Hill View Heights, WY Map & Demographics
Hill View Heights Map
Hill View Heights Overview
$28,451
PER CAPITA INCOME
53.9%
WAGE / INCOME GAP [ % ]
46.1¢/ $1
WAGE / INCOME GAP [ $ ]
0.30
INEQUALITY / GINI INDEX
217
TOTAL POPULATION
66
MALE POPULATION
151
FEMALE POPULATION
43.71
MALES / 100 FEMALES
228.79
FEMALES / 100 MALES
30.7
MEDIAN AGE
3.4
AVG FAMILY SIZE
3.3
AVG HOUSEHOLD SIZE
94
LABOR FORCE [ PEOPLE ]
72.3%
PERCENT IN LABOR FORCE
14.9%
UNEMPLOYMENT RATE
Income in Hill View Heights
Income Overview in Hill View Heights
| Characteristic | Number | Measure |
| Per Capita Income | 217 | $28,451 |
| Median Family Income | 57 | $0 |
| Mean Family Income | 57 | $94,774 |
| Median Household Income | 66 | $0 |
| Mean Household Income | 66 | $98,606 |
| Income Deficit | 57 | $0 |
| Wage / Income Gap (%) | 217 | 53.94% |
| Wage / Income Gap ($) | 217 | 46.06¢ per $1 |
| Gini / Inequality Index | 217 | 0.30 |
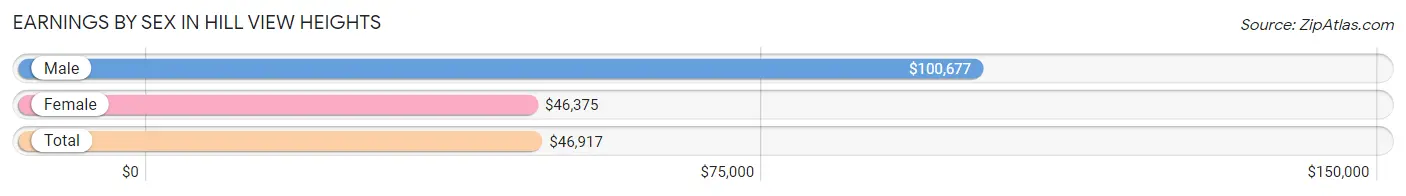
Earnings by Sex in Hill View Heights
Average Earnings in Hill View Heights are $46,917, $100,677 for men and $46,375 for women, a difference of 53.9%.
| Sex | Number | Average Earnings |
| Male | 39 (48.7%) | $100,677 |
| Female | 41 (51.2%) | $46,375 |
| Total | 80 (100.0%) | $46,917 |
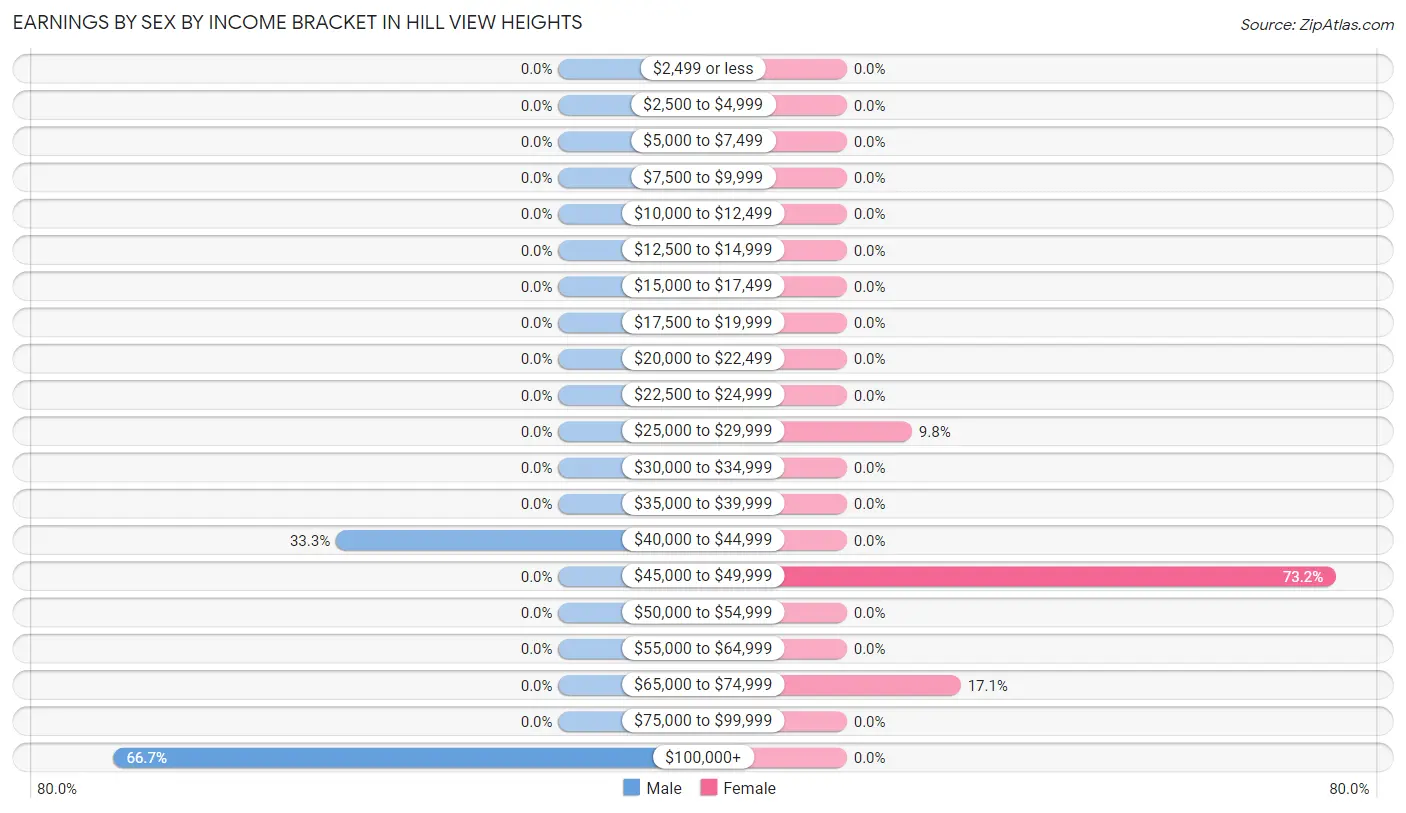
Earnings by Sex by Income Bracket in Hill View Heights
The most common earnings brackets in Hill View Heights are $100,000+ for men (26 | 66.7%) and $45,000 to $49,999 for women (30 | 73.2%).
| Income | Male | Female |
| $2,499 or less | 0 (0.0%) | 0 (0.0%) |
| $2,500 to $4,999 | 0 (0.0%) | 0 (0.0%) |
| $5,000 to $7,499 | 0 (0.0%) | 0 (0.0%) |
| $7,500 to $9,999 | 0 (0.0%) | 0 (0.0%) |
| $10,000 to $12,499 | 0 (0.0%) | 0 (0.0%) |
| $12,500 to $14,999 | 0 (0.0%) | 0 (0.0%) |
| $15,000 to $17,499 | 0 (0.0%) | 0 (0.0%) |
| $17,500 to $19,999 | 0 (0.0%) | 0 (0.0%) |
| $20,000 to $22,499 | 0 (0.0%) | 0 (0.0%) |
| $22,500 to $24,999 | 0 (0.0%) | 0 (0.0%) |
| $25,000 to $29,999 | 0 (0.0%) | 4 (9.8%) |
| $30,000 to $34,999 | 0 (0.0%) | 0 (0.0%) |
| $35,000 to $39,999 | 0 (0.0%) | 0 (0.0%) |
| $40,000 to $44,999 | 13 (33.3%) | 0 (0.0%) |
| $45,000 to $49,999 | 0 (0.0%) | 30 (73.2%) |
| $50,000 to $54,999 | 0 (0.0%) | 0 (0.0%) |
| $55,000 to $64,999 | 0 (0.0%) | 0 (0.0%) |
| $65,000 to $74,999 | 0 (0.0%) | 7 (17.1%) |
| $75,000 to $99,999 | 0 (0.0%) | 0 (0.0%) |
| $100,000+ | 26 (66.7%) | 0 (0.0%) |
| Total | 39 (100.0%) | 41 (100.0%) |
Earnings by Sex by Educational Attainment in Hill View Heights
| Educational Attainment | Male Income | Female Income |
| Less than High School | - | - |
| High School Diploma | - | - |
| College or Associate's Degree | - | - |
| Bachelor's Degree | - | - |
| Graduate Degree | - | - |
| Total | $100,677 | $46,375 |
Family Income in Hill View Heights
Family Income Brackets in Hill View Heights
According to the Hill View Heights family income data, there are 30 families falling into the $150,000 to $199,999 income range, which is the most common income bracket and makes up 52.6% of all families.
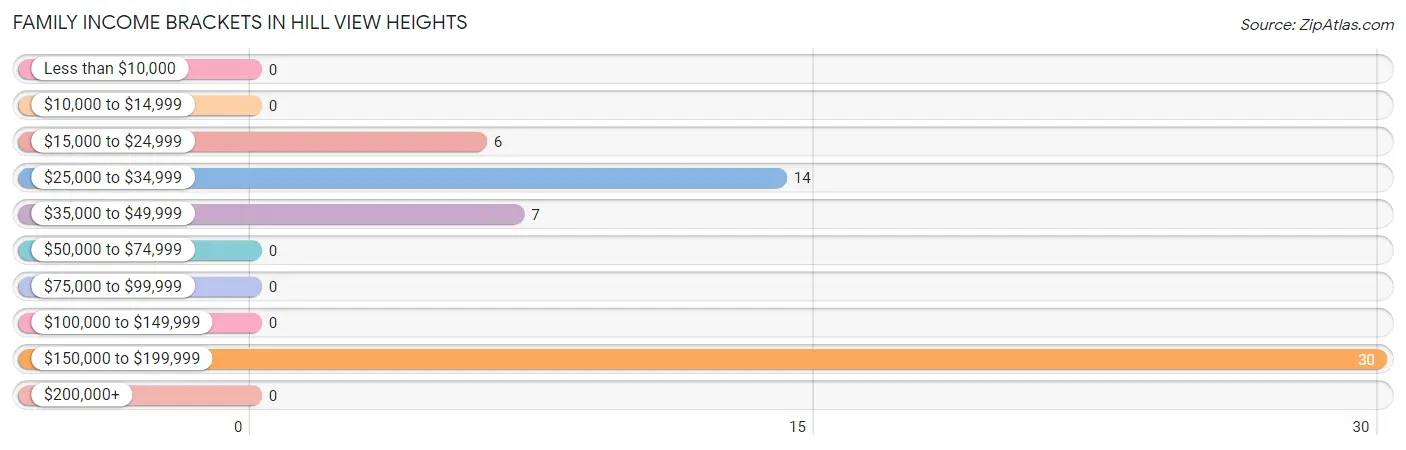
| Income Bracket | # Families | % Families |
| Less than $10,000 | 0 | 0.0% |
| $10,000 to $14,999 | 0 | 0.0% |
| $15,000 to $24,999 | 6 | 10.5% |
| $25,000 to $34,999 | 14 | 24.6% |
| $35,000 to $49,999 | 7 | 12.3% |
| $50,000 to $74,999 | 0 | 0.0% |
| $75,000 to $99,999 | 0 | 0.0% |
| $100,000 to $149,999 | 0 | 0.0% |
| $150,000 to $199,999 | 30 | 52.6% |
| $200,000+ | 0 | 0.0% |
Family Income by Famaliy Size in Hill View Heights
2-person families (27 | 47.4%) account for the highest median family income in Hill View Heights with $33,839 per family, while 2-person families (27 | 47.4%) have the highest median income of $16,920 per family member.
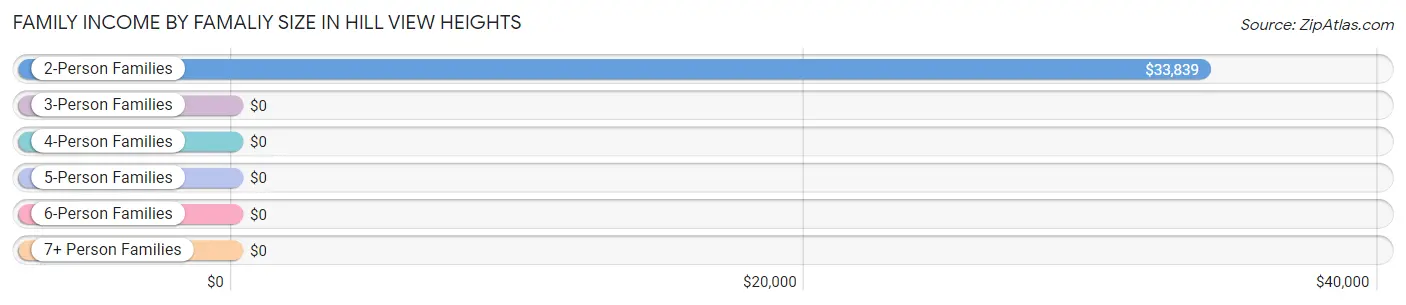
| Income Bracket | # Families | Median Income |
| 2-Person Families | 27 (47.4%) | $33,839 |
| 3-Person Families | 0 (0.0%) | $0 |
| 4-Person Families | 0 (0.0%) | $0 |
| 5-Person Families | 30 (52.6%) | $0 |
| 6-Person Families | 0 (0.0%) | $0 |
| 7+ Person Families | 0 (0.0%) | $0 |
| Total | 57 (100.0%) | $0 |
Family Income by Number of Earners in Hill View Heights
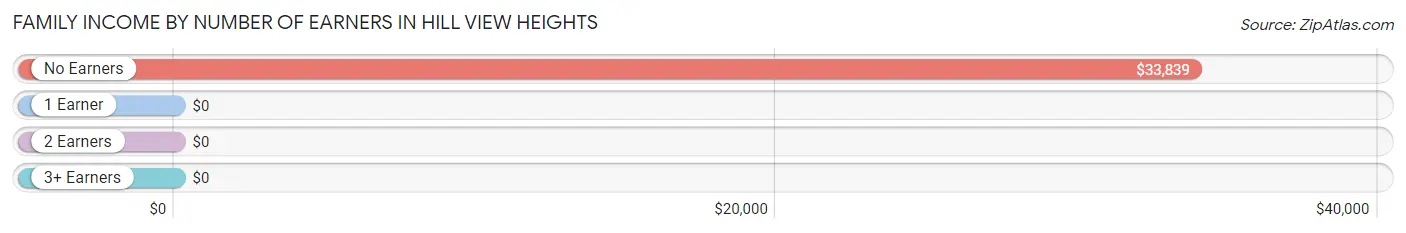
| Number of Earners | # Families | Median Income |
| No Earners | 27 (47.4%) | $33,839 |
| 1 Earner | 0 (0.0%) | $0 |
| 2 Earners | 30 (52.6%) | $0 |
| 3+ Earners | 0 (0.0%) | $0 |
| Total | 57 (100.0%) | $0 |
Household Income in Hill View Heights
Household Income Brackets in Hill View Heights
With 30 households falling in the category, the $150,000 to $199,999 income range is the most frequent in Hill View Heights, accounting for 45.5% of all households.
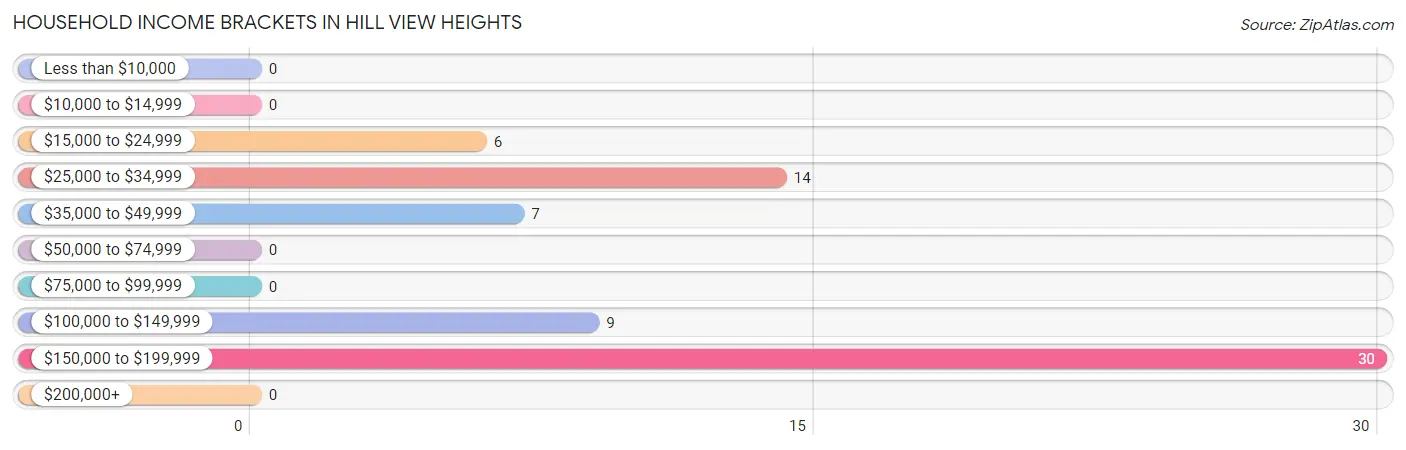
| Income Bracket | # Households | % Households |
| Less than $10,000 | 0 | 0.0% |
| $10,000 to $14,999 | 0 | 0.0% |
| $15,000 to $24,999 | 6 | 9.1% |
| $25,000 to $34,999 | 14 | 21.2% |
| $35,000 to $49,999 | 7 | 10.6% |
| $50,000 to $74,999 | 0 | 0.0% |
| $75,000 to $99,999 | 0 | 0.0% |
| $100,000 to $149,999 | 9 | 13.6% |
| $150,000 to $199,999 | 30 | 45.5% |
| $200,000+ | 0 | 0.0% |
Household Income by Householder Age in Hill View Heights
The median household income in Hill View Heights is $0, with the highest median household income of $33,839 found in the 65+ years age bracket for the primary householder. A total of 27 households (40.9%) fall into this category.
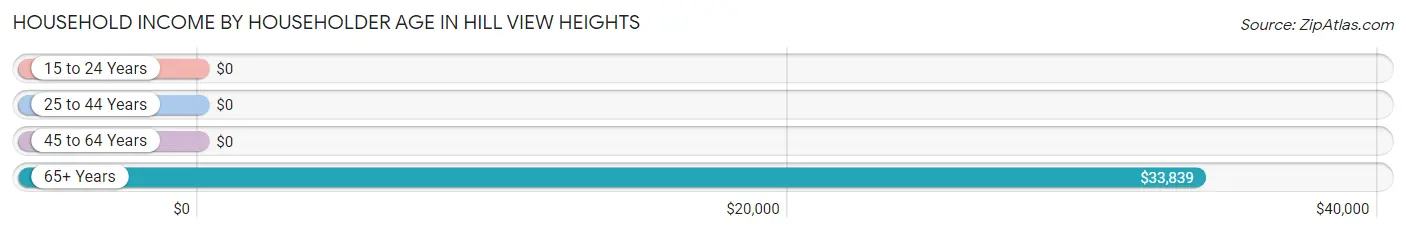
| Income Bracket | # Households | Median Income |
| 15 to 24 Years | 0 (0.0%) | $0 |
| 25 to 44 Years | 30 (45.5%) | $0 |
| 45 to 64 Years | 9 (13.6%) | $0 |
| 65+ Years | 27 (40.9%) | $33,839 |
| Total | 66 (100.0%) | $0 |
Poverty in Hill View Heights
Income Below Poverty by Sex and Age in Hill View Heights
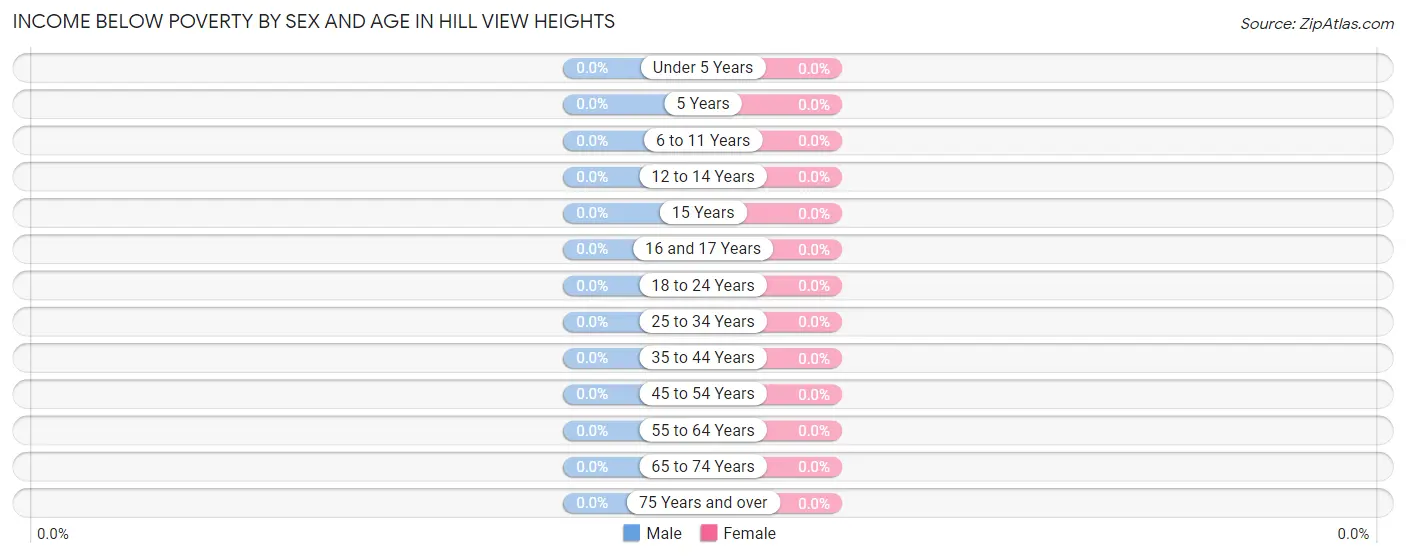
| Age Bracket | Male | Female |
| Under 5 Years | 0 (0.0%) | 0 (0.0%) |
| 5 Years | 0 (0.0%) | 0 (0.0%) |
| 6 to 11 Years | 0 (0.0%) | 0 (0.0%) |
| 12 to 14 Years | 0 (0.0%) | 0 (0.0%) |
| 15 Years | 0 (0.0%) | 0 (0.0%) |
| 16 and 17 Years | 0 (0.0%) | 0 (0.0%) |
| 18 to 24 Years | 0 (0.0%) | 0 (0.0%) |
| 25 to 34 Years | 0 (0.0%) | 0 (0.0%) |
| 35 to 44 Years | 0 (0.0%) | 0 (0.0%) |
| 45 to 54 Years | 0 (0.0%) | 0 (0.0%) |
| 55 to 64 Years | 0 (0.0%) | 0 (0.0%) |
| 65 to 74 Years | 0 (0.0%) | 0 (0.0%) |
| 75 Years and over | 0 (0.0%) | 0 (0.0%) |
| Total | 0 (0.0%) | 0 (0.0%) |
Income Above Poverty by Sex and Age in Hill View Heights
According to the poverty statistics in Hill View Heights, males aged 35 to 44 years and females aged under 5 years are the age groups that are most secure financially, with 100.0% of males and 100.0% of females in these age groups living above the poverty line.
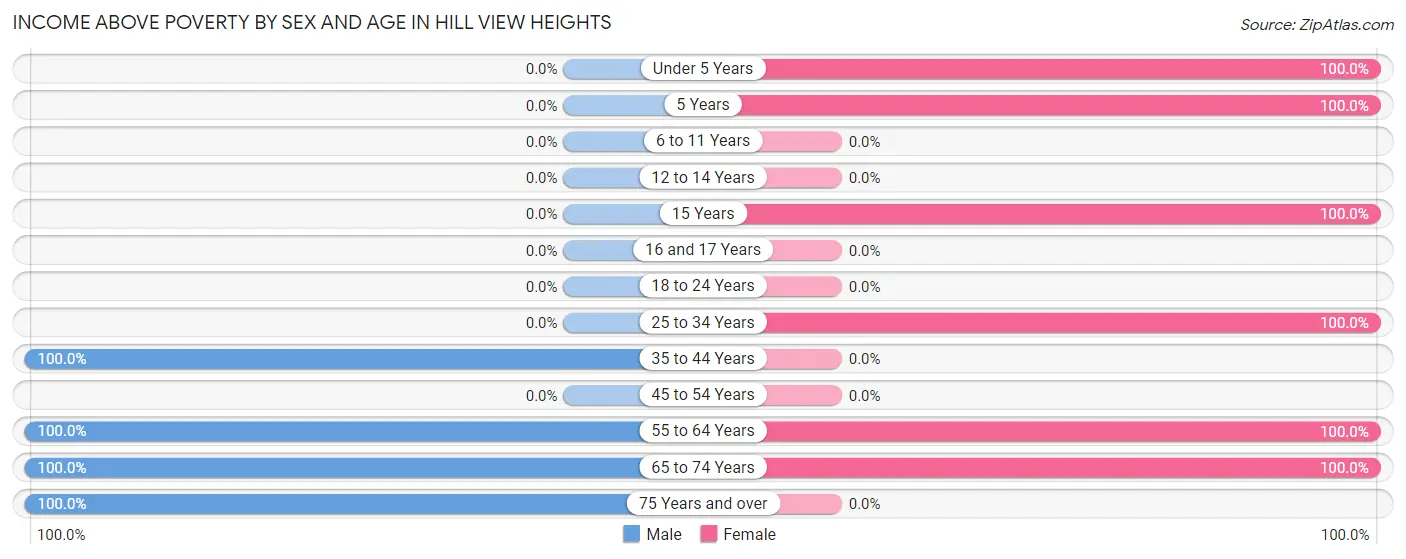
| Age Bracket | Male | Female |
| Under 5 Years | 0 (0.0%) | 25 (100.0%) |
| 5 Years | 0 (0.0%) | 29 (100.0%) |
| 6 to 11 Years | 0 (0.0%) | 0 (0.0%) |
| 12 to 14 Years | 0 (0.0%) | 0 (0.0%) |
| 15 Years | 0 (0.0%) | 33 (100.0%) |
| 16 and 17 Years | 0 (0.0%) | 0 (0.0%) |
| 18 to 24 Years | 0 (0.0%) | 0 (0.0%) |
| 25 to 34 Years | 0 (0.0%) | 30 (100.0%) |
| 35 to 44 Years | 24 (100.0%) | 0 (0.0%) |
| 45 to 54 Years | 0 (0.0%) | 0 (0.0%) |
| 55 to 64 Years | 15 (100.0%) | 11 (100.0%) |
| 65 to 74 Years | 14 (100.0%) | 23 (100.0%) |
| 75 Years and over | 13 (100.0%) | 0 (0.0%) |
| Total | 66 (100.0%) | 151 (100.0%) |
Income Below Poverty Among Married-Couple Families in Hill View Heights
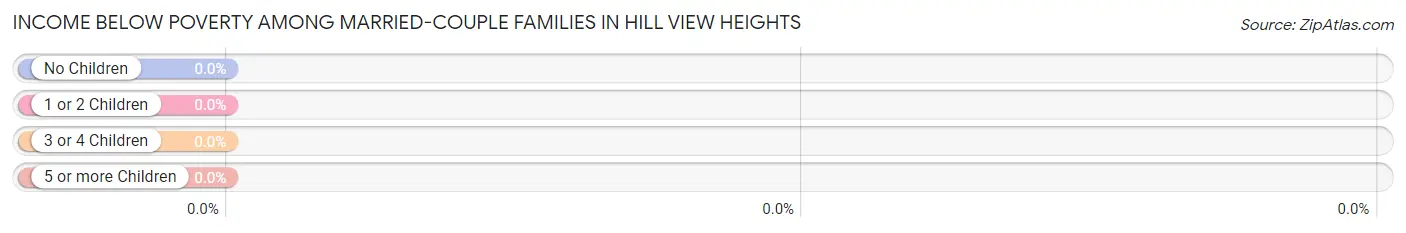
| Children | Above Poverty | Below Poverty |
| No Children | 27 (100.0%) | 0 (0.0%) |
| 1 or 2 Children | 0 (0.0%) | 0 (0.0%) |
| 3 or 4 Children | 30 (100.0%) | 0 (0.0%) |
| 5 or more Children | 0 (0.0%) | 0 (0.0%) |
| Total | 57 (100.0%) | 0 (0.0%) |
Income Below Poverty Among Single-Parent Households in Hill View Heights
| Children | Single Father | Single Mother |
| No Children | 0 (0.0%) | 0 (0.0%) |
| 1 or 2 Children | 0 (0.0%) | 0 (0.0%) |
| 3 or 4 Children | 0 (0.0%) | 0 (0.0%) |
| 5 or more Children | 0 (0.0%) | 0 (0.0%) |
| Total | 0 (0.0%) | 0 (0.0%) |
Income Below Poverty Among Married-Couple vs Single-Parent Households in Hill View Heights
| Children | Married-Couple Families | Single-Parent Households |
| No Children | 0 (0.0%) | 0 (0.0%) |
| 1 or 2 Children | 0 (0.0%) | 0 (0.0%) |
| 3 or 4 Children | 0 (0.0%) | 0 (0.0%) |
| 5 or more Children | 0 (0.0%) | 0 (0.0%) |
| Total | 0 (0.0%) | 0 (0.0%) |
Race in Hill View Heights
The most populous races in Hill View Heights are White / Caucasian (204 | 94.0%), and Two or more Races (13 | 6.0%).
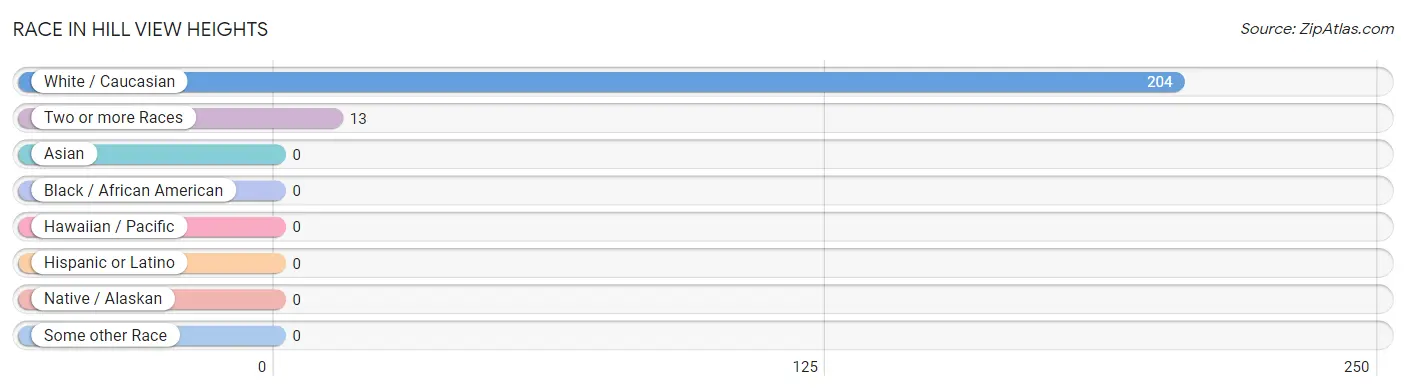
| Race | # Population | % Population |
| Asian | 0 | 0.0% |
| Black / African American | 0 | 0.0% |
| Hawaiian / Pacific | 0 | 0.0% |
| Hispanic or Latino | 0 | 0.0% |
| Native / Alaskan | 0 | 0.0% |
| White / Caucasian | 204 | 94.0% |
| Two or more Races | 13 | 6.0% |
| Some other Race | 0 | 0.0% |
| Total | 217 | 100.0% |
Ancestry in Hill View Heights
The most populous ancestries reported in Hill View Heights are English (57 | 26.3%), Sioux (13 | 6.0%), German (7 | 3.2%), Swedish (7 | 3.2%), and American (6 | 2.8%), together accounting for 41.5% of all Hill View Heights residents.
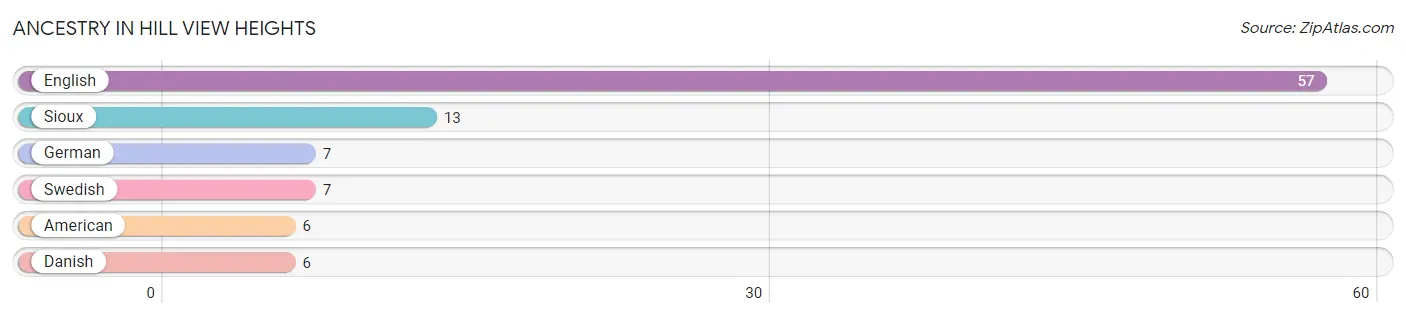
| Ancestry | # Population | % Population |
| American | 6 | 2.8% |
| Danish | 6 | 2.8% |
| English | 57 | 26.3% |
| German | 7 | 3.2% |
| Sioux | 13 | 6.0% |
| Swedish | 7 | 3.2% | View All 6 Rows |
Immigrants in Hill View Heights

| Immigration Origin | # Population | % Population | View All 0 Rows |
Sex and Age in Hill View Heights
Sex and Age in Hill View Heights
The most populous age groups in Hill View Heights are 35 to 39 Years (24 | 36.4%) for men and 15 to 19 Years (33 | 21.8%) for women.
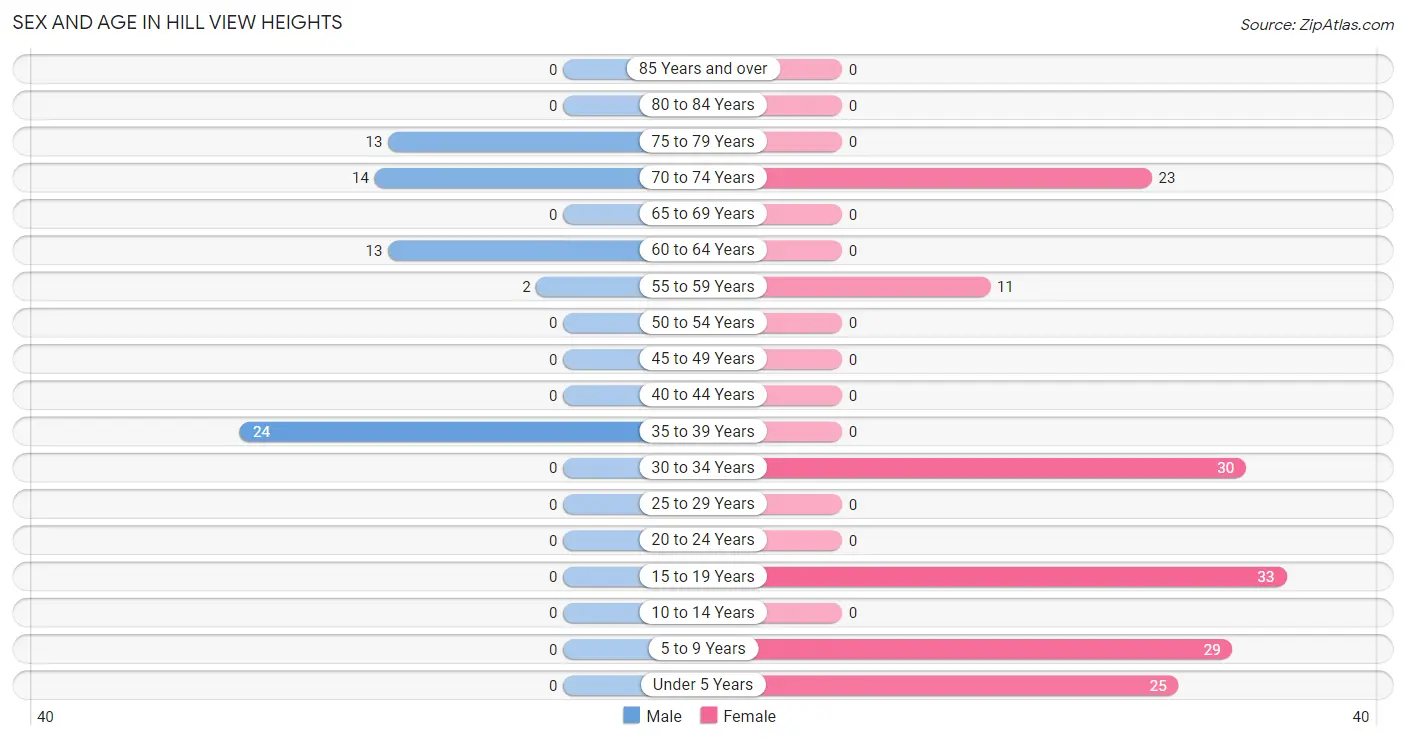
| Age Bracket | Male | Female |
| Under 5 Years | 0 (0.0%) | 25 (16.6%) |
| 5 to 9 Years | 0 (0.0%) | 29 (19.2%) |
| 10 to 14 Years | 0 (0.0%) | 0 (0.0%) |
| 15 to 19 Years | 0 (0.0%) | 33 (21.8%) |
| 20 to 24 Years | 0 (0.0%) | 0 (0.0%) |
| 25 to 29 Years | 0 (0.0%) | 0 (0.0%) |
| 30 to 34 Years | 0 (0.0%) | 30 (19.9%) |
| 35 to 39 Years | 24 (36.4%) | 0 (0.0%) |
| 40 to 44 Years | 0 (0.0%) | 0 (0.0%) |
| 45 to 49 Years | 0 (0.0%) | 0 (0.0%) |
| 50 to 54 Years | 0 (0.0%) | 0 (0.0%) |
| 55 to 59 Years | 2 (3.0%) | 11 (7.3%) |
| 60 to 64 Years | 13 (19.7%) | 0 (0.0%) |
| 65 to 69 Years | 0 (0.0%) | 0 (0.0%) |
| 70 to 74 Years | 14 (21.2%) | 23 (15.2%) |
| 75 to 79 Years | 13 (19.7%) | 0 (0.0%) |
| 80 to 84 Years | 0 (0.0%) | 0 (0.0%) |
| 85 Years and over | 0 (0.0%) | 0 (0.0%) |
| Total | 66 (100.0%) | 151 (100.0%) |
Families and Households in Hill View Heights
Median Family Size in Hill View Heights
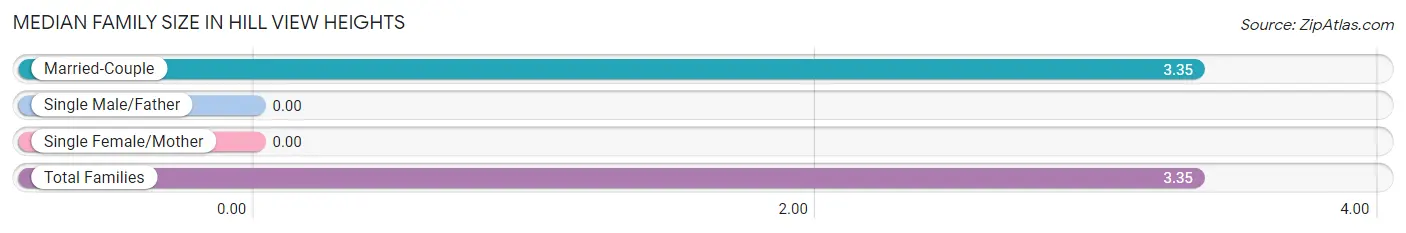
| Family Type | # Families | Family Size |
| Married-Couple | 57 (100.0%) | 3.35 |
| Single Male/Father | 0 (0.0%) | - |
| Single Female/Mother | 0 (0.0%) | - |
| Total Families | 57 (100.0%) | 3.35 |
Median Household Size in Hill View Heights
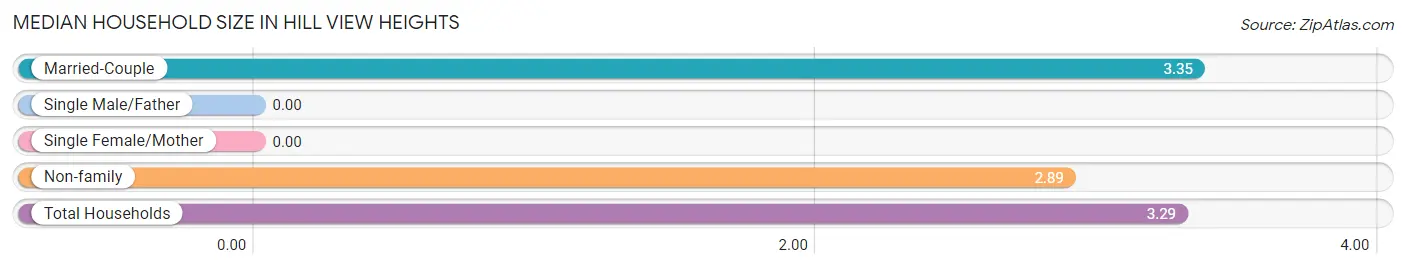
| Household Type | # Households | Household Size |
| Married-Couple | 57 (86.4%) | 3.35 |
| Single Male/Father | 0 (0.0%) | - |
| Single Female/Mother | 0 (0.0%) | - |
| Non-family | 9 (13.6%) | 2.89 |
| Total Households | 66 (100.0%) | 3.29 |
Household Size by Marriage Status in Hill View Heights
Out of a total of 66 households in Hill View Heights, 57 (86.4%) are family households, while 9 (13.6%) are nonfamily households. The most numerous type of family households are 5-person households, comprising 30, and the most common type of nonfamily households are 2-person households, comprising 9.
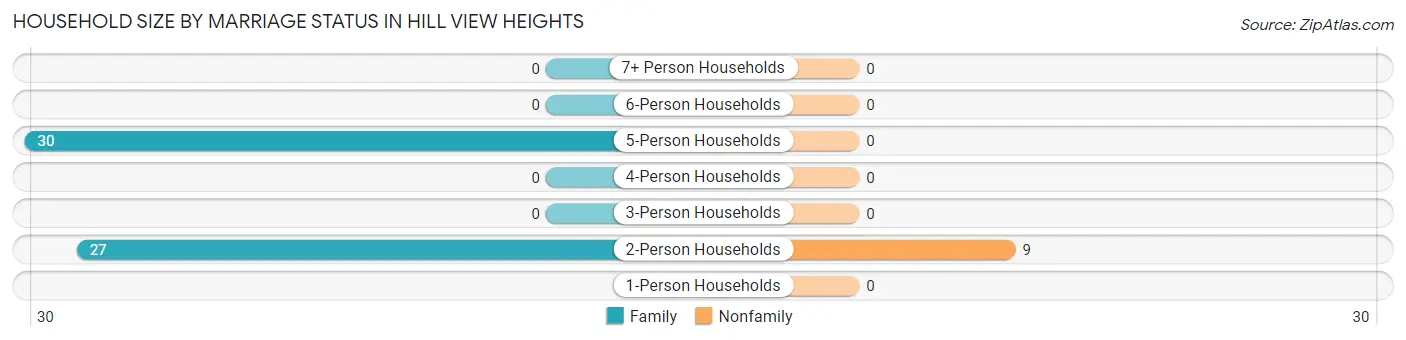
| Household Size | Family Households | Nonfamily Households |
| 1-Person Households | - | 0 (0.0%) |
| 2-Person Households | 27 (40.9%) | 9 (13.6%) |
| 3-Person Households | 0 (0.0%) | 0 (0.0%) |
| 4-Person Households | 0 (0.0%) | 0 (0.0%) |
| 5-Person Households | 30 (45.5%) | 0 (0.0%) |
| 6-Person Households | 0 (0.0%) | 0 (0.0%) |
| 7+ Person Households | 0 (0.0%) | 0 (0.0%) |
| Total | 57 (86.4%) | 9 (13.6%) |
Female Fertility in Hill View Heights
Fertility by Age in Hill View Heights
| Age Bracket | Women with Births | Births / 1,000 Women |
| 15 to 19 years | 0 (0.0%) | 0.0 |
| 20 to 34 years | 0 (0.0%) | 0.0 |
| 35 to 50 years | 0 (0.0%) | 0.0 |
| Total | 0 (0.0%) | 0.0 |
Fertility by Age by Marriage Status in Hill View Heights
| Age Bracket | Married | Unmarried |
| 15 to 19 years | 0 (0.0%) | 0 (0.0%) |
| 20 to 34 years | 0 (0.0%) | 0 (0.0%) |
| 35 to 50 years | 0 (0.0%) | 0 (0.0%) |
| Total | 0 (0.0%) | 0 (0.0%) |
Fertility by Education in Hill View Heights
| Educational Attainment | Women with Births | Births / 1,000 Women |
| Less than High School | 0 (0.0%) | 0.0 |
| High School Diploma | 0 (0.0%) | 0.0 |
| College or Associate's Degree | 0 (0.0%) | 0.0 |
| Bachelor's Degree | 0 (0.0%) | 0.0 |
| Graduate Degree | 0 (0.0%) | 0.0 |
| Total | 0 (0.0%) | 0.0 |
Fertility by Education by Marriage Status in Hill View Heights
| Educational Attainment | Married | Unmarried |
| Less than High School | 0 (0.0%) | 0 (0.0%) |
| High School Diploma | 0 (0.0%) | 0 (0.0%) |
| College or Associate's Degree | 0 (0.0%) | 0 (0.0%) |
| Bachelor's Degree | 0 (0.0%) | 0 (0.0%) |
| Graduate Degree | 0 (0.0%) | 0 (0.0%) |
| Total | 0 (0.0%) | 0 (0.0%) |
Employment Characteristics in Hill View Heights
Employment by Class of Employer in Hill View Heights
Among the 76 employed individuals in Hill View Heights, local government employees (30 | 39.5%), self-employed (not incorporated) (24 | 31.6%), and private company employees (15 | 19.7%) make up the most common classes of employment.
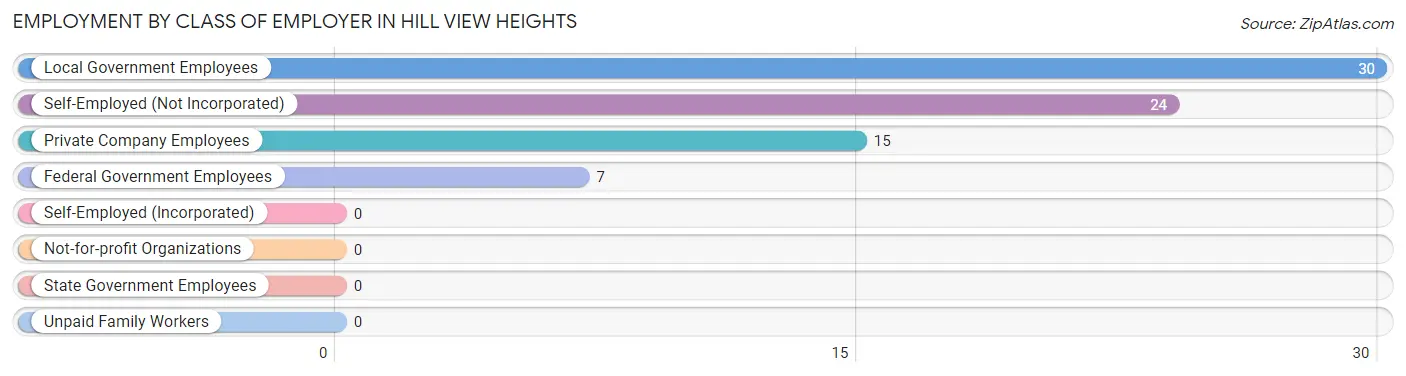
| Employer Class | # Employees | % Employees |
| Private Company Employees | 15 | 19.7% |
| Self-Employed (Incorporated) | 0 | 0.0% |
| Self-Employed (Not Incorporated) | 24 | 31.6% |
| Not-for-profit Organizations | 0 | 0.0% |
| Local Government Employees | 30 | 39.5% |
| State Government Employees | 0 | 0.0% |
| Federal Government Employees | 7 | 9.2% |
| Unpaid Family Workers | 0 | 0.0% |
| Total | 76 | 100.0% |
Employment Status by Age in Hill View Heights
According to the labor force statistics for Hill View Heights, out of the total population over 16 years of age (130), 72.3% or 94 individuals are in the labor force, with 14.9% or 14 of them unemployed. The age group with the highest labor force participation rate is 30 to 34 years, with 100.0% or 30 individuals in the labor force. Within the labor force, the 65 to 74 years age range has the highest percentage of unemployed individuals, with 100.0% or 14 of them being unemployed.
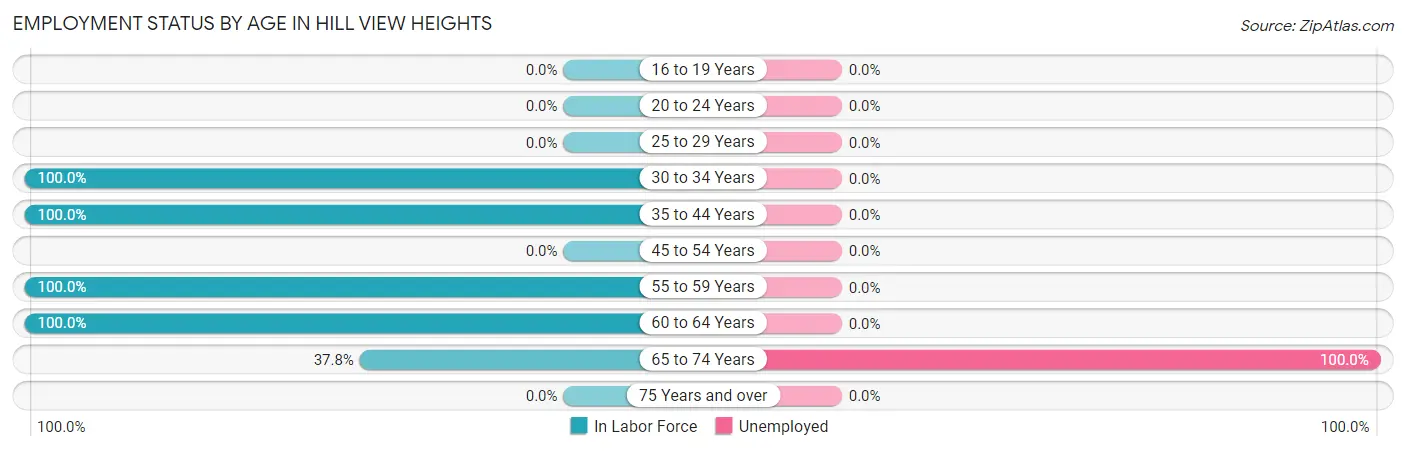
| Age Bracket | In Labor Force | Unemployed |
| 16 to 19 Years | 0 (0.0%) | 0 (0.0%) |
| 20 to 24 Years | 0 (0.0%) | 0 (0.0%) |
| 25 to 29 Years | 0 (0.0%) | 0 (0.0%) |
| 30 to 34 Years | 30 (100.0%) | 0 (0.0%) |
| 35 to 44 Years | 24 (100.0%) | 0 (0.0%) |
| 45 to 54 Years | 0 (0.0%) | 0 (0.0%) |
| 55 to 59 Years | 13 (100.0%) | 0 (0.0%) |
| 60 to 64 Years | 13 (100.0%) | 0 (0.0%) |
| 65 to 74 Years | 14 (37.8%) | 14 (100.0%) |
| 75 Years and over | 0 (0.0%) | 0 (0.0%) |
| Total | 94 (72.3%) | 14 (14.9%) |
Employment Status by Educational Attainment in Hill View Heights

| Educational Attainment | In Labor Force | Unemployed |
| Less than High School | 0 (0.0%) | 0 (0.0%) |
| High School Diploma | 19 (100.0%) | 0 (0.0%) |
| College / Associate Degree | 24 (100.0%) | 0 (0.0%) |
| Bachelor's Degree or higher | 37 (100.0%) | 0 (0.0%) |
| Total | 80 (100.0%) | 0 (0.0%) |
Employment Occupations by Sex in Hill View Heights
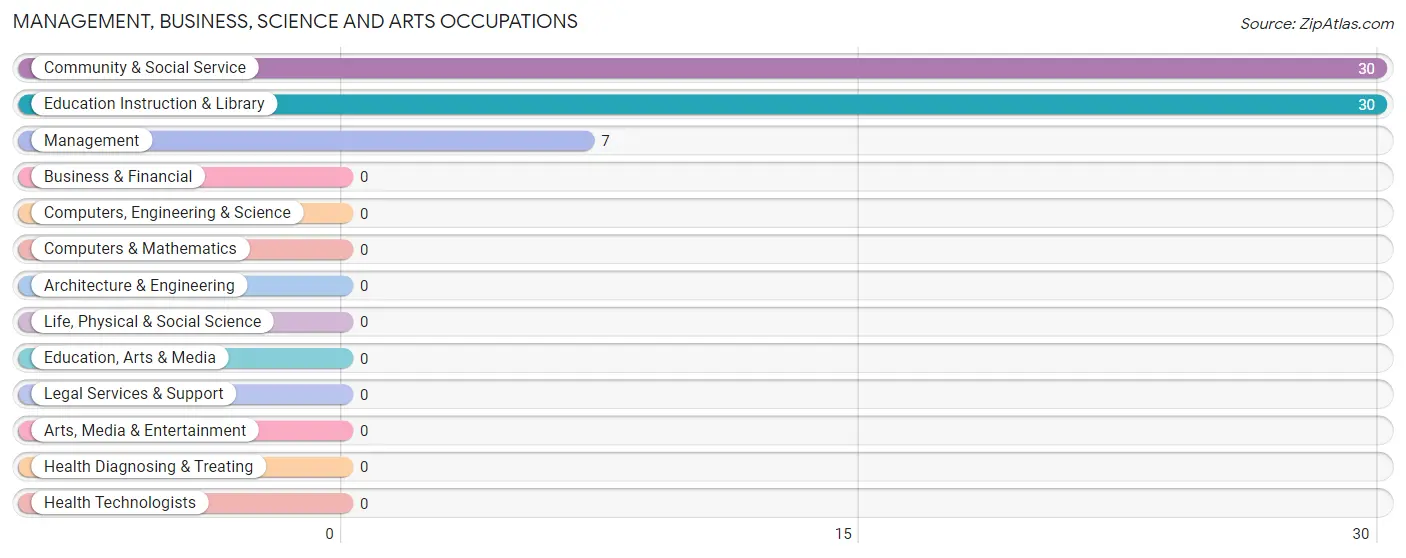
Management, Business, Science and Arts Occupations
The most common Management, Business, Science and Arts occupations in Hill View Heights are Community & Social Service (30 | 37.5%), Education Instruction & Library (30 | 37.5%), and Management (7 | 8.7%).
Management, Business, Science and Arts Occupations by Sex
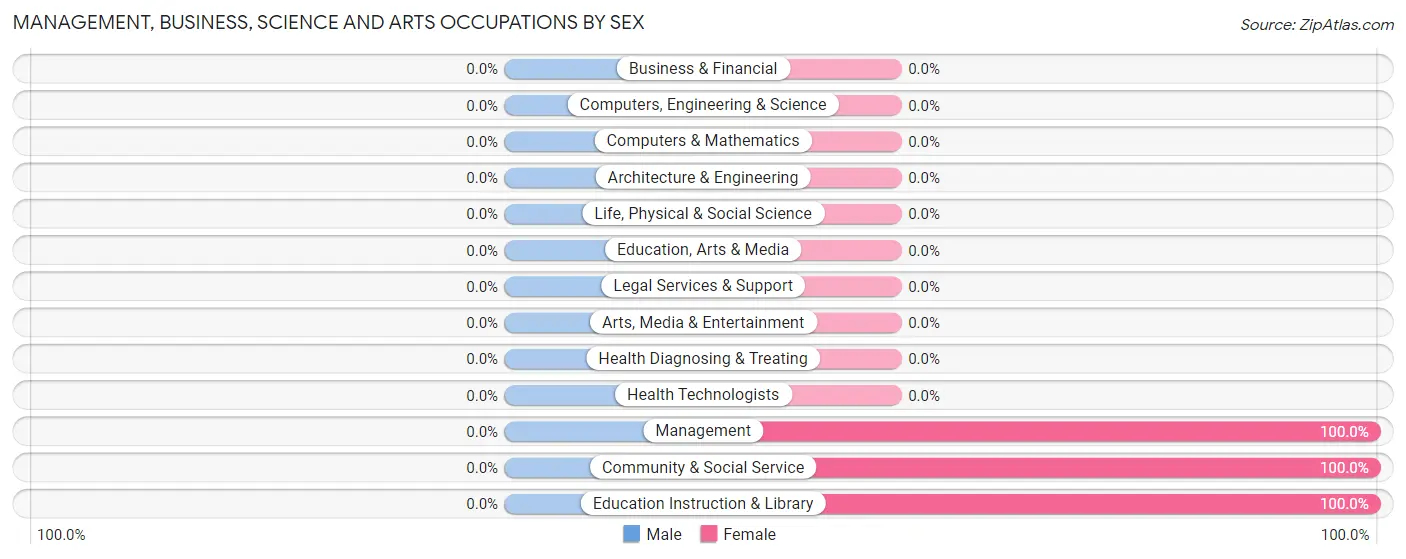
| Occupation | Male | Female |
| Management | 0 (0.0%) | 7 (100.0%) |
| Business & Financial | 0 (0.0%) | 0 (0.0%) |
| Computers, Engineering & Science | 0 (0.0%) | 0 (0.0%) |
| Computers & Mathematics | 0 (0.0%) | 0 (0.0%) |
| Architecture & Engineering | 0 (0.0%) | 0 (0.0%) |
| Life, Physical & Social Science | 0 (0.0%) | 0 (0.0%) |
| Community & Social Service | 0 (0.0%) | 30 (100.0%) |
| Education, Arts & Media | 0 (0.0%) | 0 (0.0%) |
| Legal Services & Support | 0 (0.0%) | 0 (0.0%) |
| Education Instruction & Library | 0 (0.0%) | 30 (100.0%) |
| Arts, Media & Entertainment | 0 (0.0%) | 0 (0.0%) |
| Health Diagnosing & Treating | 0 (0.0%) | 0 (0.0%) |
| Health Technologists | 0 (0.0%) | 0 (0.0%) |
| Total (Category) | 0 (0.0%) | 37 (100.0%) |
| Total (Overall) | 39 (48.7%) | 41 (51.2%) |
Services Occupations
Services Occupations by Sex
| Occupation | Male | Female |
| Healthcare Support | 0 (0.0%) | 0 (0.0%) |
| Security & Protection | 0 (0.0%) | 0 (0.0%) |
| Firefighting & Prevention | 0 (0.0%) | 0 (0.0%) |
| Law Enforcement | 0 (0.0%) | 0 (0.0%) |
| Food Preparation & Serving | 0 (0.0%) | 0 (0.0%) |
| Cleaning & Maintenance | 0 (0.0%) | 0 (0.0%) |
| Personal Care & Service | 0 (0.0%) | 0 (0.0%) |
| Total (Category) | 0 (0.0%) | 0 (0.0%) |
| Total (Overall) | 39 (48.7%) | 41 (51.2%) |
Sales and Office Occupations
The most common Sales and Office occupations in Hill View Heights are , and Office & Administration (4 | 5.0%).
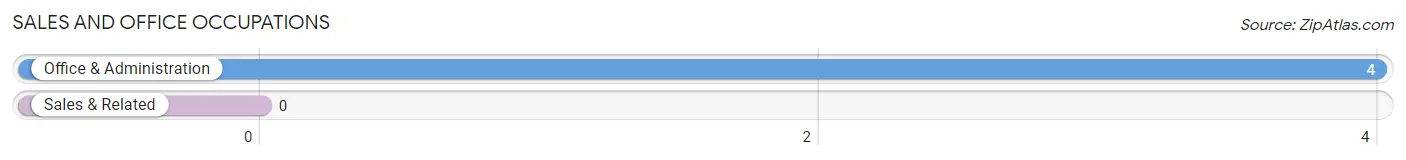
Sales and Office Occupations by Sex
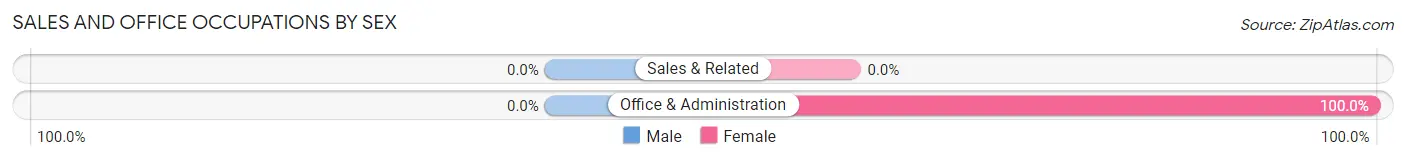
| Occupation | Male | Female |
| Sales & Related | 0 (0.0%) | 0 (0.0%) |
| Office & Administration | 0 (0.0%) | 4 (100.0%) |
| Total (Category) | 0 (0.0%) | 4 (100.0%) |
| Total (Overall) | 39 (48.7%) | 41 (51.2%) |
Natural Resources, Construction and Maintenance Occupations
The most common Natural Resources, Construction and Maintenance occupations in Hill View Heights are Installation, Maintenance & Repair (24 | 30.0%), and Construction & Extraction (15 | 18.8%).
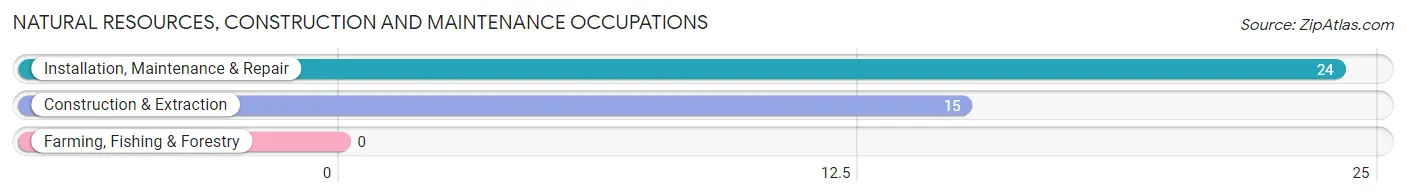
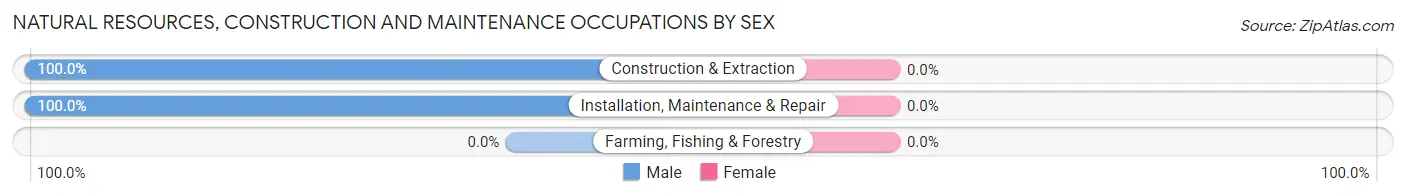
Natural Resources, Construction and Maintenance Occupations by Sex
| Occupation | Male | Female |
| Farming, Fishing & Forestry | 0 (0.0%) | 0 (0.0%) |
| Construction & Extraction | 15 (100.0%) | 0 (0.0%) |
| Installation, Maintenance & Repair | 24 (100.0%) | 0 (0.0%) |
| Total (Category) | 39 (100.0%) | 0 (0.0%) |
| Total (Overall) | 39 (48.7%) | 41 (51.2%) |
Production, Transportation and Moving Occupations
Production, Transportation and Moving Occupations by Sex
| Occupation | Male | Female |
| Production | 0 (0.0%) | 0 (0.0%) |
| Transportation | 0 (0.0%) | 0 (0.0%) |
| Material Moving | 0 (0.0%) | 0 (0.0%) |
| Total (Category) | 0 (0.0%) | 0 (0.0%) |
| Total (Overall) | 39 (48.7%) | 41 (51.2%) |
Employment Industries by Sex in Hill View Heights
Employment Industries in Hill View Heights
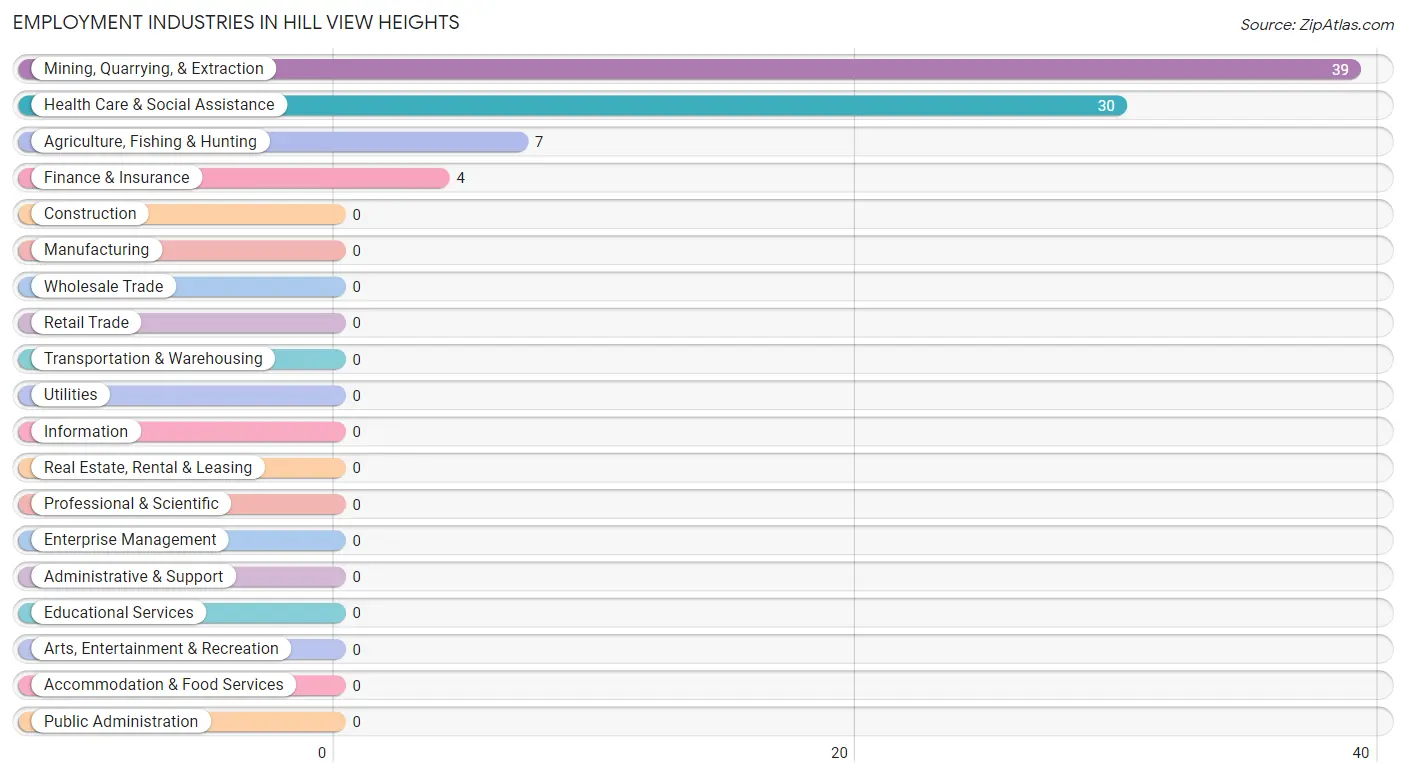
The major employment industries in Hill View Heights include Mining, Quarrying, & Extraction (39 | 48.7%), Health Care & Social Assistance (30 | 37.5%), Agriculture, Fishing & Hunting (7 | 8.7%), and Finance & Insurance (4 | 5.0%).
Employment Industries by Sex in Hill View Heights
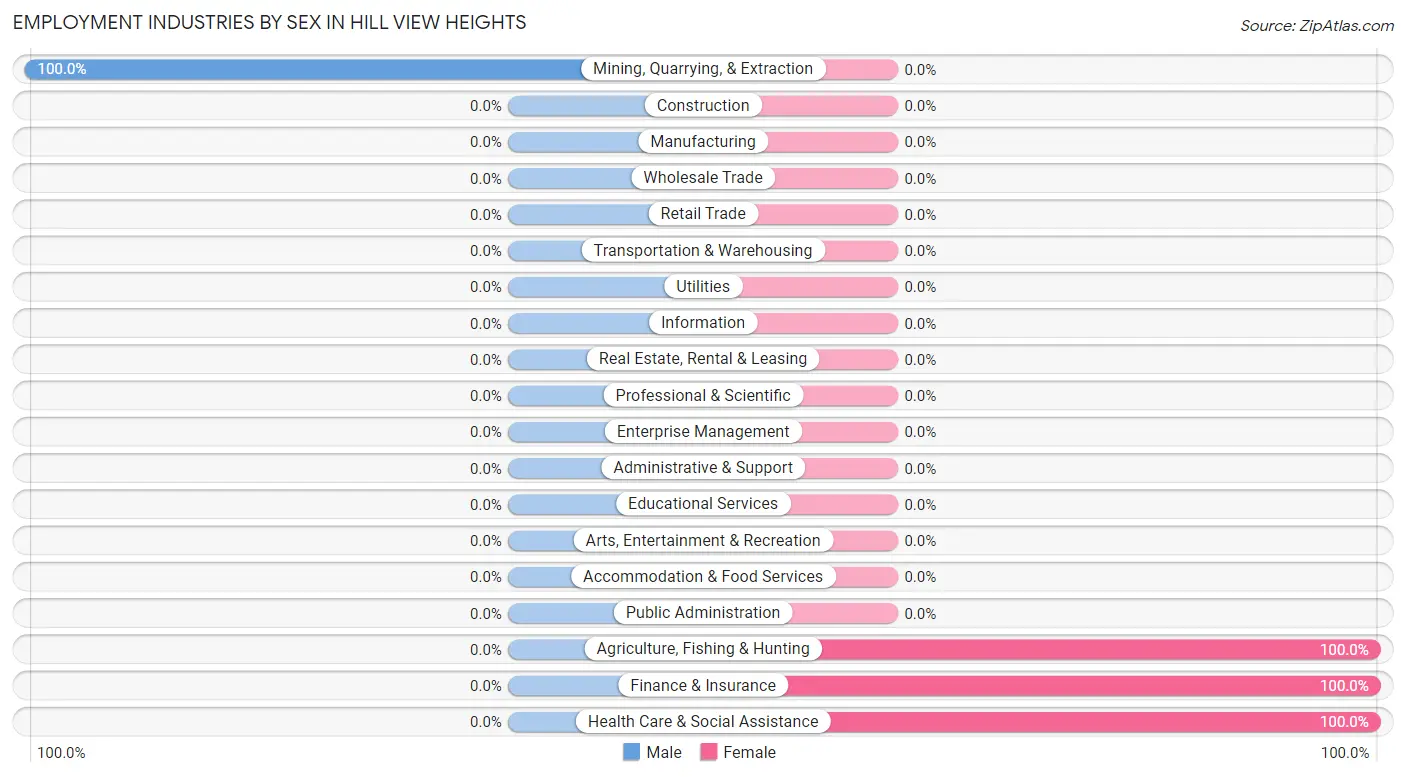
| Industry | Male | Female |
| Agriculture, Fishing & Hunting | 0 (0.0%) | 7 (100.0%) |
| Mining, Quarrying, & Extraction | 39 (100.0%) | 0 (0.0%) |
| Construction | 0 (0.0%) | 0 (0.0%) |
| Manufacturing | 0 (0.0%) | 0 (0.0%) |
| Wholesale Trade | 0 (0.0%) | 0 (0.0%) |
| Retail Trade | 0 (0.0%) | 0 (0.0%) |
| Transportation & Warehousing | 0 (0.0%) | 0 (0.0%) |
| Utilities | 0 (0.0%) | 0 (0.0%) |
| Information | 0 (0.0%) | 0 (0.0%) |
| Finance & Insurance | 0 (0.0%) | 4 (100.0%) |
| Real Estate, Rental & Leasing | 0 (0.0%) | 0 (0.0%) |
| Professional & Scientific | 0 (0.0%) | 0 (0.0%) |
| Enterprise Management | 0 (0.0%) | 0 (0.0%) |
| Administrative & Support | 0 (0.0%) | 0 (0.0%) |
| Educational Services | 0 (0.0%) | 0 (0.0%) |
| Health Care & Social Assistance | 0 (0.0%) | 30 (100.0%) |
| Arts, Entertainment & Recreation | 0 (0.0%) | 0 (0.0%) |
| Accommodation & Food Services | 0 (0.0%) | 0 (0.0%) |
| Public Administration | 0 (0.0%) | 0 (0.0%) |
| Total | 39 (48.7%) | 41 (51.2%) |
Education in Hill View Heights
School Enrollment in Hill View Heights
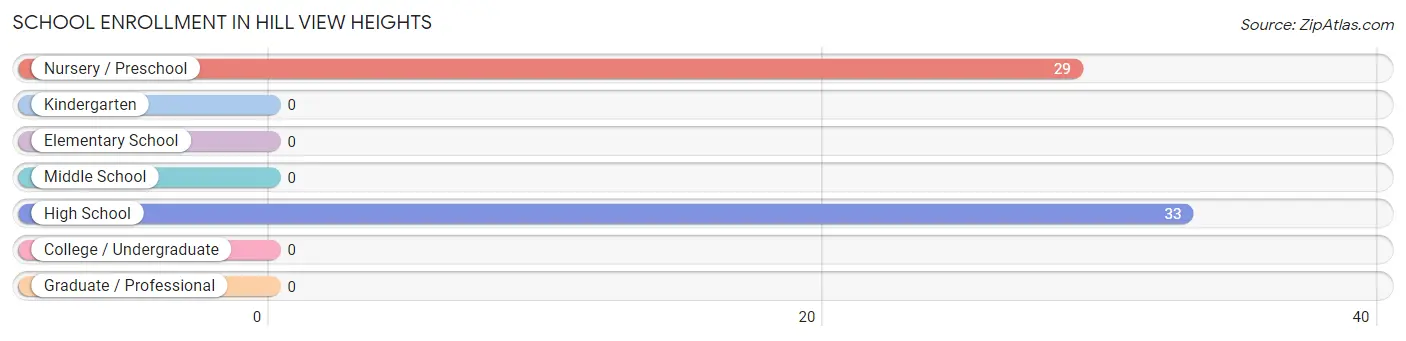
The most common levels of schooling among the 62 students in Hill View Heights are high school (33 | 53.2%), and nursery / preschool (29 | 46.8%).
| School Level | # Students | % Students |
| Nursery / Preschool | 29 | 46.8% |
| Kindergarten | 0 | 0.0% |
| Elementary School | 0 | 0.0% |
| Middle School | 0 | 0.0% |
| High School | 33 | 53.2% |
| College / Undergraduate | 0 | 0.0% |
| Graduate / Professional | 0 | 0.0% |
| Total | 62 | 100.0% |
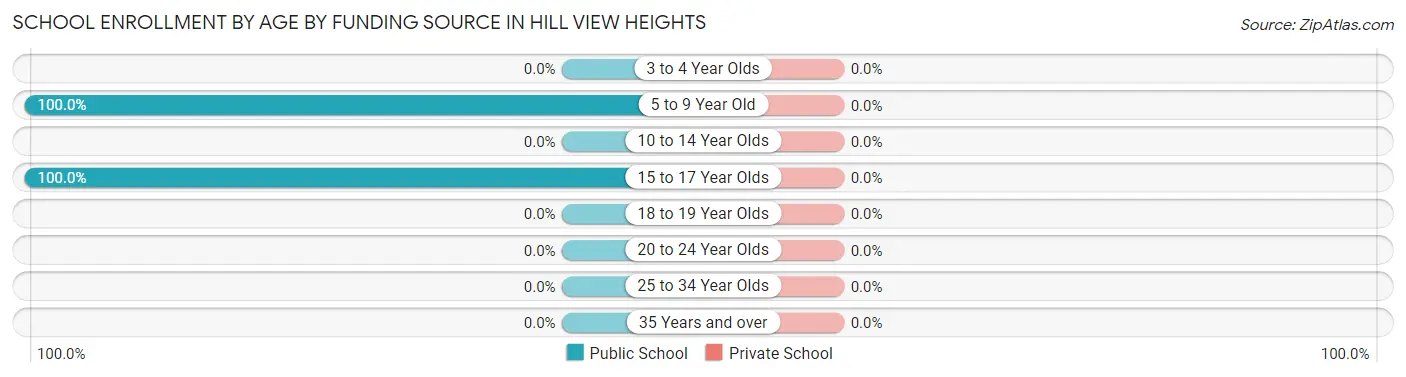
School Enrollment by Age by Funding Source in Hill View Heights
| Age Bracket | Public School | Private School |
| 3 to 4 Year Olds | 0 (0.0%) | 0 (0.0%) |
| 5 to 9 Year Old | 29 (100.0%) | 0 (0.0%) |
| 10 to 14 Year Olds | 0 (0.0%) | 0 (0.0%) |
| 15 to 17 Year Olds | 33 (100.0%) | 0 (0.0%) |
| 18 to 19 Year Olds | 0 (0.0%) | 0 (0.0%) |
| 20 to 24 Year Olds | 0 (0.0%) | 0 (0.0%) |
| 25 to 34 Year Olds | 0 (0.0%) | 0 (0.0%) |
| 35 Years and over | 0 (0.0%) | 0 (0.0%) |
| Total | 62 (100.0%) | 0 (0.0%) |
Educational Attainment by Field of Study in Hill View Heights
Education (30 | 46.2%), bio, nature & agricultural (21 | 32.3%), and business (14 | 21.5%) are the most common fields of study among 65 individuals in Hill View Heights who have obtained a bachelor's degree or higher.
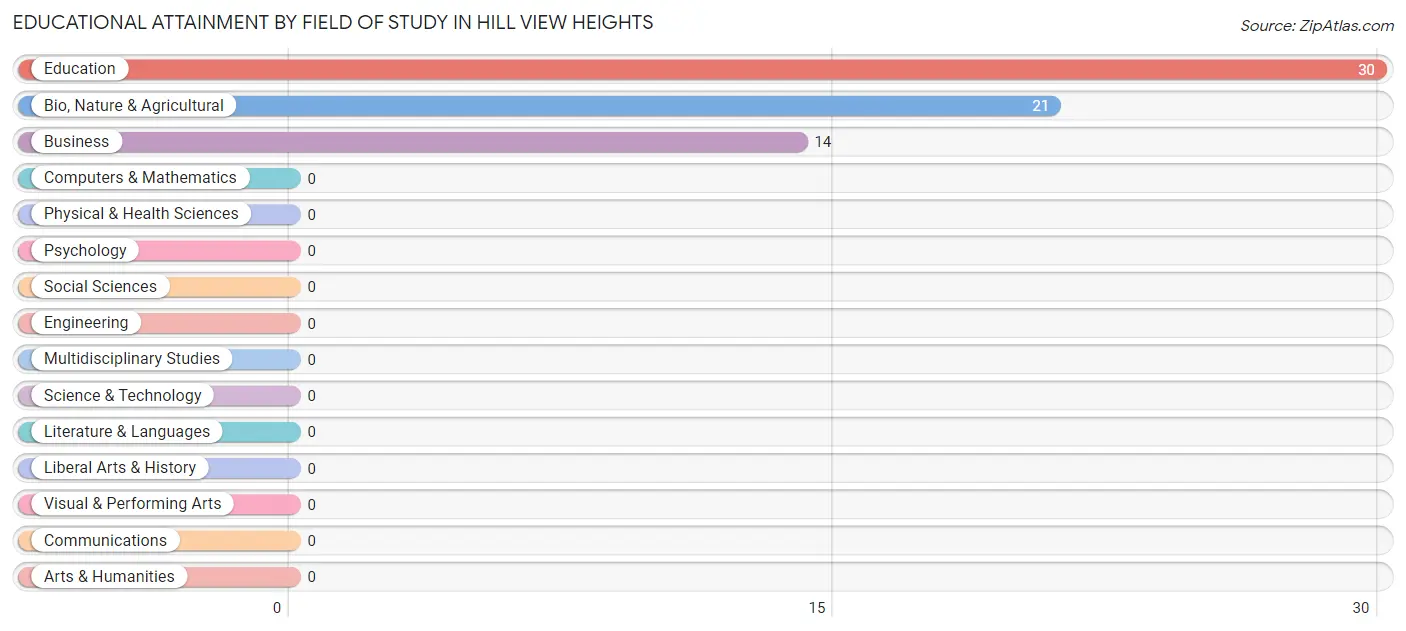
| Field of Study | # Graduates | % Graduates |
| Computers & Mathematics | 0 | 0.0% |
| Bio, Nature & Agricultural | 21 | 32.3% |
| Physical & Health Sciences | 0 | 0.0% |
| Psychology | 0 | 0.0% |
| Social Sciences | 0 | 0.0% |
| Engineering | 0 | 0.0% |
| Multidisciplinary Studies | 0 | 0.0% |
| Science & Technology | 0 | 0.0% |
| Business | 14 | 21.5% |
| Education | 30 | 46.2% |
| Literature & Languages | 0 | 0.0% |
| Liberal Arts & History | 0 | 0.0% |
| Visual & Performing Arts | 0 | 0.0% |
| Communications | 0 | 0.0% |
| Arts & Humanities | 0 | 0.0% |
| Total | 65 | 100.0% |
Transportation & Commute in Hill View Heights
Vehicle Availability by Sex in Hill View Heights
The most prevalent vehicle ownership categories in Hill View Heights are males with 5 or more vehicles (24, accounting for 61.5%) and females with 5 or more vehicles (30, making up 64.9%).
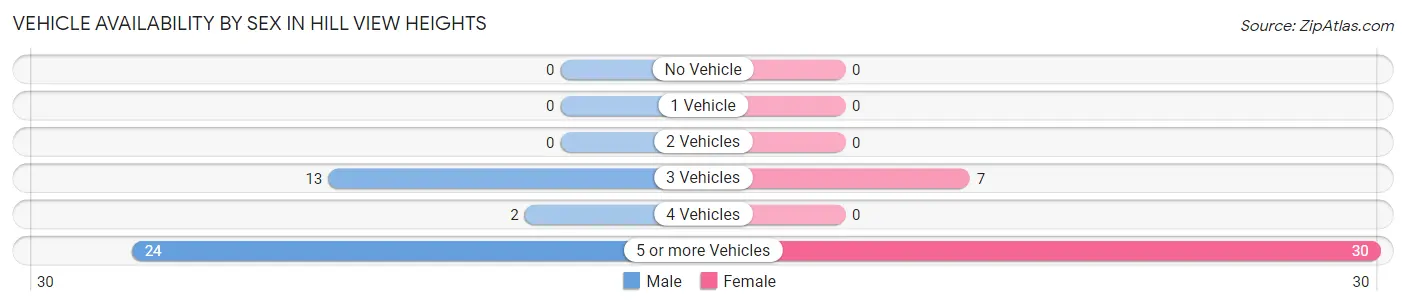
| Vehicles Available | Male | Female |
| No Vehicle | 0 (0.0%) | 0 (0.0%) |
| 1 Vehicle | 0 (0.0%) | 0 (0.0%) |
| 2 Vehicles | 0 (0.0%) | 0 (0.0%) |
| 3 Vehicles | 13 (33.3%) | 7 (18.9%) |
| 4 Vehicles | 2 (5.1%) | 0 (0.0%) |
| 5 or more Vehicles | 24 (61.5%) | 30 (81.1%) |
| Total | 39 (100.0%) | 37 (100.0%) |
Commute Time in Hill View Heights
The most frequently occuring commute durations in Hill View Heights are 10 to 14 minutes (30 commuters, 43.5%), 45 to 59 minutes (24 commuters, 34.8%), and 20 to 24 minutes (13 commuters, 18.8%).
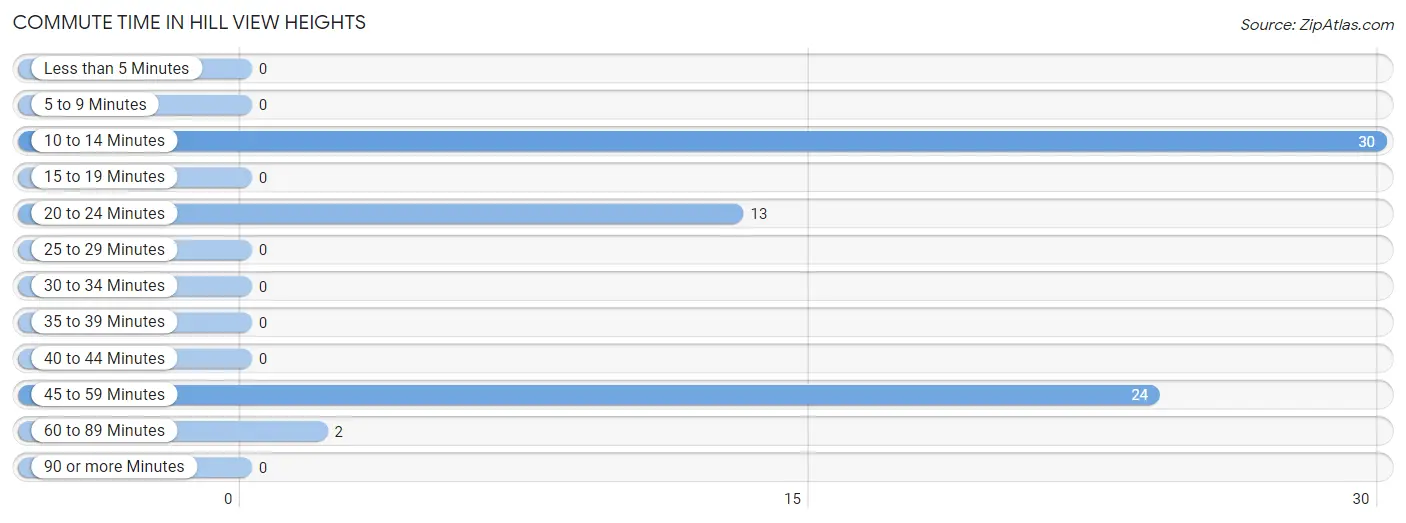
| Commute Time | # Commuters | % Commuters |
| Less than 5 Minutes | 0 | 0.0% |
| 5 to 9 Minutes | 0 | 0.0% |
| 10 to 14 Minutes | 30 | 43.5% |
| 15 to 19 Minutes | 0 | 0.0% |
| 20 to 24 Minutes | 13 | 18.8% |
| 25 to 29 Minutes | 0 | 0.0% |
| 30 to 34 Minutes | 0 | 0.0% |
| 35 to 39 Minutes | 0 | 0.0% |
| 40 to 44 Minutes | 0 | 0.0% |
| 45 to 59 Minutes | 24 | 34.8% |
| 60 to 89 Minutes | 2 | 2.9% |
| 90 or more Minutes | 0 | 0.0% |
Commute Time by Sex in Hill View Heights
The most common commute times in Hill View Heights are 45 to 59 minutes (24 commuters, 61.5%) for males and 10 to 14 minutes (30 commuters, 100.0%) for females.
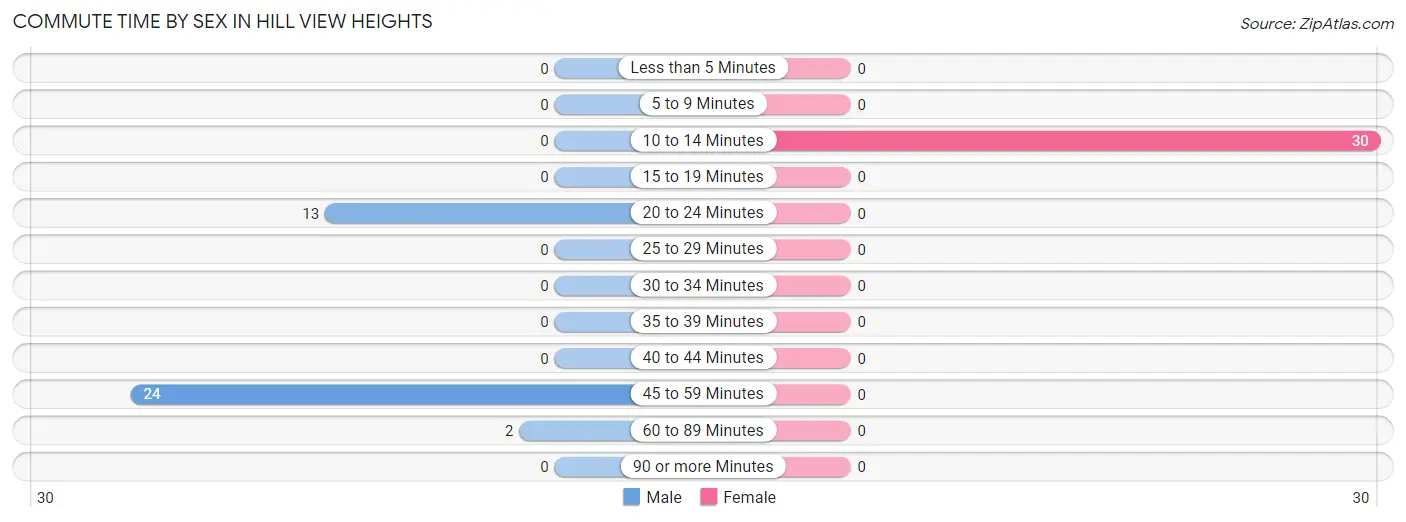
| Commute Time | Male | Female |
| Less than 5 Minutes | 0 (0.0%) | 0 (0.0%) |
| 5 to 9 Minutes | 0 (0.0%) | 0 (0.0%) |
| 10 to 14 Minutes | 0 (0.0%) | 30 (100.0%) |
| 15 to 19 Minutes | 0 (0.0%) | 0 (0.0%) |
| 20 to 24 Minutes | 13 (33.3%) | 0 (0.0%) |
| 25 to 29 Minutes | 0 (0.0%) | 0 (0.0%) |
| 30 to 34 Minutes | 0 (0.0%) | 0 (0.0%) |
| 35 to 39 Minutes | 0 (0.0%) | 0 (0.0%) |
| 40 to 44 Minutes | 0 (0.0%) | 0 (0.0%) |
| 45 to 59 Minutes | 24 (61.5%) | 0 (0.0%) |
| 60 to 89 Minutes | 2 (5.1%) | 0 (0.0%) |
| 90 or more Minutes | 0 (0.0%) | 0 (0.0%) |
Time of Departure to Work by Sex in Hill View Heights
The most frequent times of departure to work in Hill View Heights are 5:00 AM to 5:29 AM (26, 66.7%) for males and 8:00 AM to 8:29 AM (30, 100.0%) for females.
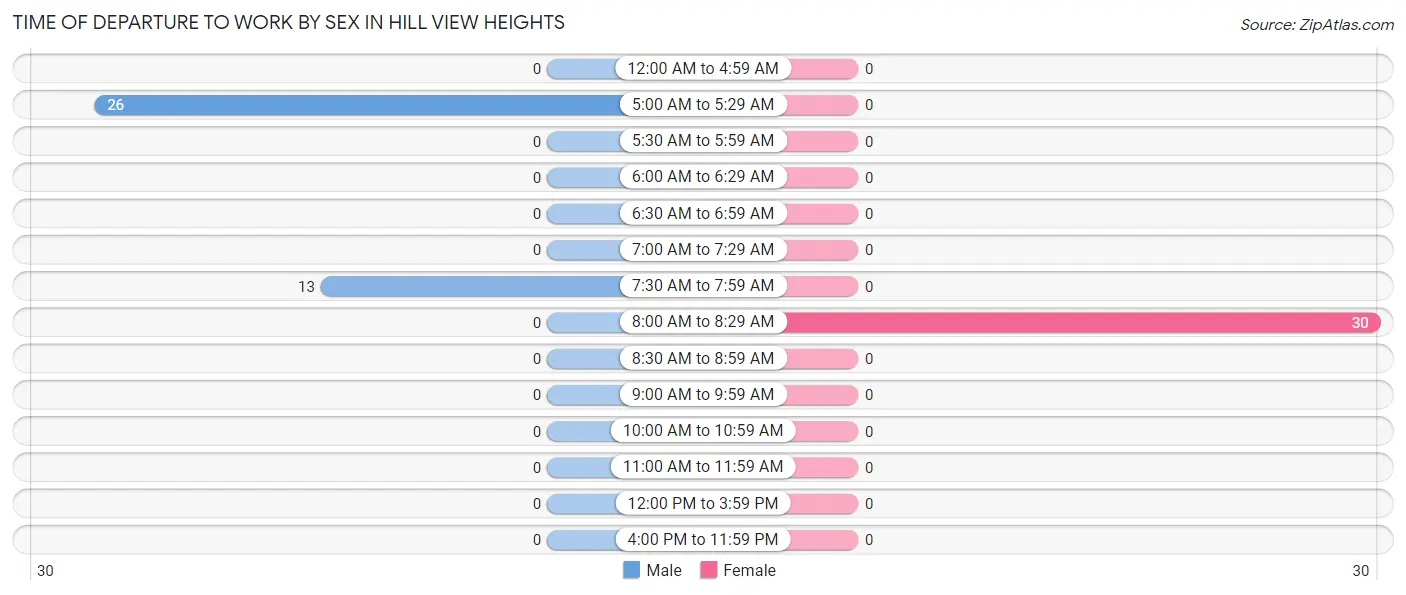
| Time of Departure | Male | Female |
| 12:00 AM to 4:59 AM | 0 (0.0%) | 0 (0.0%) |
| 5:00 AM to 5:29 AM | 26 (66.7%) | 0 (0.0%) |
| 5:30 AM to 5:59 AM | 0 (0.0%) | 0 (0.0%) |
| 6:00 AM to 6:29 AM | 0 (0.0%) | 0 (0.0%) |
| 6:30 AM to 6:59 AM | 0 (0.0%) | 0 (0.0%) |
| 7:00 AM to 7:29 AM | 0 (0.0%) | 0 (0.0%) |
| 7:30 AM to 7:59 AM | 13 (33.3%) | 0 (0.0%) |
| 8:00 AM to 8:29 AM | 0 (0.0%) | 30 (100.0%) |
| 8:30 AM to 8:59 AM | 0 (0.0%) | 0 (0.0%) |
| 9:00 AM to 9:59 AM | 0 (0.0%) | 0 (0.0%) |
| 10:00 AM to 10:59 AM | 0 (0.0%) | 0 (0.0%) |
| 11:00 AM to 11:59 AM | 0 (0.0%) | 0 (0.0%) |
| 12:00 PM to 3:59 PM | 0 (0.0%) | 0 (0.0%) |
| 4:00 PM to 11:59 PM | 0 (0.0%) | 0 (0.0%) |
| Total | 39 (100.0%) | 30 (100.0%) |
Housing Occupancy in Hill View Heights
Occupancy by Ownership in Hill View Heights
Of the total 66 dwellings in Hill View Heights, owner-occupied units account for 66 (100.0%), while renter-occupied units make up 0 (0.0%).
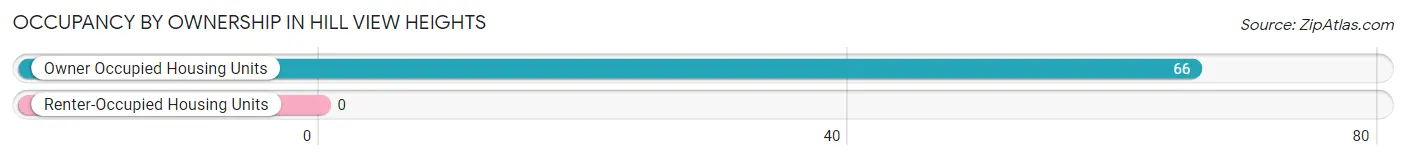
| Occupancy | # Housing Units | % Housing Units |
| Owner Occupied Housing Units | 66 | 100.0% |
| Renter-Occupied Housing Units | 0 | 0.0% |
| Total Occupied Housing Units | 66 | 100.0% |
Occupancy by Household Size in Hill View Heights
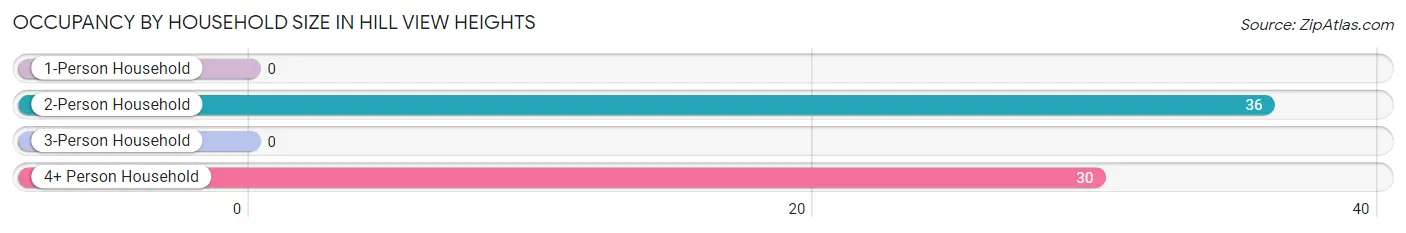
| Household Size | # Housing Units | % Housing Units |
| 1-Person Household | 0 | 0.0% |
| 2-Person Household | 36 | 54.5% |
| 3-Person Household | 0 | 0.0% |
| 4+ Person Household | 30 | 45.5% |
| Total Housing Units | 66 | 100.0% |
Occupancy by Ownership by Household Size in Hill View Heights
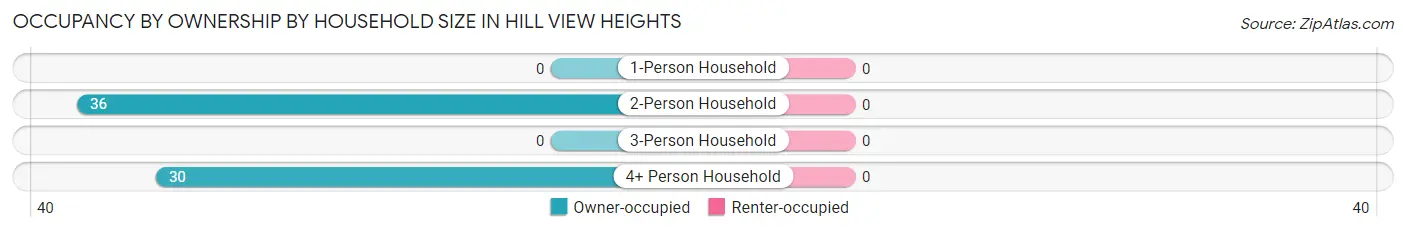
| Household Size | Owner-occupied | Renter-occupied |
| 1-Person Household | 0 (0.0%) | 0 (0.0%) |
| 2-Person Household | 36 (100.0%) | 0 (0.0%) |
| 3-Person Household | 0 (0.0%) | 0 (0.0%) |
| 4+ Person Household | 30 (100.0%) | 0 (0.0%) |
| Total Housing Units | 66 (100.0%) | 0 (0.0%) |
Occupancy by Educational Attainment in Hill View Heights
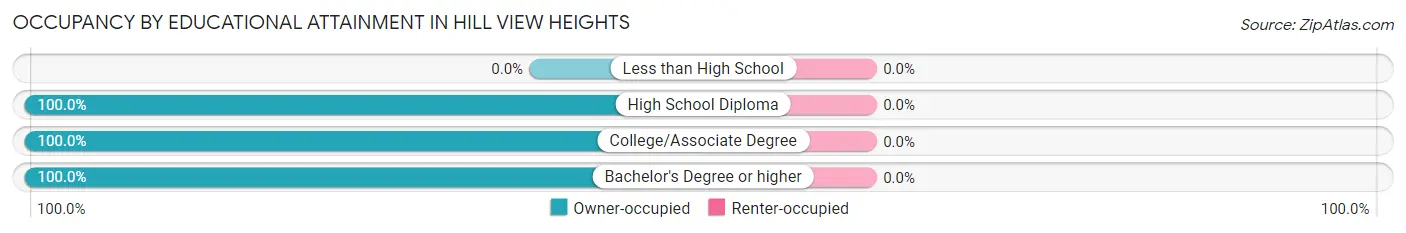
| Household Size | Owner-occupied | Renter-occupied |
| Less than High School | 0 (0.0%) | 0 (0.0%) |
| High School Diploma | 9 (100.0%) | 0 (0.0%) |
| College/Associate Degree | 6 (100.0%) | 0 (0.0%) |
| Bachelor's Degree or higher | 51 (100.0%) | 0 (0.0%) |
Occupancy by Age of Householder in Hill View Heights
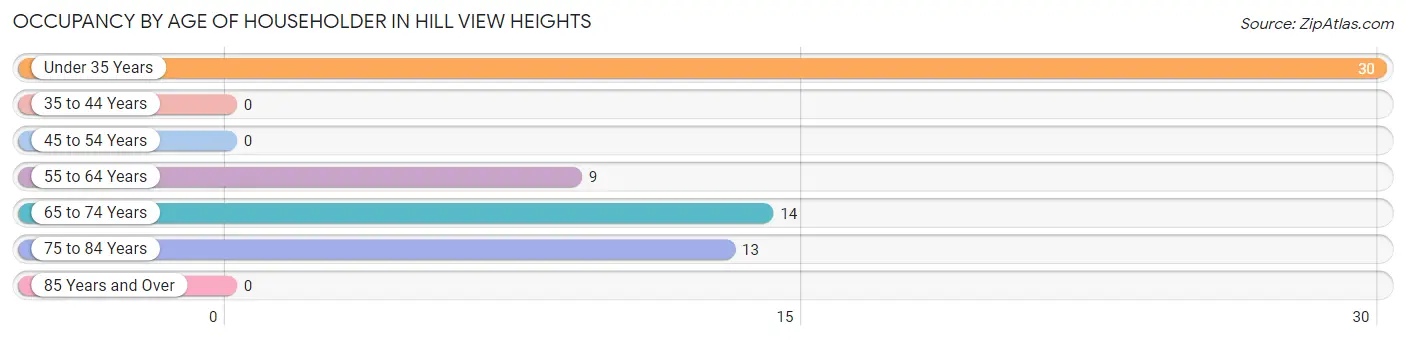
| Age Bracket | # Households | % Households |
| Under 35 Years | 30 | 45.5% |
| 35 to 44 Years | 0 | 0.0% |
| 45 to 54 Years | 0 | 0.0% |
| 55 to 64 Years | 9 | 13.6% |
| 65 to 74 Years | 14 | 21.2% |
| 75 to 84 Years | 13 | 19.7% |
| 85 Years and Over | 0 | 0.0% |
| Total | 66 | 100.0% |
Housing Finances in Hill View Heights
Median Income by Occupancy in Hill View Heights
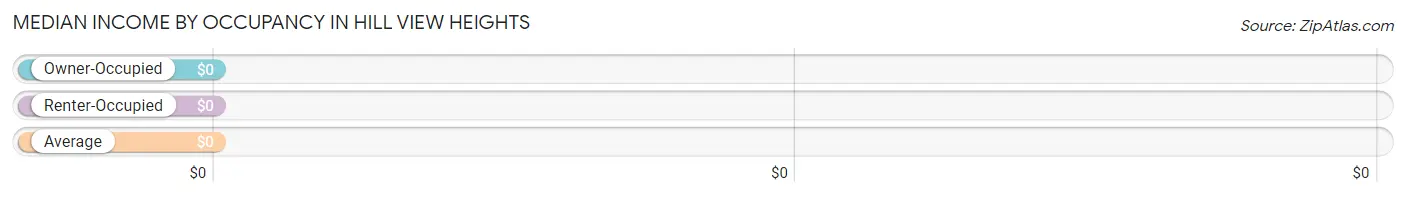
| Occupancy Type | # Households | Median Income |
| Owner-Occupied | 66 (100.0%) | $0 |
| Renter-Occupied | 0 (0.0%) | $0 |
| Average | 66 (100.0%) | $0 |
Occupancy by Householder Income Bracket in Hill View Heights
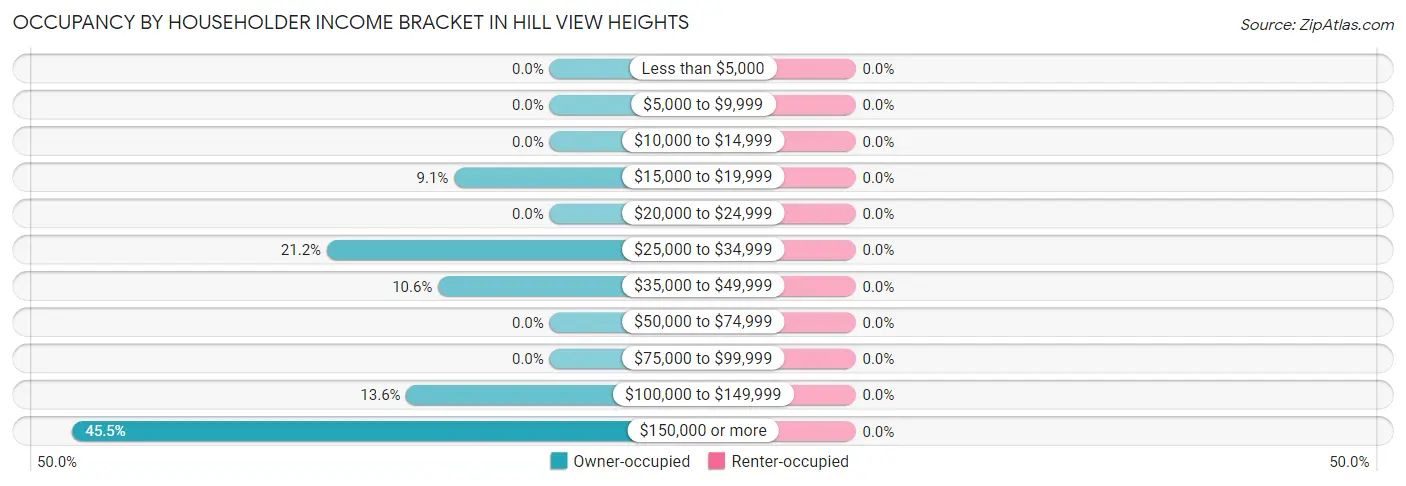
| Income Bracket | Owner-occupied | Renter-occupied |
| Less than $5,000 | 0 (0.0%) | 0 (0.0%) |
| $5,000 to $9,999 | 0 (0.0%) | 0 (0.0%) |
| $10,000 to $14,999 | 0 (0.0%) | 0 (0.0%) |
| $15,000 to $19,999 | 6 (9.1%) | 0 (0.0%) |
| $20,000 to $24,999 | 0 (0.0%) | 0 (0.0%) |
| $25,000 to $34,999 | 14 (21.2%) | 0 (0.0%) |
| $35,000 to $49,999 | 7 (10.6%) | 0 (0.0%) |
| $50,000 to $74,999 | 0 (0.0%) | 0 (0.0%) |
| $75,000 to $99,999 | 0 (0.0%) | 0 (0.0%) |
| $100,000 to $149,999 | 9 (13.6%) | 0 (0.0%) |
| $150,000 or more | 30 (45.5%) | 0 (0.0%) |
| Total | 66 (100.0%) | 0 (0.0%) |
Monthly Housing Cost Tiers in Hill View Heights
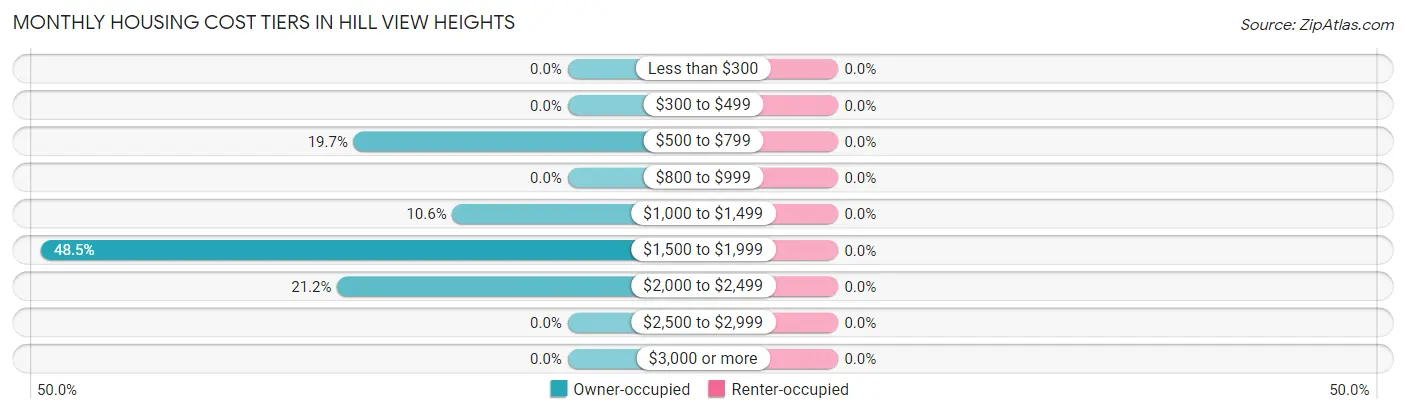
| Monthly Cost | Owner-occupied | Renter-occupied |
| Less than $300 | 0 (0.0%) | 0 (0.0%) |
| $300 to $499 | 0 (0.0%) | 0 (0.0%) |
| $500 to $799 | 13 (19.7%) | 0 (0.0%) |
| $800 to $999 | 0 (0.0%) | 0 (0.0%) |
| $1,000 to $1,499 | 7 (10.6%) | 0 (0.0%) |
| $1,500 to $1,999 | 32 (48.5%) | 0 (0.0%) |
| $2,000 to $2,499 | 14 (21.2%) | 0 (0.0%) |
| $2,500 to $2,999 | 0 (0.0%) | 0 (0.0%) |
| $3,000 or more | 0 (0.0%) | 0 (0.0%) |
| Total | 66 (100.0%) | 0 (0.0%) |
Physical Housing Characteristics in Hill View Heights
Housing Structures in Hill View Heights
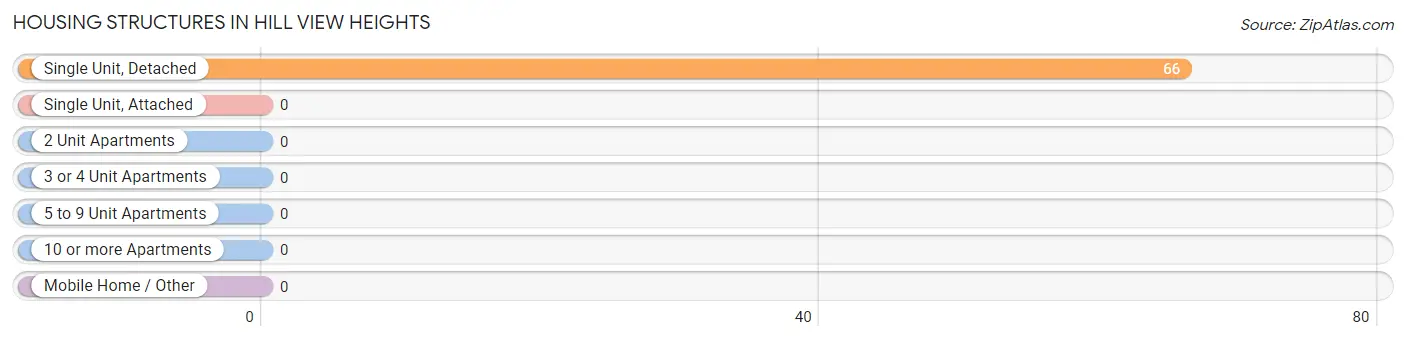
| Structure Type | # Housing Units | % Housing Units |
| Single Unit, Detached | 66 | 100.0% |
| Single Unit, Attached | 0 | 0.0% |
| 2 Unit Apartments | 0 | 0.0% |
| 3 or 4 Unit Apartments | 0 | 0.0% |
| 5 to 9 Unit Apartments | 0 | 0.0% |
| 10 or more Apartments | 0 | 0.0% |
| Mobile Home / Other | 0 | 0.0% |
| Total | 66 | 100.0% |
Housing Structures by Occupancy in Hill View Heights
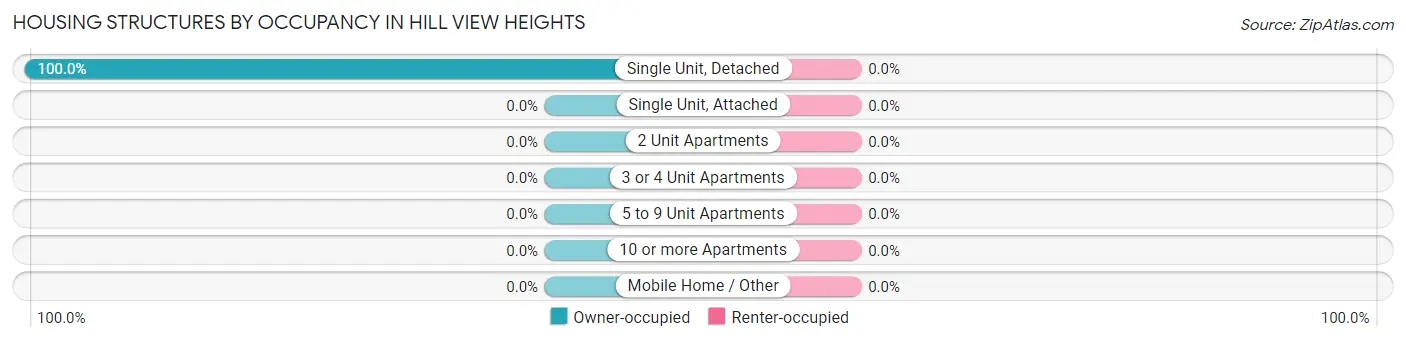
| Structure Type | Owner-occupied | Renter-occupied |
| Single Unit, Detached | 66 (100.0%) | 0 (0.0%) |
| Single Unit, Attached | 0 (0.0%) | 0 (0.0%) |
| 2 Unit Apartments | 0 (0.0%) | 0 (0.0%) |
| 3 or 4 Unit Apartments | 0 (0.0%) | 0 (0.0%) |
| 5 to 9 Unit Apartments | 0 (0.0%) | 0 (0.0%) |
| 10 or more Apartments | 0 (0.0%) | 0 (0.0%) |
| Mobile Home / Other | 0 (0.0%) | 0 (0.0%) |
| Total | 66 (100.0%) | 0 (0.0%) |
Housing Structures by Number of Rooms in Hill View Heights
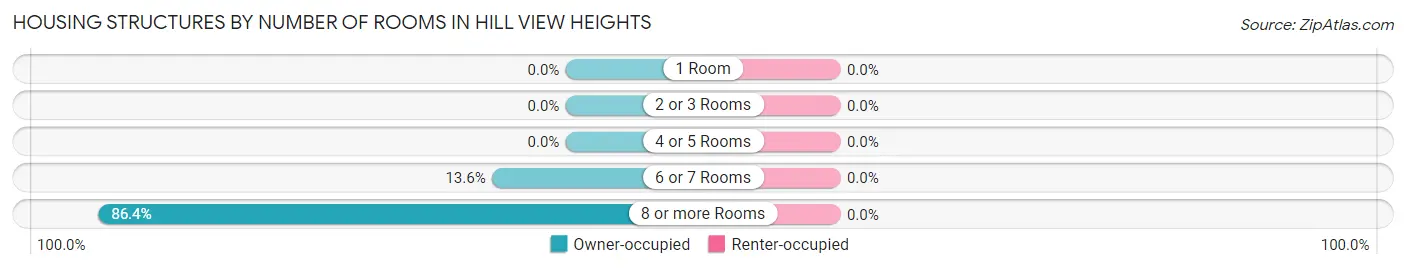
| Number of Rooms | Owner-occupied | Renter-occupied |
| 1 Room | 0 (0.0%) | 0 (0.0%) |
| 2 or 3 Rooms | 0 (0.0%) | 0 (0.0%) |
| 4 or 5 Rooms | 0 (0.0%) | 0 (0.0%) |
| 6 or 7 Rooms | 9 (13.6%) | 0 (0.0%) |
| 8 or more Rooms | 57 (86.4%) | 0 (0.0%) |
| Total | 66 (100.0%) | 0 (0.0%) |
Housing Structure by Heating Type in Hill View Heights

| Heating Type | Owner-occupied | Renter-occupied |
| Utility Gas | 0 (0.0%) | 0 (0.0%) |
| Bottled, Tank, or LP Gas | 37 (56.1%) | 0 (0.0%) |
| Electricity | 29 (43.9%) | 0 (0.0%) |
| Fuel Oil or Kerosene | 0 (0.0%) | 0 (0.0%) |
| Coal or Coke | 0 (0.0%) | 0 (0.0%) |
| All other Fuels | 0 (0.0%) | 0 (0.0%) |
| No Fuel Used | 0 (0.0%) | 0 (0.0%) |
| Total | 66 (100.0%) | 0 (0.0%) |
Household Vehicle Usage in Hill View Heights
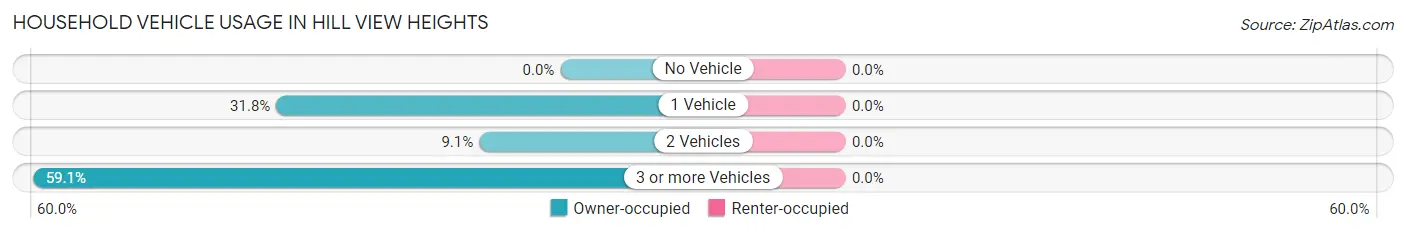
| Vehicles per Household | Owner-occupied | Renter-occupied |
| No Vehicle | 0 (0.0%) | 0 (0.0%) |
| 1 Vehicle | 21 (31.8%) | 0 (0.0%) |
| 2 Vehicles | 6 (9.1%) | 0 (0.0%) |
| 3 or more Vehicles | 39 (59.1%) | 0 (0.0%) |
| Total | 66 (100.0%) | 0 (0.0%) |
Real Estate & Mortgages in Hill View Heights
Real Estate and Mortgage Overview in Hill View Heights
| Characteristic | Without Mortgage | With Mortgage |
| Housing Units | 13 | 53 |
| Median Property Value | - | - |
| Median Household Income | - | - |
| Monthly Housing Costs | - | - |
| Real Estate Taxes | - | - |
Property Value by Mortgage Status in Hill View Heights
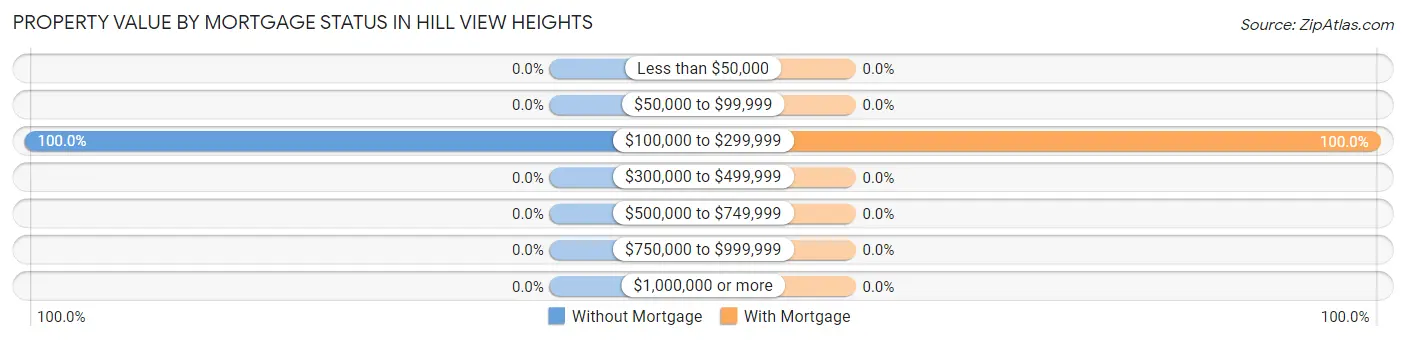
| Property Value | Without Mortgage | With Mortgage |
| Less than $50,000 | 0 (0.0%) | 0 (0.0%) |
| $50,000 to $99,999 | 0 (0.0%) | 0 (0.0%) |
| $100,000 to $299,999 | 13 (100.0%) | 53 (100.0%) |
| $300,000 to $499,999 | 0 (0.0%) | 0 (0.0%) |
| $500,000 to $749,999 | 0 (0.0%) | 0 (0.0%) |
| $750,000 to $999,999 | 0 (0.0%) | 0 (0.0%) |
| $1,000,000 or more | 0 (0.0%) | 0 (0.0%) |
| Total | 13 (100.0%) | 53 (100.0%) |
Household Income by Mortgage Status in Hill View Heights
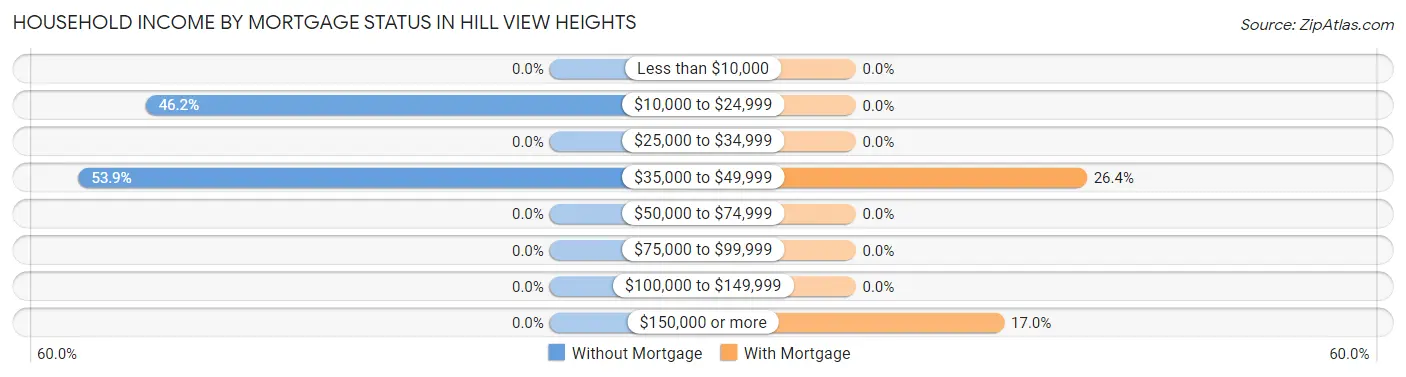
| Household Income | Without Mortgage | With Mortgage |
| Less than $10,000 | 0 (0.0%) | 0 (0.0%) |
| $10,000 to $24,999 | 6 (46.2%) | 0 (0.0%) |
| $25,000 to $34,999 | 0 (0.0%) | 0 (0.0%) |
| $35,000 to $49,999 | 7 (53.8%) | 14 (26.4%) |
| $50,000 to $74,999 | 0 (0.0%) | 0 (0.0%) |
| $75,000 to $99,999 | 0 (0.0%) | 0 (0.0%) |
| $100,000 to $149,999 | 0 (0.0%) | 0 (0.0%) |
| $150,000 or more | 0 (0.0%) | 9 (17.0%) |
| Total | 13 (100.0%) | 53 (100.0%) |
Property Value to Household Income Ratio in Hill View Heights
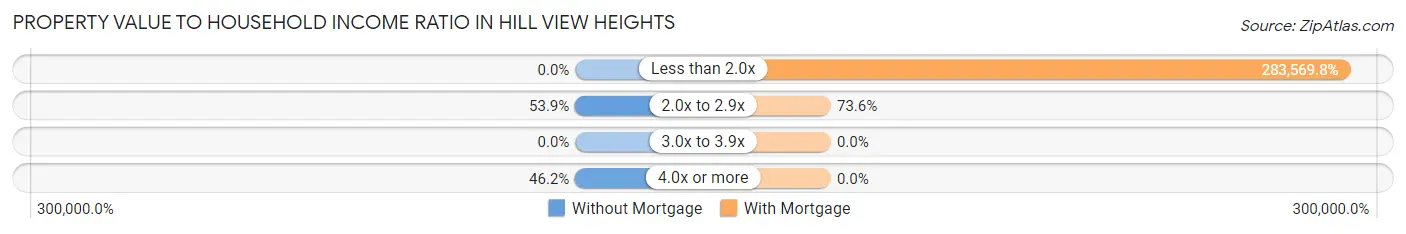
| Value-to-Income Ratio | Without Mortgage | With Mortgage |
| Less than 2.0x | 0 (0.0%) | 150,292 (283,569.8%) |
| 2.0x to 2.9x | 7 (53.8%) | 39 (73.6%) |
| 3.0x to 3.9x | 0 (0.0%) | 0 (0.0%) |
| 4.0x or more | 6 (46.2%) | 0 (0.0%) |
| Total | 13 (100.0%) | 53 (100.0%) |
Real Estate Taxes by Mortgage Status in Hill View Heights
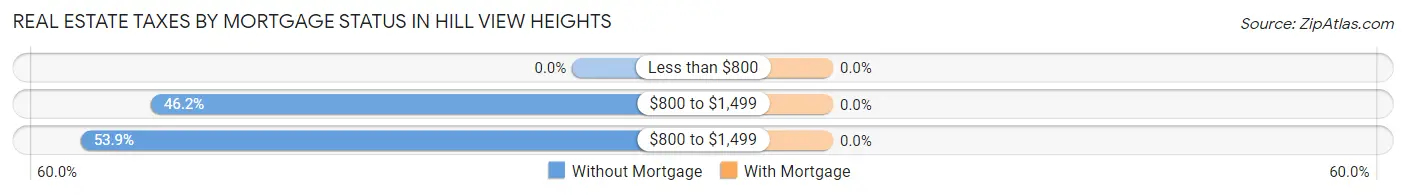
| Property Taxes | Without Mortgage | With Mortgage |
| Less than $800 | 0 (0.0%) | 0 (0.0%) |
| $800 to $1,499 | 6 (46.2%) | 0 (0.0%) |
| $800 to $1,499 | 7 (53.8%) | 0 (0.0%) |
| Total | 13 (100.0%) | 53 (100.0%) |
Health & Disability in Hill View Heights
Health Insurance Coverage by Age in Hill View Heights
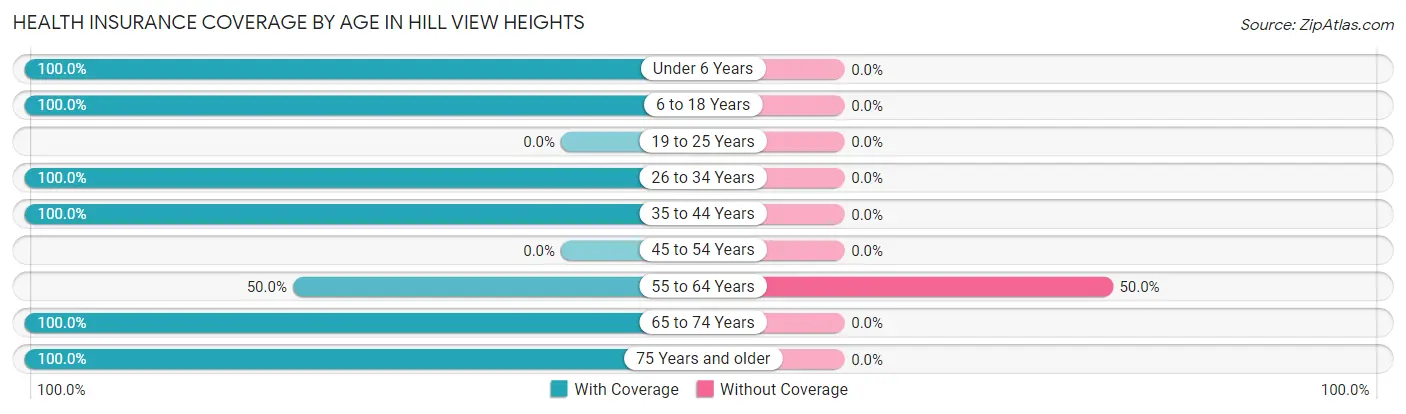
| Age Bracket | With Coverage | Without Coverage |
| Under 6 Years | 54 (100.0%) | 0 (0.0%) |
| 6 to 18 Years | 33 (100.0%) | 0 (0.0%) |
| 19 to 25 Years | 0 (0.0%) | 0 (0.0%) |
| 26 to 34 Years | 30 (100.0%) | 0 (0.0%) |
| 35 to 44 Years | 24 (100.0%) | 0 (0.0%) |
| 45 to 54 Years | 0 (0.0%) | 0 (0.0%) |
| 55 to 64 Years | 13 (50.0%) | 13 (50.0%) |
| 65 to 74 Years | 37 (100.0%) | 0 (0.0%) |
| 75 Years and older | 13 (100.0%) | 0 (0.0%) |
| Total | 204 (94.0%) | 13 (6.0%) |
Health Insurance Coverage by Citizenship Status in Hill View Heights
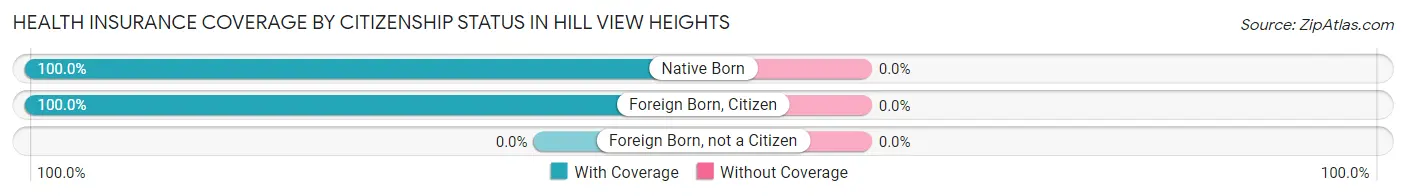
| Citizenship Status | With Coverage | Without Coverage |
| Native Born | 54 (100.0%) | 0 (0.0%) |
| Foreign Born, Citizen | 33 (100.0%) | 0 (0.0%) |
| Foreign Born, not a Citizen | 0 (0.0%) | 0 (0.0%) |
Health Insurance Coverage by Household Income in Hill View Heights
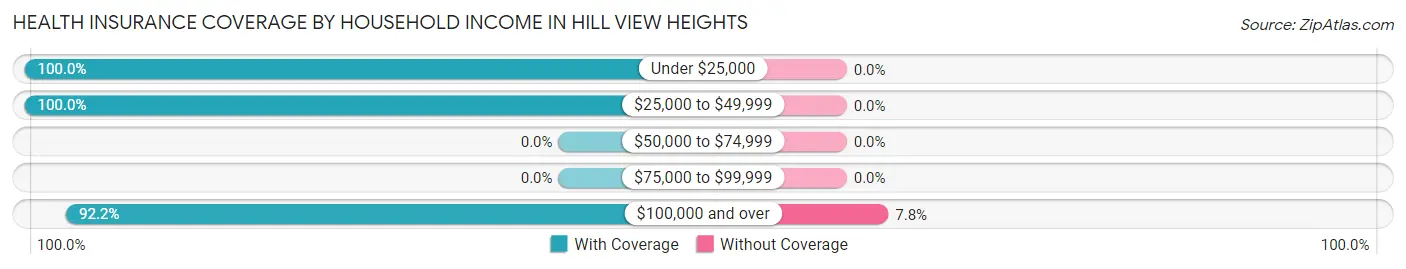
| Household Income | With Coverage | Without Coverage |
| Under $25,000 | 13 (100.0%) | 0 (0.0%) |
| $25,000 to $49,999 | 37 (100.0%) | 0 (0.0%) |
| $50,000 to $74,999 | 0 (0.0%) | 0 (0.0%) |
| $75,000 to $99,999 | 0 (0.0%) | 0 (0.0%) |
| $100,000 and over | 154 (92.2%) | 13 (7.8%) |
Public vs Private Health Insurance Coverage by Age in Hill View Heights
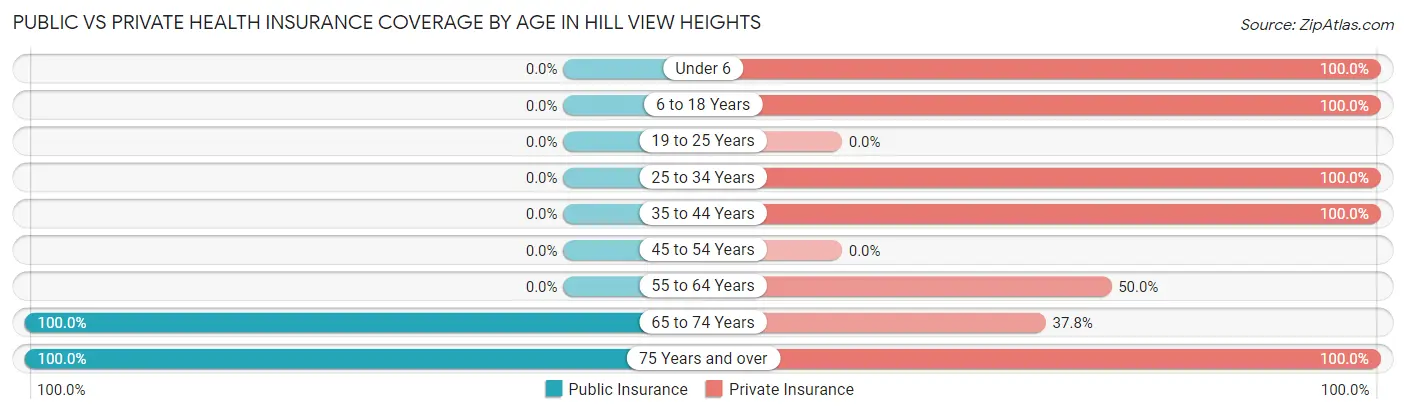
| Age Bracket | Public Insurance | Private Insurance |
| Under 6 | 0 (0.0%) | 54 (100.0%) |
| 6 to 18 Years | 0 (0.0%) | 33 (100.0%) |
| 19 to 25 Years | 0 (0.0%) | 0 (0.0%) |
| 25 to 34 Years | 0 (0.0%) | 30 (100.0%) |
| 35 to 44 Years | 0 (0.0%) | 24 (100.0%) |
| 45 to 54 Years | 0 (0.0%) | 0 (0.0%) |
| 55 to 64 Years | 0 (0.0%) | 13 (50.0%) |
| 65 to 74 Years | 37 (100.0%) | 14 (37.8%) |
| 75 Years and over | 13 (100.0%) | 13 (100.0%) |
| Total | 50 (23.0%) | 181 (83.4%) |
Disability Status by Sex by Age in Hill View Heights
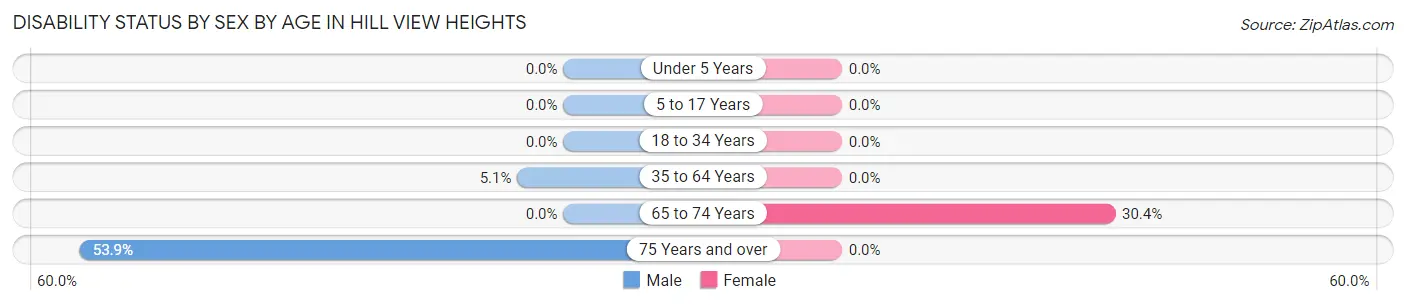
| Age Bracket | Male | Female |
| Under 5 Years | 0 (0.0%) | 0 (0.0%) |
| 5 to 17 Years | 0 (0.0%) | 0 (0.0%) |
| 18 to 34 Years | 0 (0.0%) | 0 (0.0%) |
| 35 to 64 Years | 2 (5.1%) | 0 (0.0%) |
| 65 to 74 Years | 0 (0.0%) | 7 (30.4%) |
| 75 Years and over | 7 (53.8%) | 0 (0.0%) |
Disability Class by Sex by Age in Hill View Heights
Disability Class: Hearing Difficulty
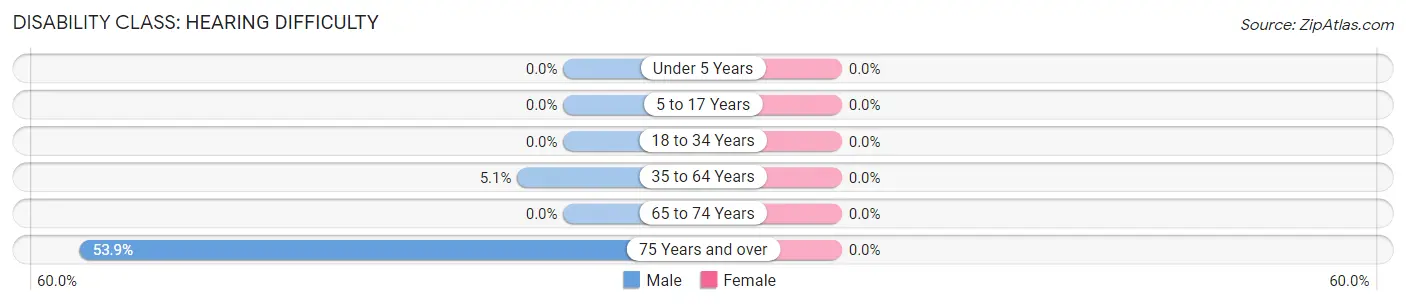
| Age Bracket | Male | Female |
| Under 5 Years | 0 (0.0%) | 0 (0.0%) |
| 5 to 17 Years | 0 (0.0%) | 0 (0.0%) |
| 18 to 34 Years | 0 (0.0%) | 0 (0.0%) |
| 35 to 64 Years | 2 (5.1%) | 0 (0.0%) |
| 65 to 74 Years | 0 (0.0%) | 0 (0.0%) |
| 75 Years and over | 7 (53.8%) | 0 (0.0%) |
Disability Class: Vision Difficulty
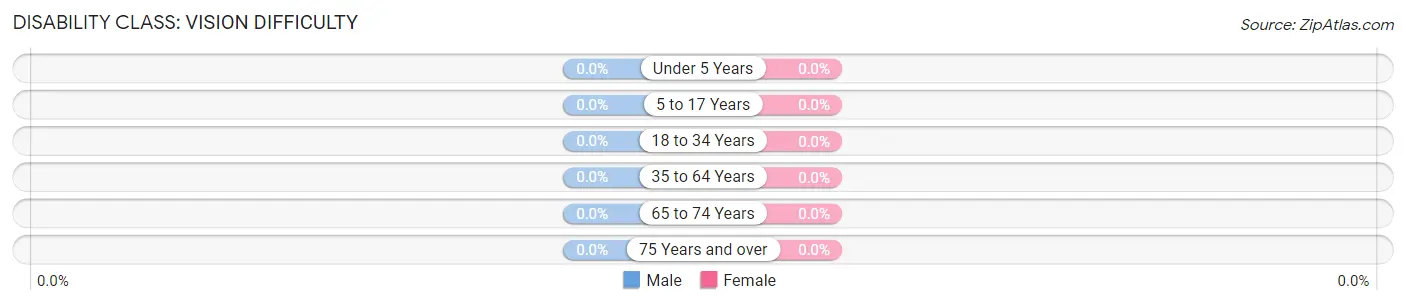
| Age Bracket | Male | Female |
| Under 5 Years | 0 (0.0%) | 0 (0.0%) |
| 5 to 17 Years | 0 (0.0%) | 0 (0.0%) |
| 18 to 34 Years | 0 (0.0%) | 0 (0.0%) |
| 35 to 64 Years | 0 (0.0%) | 0 (0.0%) |
| 65 to 74 Years | 0 (0.0%) | 0 (0.0%) |
| 75 Years and over | 0 (0.0%) | 0 (0.0%) |
Disability Class: Cognitive Difficulty
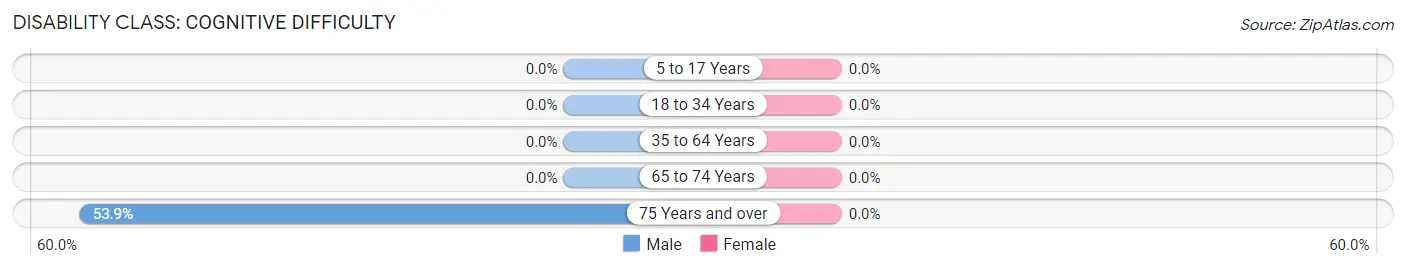
| Age Bracket | Male | Female |
| 5 to 17 Years | 0 (0.0%) | 0 (0.0%) |
| 18 to 34 Years | 0 (0.0%) | 0 (0.0%) |
| 35 to 64 Years | 0 (0.0%) | 0 (0.0%) |
| 65 to 74 Years | 0 (0.0%) | 0 (0.0%) |
| 75 Years and over | 7 (53.8%) | 0 (0.0%) |
Disability Class: Ambulatory Difficulty
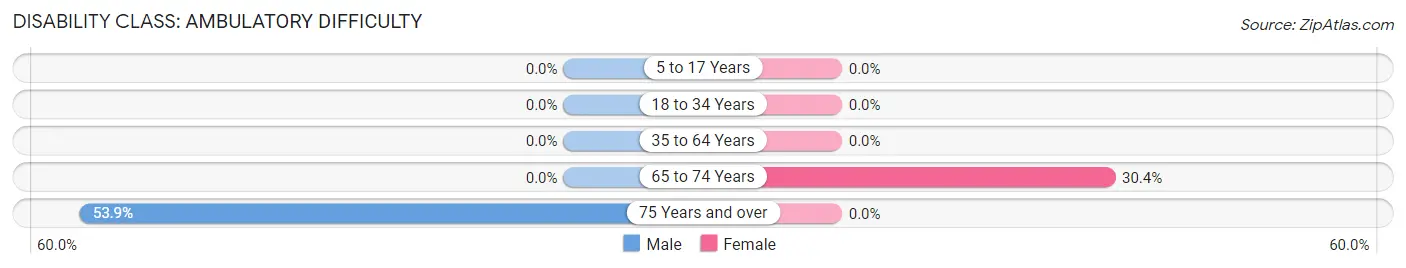
| Age Bracket | Male | Female |
| 5 to 17 Years | 0 (0.0%) | 0 (0.0%) |
| 18 to 34 Years | 0 (0.0%) | 0 (0.0%) |
| 35 to 64 Years | 0 (0.0%) | 0 (0.0%) |
| 65 to 74 Years | 0 (0.0%) | 7 (30.4%) |
| 75 Years and over | 7 (53.8%) | 0 (0.0%) |
Disability Class: Self-Care Difficulty
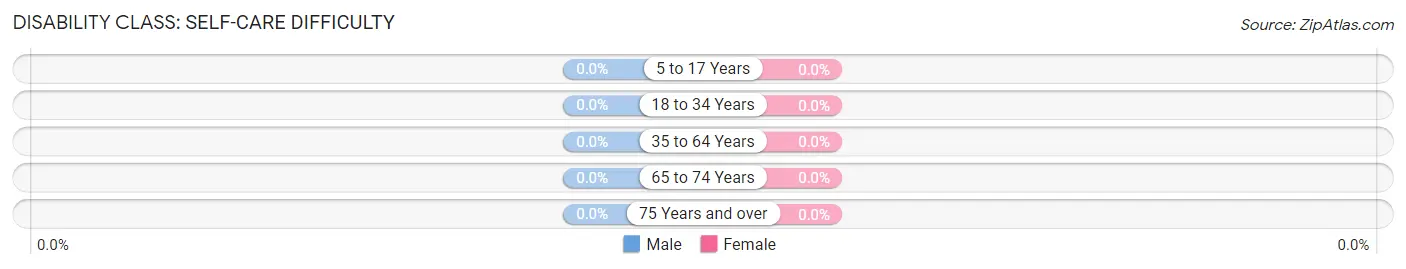
| Age Bracket | Male | Female |
| 5 to 17 Years | 0 (0.0%) | 0 (0.0%) |
| 18 to 34 Years | 0 (0.0%) | 0 (0.0%) |
| 35 to 64 Years | 0 (0.0%) | 0 (0.0%) |
| 65 to 74 Years | 0 (0.0%) | 0 (0.0%) |
| 75 Years and over | 0 (0.0%) | 0 (0.0%) |
Technology Access in Hill View Heights
Computing Device Access in Hill View Heights
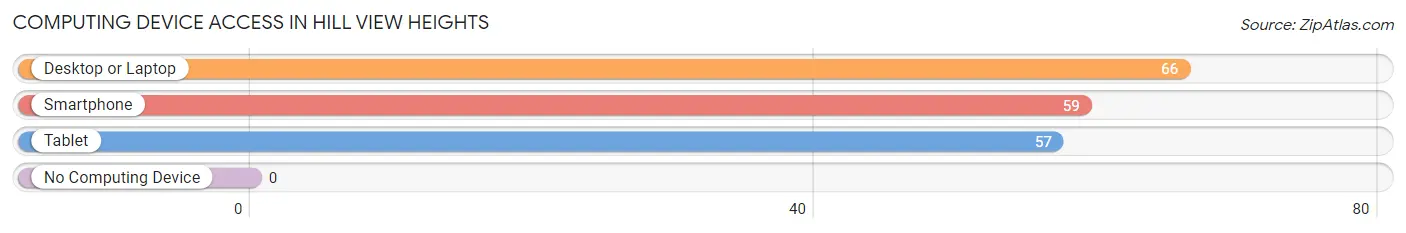
| Device Type | # Households | % Households |
| Desktop or Laptop | 66 | 100.0% |
| Smartphone | 59 | 89.4% |
| Tablet | 57 | 86.4% |
| No Computing Device | 0 | 0.0% |
| Total | 66 | 100.0% |
Internet Access in Hill View Heights
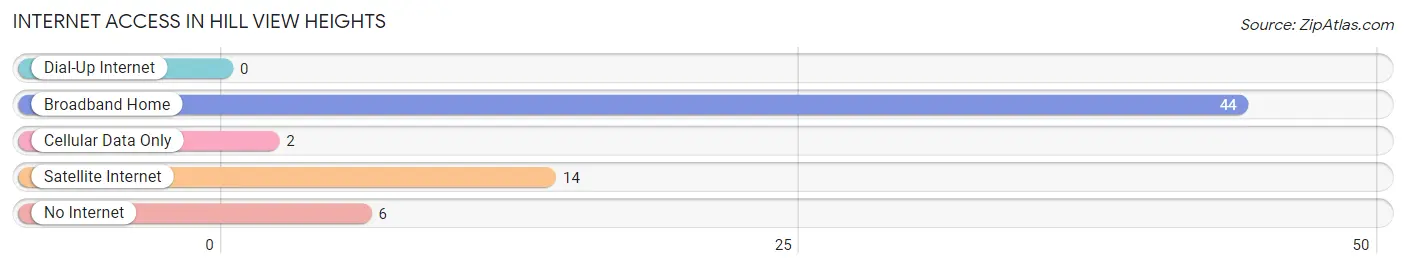
| Internet Type | # Households | % Households |
| Dial-Up Internet | 0 | 0.0% |
| Broadband Home | 44 | 66.7% |
| Cellular Data Only | 2 | 3.0% |
| Satellite Internet | 14 | 21.2% |
| No Internet | 6 | 9.1% |
| Total | 66 | 100.0% |
Hill View Heights Summary
Hill View Heights is a small town located in the state of Wyoming, in the United States of America. It is situated in the western part of the state, in the foothills of the Rocky Mountains. The town has a population of approximately 1,000 people, and is located in the county of Park.
History
The town of Hill View Heights was founded in the late 1800s, when a group of settlers from the east coast of the United States decided to move west in search of a better life. The settlers were attracted to the area due to its abundance of natural resources, including timber, minerals, and water. The town was originally named Hill View, but the name was changed to Hill View Heights in the early 1900s.
The town grew steadily throughout the early 20th century, and by the 1950s it had become a thriving community. The town was home to a variety of businesses, including a sawmill, a general store, and a hotel. The town also had a school, a post office, and a church.
Geography
Hill View Heights is located in the western part of Wyoming, in the foothills of the Rocky Mountains. The town is situated at an elevation of 6,000 feet above sea level, and is surrounded by mountains and forests. The town is located in a valley, and is bordered by the Snake River to the north and the Wind River to the south.
The climate in Hill View Heights is generally mild, with temperatures ranging from the low 30s in the winter to the high 80s in the summer. The town receives an average of 20 inches of precipitation per year, with most of it falling in the form of snow.
Economy
The economy of Hill View Heights is largely based on tourism and agriculture. The town is home to a variety of tourist attractions, including a ski resort, a golf course, and a number of hiking trails. The town also has a number of farms, which produce a variety of crops, including wheat, corn, and hay.
The town also has a number of small businesses, including restaurants, shops, and a gas station. The town is also home to a number of manufacturing companies, which produce a variety of products, including furniture, clothing, and electronics.
Demographics
As of the 2010 census, the population of Hill View Heights was 1,000 people. The town is predominantly white, with approximately 95% of the population being of European descent. The town also has a small Hispanic population, with approximately 5% of the population being of Hispanic or Latino origin.
The median household income in Hill View Heights is approximately $50,000 per year, and the median home value is approximately $200,000. The town has a low unemployment rate, with only 3.5% of the population being unemployed.
Conclusion
Hill View Heights is a small town located in the western part of Wyoming, in the foothills of the Rocky Mountains. The town has a population of approximately 1,000 people, and is largely based on tourism and agriculture. The town is predominantly white, with a small Hispanic population, and has a median household income of approximately $50,000 per year. Hill View Heights is a thriving community, with a variety of businesses, tourist attractions, and natural resources.
Common Questions
What is Per Capita Income in Hill View Heights?
Per Capita income in Hill View Heights is $28,451.
What is Income or Wage Gap in Hill View Heights?
Income or Wage Gap in Hill View Heights is 53.9%.
Women in Hill View Heights earn 46.1 cents for every dollar earned by a man.
What is Inequality or Gini Index in Hill View Heights?
Inequality or Gini Index in Hill View Heights is 0.30.
What is the Total Population of Hill View Heights?
Total Population of Hill View Heights is 217.
What is the Total Male Population of Hill View Heights?
Total Male Population of Hill View Heights is 66.
What is the Total Female Population of Hill View Heights?
Total Female Population of Hill View Heights is 151.
What is the Ratio of Males per 100 Females in Hill View Heights?
There are 43.71 Males per 100 Females in Hill View Heights.
What is the Ratio of Females per 100 Males in Hill View Heights?
There are 228.79 Females per 100 Males in Hill View Heights.
What is the Median Population Age in Hill View Heights?
Median Population Age in Hill View Heights is 30.7 Years.
What is the Average Family Size in Hill View Heights
Average Family Size in Hill View Heights is 3.4 People.
What is the Average Household Size in Hill View Heights
Average Household Size in Hill View Heights is 3.3 People.
How Large is the Labor Force in Hill View Heights?
There are 94 People in the Labor Forcein in Hill View Heights.
What is the Percentage of People in the Labor Force in Hill View Heights?
72.3% of People are in the Labor Force in Hill View Heights.
What is the Unemployment Rate in Hill View Heights?
Unemployment Rate in Hill View Heights is 14.9%.