Fairview, OR Map & Demographics
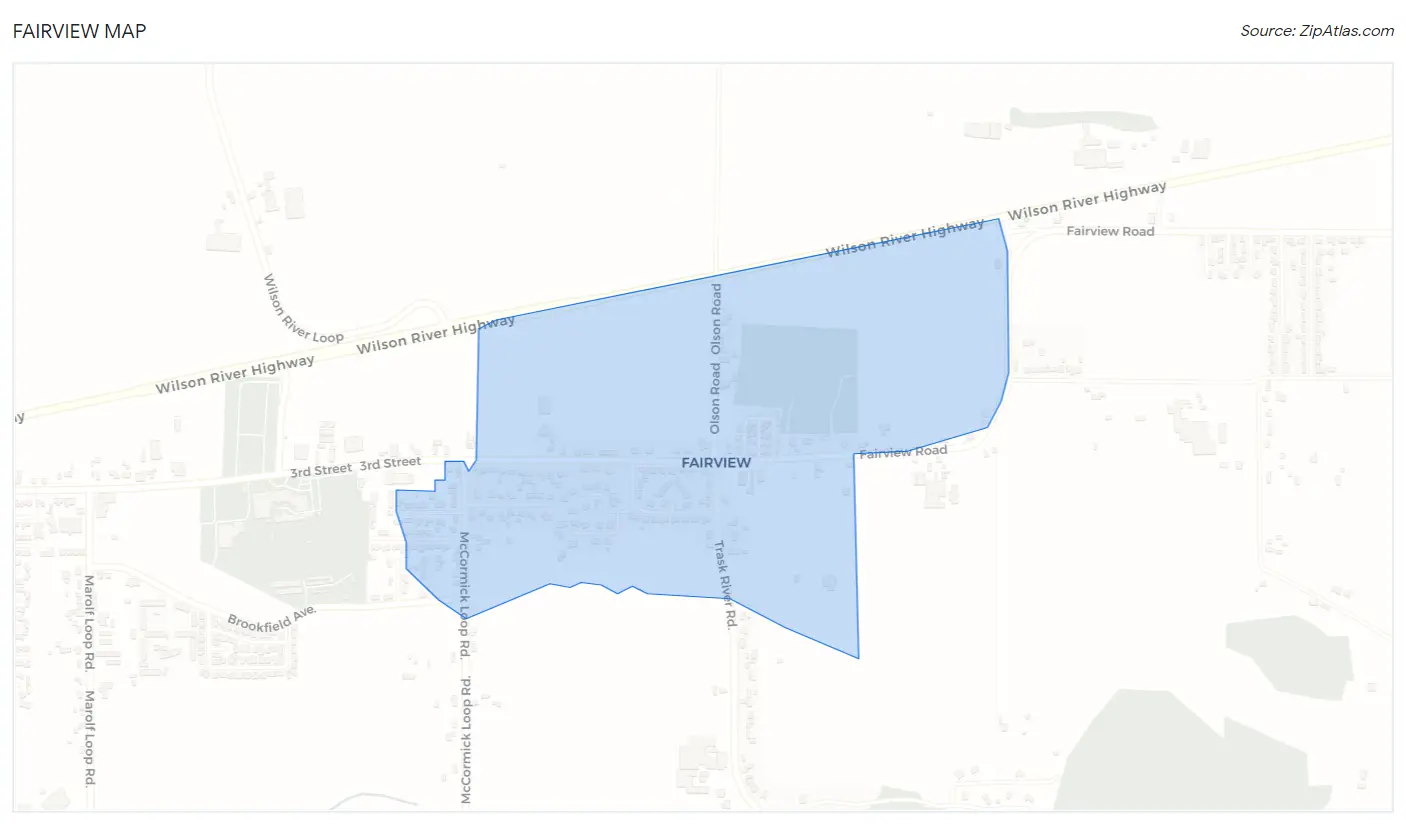
Fairview Map
Fairview Overview
$20,012
PER CAPITA INCOME
$49,259
AVG FAMILY INCOME
$43,036
AVG HOUSEHOLD INCOME
20.6%
WAGE / INCOME GAP [ % ]
79.4¢/ $1
WAGE / INCOME GAP [ $ ]
0.24
INEQUALITY / GINI INDEX
495
TOTAL POPULATION
155
MALE POPULATION
340
FEMALE POPULATION
45.59
MALES / 100 FEMALES
219.35
FEMALES / 100 MALES
34.9
MEDIAN AGE
3.2
AVG FAMILY SIZE
2.3
AVG HOUSEHOLD SIZE
248
LABOR FORCE [ PEOPLE ]
59.6%
PERCENT IN LABOR FORCE
11.7%
UNEMPLOYMENT RATE
Fairview Zip Codes
Fairview Area Codes
Income in Fairview
Income Overview in Fairview
Per Capita Income in Fairview is $20,012, while median incomes of families and households are $49,259 and $43,036 respectively.
| Characteristic | Number | Measure |
| Per Capita Income | 495 | $20,012 |
| Median Family Income | 108 | $49,259 |
| Mean Family Income | 108 | $51,933 |
| Median Household Income | 214 | $43,036 |
| Mean Household Income | 214 | $42,079 |
| Income Deficit | 108 | $0 |
| Wage / Income Gap (%) | 495 | 20.55% |
| Wage / Income Gap ($) | 495 | 79.45¢ per $1 |
| Gini / Inequality Index | 495 | 0.24 |
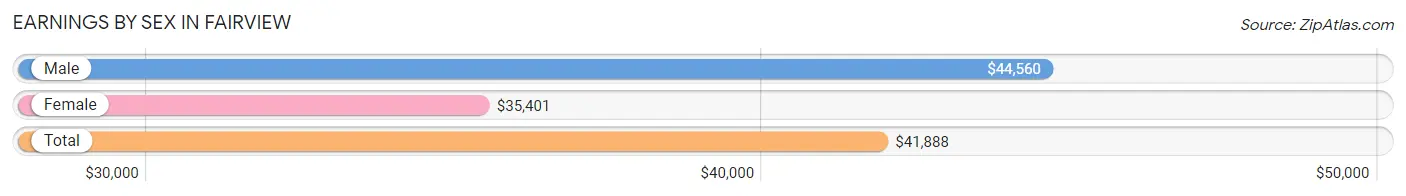
Earnings by Sex in Fairview
Average Earnings in Fairview are $41,888, $44,560 for men and $35,401 for women, a difference of 20.5%.
| Sex | Number | Average Earnings |
| Male | 76 (30.3%) | $44,560 |
| Female | 175 (69.7%) | $35,401 |
| Total | 251 (100.0%) | $41,888 |
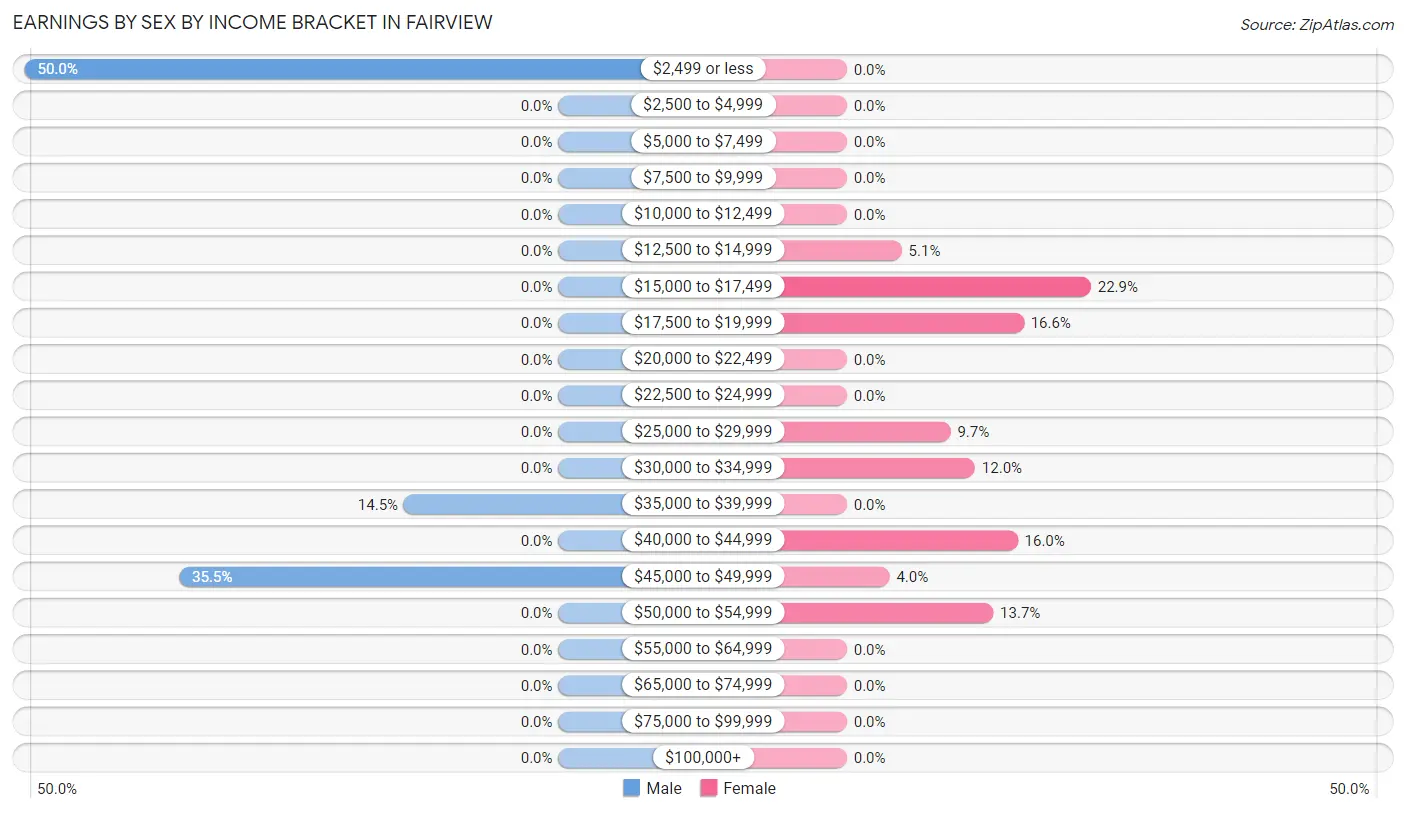
Earnings by Sex by Income Bracket in Fairview
The most common earnings brackets in Fairview are $2,499 or less for men (38 | 50.0%) and $15,000 to $17,499 for women (40 | 22.9%).
| Income | Male | Female |
| $2,499 or less | 38 (50.0%) | 0 (0.0%) |
| $2,500 to $4,999 | 0 (0.0%) | 0 (0.0%) |
| $5,000 to $7,499 | 0 (0.0%) | 0 (0.0%) |
| $7,500 to $9,999 | 0 (0.0%) | 0 (0.0%) |
| $10,000 to $12,499 | 0 (0.0%) | 0 (0.0%) |
| $12,500 to $14,999 | 0 (0.0%) | 9 (5.1%) |
| $15,000 to $17,499 | 0 (0.0%) | 40 (22.9%) |
| $17,500 to $19,999 | 0 (0.0%) | 29 (16.6%) |
| $20,000 to $22,499 | 0 (0.0%) | 0 (0.0%) |
| $22,500 to $24,999 | 0 (0.0%) | 0 (0.0%) |
| $25,000 to $29,999 | 0 (0.0%) | 17 (9.7%) |
| $30,000 to $34,999 | 0 (0.0%) | 21 (12.0%) |
| $35,000 to $39,999 | 11 (14.5%) | 0 (0.0%) |
| $40,000 to $44,999 | 0 (0.0%) | 28 (16.0%) |
| $45,000 to $49,999 | 27 (35.5%) | 7 (4.0%) |
| $50,000 to $54,999 | 0 (0.0%) | 24 (13.7%) |
| $55,000 to $64,999 | 0 (0.0%) | 0 (0.0%) |
| $65,000 to $74,999 | 0 (0.0%) | 0 (0.0%) |
| $75,000 to $99,999 | 0 (0.0%) | 0 (0.0%) |
| $100,000+ | 0 (0.0%) | 0 (0.0%) |
| Total | 76 (100.0%) | 175 (100.0%) |
Earnings by Sex by Educational Attainment in Fairview
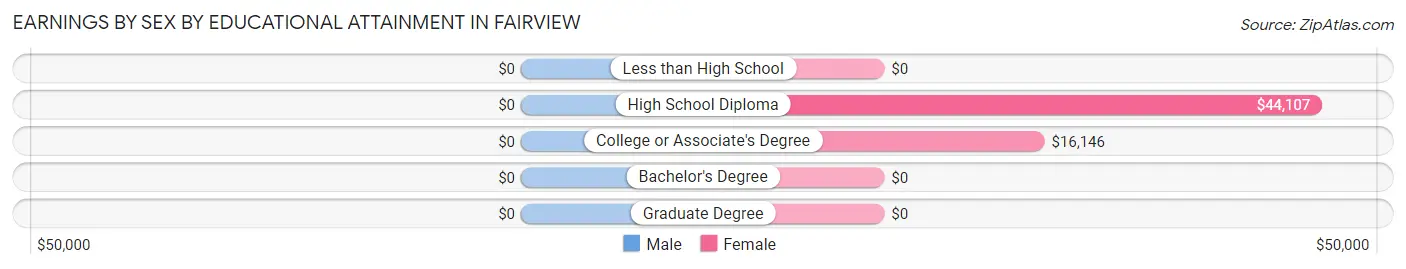
| Educational Attainment | Male Income | Female Income |
| Less than High School | - | - |
| High School Diploma | - | - |
| College or Associate's Degree | - | - |
| Bachelor's Degree | - | - |
| Graduate Degree | - | - |
| Total | $46,667 | $31,845 |
Family Income in Fairview
Family Income Brackets in Fairview
According to the Fairview family income data, there are 46 families falling into the $35,000 to $49,999 income range, which is the most common income bracket and makes up 42.6% of all families.
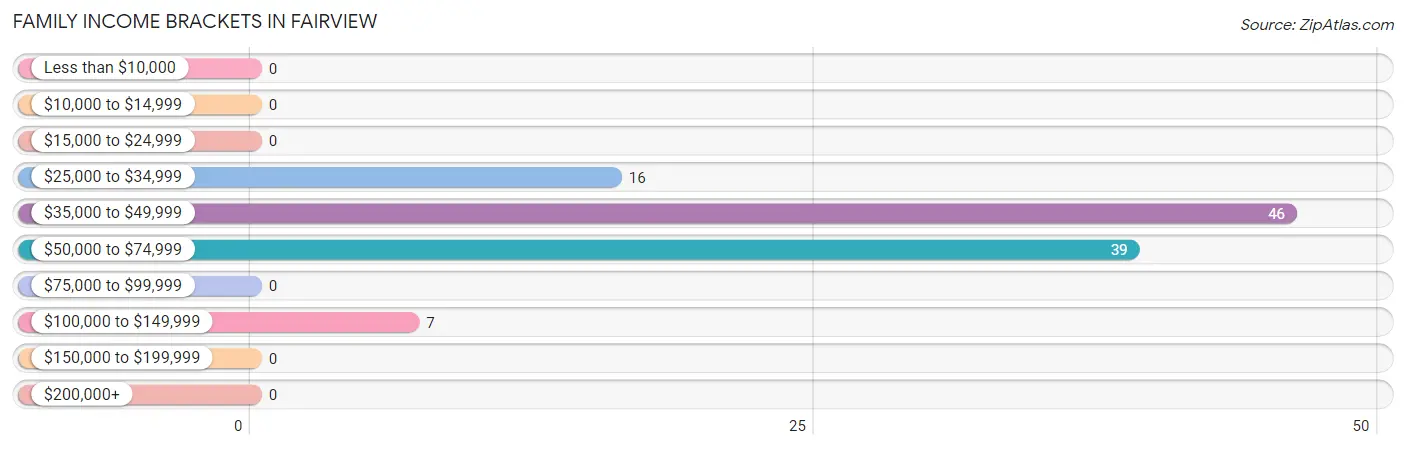
| Income Bracket | # Families | % Families |
| Less than $10,000 | 0 | 0.0% |
| $10,000 to $14,999 | 0 | 0.0% |
| $15,000 to $24,999 | 0 | 0.0% |
| $25,000 to $34,999 | 16 | 14.8% |
| $35,000 to $49,999 | 46 | 42.6% |
| $50,000 to $74,999 | 39 | 36.1% |
| $75,000 to $99,999 | 0 | 0.0% |
| $100,000 to $149,999 | 7 | 6.5% |
| $150,000 to $199,999 | 0 | 0.0% |
| $200,000+ | 0 | 0.0% |
Family Income by Famaliy Size in Fairview
2-person families (55 | 50.9%) account for the highest median family income in Fairview with $53,698 per family, while 2-person families (55 | 50.9%) have the highest median income of $26,849 per family member.
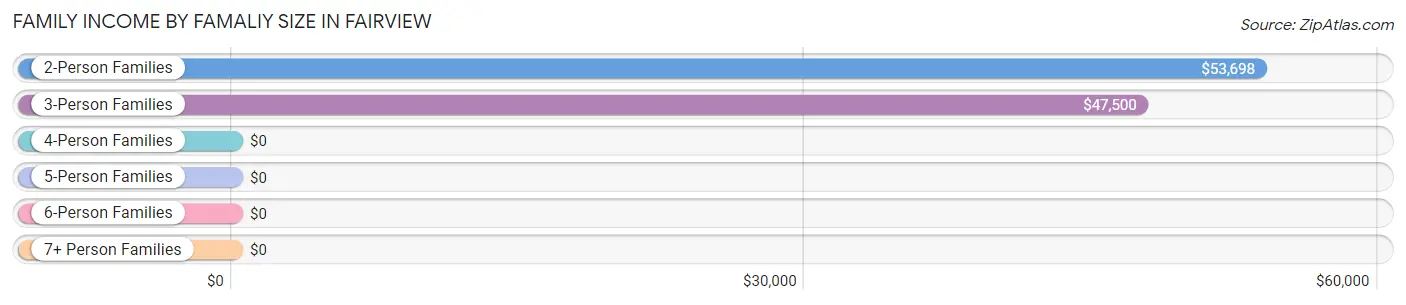
| Income Bracket | # Families | Median Income |
| 2-Person Families | 55 (50.9%) | $53,698 |
| 3-Person Families | 38 (35.2%) | $47,500 |
| 4-Person Families | 15 (13.9%) | $0 |
| 5-Person Families | 0 (0.0%) | $0 |
| 6-Person Families | 0 (0.0%) | $0 |
| 7+ Person Families | 0 (0.0%) | $0 |
| Total | 108 (100.0%) | $49,259 |
Family Income by Number of Earners in Fairview
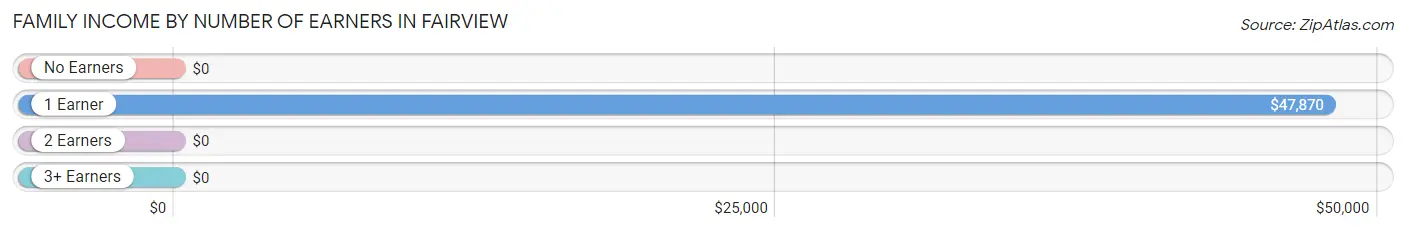
| Number of Earners | # Families | Median Income |
| No Earners | 31 (28.7%) | $0 |
| 1 Earner | 46 (42.6%) | $47,870 |
| 2 Earners | 24 (22.2%) | $0 |
| 3+ Earners | 7 (6.5%) | $0 |
| Total | 108 (100.0%) | $49,259 |
Household Income in Fairview
Household Income Brackets in Fairview
With 62 households falling in the category, the $35,000 to $49,999 income range is the most frequent in Fairview, accounting for 29.0% of all households.
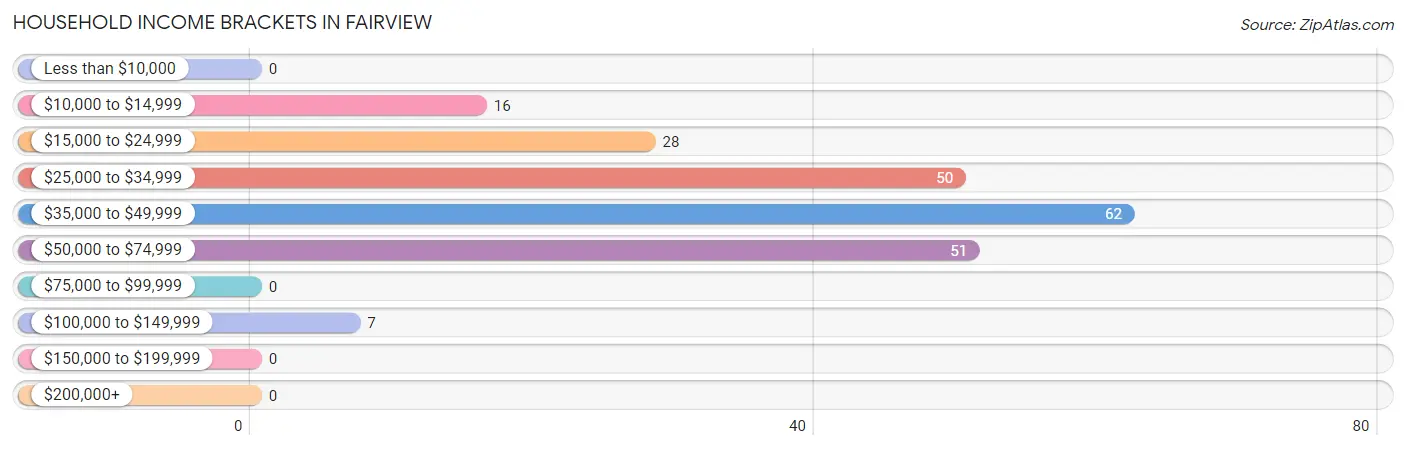
| Income Bracket | # Households | % Households |
| Less than $10,000 | 0 | 0.0% |
| $10,000 to $14,999 | 16 | 7.5% |
| $15,000 to $24,999 | 28 | 13.1% |
| $25,000 to $34,999 | 50 | 23.4% |
| $35,000 to $49,999 | 62 | 29.0% |
| $50,000 to $74,999 | 51 | 23.8% |
| $75,000 to $99,999 | 0 | 0.0% |
| $100,000 to $149,999 | 7 | 3.3% |
| $150,000 to $199,999 | 0 | 0.0% |
| $200,000+ | 0 | 0.0% |
Household Income by Householder Age in Fairview
The median household income in Fairview is $43,036, with the highest median household income of $43,884 found in the 25 to 44 years age bracket for the primary householder. A total of 79 households (36.9%) fall into this category.
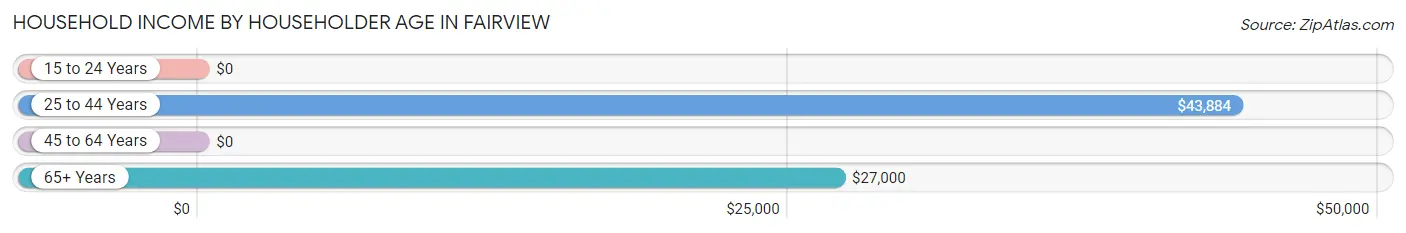
| Income Bracket | # Households | Median Income |
| 15 to 24 Years | 0 (0.0%) | $0 |
| 25 to 44 Years | 79 (36.9%) | $43,884 |
| 45 to 64 Years | 31 (14.5%) | $0 |
| 65+ Years | 104 (48.6%) | $27,000 |
| Total | 214 (100.0%) | $43,036 |
Poverty in Fairview
Income Below Poverty by Sex and Age in Fairview
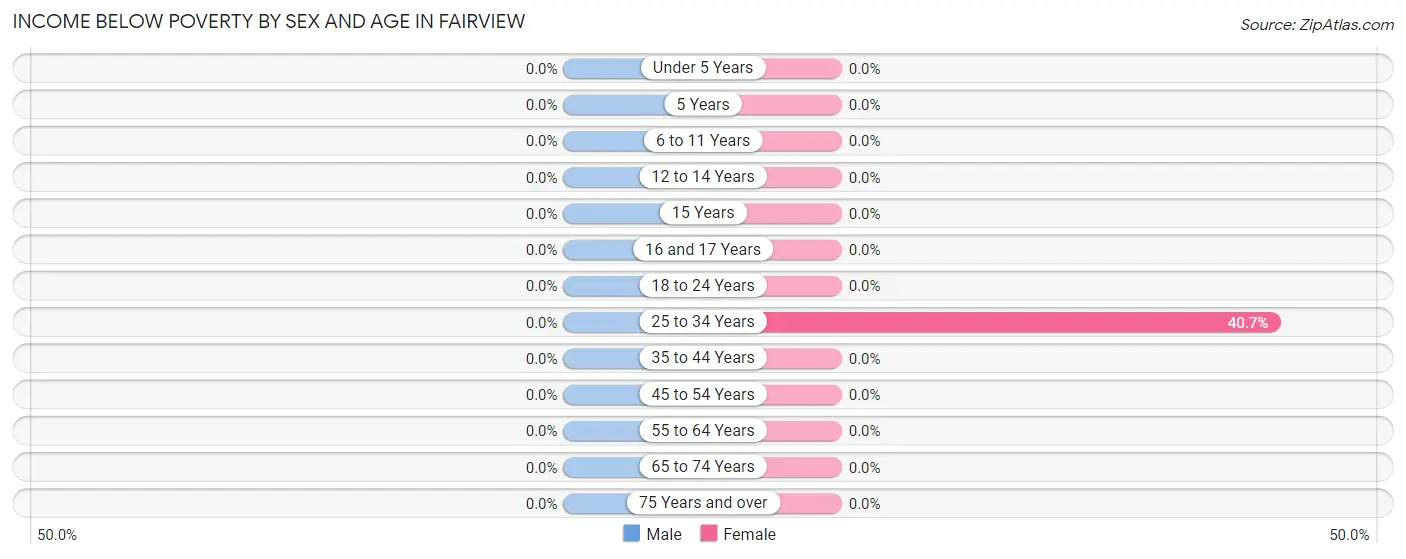
| Age Bracket | Male | Female |
| Under 5 Years | 0 (0.0%) | 0 (0.0%) |
| 5 Years | 0 (0.0%) | 0 (0.0%) |
| 6 to 11 Years | 0 (0.0%) | 0 (0.0%) |
| 12 to 14 Years | 0 (0.0%) | 0 (0.0%) |
| 15 Years | 0 (0.0%) | 0 (0.0%) |
| 16 and 17 Years | 0 (0.0%) | 0 (0.0%) |
| 18 to 24 Years | 0 (0.0%) | 0 (0.0%) |
| 25 to 34 Years | 0 (0.0%) | 24 (40.7%) |
| 35 to 44 Years | 0 (0.0%) | 0 (0.0%) |
| 45 to 54 Years | 0 (0.0%) | 0 (0.0%) |
| 55 to 64 Years | 0 (0.0%) | 0 (0.0%) |
| 65 to 74 Years | 0 (0.0%) | 0 (0.0%) |
| 75 Years and over | 0 (0.0%) | 0 (0.0%) |
| Total | 0 (0.0%) | 24 (7.1%) |
Income Above Poverty by Sex and Age in Fairview
According to the poverty statistics in Fairview, males aged under 5 years and females aged under 5 years are the age groups that are most secure financially, with 100.0% of males and 100.0% of females in these age groups living above the poverty line.
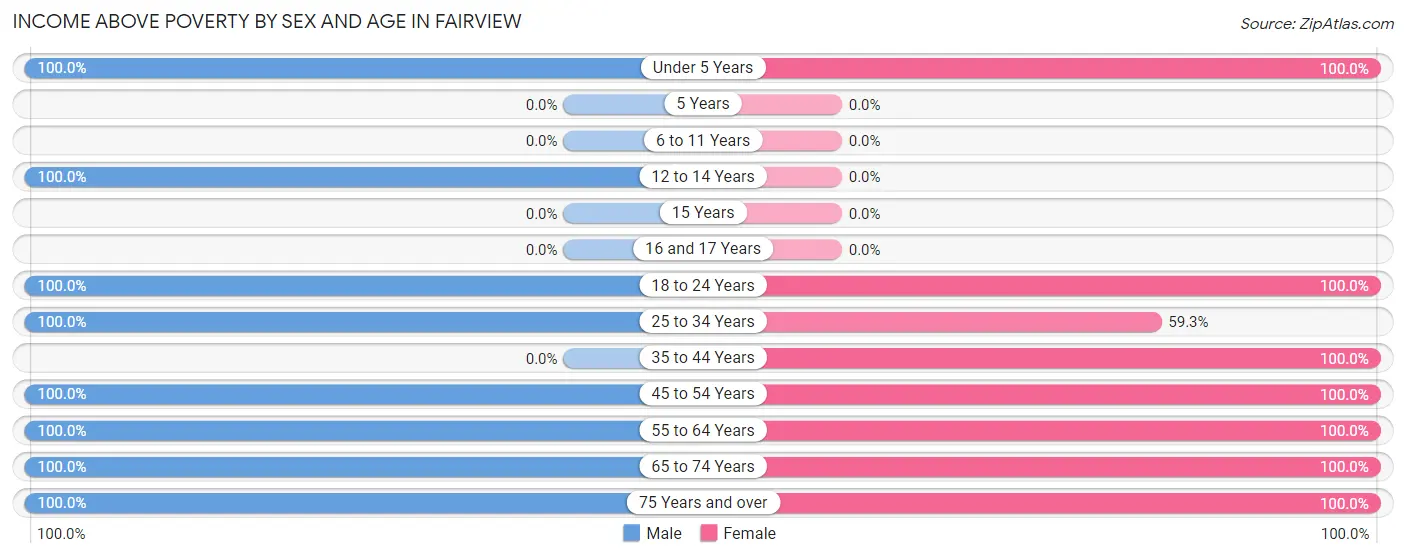
| Age Bracket | Male | Female |
| Under 5 Years | 7 (100.0%) | 63 (100.0%) |
| 5 Years | 0 (0.0%) | 0 (0.0%) |
| 6 to 11 Years | 0 (0.0%) | 0 (0.0%) |
| 12 to 14 Years | 9 (100.0%) | 0 (0.0%) |
| 15 Years | 0 (0.0%) | 0 (0.0%) |
| 16 and 17 Years | 0 (0.0%) | 0 (0.0%) |
| 18 to 24 Years | 38 (100.0%) | 46 (100.0%) |
| 25 to 34 Years | 27 (100.0%) | 35 (59.3%) |
| 35 to 44 Years | 0 (0.0%) | 28 (100.0%) |
| 45 to 54 Years | 11 (100.0%) | 45 (100.0%) |
| 55 to 64 Years | 20 (100.0%) | 16 (100.0%) |
| 65 to 74 Years | 12 (100.0%) | 38 (100.0%) |
| 75 Years and over | 31 (100.0%) | 45 (100.0%) |
| Total | 155 (100.0%) | 316 (92.9%) |
Income Below Poverty Among Married-Couple Families in Fairview
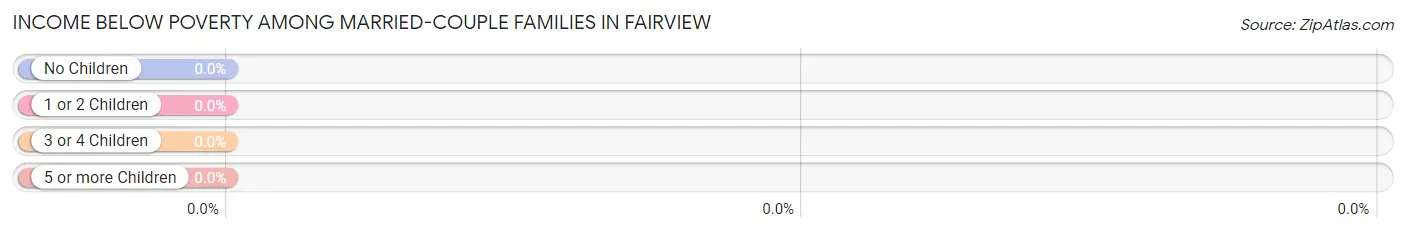
| Children | Above Poverty | Below Poverty |
| No Children | 50 (100.0%) | 0 (0.0%) |
| 1 or 2 Children | 15 (100.0%) | 0 (0.0%) |
| 3 or 4 Children | 0 (0.0%) | 0 (0.0%) |
| 5 or more Children | 0 (0.0%) | 0 (0.0%) |
| Total | 65 (100.0%) | 0 (0.0%) |
Income Below Poverty Among Single-Parent Households in Fairview
| Children | Single Father | Single Mother |
| No Children | 0 (0.0%) | 0 (0.0%) |
| 1 or 2 Children | 0 (0.0%) | 0 (0.0%) |
| 3 or 4 Children | 0 (0.0%) | 0 (0.0%) |
| 5 or more Children | 0 (0.0%) | 0 (0.0%) |
| Total | 0 (0.0%) | 0 (0.0%) |
Income Below Poverty Among Married-Couple vs Single-Parent Households in Fairview
| Children | Married-Couple Families | Single-Parent Households |
| No Children | 0 (0.0%) | 0 (0.0%) |
| 1 or 2 Children | 0 (0.0%) | 0 (0.0%) |
| 3 or 4 Children | 0 (0.0%) | 0 (0.0%) |
| 5 or more Children | 0 (0.0%) | 0 (0.0%) |
| Total | 0 (0.0%) | 0 (0.0%) |
Race in Fairview
The most populous races in Fairview are White / Caucasian (410 | 82.8%), Hispanic or Latino (111 | 22.4%), and Two or more Races (78 | 15.8%).
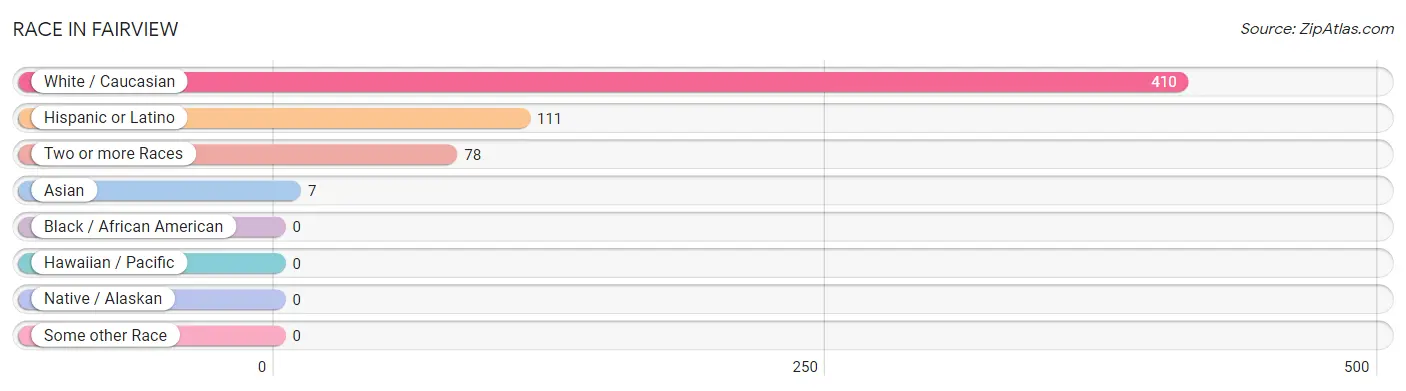
| Race | # Population | % Population |
| Asian | 7 | 1.4% |
| Black / African American | 0 | 0.0% |
| Hawaiian / Pacific | 0 | 0.0% |
| Hispanic or Latino | 111 | 22.4% |
| Native / Alaskan | 0 | 0.0% |
| White / Caucasian | 410 | 82.8% |
| Two or more Races | 78 | 15.8% |
| Some other Race | 0 | 0.0% |
| Total | 495 | 100.0% |
Ancestry in Fairview
The most populous ancestries reported in Fairview are English (123 | 24.8%), Mexican (111 | 22.4%), Irish (86 | 17.4%), Scandinavian (82 | 16.6%), and German (64 | 12.9%), together accounting for 94.1% of all Fairview residents.
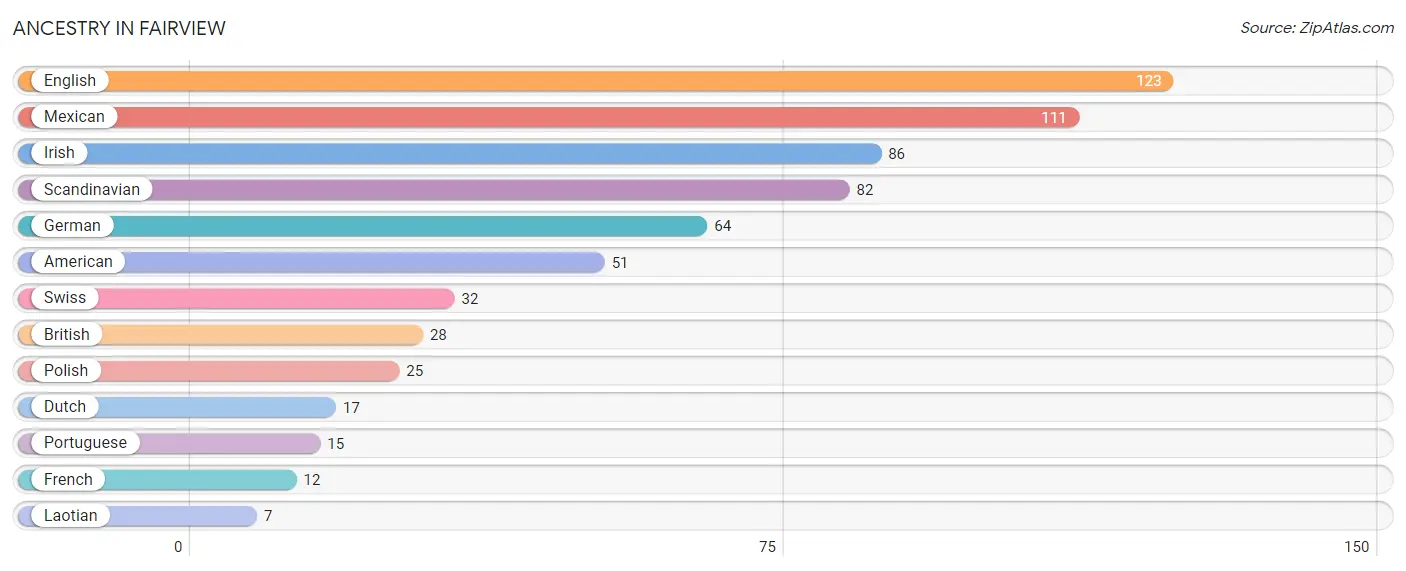
| Ancestry | # Population | % Population |
| American | 51 | 10.3% |
| British | 28 | 5.7% |
| Dutch | 17 | 3.4% |
| English | 123 | 24.8% |
| French | 12 | 2.4% |
| German | 64 | 12.9% |
| Irish | 86 | 17.4% |
| Laotian | 7 | 1.4% |
| Mexican | 111 | 22.4% |
| Polish | 25 | 5.1% |
| Portuguese | 15 | 3.0% |
| Scandinavian | 82 | 16.6% |
| Swiss | 32 | 6.5% | View All 13 Rows |
Immigrants in Fairview
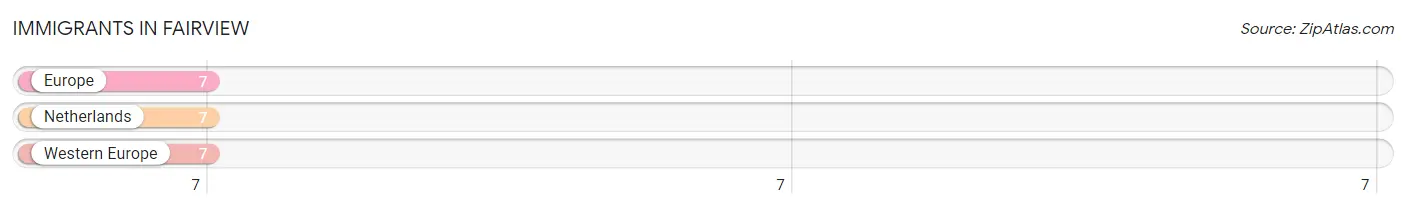
The most numerous immigrant groups reported in Fairview came from Europe (7 | 1.4%), Netherlands (7 | 1.4%), and Western Europe (7 | 1.4%), together accounting for 4.2% of all Fairview residents.
| Immigration Origin | # Population | % Population |
| Europe | 7 | 1.4% |
| Netherlands | 7 | 1.4% |
| Western Europe | 7 | 1.4% | View All 3 Rows |
Sex and Age in Fairview
Sex and Age in Fairview
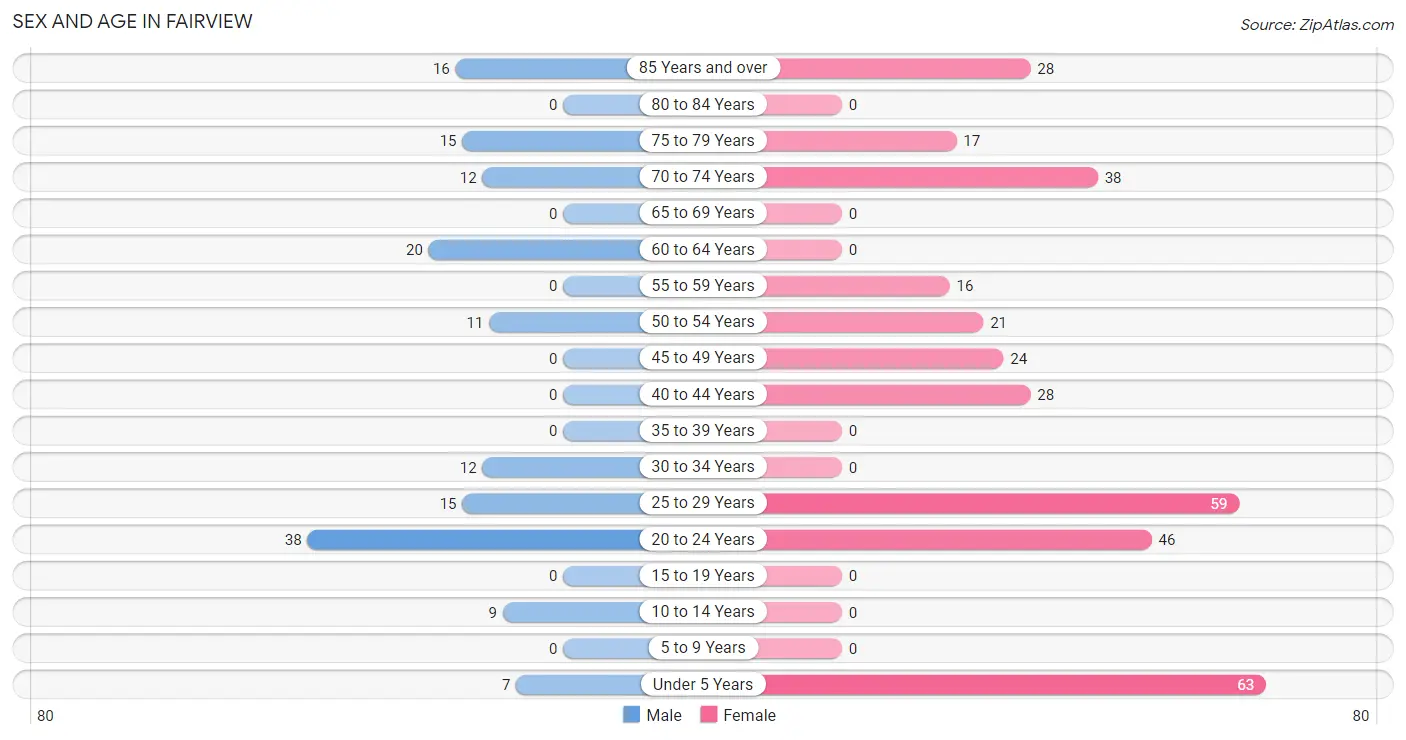
The most populous age groups in Fairview are 20 to 24 Years (38 | 24.5%) for men and Under 5 Years (63 | 18.5%) for women.
| Age Bracket | Male | Female |
| Under 5 Years | 7 (4.5%) | 63 (18.5%) |
| 5 to 9 Years | 0 (0.0%) | 0 (0.0%) |
| 10 to 14 Years | 9 (5.8%) | 0 (0.0%) |
| 15 to 19 Years | 0 (0.0%) | 0 (0.0%) |
| 20 to 24 Years | 38 (24.5%) | 46 (13.5%) |
| 25 to 29 Years | 15 (9.7%) | 59 (17.3%) |
| 30 to 34 Years | 12 (7.7%) | 0 (0.0%) |
| 35 to 39 Years | 0 (0.0%) | 0 (0.0%) |
| 40 to 44 Years | 0 (0.0%) | 28 (8.2%) |
| 45 to 49 Years | 0 (0.0%) | 24 (7.1%) |
| 50 to 54 Years | 11 (7.1%) | 21 (6.2%) |
| 55 to 59 Years | 0 (0.0%) | 16 (4.7%) |
| 60 to 64 Years | 20 (12.9%) | 0 (0.0%) |
| 65 to 69 Years | 0 (0.0%) | 0 (0.0%) |
| 70 to 74 Years | 12 (7.7%) | 38 (11.2%) |
| 75 to 79 Years | 15 (9.7%) | 17 (5.0%) |
| 80 to 84 Years | 0 (0.0%) | 0 (0.0%) |
| 85 Years and over | 16 (10.3%) | 28 (8.2%) |
| Total | 155 (100.0%) | 340 (100.0%) |
Families and Households in Fairview
Median Family Size in Fairview
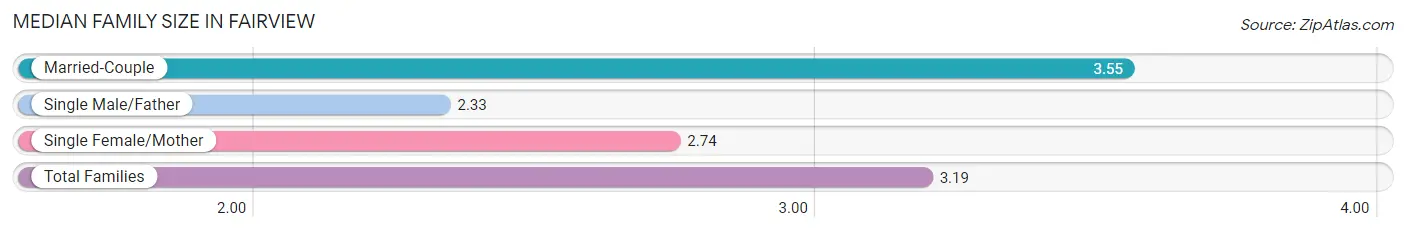
The median family size in Fairview is 3.19 persons per family, with married-couple families (65 | 60.2%) accounting for the largest median family size of 3.55 persons per family. On the other hand, single male/father families (12 | 11.1%) represent the smallest median family size with 2.33 persons per family.
| Family Type | # Families | Family Size |
| Married-Couple | 65 (60.2%) | 3.55 |
| Single Male/Father | 12 (11.1%) | 2.33 |
| Single Female/Mother | 31 (28.7%) | 2.74 |
| Total Families | 108 (100.0%) | 3.19 |
Median Household Size in Fairview
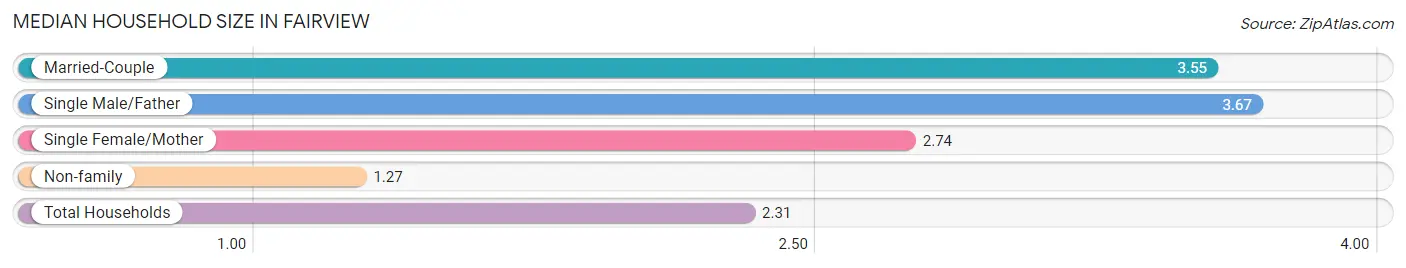
The median household size in Fairview is 2.31 persons per household, with single male/father households (12 | 5.6%) accounting for the largest median household size of 3.67 persons per household. non-family households (106 | 49.5%) represent the smallest median household size with 1.27 persons per household.
| Household Type | # Households | Household Size |
| Married-Couple | 65 (30.4%) | 3.55 |
| Single Male/Father | 12 (5.6%) | 3.67 |
| Single Female/Mother | 31 (14.5%) | 2.74 |
| Non-family | 106 (49.5%) | 1.27 |
| Total Households | 214 (100.0%) | 2.31 |
Household Size by Marriage Status in Fairview
Out of a total of 214 households in Fairview, 108 (50.5%) are family households, while 106 (49.5%) are nonfamily households. The most numerous type of family households are 2-person households, comprising 55, and the most common type of nonfamily households are 1-person households, comprising 82.
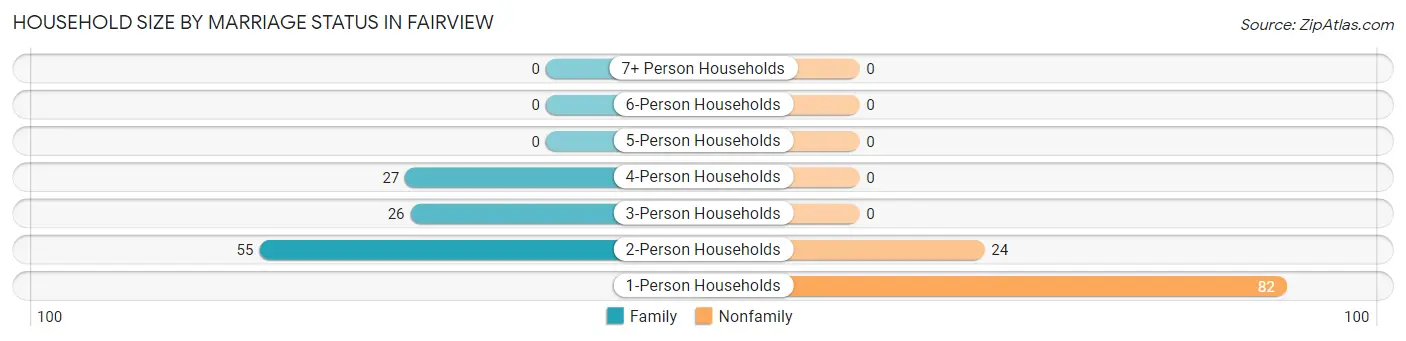
| Household Size | Family Households | Nonfamily Households |
| 1-Person Households | - | 82 (38.3%) |
| 2-Person Households | 55 (25.7%) | 24 (11.2%) |
| 3-Person Households | 26 (12.1%) | 0 (0.0%) |
| 4-Person Households | 27 (12.6%) | 0 (0.0%) |
| 5-Person Households | 0 (0.0%) | 0 (0.0%) |
| 6-Person Households | 0 (0.0%) | 0 (0.0%) |
| 7+ Person Households | 0 (0.0%) | 0 (0.0%) |
| Total | 108 (50.5%) | 106 (49.5%) |
Female Fertility in Fairview
Fertility by Age in Fairview
| Age Bracket | Women with Births | Births / 1,000 Women |
| 15 to 19 years | 0 (0.0%) | 0.0 |
| 20 to 34 years | 0 (0.0%) | 0.0 |
| 35 to 50 years | 0 (0.0%) | 0.0 |
| Total | 0 (0.0%) | 0.0 |
Fertility by Age by Marriage Status in Fairview
| Age Bracket | Married | Unmarried |
| 15 to 19 years | 0 (0.0%) | 0 (0.0%) |
| 20 to 34 years | 0 (0.0%) | 0 (0.0%) |
| 35 to 50 years | 0 (0.0%) | 0 (0.0%) |
| Total | 0 (0.0%) | 0 (0.0%) |
Fertility by Education in Fairview
| Educational Attainment | Women with Births | Births / 1,000 Women |
| Less than High School | 0 (0.0%) | 0.0 |
| High School Diploma | 0 (0.0%) | 0.0 |
| College or Associate's Degree | 0 (0.0%) | 0.0 |
| Bachelor's Degree | 0 (0.0%) | 0.0 |
| Graduate Degree | 0 (0.0%) | 0.0 |
| Total | 0 (0.0%) | 0.0 |
Fertility by Education by Marriage Status in Fairview
| Educational Attainment | Married | Unmarried |
| Less than High School | 0 (0.0%) | 0 (0.0%) |
| High School Diploma | 0 (0.0%) | 0 (0.0%) |
| College or Associate's Degree | 0 (0.0%) | 0 (0.0%) |
| Bachelor's Degree | 0 (0.0%) | 0 (0.0%) |
| Graduate Degree | 0 (0.0%) | 0 (0.0%) |
| Total | 0 (0.0%) | 0 (0.0%) |
Employment Characteristics in Fairview
Employment by Class of Employer in Fairview
Among the 219 employed individuals in Fairview, private company employees (134 | 61.2%), local government employees (33 | 15.1%), and self-employed (incorporated) (28 | 12.8%) make up the most common classes of employment.
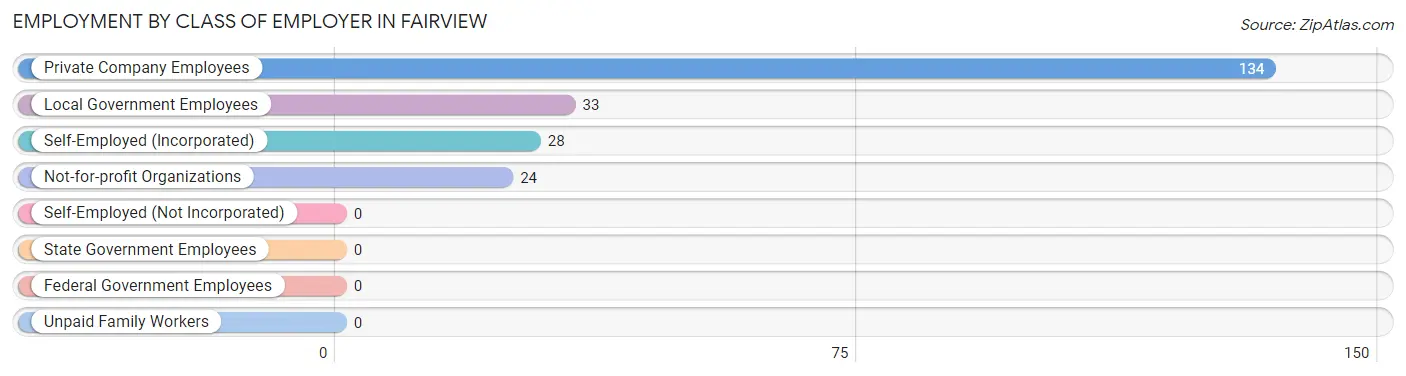
| Employer Class | # Employees | % Employees |
| Private Company Employees | 134 | 61.2% |
| Self-Employed (Incorporated) | 28 | 12.8% |
| Self-Employed (Not Incorporated) | 0 | 0.0% |
| Not-for-profit Organizations | 24 | 11.0% |
| Local Government Employees | 33 | 15.1% |
| State Government Employees | 0 | 0.0% |
| Federal Government Employees | 0 | 0.0% |
| Unpaid Family Workers | 0 | 0.0% |
| Total | 219 | 100.0% |
Employment Status by Age in Fairview
According to the labor force statistics for Fairview, out of the total population over 16 years of age (416), 59.6% or 248 individuals are in the labor force, with 11.7% or 29 of them unemployed. The age group with the highest labor force participation rate is 20 to 24 years, with 100.0% or 84 individuals in the labor force. Within the labor force, the 65 to 74 years age range has the highest percentage of unemployed individuals, with 100.0% or 8 of them being unemployed.
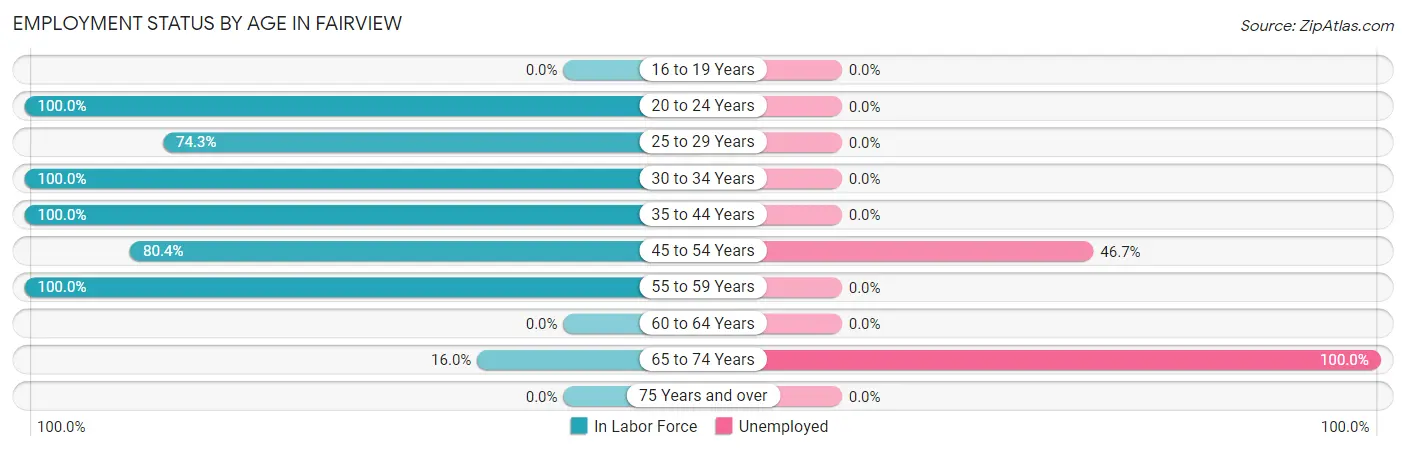
| Age Bracket | In Labor Force | Unemployed |
| 16 to 19 Years | 0 (0.0%) | 0 (0.0%) |
| 20 to 24 Years | 84 (100.0%) | 0 (0.0%) |
| 25 to 29 Years | 55 (74.3%) | 0 (0.0%) |
| 30 to 34 Years | 12 (100.0%) | 0 (0.0%) |
| 35 to 44 Years | 28 (100.0%) | 0 (0.0%) |
| 45 to 54 Years | 45 (80.4%) | 21 (46.7%) |
| 55 to 59 Years | 16 (100.0%) | 0 (0.0%) |
| 60 to 64 Years | 0 (0.0%) | 0 (0.0%) |
| 65 to 74 Years | 8 (16.0%) | 8 (100.0%) |
| 75 Years and over | 0 (0.0%) | 0 (0.0%) |
| Total | 248 (59.6%) | 29 (11.7%) |
Employment Status by Educational Attainment in Fairview
According to labor force statistics for Fairview, 75.7% of individuals (156) out of the total population between 25 and 64 years of age (206) are in the labor force, with 13.5% or 21 of them being unemployed. The group with the highest labor force participation rate are those with the educational attainment of less than high school, with 100.0% or 12 individuals in the labor force. Within the labor force, individuals with bachelor's degree or higher education have the highest percentage of unemployment, with 58.3% or 21 of them being unemployed.
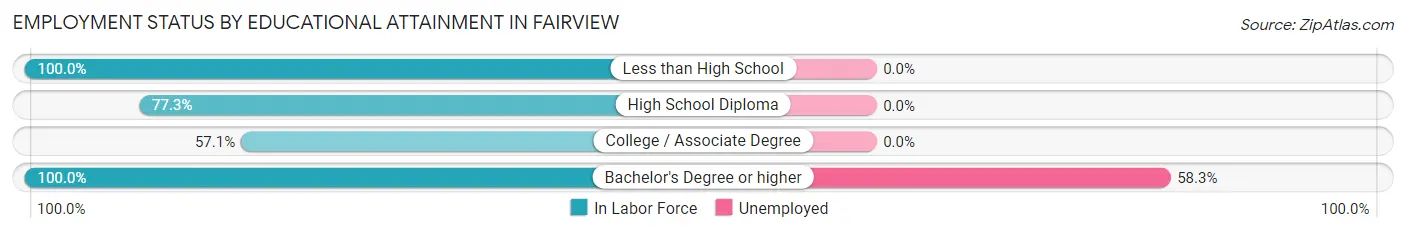
| Educational Attainment | In Labor Force | Unemployed |
| Less than High School | 12 (100.0%) | 0 (0.0%) |
| High School Diploma | 68 (77.3%) | 0 (0.0%) |
| College / Associate Degree | 40 (57.1%) | 0 (0.0%) |
| Bachelor's Degree or higher | 36 (100.0%) | 21 (58.3%) |
| Total | 156 (75.7%) | 28 (13.5%) |
Employment Occupations by Sex in Fairview
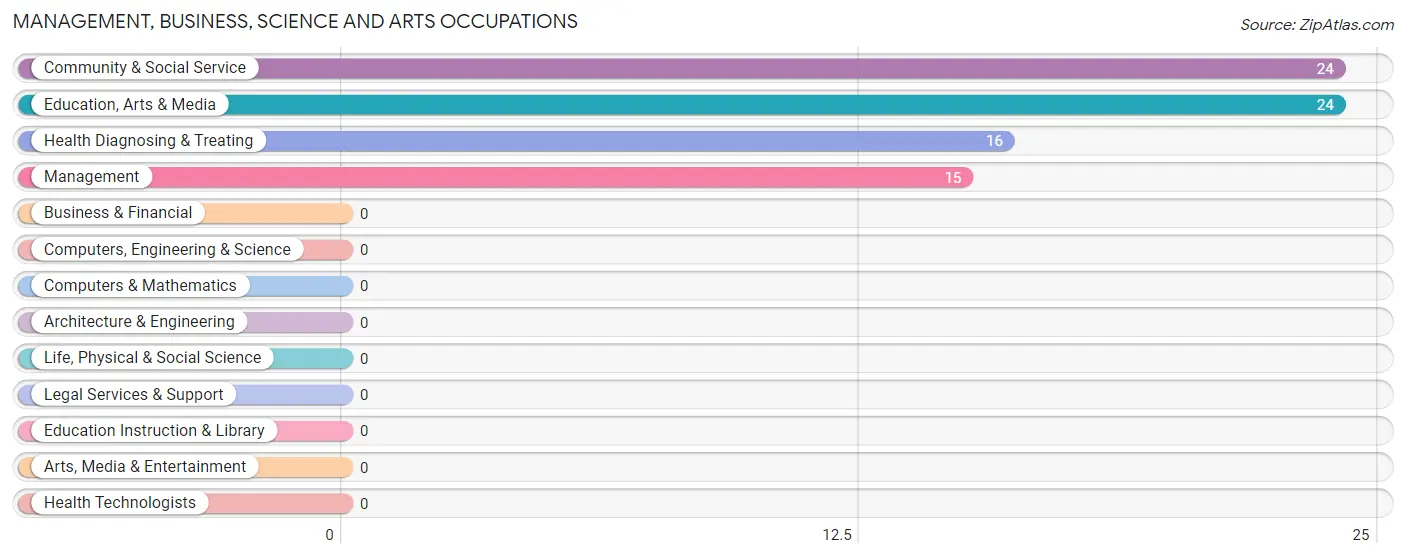
Management, Business, Science and Arts Occupations
The most common Management, Business, Science and Arts occupations in Fairview are Community & Social Service (24 | 11.0%), Education, Arts & Media (24 | 11.0%), Health Diagnosing & Treating (16 | 7.3%), and Management (15 | 6.9%).
Management, Business, Science and Arts Occupations by Sex
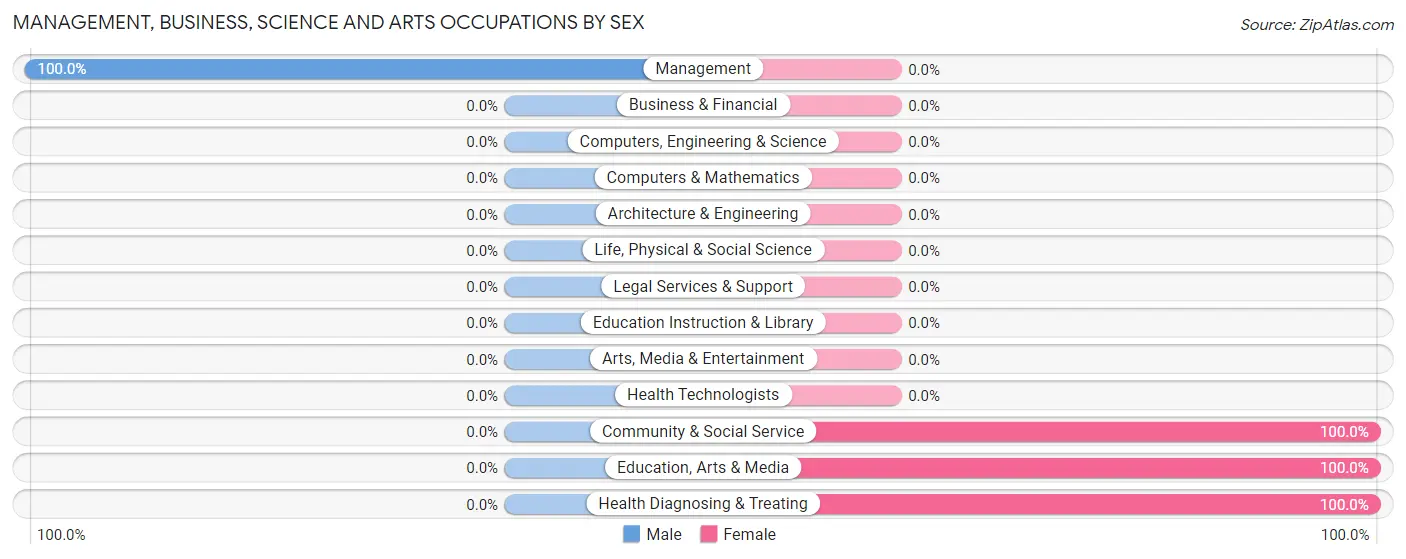
| Occupation | Male | Female |
| Management | 15 (100.0%) | 0 (0.0%) |
| Business & Financial | 0 (0.0%) | 0 (0.0%) |
| Computers, Engineering & Science | 0 (0.0%) | 0 (0.0%) |
| Computers & Mathematics | 0 (0.0%) | 0 (0.0%) |
| Architecture & Engineering | 0 (0.0%) | 0 (0.0%) |
| Life, Physical & Social Science | 0 (0.0%) | 0 (0.0%) |
| Community & Social Service | 0 (0.0%) | 24 (100.0%) |
| Education, Arts & Media | 0 (0.0%) | 24 (100.0%) |
| Legal Services & Support | 0 (0.0%) | 0 (0.0%) |
| Education Instruction & Library | 0 (0.0%) | 0 (0.0%) |
| Arts, Media & Entertainment | 0 (0.0%) | 0 (0.0%) |
| Health Diagnosing & Treating | 0 (0.0%) | 16 (100.0%) |
| Health Technologists | 0 (0.0%) | 0 (0.0%) |
| Total (Category) | 15 (27.3%) | 40 (72.7%) |
| Total (Overall) | 65 (29.7%) | 154 (70.3%) |
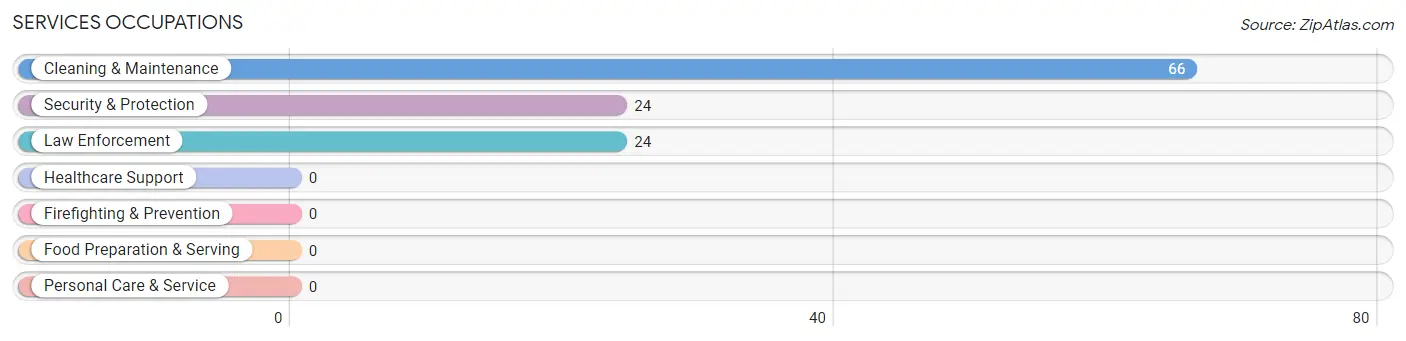
Services Occupations
The most common Services occupations in Fairview are Cleaning & Maintenance (66 | 30.1%), Security & Protection (24 | 11.0%), and Law Enforcement (24 | 11.0%).
Services Occupations by Sex
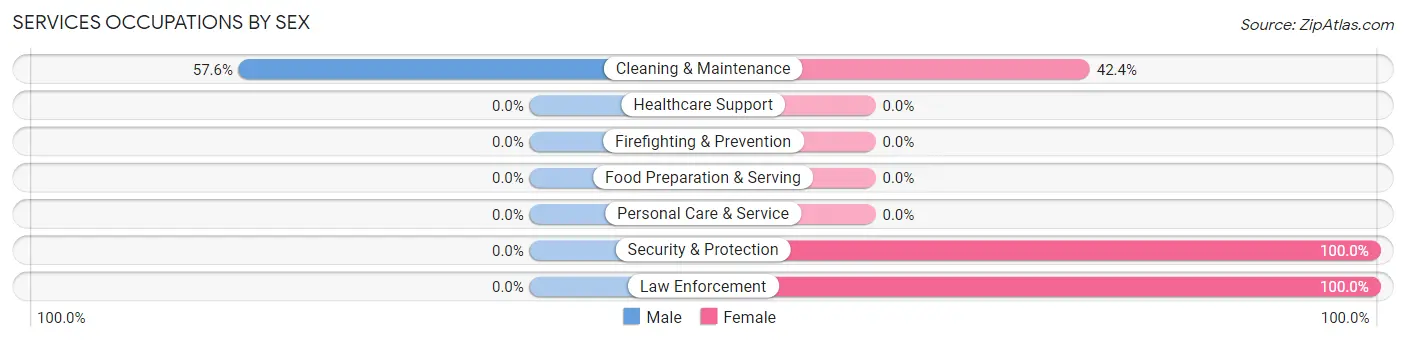
| Occupation | Male | Female |
| Healthcare Support | 0 (0.0%) | 0 (0.0%) |
| Security & Protection | 0 (0.0%) | 24 (100.0%) |
| Firefighting & Prevention | 0 (0.0%) | 0 (0.0%) |
| Law Enforcement | 0 (0.0%) | 24 (100.0%) |
| Food Preparation & Serving | 0 (0.0%) | 0 (0.0%) |
| Cleaning & Maintenance | 38 (57.6%) | 28 (42.4%) |
| Personal Care & Service | 0 (0.0%) | 0 (0.0%) |
| Total (Category) | 38 (42.2%) | 52 (57.8%) |
| Total (Overall) | 65 (29.7%) | 154 (70.3%) |
Sales and Office Occupations
The most common Sales and Office occupations in Fairview are Sales & Related (29 | 13.2%), and Office & Administration (24 | 11.0%).
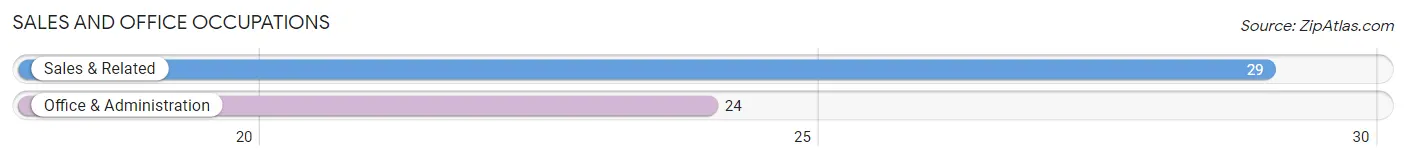
Sales and Office Occupations by Sex

| Occupation | Male | Female |
| Sales & Related | 0 (0.0%) | 29 (100.0%) |
| Office & Administration | 0 (0.0%) | 24 (100.0%) |
| Total (Category) | 0 (0.0%) | 53 (100.0%) |
| Total (Overall) | 65 (29.7%) | 154 (70.3%) |
Natural Resources, Construction and Maintenance Occupations
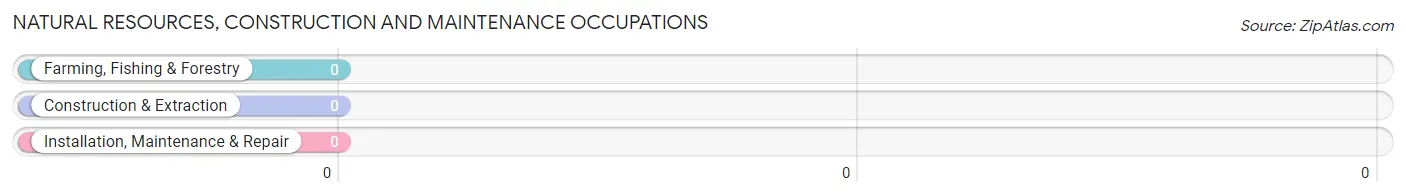
Natural Resources, Construction and Maintenance Occupations by Sex
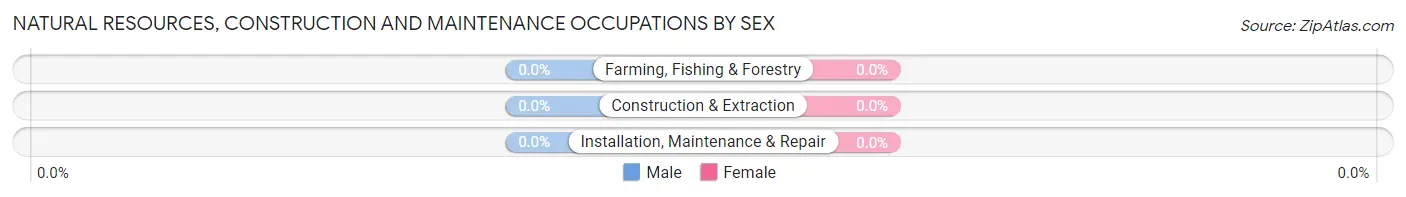
| Occupation | Male | Female |
| Farming, Fishing & Forestry | 0 (0.0%) | 0 (0.0%) |
| Construction & Extraction | 0 (0.0%) | 0 (0.0%) |
| Installation, Maintenance & Repair | 0 (0.0%) | 0 (0.0%) |
| Total (Category) | 0 (0.0%) | 0 (0.0%) |
| Total (Overall) | 65 (29.7%) | 154 (70.3%) |
Production, Transportation and Moving Occupations
The most common Production, Transportation and Moving occupations in Fairview are Production (12 | 5.5%), and Transportation (9 | 4.1%).
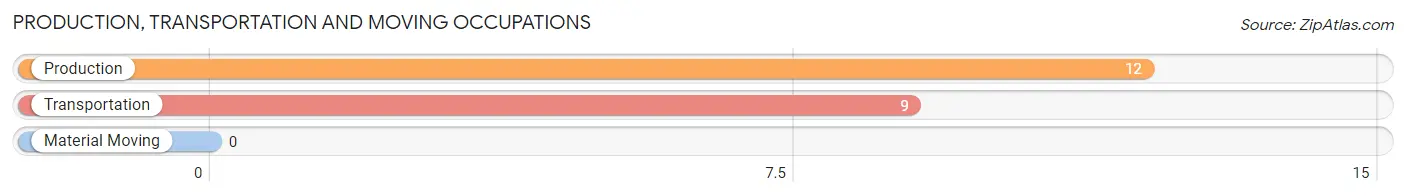
Production, Transportation and Moving Occupations by Sex
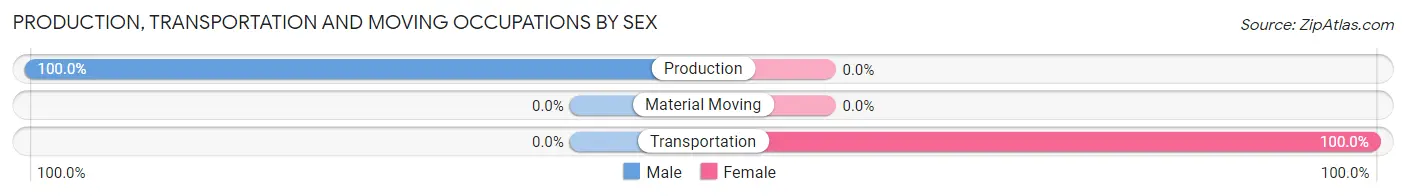
| Occupation | Male | Female |
| Production | 12 (100.0%) | 0 (0.0%) |
| Transportation | 0 (0.0%) | 9 (100.0%) |
| Material Moving | 0 (0.0%) | 0 (0.0%) |
| Total (Category) | 12 (57.1%) | 9 (42.9%) |
| Total (Overall) | 65 (29.7%) | 154 (70.3%) |
Employment Industries by Sex in Fairview
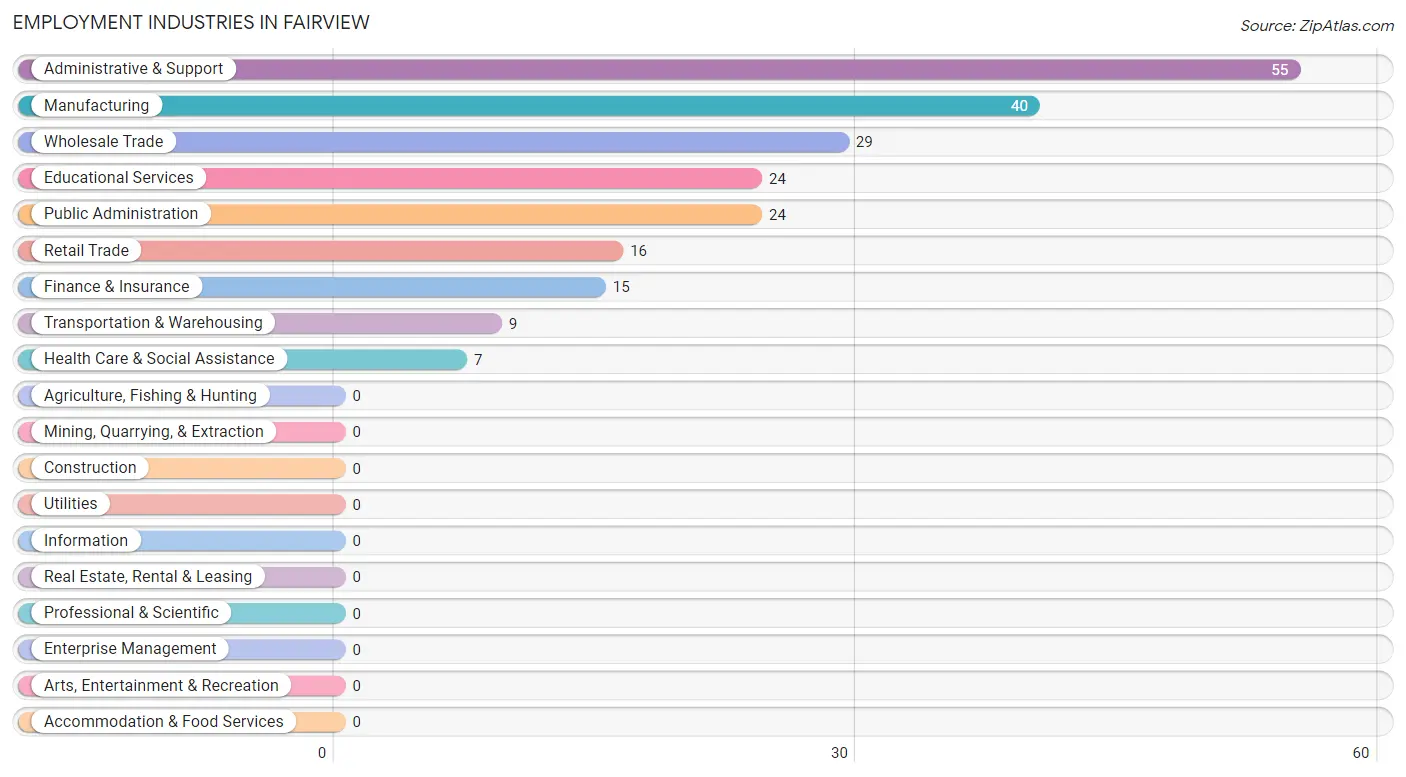
Employment Industries in Fairview
The major employment industries in Fairview include Administrative & Support (55 | 25.1%), Manufacturing (40 | 18.3%), Wholesale Trade (29 | 13.2%), Educational Services (24 | 11.0%), and Public Administration (24 | 11.0%).
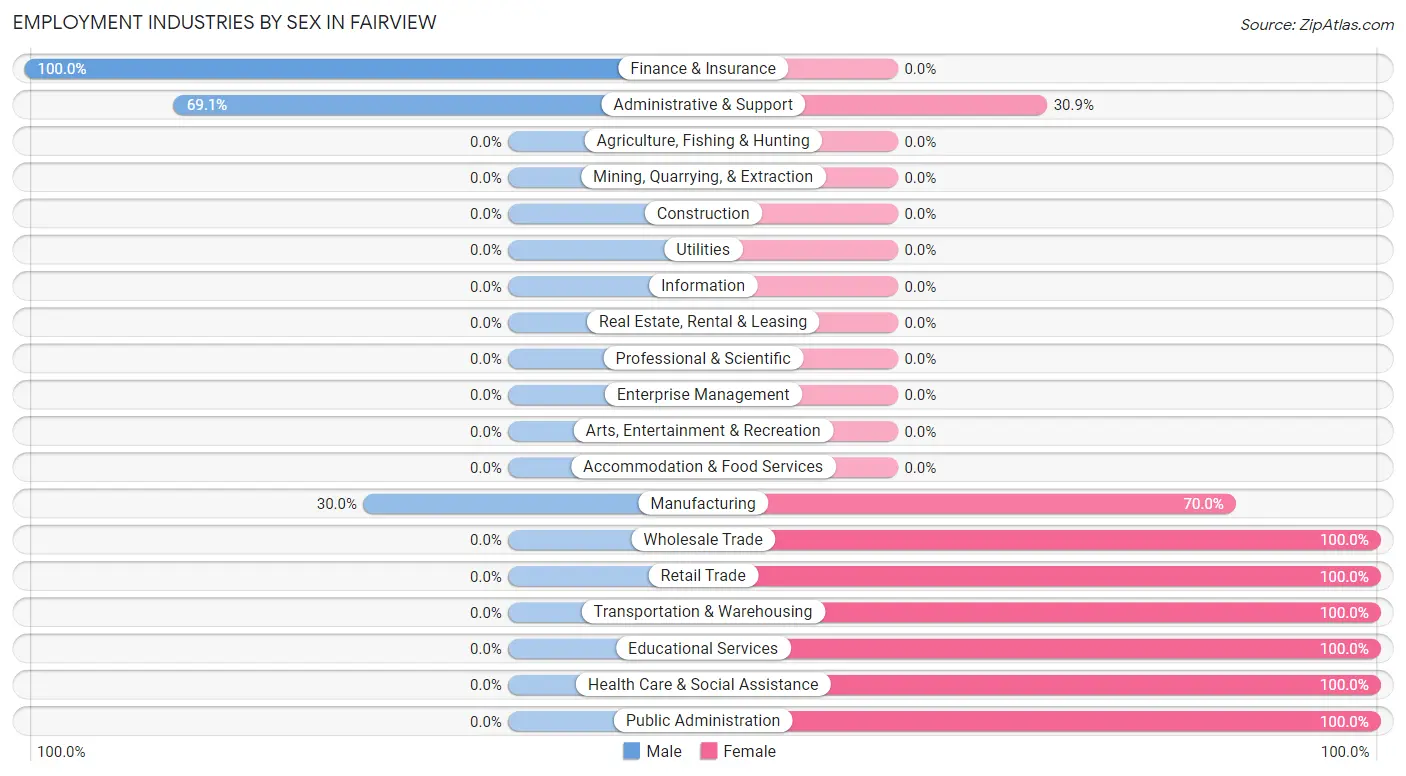
Employment Industries by Sex in Fairview
The Fairview industries that see more men than women are Finance & Insurance (100.0%), Administrative & Support (69.1%), and Manufacturing (30.0%), whereas the industries that tend to have a higher number of women are Wholesale Trade (100.0%), Retail Trade (100.0%), and Transportation & Warehousing (100.0%).
| Industry | Male | Female |
| Agriculture, Fishing & Hunting | 0 (0.0%) | 0 (0.0%) |
| Mining, Quarrying, & Extraction | 0 (0.0%) | 0 (0.0%) |
| Construction | 0 (0.0%) | 0 (0.0%) |
| Manufacturing | 12 (30.0%) | 28 (70.0%) |
| Wholesale Trade | 0 (0.0%) | 29 (100.0%) |
| Retail Trade | 0 (0.0%) | 16 (100.0%) |
| Transportation & Warehousing | 0 (0.0%) | 9 (100.0%) |
| Utilities | 0 (0.0%) | 0 (0.0%) |
| Information | 0 (0.0%) | 0 (0.0%) |
| Finance & Insurance | 15 (100.0%) | 0 (0.0%) |
| Real Estate, Rental & Leasing | 0 (0.0%) | 0 (0.0%) |
| Professional & Scientific | 0 (0.0%) | 0 (0.0%) |
| Enterprise Management | 0 (0.0%) | 0 (0.0%) |
| Administrative & Support | 38 (69.1%) | 17 (30.9%) |
| Educational Services | 0 (0.0%) | 24 (100.0%) |
| Health Care & Social Assistance | 0 (0.0%) | 7 (100.0%) |
| Arts, Entertainment & Recreation | 0 (0.0%) | 0 (0.0%) |
| Accommodation & Food Services | 0 (0.0%) | 0 (0.0%) |
| Public Administration | 0 (0.0%) | 24 (100.0%) |
| Total | 65 (29.7%) | 154 (70.3%) |
Education in Fairview
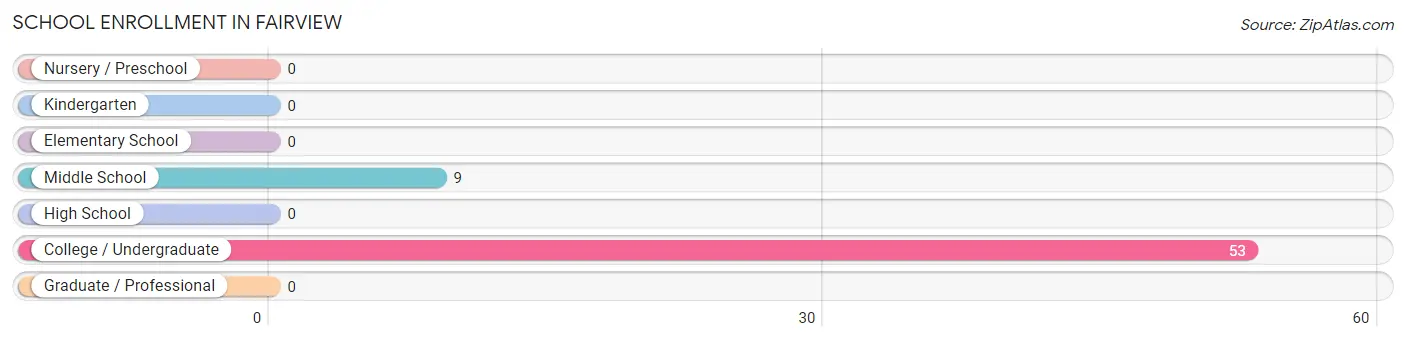
School Enrollment in Fairview
The most common levels of schooling among the 62 students in Fairview are college / undergraduate (53 | 85.5%), and middle school (9 | 14.5%).
| School Level | # Students | % Students |
| Nursery / Preschool | 0 | 0.0% |
| Kindergarten | 0 | 0.0% |
| Elementary School | 0 | 0.0% |
| Middle School | 9 | 14.5% |
| High School | 0 | 0.0% |
| College / Undergraduate | 53 | 85.5% |
| Graduate / Professional | 0 | 0.0% |
| Total | 62 | 100.0% |
School Enrollment by Age by Funding Source in Fairview
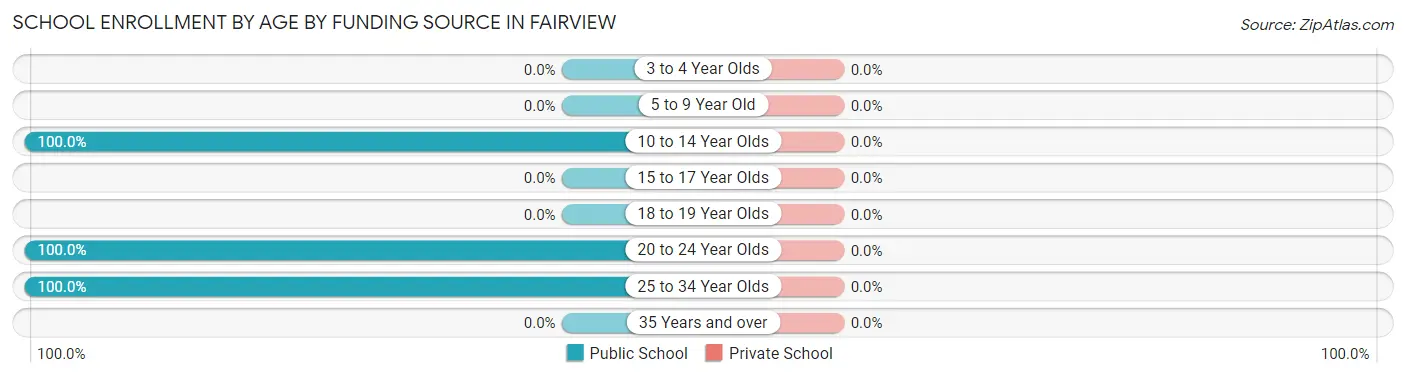
| Age Bracket | Public School | Private School |
| 3 to 4 Year Olds | 0 (0.0%) | 0 (0.0%) |
| 5 to 9 Year Old | 0 (0.0%) | 0 (0.0%) |
| 10 to 14 Year Olds | 9 (100.0%) | 0 (0.0%) |
| 15 to 17 Year Olds | 0 (0.0%) | 0 (0.0%) |
| 18 to 19 Year Olds | 0 (0.0%) | 0 (0.0%) |
| 20 to 24 Year Olds | 29 (100.0%) | 0 (0.0%) |
| 25 to 34 Year Olds | 24 (100.0%) | 0 (0.0%) |
| 35 Years and over | 0 (0.0%) | 0 (0.0%) |
| Total | 62 (100.0%) | 0 (0.0%) |
Educational Attainment by Field of Study in Fairview
Science & technology (21 | 40.4%), education (16 | 30.8%), and business (15 | 28.8%) are the most common fields of study among 52 individuals in Fairview who have obtained a bachelor's degree or higher.
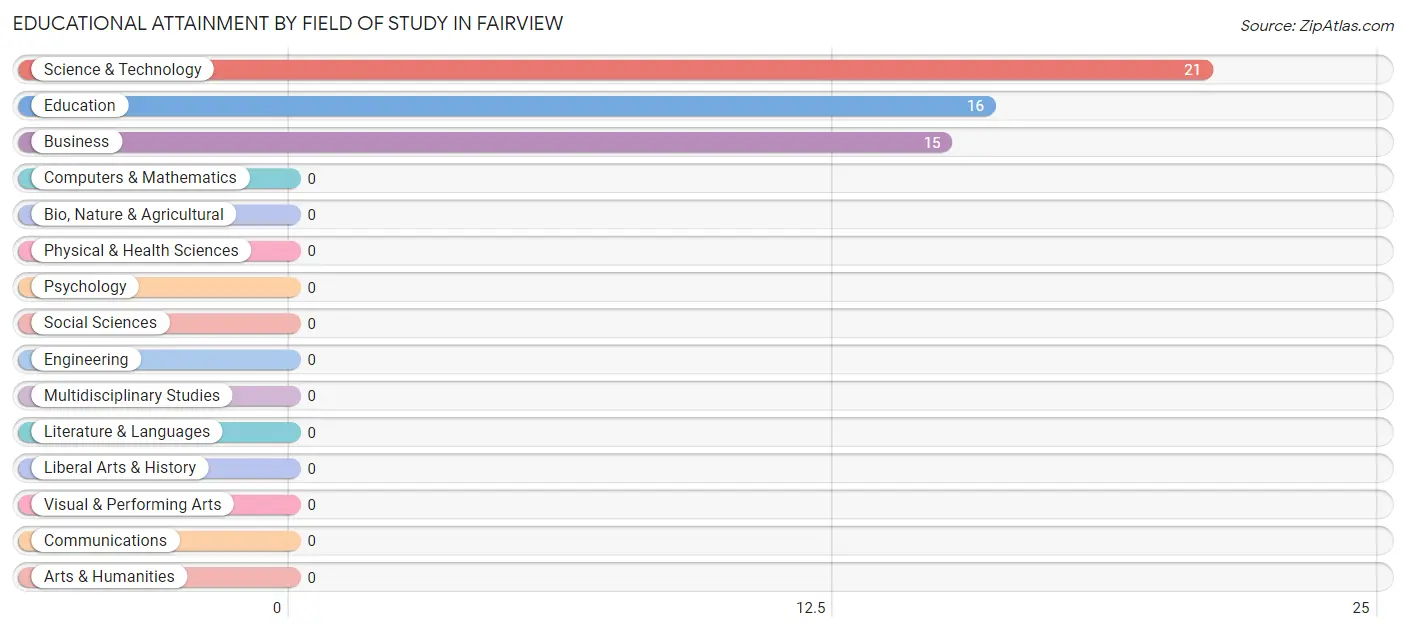
| Field of Study | # Graduates | % Graduates |
| Computers & Mathematics | 0 | 0.0% |
| Bio, Nature & Agricultural | 0 | 0.0% |
| Physical & Health Sciences | 0 | 0.0% |
| Psychology | 0 | 0.0% |
| Social Sciences | 0 | 0.0% |
| Engineering | 0 | 0.0% |
| Multidisciplinary Studies | 0 | 0.0% |
| Science & Technology | 21 | 40.4% |
| Business | 15 | 28.8% |
| Education | 16 | 30.8% |
| Literature & Languages | 0 | 0.0% |
| Liberal Arts & History | 0 | 0.0% |
| Visual & Performing Arts | 0 | 0.0% |
| Communications | 0 | 0.0% |
| Arts & Humanities | 0 | 0.0% |
| Total | 52 | 100.0% |
Transportation & Commute in Fairview
Vehicle Availability by Sex in Fairview
The most prevalent vehicle ownership categories in Fairview are males with 2 vehicles (65, accounting for 100.0%) and females with 2 vehicles (93, making up 42.2%).
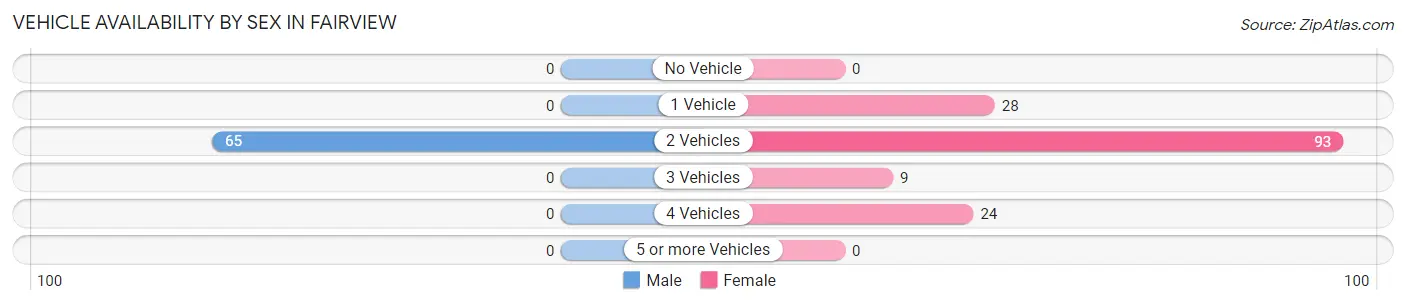
| Vehicles Available | Male | Female |
| No Vehicle | 0 (0.0%) | 0 (0.0%) |
| 1 Vehicle | 0 (0.0%) | 28 (18.2%) |
| 2 Vehicles | 65 (100.0%) | 93 (60.4%) |
| 3 Vehicles | 0 (0.0%) | 9 (5.8%) |
| 4 Vehicles | 0 (0.0%) | 24 (15.6%) |
| 5 or more Vehicles | 0 (0.0%) | 0 (0.0%) |
| Total | 65 (100.0%) | 154 (100.0%) |
Commute Time in Fairview
The most frequently occuring commute durations in Fairview are 10 to 14 minutes (98 commuters, 44.8%), 5 to 9 minutes (78 commuters, 35.6%), and 45 to 59 minutes (28 commuters, 12.8%).
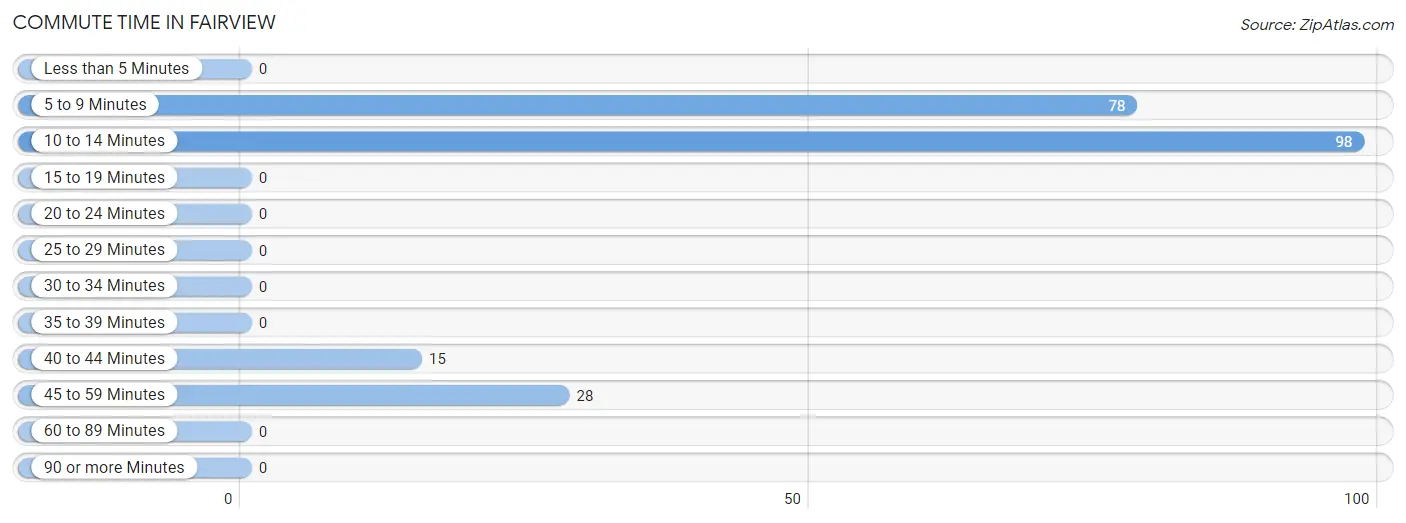
| Commute Time | # Commuters | % Commuters |
| Less than 5 Minutes | 0 | 0.0% |
| 5 to 9 Minutes | 78 | 35.6% |
| 10 to 14 Minutes | 98 | 44.8% |
| 15 to 19 Minutes | 0 | 0.0% |
| 20 to 24 Minutes | 0 | 0.0% |
| 25 to 29 Minutes | 0 | 0.0% |
| 30 to 34 Minutes | 0 | 0.0% |
| 35 to 39 Minutes | 0 | 0.0% |
| 40 to 44 Minutes | 15 | 6.9% |
| 45 to 59 Minutes | 28 | 12.8% |
| 60 to 89 Minutes | 0 | 0.0% |
| 90 or more Minutes | 0 | 0.0% |
Commute Time by Sex in Fairview
The most common commute times in Fairview are 5 to 9 minutes (38 commuters, 58.5%) for males and 10 to 14 minutes (86 commuters, 55.8%) for females.
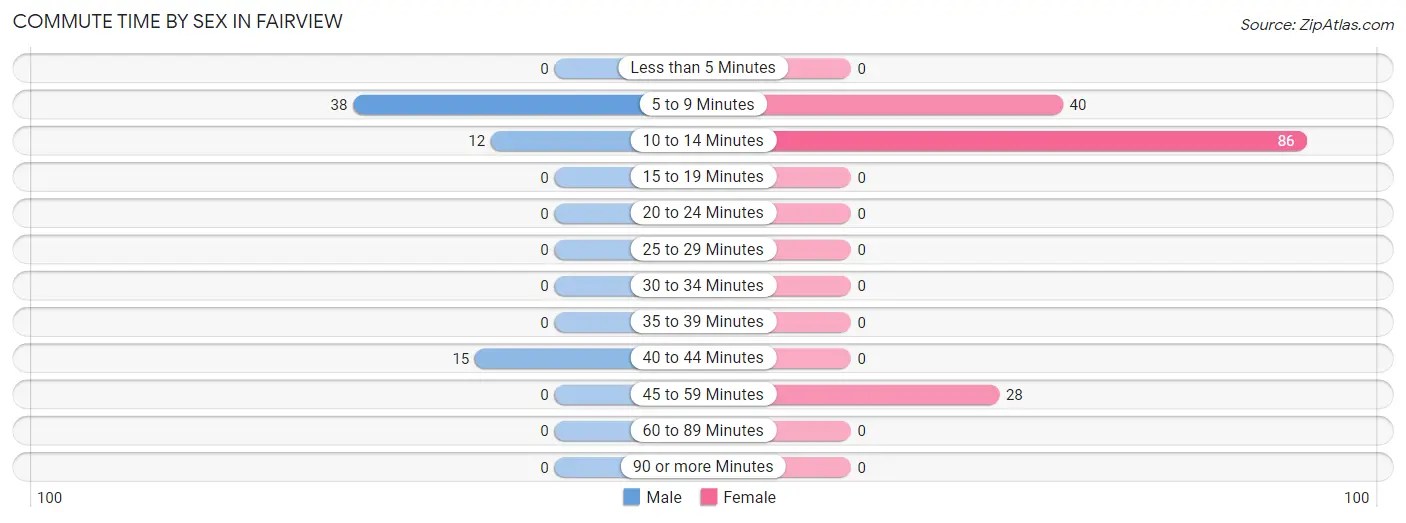
| Commute Time | Male | Female |
| Less than 5 Minutes | 0 (0.0%) | 0 (0.0%) |
| 5 to 9 Minutes | 38 (58.5%) | 40 (26.0%) |
| 10 to 14 Minutes | 12 (18.5%) | 86 (55.8%) |
| 15 to 19 Minutes | 0 (0.0%) | 0 (0.0%) |
| 20 to 24 Minutes | 0 (0.0%) | 0 (0.0%) |
| 25 to 29 Minutes | 0 (0.0%) | 0 (0.0%) |
| 30 to 34 Minutes | 0 (0.0%) | 0 (0.0%) |
| 35 to 39 Minutes | 0 (0.0%) | 0 (0.0%) |
| 40 to 44 Minutes | 15 (23.1%) | 0 (0.0%) |
| 45 to 59 Minutes | 0 (0.0%) | 28 (18.2%) |
| 60 to 89 Minutes | 0 (0.0%) | 0 (0.0%) |
| 90 or more Minutes | 0 (0.0%) | 0 (0.0%) |
Time of Departure to Work by Sex in Fairview
The most frequent times of departure to work in Fairview are 7:30 AM to 7:59 AM (38, 58.5%) for males and 12:00 PM to 3:59 PM (33, 21.4%) for females.
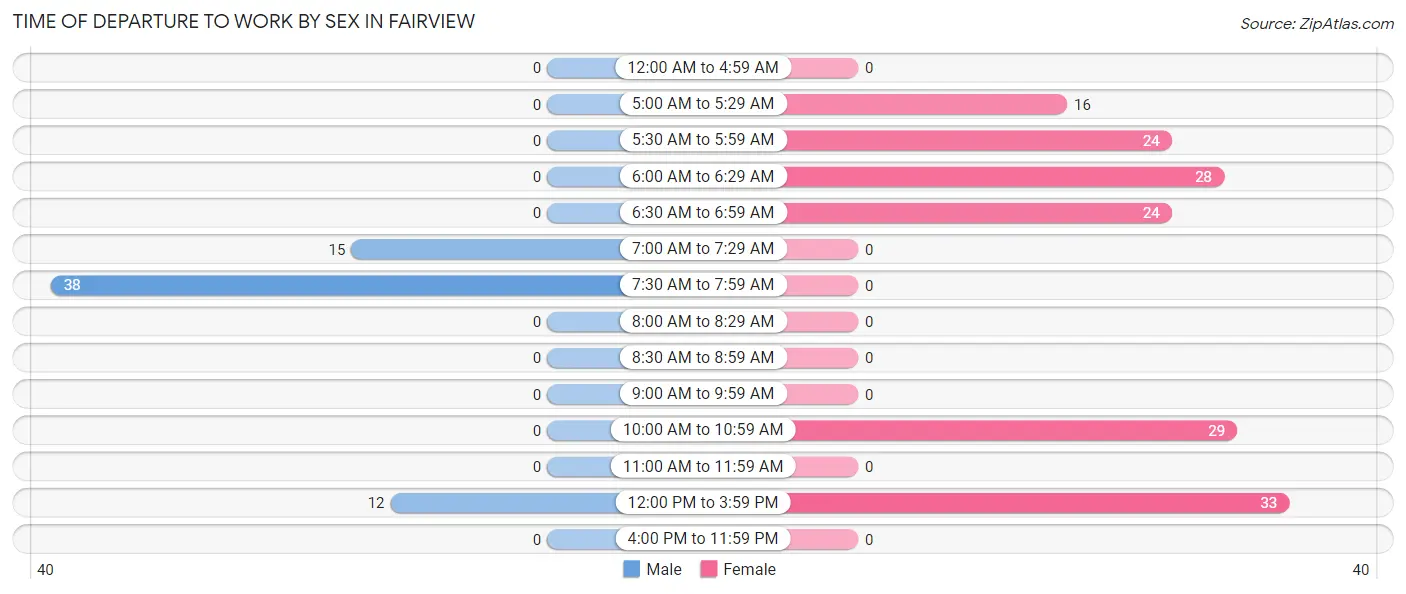
| Time of Departure | Male | Female |
| 12:00 AM to 4:59 AM | 0 (0.0%) | 0 (0.0%) |
| 5:00 AM to 5:29 AM | 0 (0.0%) | 16 (10.4%) |
| 5:30 AM to 5:59 AM | 0 (0.0%) | 24 (15.6%) |
| 6:00 AM to 6:29 AM | 0 (0.0%) | 28 (18.2%) |
| 6:30 AM to 6:59 AM | 0 (0.0%) | 24 (15.6%) |
| 7:00 AM to 7:29 AM | 15 (23.1%) | 0 (0.0%) |
| 7:30 AM to 7:59 AM | 38 (58.5%) | 0 (0.0%) |
| 8:00 AM to 8:29 AM | 0 (0.0%) | 0 (0.0%) |
| 8:30 AM to 8:59 AM | 0 (0.0%) | 0 (0.0%) |
| 9:00 AM to 9:59 AM | 0 (0.0%) | 0 (0.0%) |
| 10:00 AM to 10:59 AM | 0 (0.0%) | 29 (18.8%) |
| 11:00 AM to 11:59 AM | 0 (0.0%) | 0 (0.0%) |
| 12:00 PM to 3:59 PM | 12 (18.5%) | 33 (21.4%) |
| 4:00 PM to 11:59 PM | 0 (0.0%) | 0 (0.0%) |
| Total | 65 (100.0%) | 154 (100.0%) |
Housing Occupancy in Fairview
Occupancy by Ownership in Fairview
Of the total 4,128 dwellings in Fairview, owner-occupied units account for 2,081 (50.4%), while renter-occupied units make up 2,047 (49.6%).
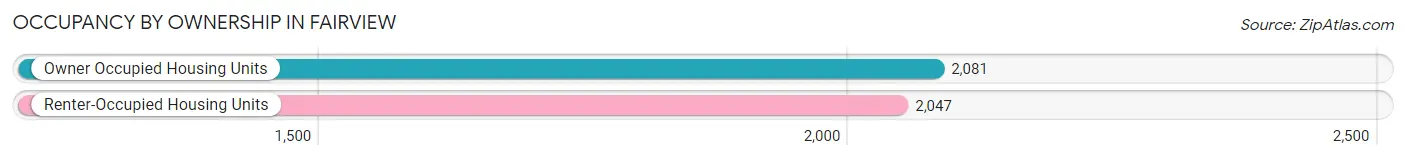
| Occupancy | # Housing Units | % Housing Units |
| Owner Occupied Housing Units | 2,081 | 50.4% |
| Renter-Occupied Housing Units | 2,047 | 49.6% |
| Total Occupied Housing Units | 4,128 | 100.0% |
Occupancy by Household Size in Fairview
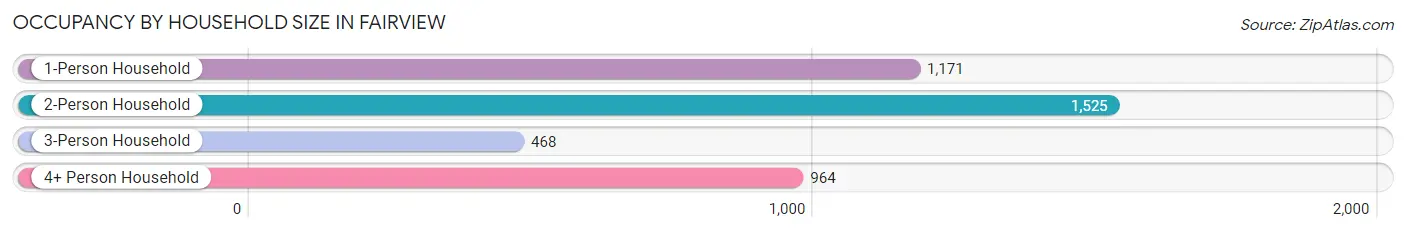
| Household Size | # Housing Units | % Housing Units |
| 1-Person Household | 1,171 | 28.4% |
| 2-Person Household | 1,525 | 36.9% |
| 3-Person Household | 468 | 11.3% |
| 4+ Person Household | 964 | 23.4% |
| Total Housing Units | 4,128 | 100.0% |
Occupancy by Ownership by Household Size in Fairview
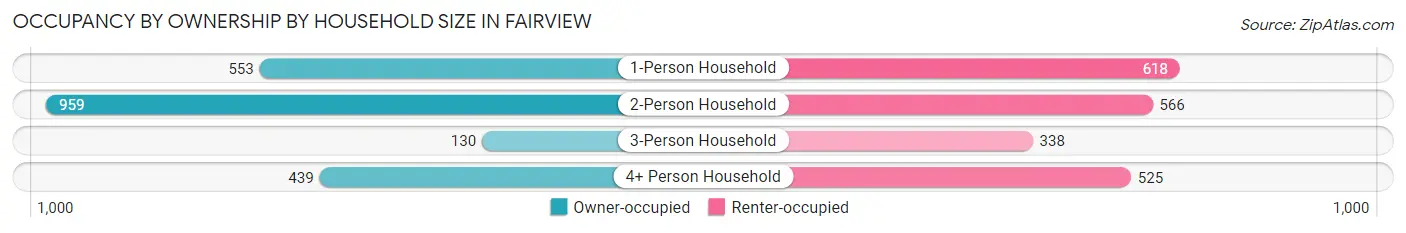
| Household Size | Owner-occupied | Renter-occupied |
| 1-Person Household | 553 (47.2%) | 618 (52.8%) |
| 2-Person Household | 959 (62.9%) | 566 (37.1%) |
| 3-Person Household | 130 (27.8%) | 338 (72.2%) |
| 4+ Person Household | 439 (45.5%) | 525 (54.5%) |
| Total Housing Units | 2,081 (50.4%) | 2,047 (49.6%) |
Occupancy by Educational Attainment in Fairview
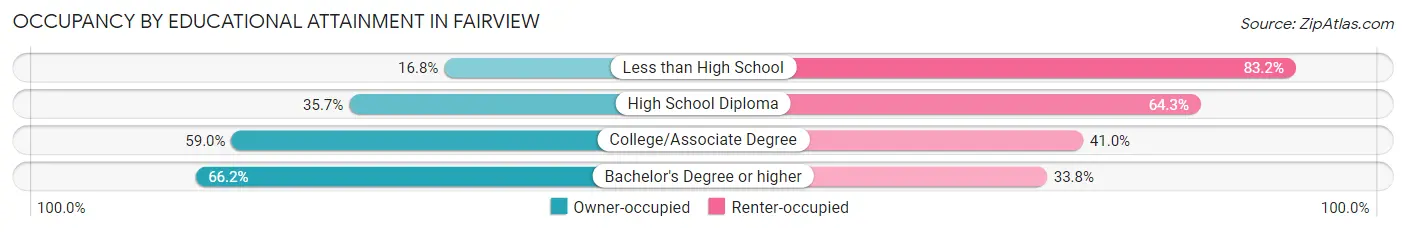
| Household Size | Owner-occupied | Renter-occupied |
| Less than High School | 72 (16.8%) | 356 (83.2%) |
| High School Diploma | 383 (35.7%) | 691 (64.3%) |
| College/Associate Degree | 920 (59.0%) | 639 (41.0%) |
| Bachelor's Degree or higher | 706 (66.2%) | 361 (33.8%) |
Occupancy by Age of Householder in Fairview
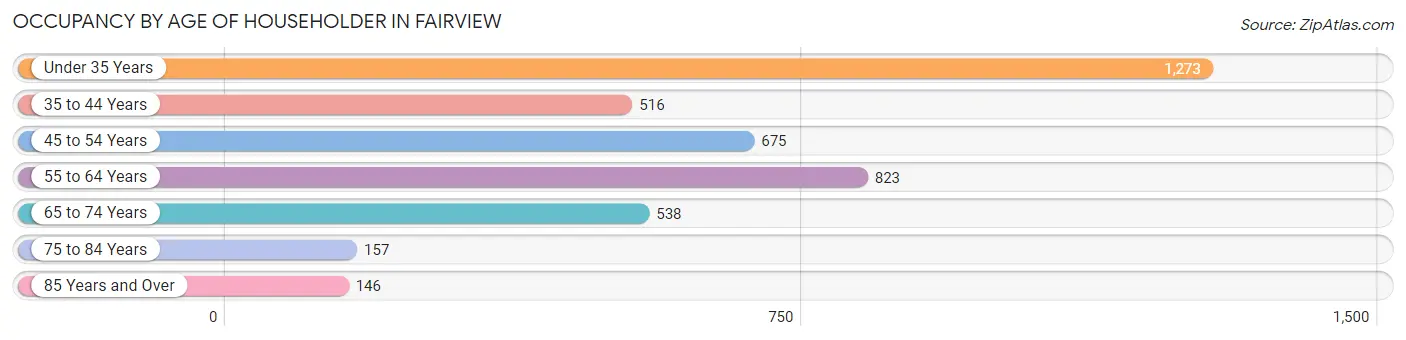
| Age Bracket | # Households | % Households |
| Under 35 Years | 1,273 | 30.8% |
| 35 to 44 Years | 516 | 12.5% |
| 45 to 54 Years | 675 | 16.4% |
| 55 to 64 Years | 823 | 19.9% |
| 65 to 74 Years | 538 | 13.0% |
| 75 to 84 Years | 157 | 3.8% |
| 85 Years and Over | 146 | 3.5% |
| Total | 4,128 | 100.0% |
Housing Finances in Fairview
Median Income by Occupancy in Fairview
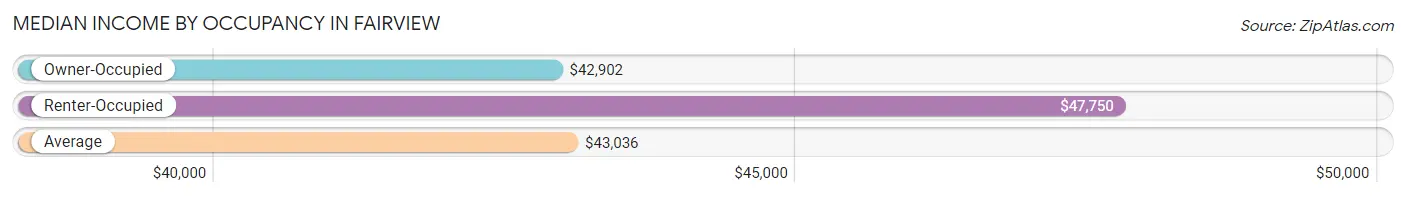
| Occupancy Type | # Households | Median Income |
| Owner-Occupied | 163 (76.2%) | $42,902 |
| Renter-Occupied | 51 (23.8%) | $47,750 |
| Average | 214 (100.0%) | $43,036 |
Occupancy by Householder Income Bracket in Fairview
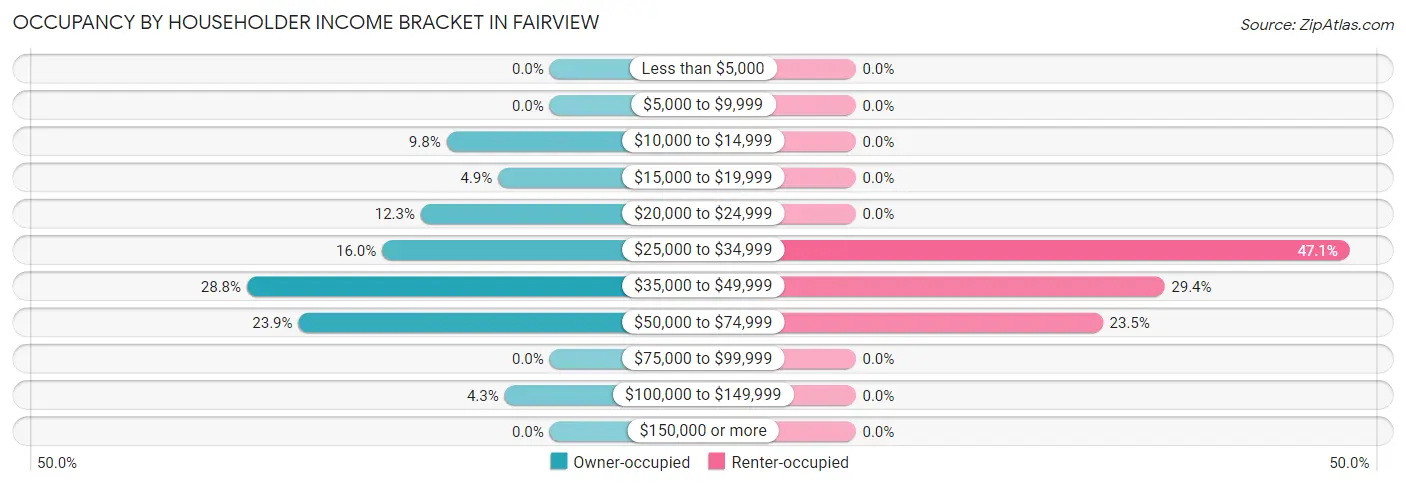
| Income Bracket | Owner-occupied | Renter-occupied |
| Less than $5,000 | 0 (0.0%) | 0 (0.0%) |
| $5,000 to $9,999 | 0 (0.0%) | 0 (0.0%) |
| $10,000 to $14,999 | 16 (9.8%) | 0 (0.0%) |
| $15,000 to $19,999 | 8 (4.9%) | 0 (0.0%) |
| $20,000 to $24,999 | 20 (12.3%) | 0 (0.0%) |
| $25,000 to $34,999 | 26 (16.0%) | 24 (47.1%) |
| $35,000 to $49,999 | 47 (28.8%) | 15 (29.4%) |
| $50,000 to $74,999 | 39 (23.9%) | 12 (23.5%) |
| $75,000 to $99,999 | 0 (0.0%) | 0 (0.0%) |
| $100,000 to $149,999 | 7 (4.3%) | 0 (0.0%) |
| $150,000 or more | 0 (0.0%) | 0 (0.0%) |
| Total | 163 (100.0%) | 51 (100.0%) |
Monthly Housing Cost Tiers in Fairview
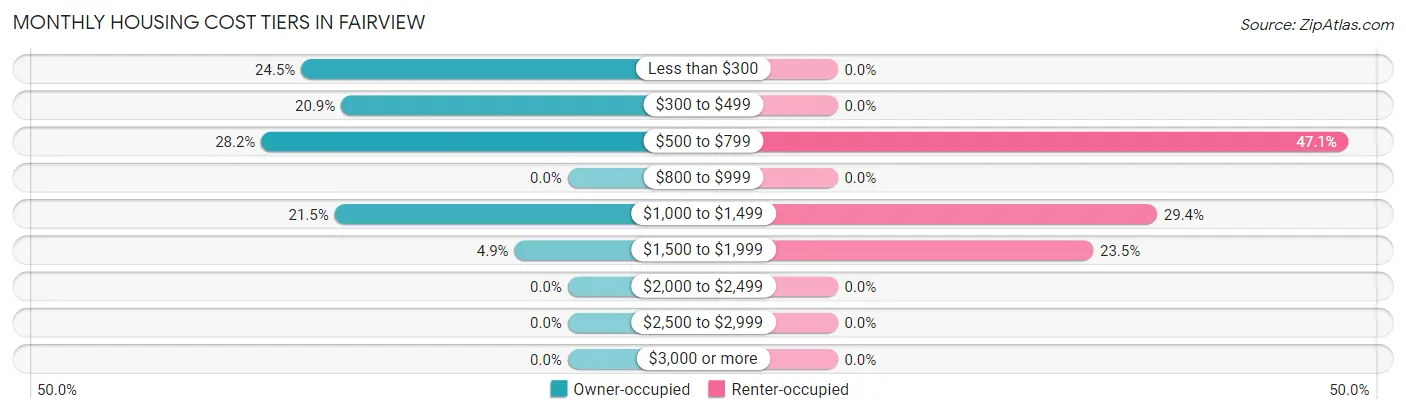
| Monthly Cost | Owner-occupied | Renter-occupied |
| Less than $300 | 40 (24.5%) | 0 (0.0%) |
| $300 to $499 | 34 (20.9%) | 0 (0.0%) |
| $500 to $799 | 46 (28.2%) | 24 (47.1%) |
| $800 to $999 | 0 (0.0%) | 0 (0.0%) |
| $1,000 to $1,499 | 35 (21.5%) | 15 (29.4%) |
| $1,500 to $1,999 | 8 (4.9%) | 12 (23.5%) |
| $2,000 to $2,499 | 0 (0.0%) | 0 (0.0%) |
| $2,500 to $2,999 | 0 (0.0%) | 0 (0.0%) |
| $3,000 or more | 0 (0.0%) | 0 (0.0%) |
| Total | 163 (100.0%) | 51 (100.0%) |
Physical Housing Characteristics in Fairview
Housing Structures in Fairview
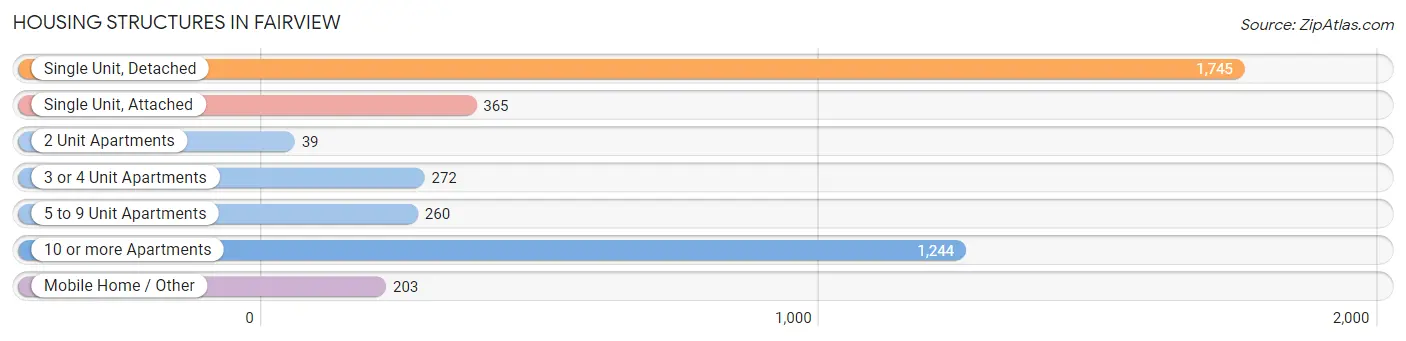
| Structure Type | # Housing Units | % Housing Units |
| Single Unit, Detached | 1,745 | 42.3% |
| Single Unit, Attached | 365 | 8.8% |
| 2 Unit Apartments | 39 | 0.9% |
| 3 or 4 Unit Apartments | 272 | 6.6% |
| 5 to 9 Unit Apartments | 260 | 6.3% |
| 10 or more Apartments | 1,244 | 30.1% |
| Mobile Home / Other | 203 | 4.9% |
| Total | 4,128 | 100.0% |
Housing Structures by Occupancy in Fairview
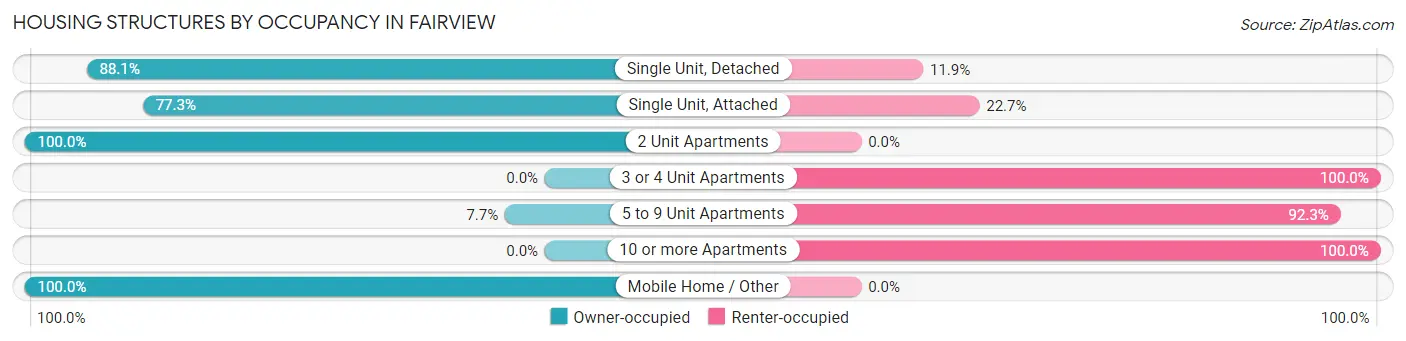
| Structure Type | Owner-occupied | Renter-occupied |
| Single Unit, Detached | 1,537 (88.1%) | 208 (11.9%) |
| Single Unit, Attached | 282 (77.3%) | 83 (22.7%) |
| 2 Unit Apartments | 39 (100.0%) | 0 (0.0%) |
| 3 or 4 Unit Apartments | 0 (0.0%) | 272 (100.0%) |
| 5 to 9 Unit Apartments | 20 (7.7%) | 240 (92.3%) |
| 10 or more Apartments | 0 (0.0%) | 1,244 (100.0%) |
| Mobile Home / Other | 203 (100.0%) | 0 (0.0%) |
| Total | 2,081 (50.4%) | 2,047 (49.6%) |
Housing Structures by Number of Rooms in Fairview
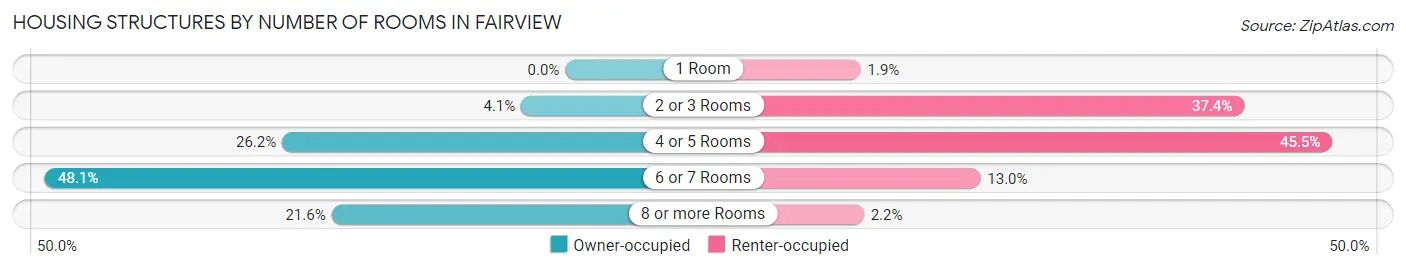
| Number of Rooms | Owner-occupied | Renter-occupied |
| 1 Room | 0 (0.0%) | 39 (1.9%) |
| 2 or 3 Rooms | 85 (4.1%) | 765 (37.4%) |
| 4 or 5 Rooms | 545 (26.2%) | 932 (45.5%) |
| 6 or 7 Rooms | 1,001 (48.1%) | 266 (13.0%) |
| 8 or more Rooms | 450 (21.6%) | 45 (2.2%) |
| Total | 2,081 (100.0%) | 2,047 (100.0%) |
Housing Structure by Heating Type in Fairview
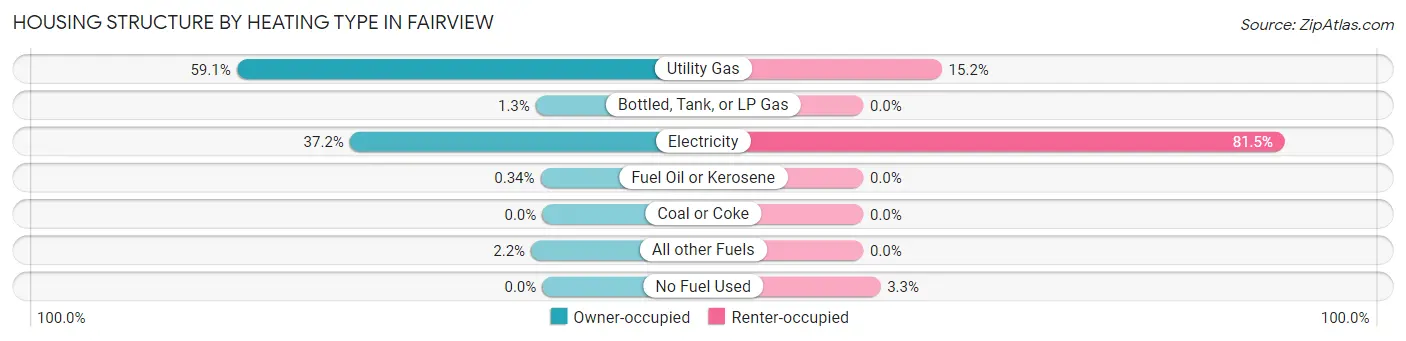
| Heating Type | Owner-occupied | Renter-occupied |
| Utility Gas | 1,229 (59.1%) | 311 (15.2%) |
| Bottled, Tank, or LP Gas | 26 (1.3%) | 0 (0.0%) |
| Electricity | 774 (37.2%) | 1,668 (81.5%) |
| Fuel Oil or Kerosene | 7 (0.3%) | 0 (0.0%) |
| Coal or Coke | 0 (0.0%) | 0 (0.0%) |
| All other Fuels | 45 (2.2%) | 0 (0.0%) |
| No Fuel Used | 0 (0.0%) | 68 (3.3%) |
| Total | 2,081 (100.0%) | 2,047 (100.0%) |
Household Vehicle Usage in Fairview
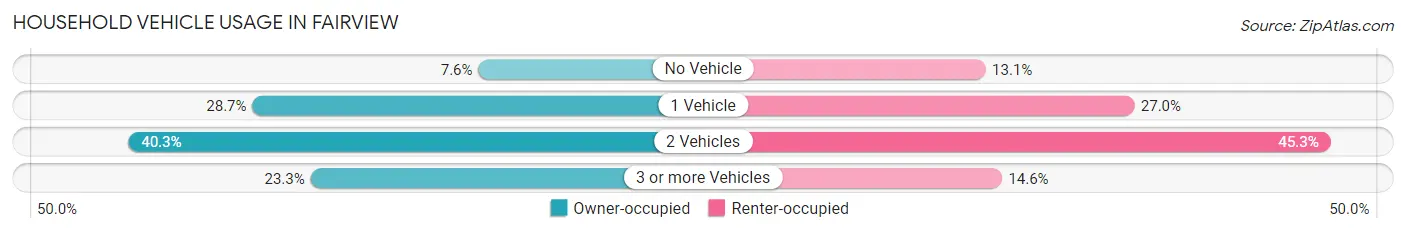
| Vehicles per Household | Owner-occupied | Renter-occupied |
| No Vehicle | 159 (7.6%) | 268 (13.1%) |
| 1 Vehicle | 598 (28.7%) | 552 (27.0%) |
| 2 Vehicles | 839 (40.3%) | 928 (45.3%) |
| 3 or more Vehicles | 485 (23.3%) | 299 (14.6%) |
| Total | 2,081 (100.0%) | 2,047 (100.0%) |
Real Estate & Mortgages in Fairview
Real Estate and Mortgage Overview in Fairview
| Characteristic | Without Mortgage | With Mortgage |
| Housing Units | 909 | 79 |
| Median Property Value | $406,600 | $269,400 |
| Median Household Income | $78,750 | $0 |
| Monthly Housing Costs | $644 | $0 |
| Real Estate Taxes | $3,425 | $0 |
Property Value by Mortgage Status in Fairview
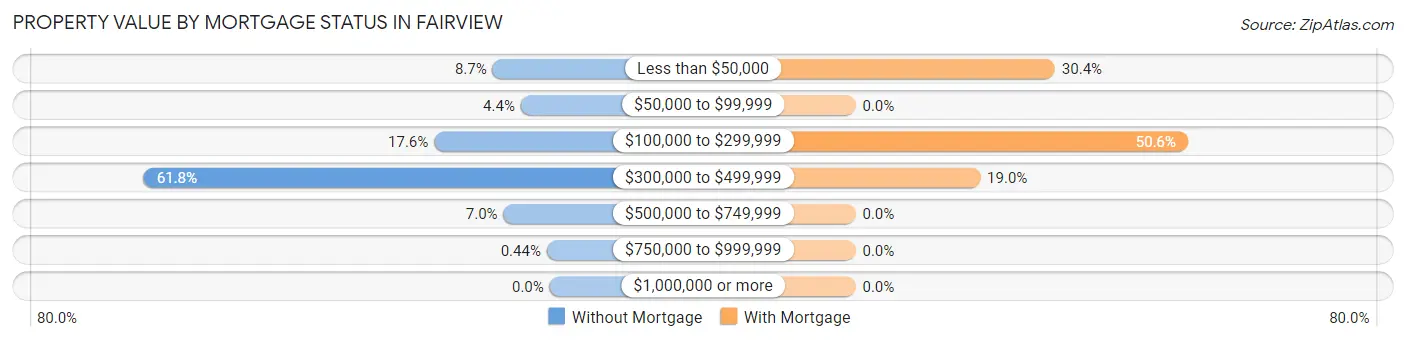
| Property Value | Without Mortgage | With Mortgage |
| Less than $50,000 | 79 (8.7%) | 24 (30.4%) |
| $50,000 to $99,999 | 40 (4.4%) | 0 (0.0%) |
| $100,000 to $299,999 | 160 (17.6%) | 40 (50.6%) |
| $300,000 to $499,999 | 562 (61.8%) | 15 (19.0%) |
| $500,000 to $749,999 | 64 (7.0%) | 0 (0.0%) |
| $750,000 to $999,999 | 4 (0.4%) | 0 (0.0%) |
| $1,000,000 or more | 0 (0.0%) | 0 (0.0%) |
| Total | 909 (100.0%) | 79 (100.0%) |
Household Income by Mortgage Status in Fairview
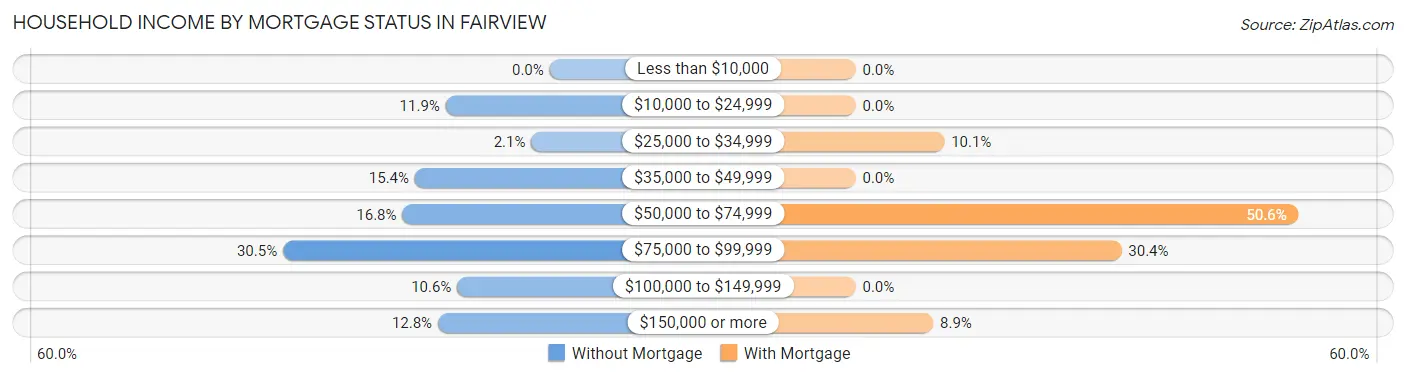
| Household Income | Without Mortgage | With Mortgage |
| Less than $10,000 | 0 (0.0%) | 0 (0.0%) |
| $10,000 to $24,999 | 108 (11.9%) | 0 (0.0%) |
| $25,000 to $34,999 | 19 (2.1%) | 8 (10.1%) |
| $35,000 to $49,999 | 140 (15.4%) | 0 (0.0%) |
| $50,000 to $74,999 | 153 (16.8%) | 40 (50.6%) |
| $75,000 to $99,999 | 277 (30.5%) | 24 (30.4%) |
| $100,000 to $149,999 | 96 (10.6%) | 0 (0.0%) |
| $150,000 or more | 116 (12.8%) | 7 (8.9%) |
| Total | 909 (100.0%) | 79 (100.0%) |
Property Value to Household Income Ratio in Fairview
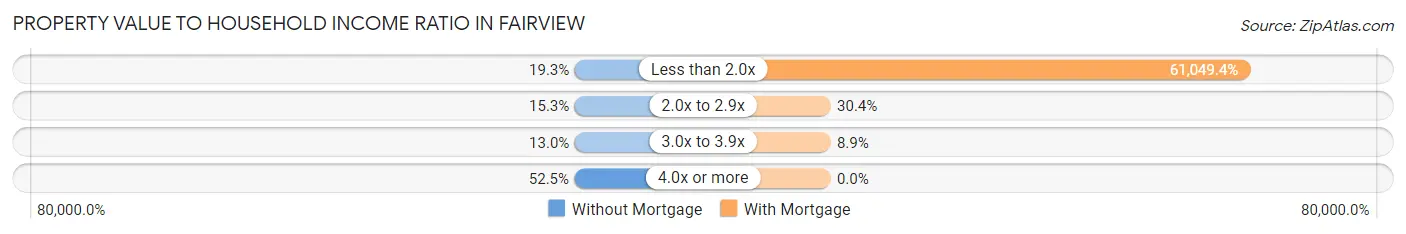
| Value-to-Income Ratio | Without Mortgage | With Mortgage |
| Less than 2.0x | 175 (19.3%) | 48,229 (61,049.4%) |
| 2.0x to 2.9x | 139 (15.3%) | 24 (30.4%) |
| 3.0x to 3.9x | 118 (13.0%) | 7 (8.9%) |
| 4.0x or more | 477 (52.5%) | 0 (0.0%) |
| Total | 909 (100.0%) | 79 (100.0%) |
Real Estate Taxes by Mortgage Status in Fairview
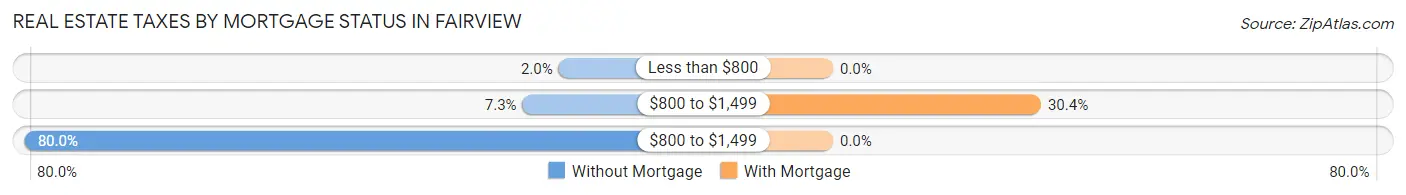
| Property Taxes | Without Mortgage | With Mortgage |
| Less than $800 | 18 (2.0%) | 0 (0.0%) |
| $800 to $1,499 | 66 (7.3%) | 24 (30.4%) |
| $800 to $1,499 | 727 (80.0%) | 0 (0.0%) |
| Total | 909 (100.0%) | 79 (100.0%) |
Health & Disability in Fairview
Health Insurance Coverage by Age in Fairview
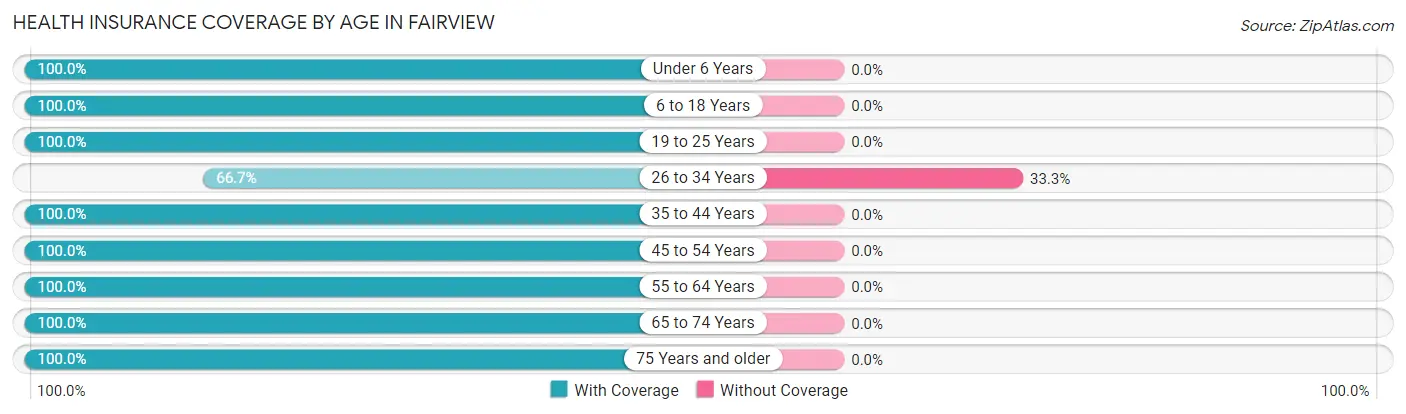
| Age Bracket | With Coverage | Without Coverage |
| Under 6 Years | 70 (100.0%) | 0 (0.0%) |
| 6 to 18 Years | 9 (100.0%) | 0 (0.0%) |
| 19 to 25 Years | 134 (100.0%) | 0 (0.0%) |
| 26 to 34 Years | 24 (66.7%) | 12 (33.3%) |
| 35 to 44 Years | 28 (100.0%) | 0 (0.0%) |
| 45 to 54 Years | 56 (100.0%) | 0 (0.0%) |
| 55 to 64 Years | 36 (100.0%) | 0 (0.0%) |
| 65 to 74 Years | 50 (100.0%) | 0 (0.0%) |
| 75 Years and older | 76 (100.0%) | 0 (0.0%) |
| Total | 483 (97.6%) | 12 (2.4%) |
Health Insurance Coverage by Citizenship Status in Fairview
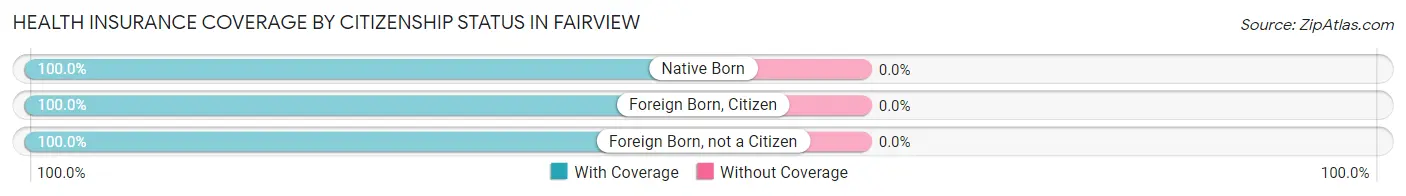
| Citizenship Status | With Coverage | Without Coverage |
| Native Born | 70 (100.0%) | 0 (0.0%) |
| Foreign Born, Citizen | 9 (100.0%) | 0 (0.0%) |
| Foreign Born, not a Citizen | 134 (100.0%) | 0 (0.0%) |
Health Insurance Coverage by Household Income in Fairview
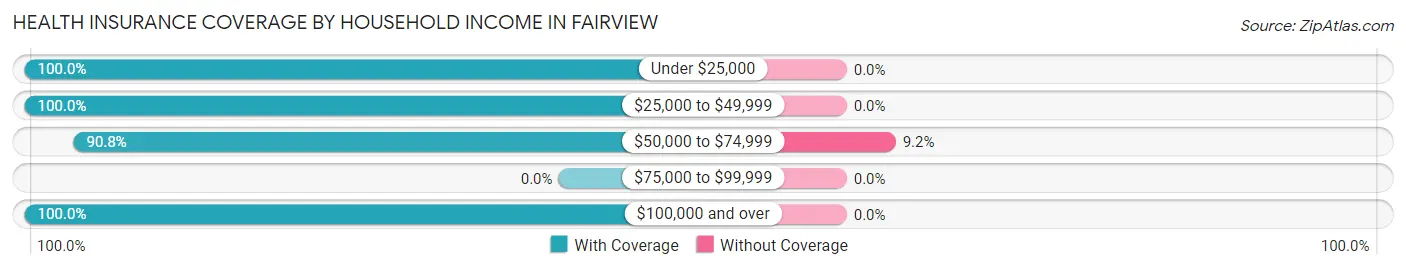
| Household Income | With Coverage | Without Coverage |
| Under $25,000 | 44 (100.0%) | 0 (0.0%) |
| $25,000 to $49,999 | 285 (100.0%) | 0 (0.0%) |
| $50,000 to $74,999 | 119 (90.8%) | 12 (9.2%) |
| $75,000 to $99,999 | 0 (0.0%) | 0 (0.0%) |
| $100,000 and over | 35 (100.0%) | 0 (0.0%) |
Public vs Private Health Insurance Coverage by Age in Fairview
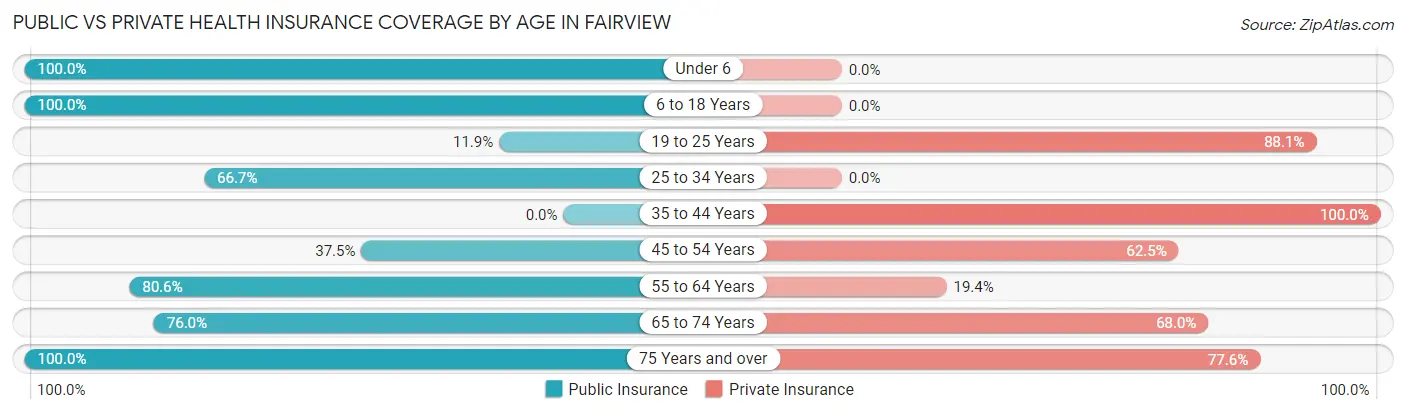
| Age Bracket | Public Insurance | Private Insurance |
| Under 6 | 70 (100.0%) | 0 (0.0%) |
| 6 to 18 Years | 9 (100.0%) | 0 (0.0%) |
| 19 to 25 Years | 16 (11.9%) | 118 (88.1%) |
| 25 to 34 Years | 24 (66.7%) | 0 (0.0%) |
| 35 to 44 Years | 0 (0.0%) | 28 (100.0%) |
| 45 to 54 Years | 21 (37.5%) | 35 (62.5%) |
| 55 to 64 Years | 29 (80.6%) | 7 (19.4%) |
| 65 to 74 Years | 38 (76.0%) | 34 (68.0%) |
| 75 Years and over | 76 (100.0%) | 59 (77.6%) |
| Total | 283 (57.2%) | 281 (56.8%) |
Disability Status by Sex by Age in Fairview
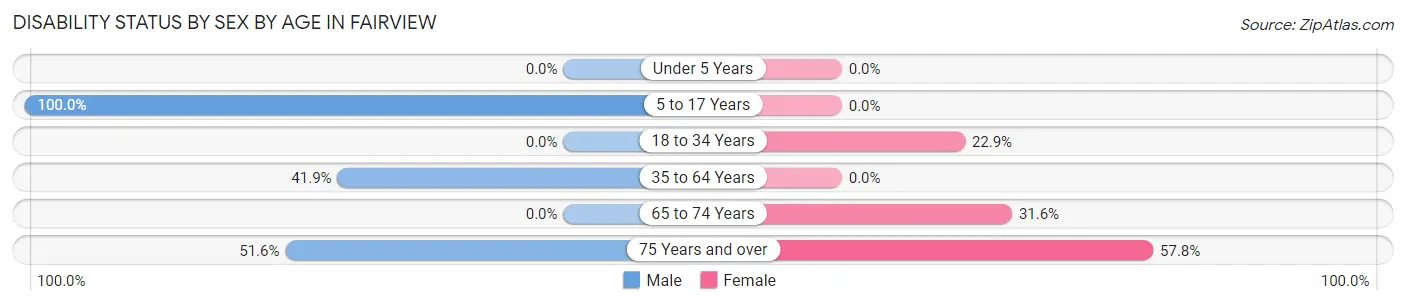
| Age Bracket | Male | Female |
| Under 5 Years | 0 (0.0%) | 0 (0.0%) |
| 5 to 17 Years | 9 (100.0%) | 0 (0.0%) |
| 18 to 34 Years | 0 (0.0%) | 24 (22.9%) |
| 35 to 64 Years | 13 (41.9%) | 0 (0.0%) |
| 65 to 74 Years | 0 (0.0%) | 12 (31.6%) |
| 75 Years and over | 16 (51.6%) | 26 (57.8%) |
Disability Class by Sex by Age in Fairview
Disability Class: Hearing Difficulty
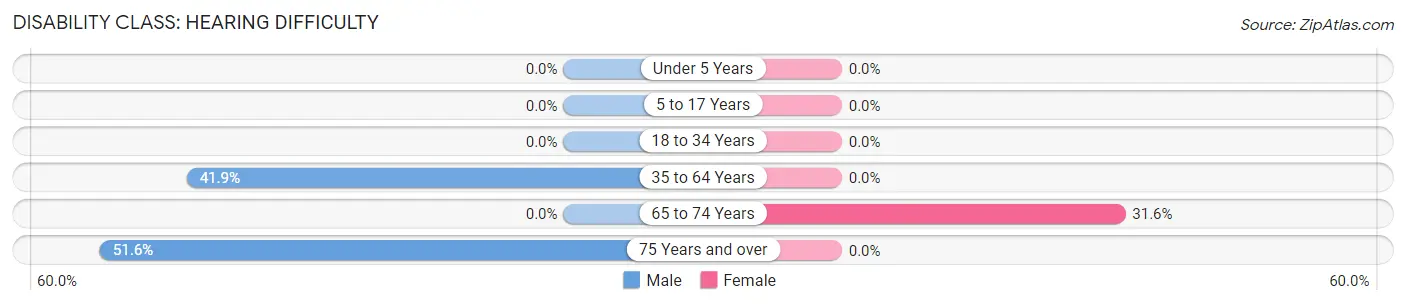
| Age Bracket | Male | Female |
| Under 5 Years | 0 (0.0%) | 0 (0.0%) |
| 5 to 17 Years | 0 (0.0%) | 0 (0.0%) |
| 18 to 34 Years | 0 (0.0%) | 0 (0.0%) |
| 35 to 64 Years | 13 (41.9%) | 0 (0.0%) |
| 65 to 74 Years | 0 (0.0%) | 12 (31.6%) |
| 75 Years and over | 16 (51.6%) | 0 (0.0%) |
Disability Class: Vision Difficulty
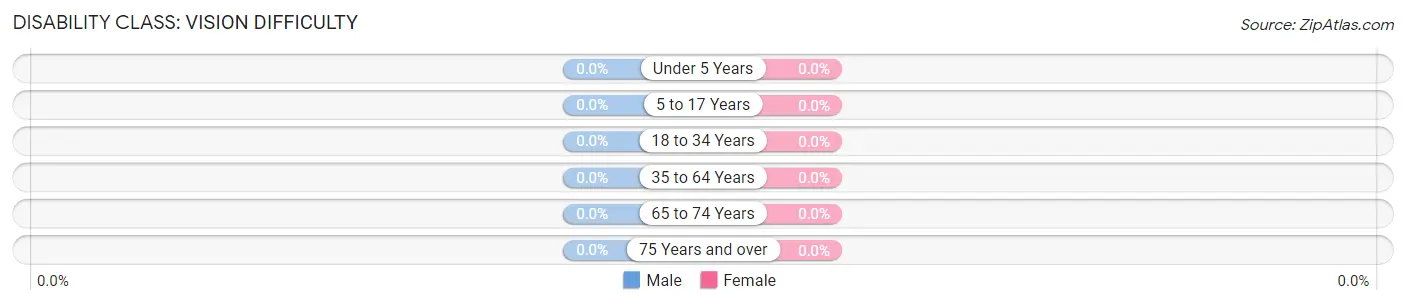
| Age Bracket | Male | Female |
| Under 5 Years | 0 (0.0%) | 0 (0.0%) |
| 5 to 17 Years | 0 (0.0%) | 0 (0.0%) |
| 18 to 34 Years | 0 (0.0%) | 0 (0.0%) |
| 35 to 64 Years | 0 (0.0%) | 0 (0.0%) |
| 65 to 74 Years | 0 (0.0%) | 0 (0.0%) |
| 75 Years and over | 0 (0.0%) | 0 (0.0%) |
Disability Class: Cognitive Difficulty
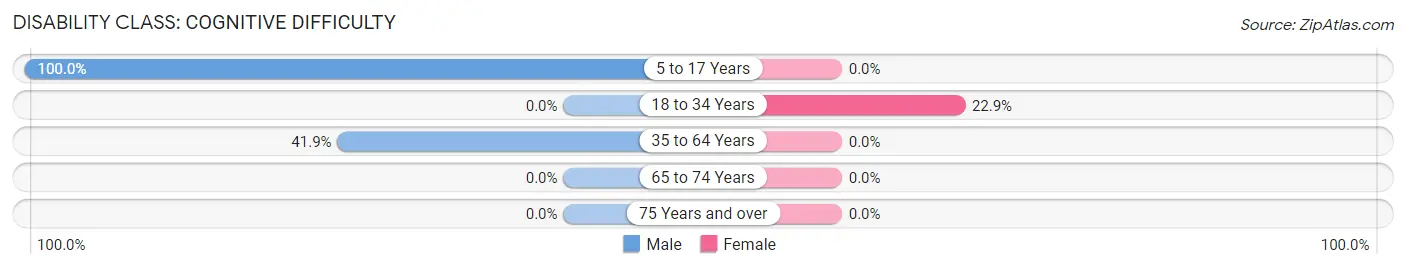
| Age Bracket | Male | Female |
| 5 to 17 Years | 9 (100.0%) | 0 (0.0%) |
| 18 to 34 Years | 0 (0.0%) | 24 (22.9%) |
| 35 to 64 Years | 13 (41.9%) | 0 (0.0%) |
| 65 to 74 Years | 0 (0.0%) | 0 (0.0%) |
| 75 Years and over | 0 (0.0%) | 0 (0.0%) |
Disability Class: Ambulatory Difficulty
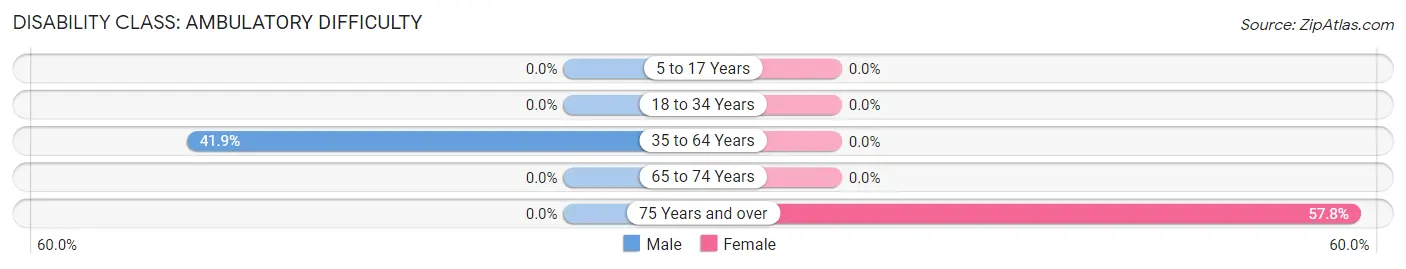
| Age Bracket | Male | Female |
| 5 to 17 Years | 0 (0.0%) | 0 (0.0%) |
| 18 to 34 Years | 0 (0.0%) | 0 (0.0%) |
| 35 to 64 Years | 13 (41.9%) | 0 (0.0%) |
| 65 to 74 Years | 0 (0.0%) | 0 (0.0%) |
| 75 Years and over | 0 (0.0%) | 26 (57.8%) |
Disability Class: Self-Care Difficulty
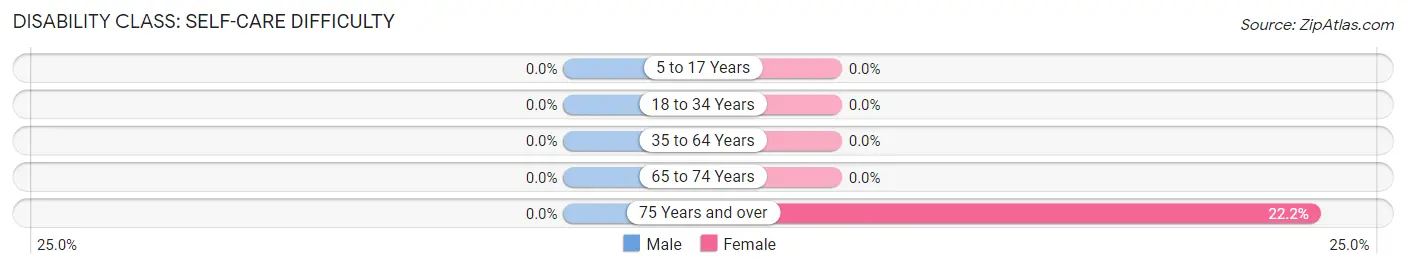
| Age Bracket | Male | Female |
| 5 to 17 Years | 0 (0.0%) | 0 (0.0%) |
| 18 to 34 Years | 0 (0.0%) | 0 (0.0%) |
| 35 to 64 Years | 0 (0.0%) | 0 (0.0%) |
| 65 to 74 Years | 0 (0.0%) | 0 (0.0%) |
| 75 Years and over | 0 (0.0%) | 10 (22.2%) |
Technology Access in Fairview
Computing Device Access in Fairview
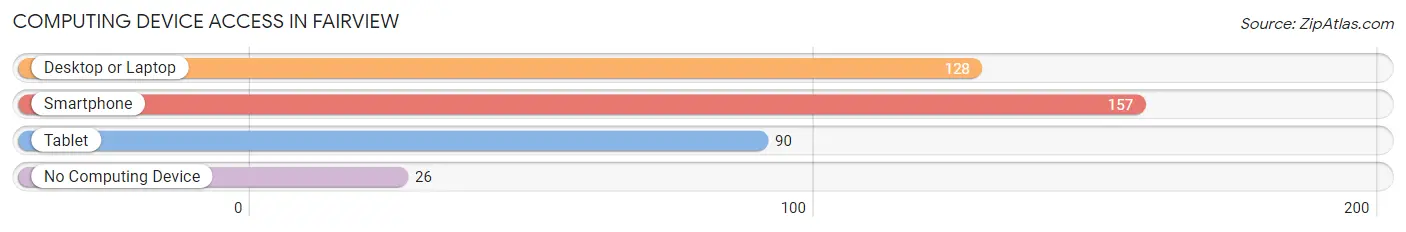
| Device Type | # Households | % Households |
| Desktop or Laptop | 128 | 59.8% |
| Smartphone | 157 | 73.4% |
| Tablet | 90 | 42.1% |
| No Computing Device | 26 | 12.1% |
| Total | 214 | 100.0% |
Internet Access in Fairview
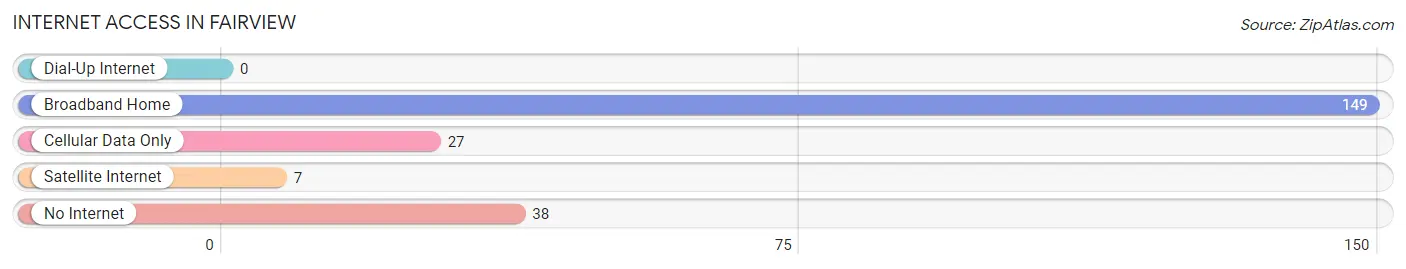
| Internet Type | # Households | % Households |
| Dial-Up Internet | 0 | 0.0% |
| Broadband Home | 149 | 69.6% |
| Cellular Data Only | 27 | 12.6% |
| Satellite Internet | 7 | 3.3% |
| No Internet | 38 | 17.8% |
| Total | 214 | 100.0% |
Fairview Summary
History
The city of Fairview, Oregon is located in Multnomah County, just east of Portland. It is a small city with a population of 8,920 as of the 2010 census. The city was founded in 1891 and was originally known as Fairview Station. The city was named after the nearby Fairview Farm, which was owned by the local postmaster.
The city was originally a farming community, but in the early 1900s, the city began to grow as a result of the construction of the Columbia River Highway. This highway connected Portland to the Columbia River Gorge, and it allowed for the development of the city.
In the 1920s, the city began to experience a population boom as a result of the construction of the Portland-Vancouver Interurban Railway. This railway connected Portland to Vancouver, Washington, and it allowed for the development of the city.
In the 1950s, the city experienced another population boom as a result of the construction of the Banfield Freeway. This freeway connected Portland to Gresham, and it allowed for the development of the city.
In the 1960s, the city experienced yet another population boom as a result of the construction of the I-205 Freeway. This freeway connected Portland to Vancouver, Washington, and it allowed for the development of the city.
In the 1970s, the city experienced yet another population boom as a result of the construction of the I-84 Freeway. This freeway connected Portland to The Dalles, and it allowed for the development of the city.
In the 1980s, the city experienced yet another population boom as a result of the construction of the I-5 Freeway. This freeway connected Portland to Seattle, and it allowed for the development of the city.
Geography
Fairview is located in Multnomah County, Oregon, just east of Portland. It is situated on the Columbia River, and it is bordered by the cities of Troutdale, Gresham, and Wood Village. The city is located in the foothills of the Cascade Mountains, and it is surrounded by forests and rivers.
The city has a total area of 4.2 square miles, and it has a population density of 2,093 people per square mile. The city is located at an elevation of 545 feet above sea level.
Economy
The economy of Fairview is largely based on the service industry. The city is home to a variety of restaurants, retail stores, and other businesses. The city is also home to a number of manufacturing companies, including a paper mill and a wood products plant.
The city is also home to a number of educational institutions, including a community college and a vocational school. The city is also home to a number of medical facilities, including a hospital and a number of clinics.
Demographics
As of the 2010 census, the population of Fairview was 8,920. The racial makeup of the city was 79.3% White, 8.2% African American, 0.7% Native American, 4.2% Asian, 0.2% Pacific Islander, and 6.6% from other races. The median household income was $50,945, and the median family income was $60,945.
The city is home to a variety of religious denominations, including Catholic, Protestant, and Jewish. The city is also home to a variety of ethnicities, including German, Irish, Italian, and Polish.
Conclusion
Fairview, Oregon is a small city located in Multnomah County, just east of Portland. The city was founded in 1891 and was originally known as Fairview Station. The city has experienced a number of population booms as a result of the construction of various highways and freeways. The economy of the city is largely based on the service industry, and the city is home to a variety of educational institutions, medical facilities, and other businesses. The population of the city is 8,920, and the racial makeup of the city is 79.3% White, 8.2% African American, 0.7% Native American, 4.2% Asian, 0.2% Pacific Islander, and 6.6% from other races. The city is home to a variety of religious denominations and ethnicities.
Common Questions
What is Per Capita Income in Fairview?
Per Capita income in Fairview is $20,012.
What is the Median Family Income in Fairview?
Median Family Income in Fairview is $49,259.
What is the Median Household income in Fairview?
Median Household Income in Fairview is $43,036.
What is Income or Wage Gap in Fairview?
Income or Wage Gap in Fairview is 20.6%.
Women in Fairview earn 79.4 cents for every dollar earned by a man.
What is Inequality or Gini Index in Fairview?
Inequality or Gini Index in Fairview is 0.24.
What is the Total Population of Fairview?
Total Population of Fairview is 495.
What is the Total Male Population of Fairview?
Total Male Population of Fairview is 155.
What is the Total Female Population of Fairview?
Total Female Population of Fairview is 340.
What is the Ratio of Males per 100 Females in Fairview?
There are 45.59 Males per 100 Females in Fairview.
What is the Ratio of Females per 100 Males in Fairview?
There are 219.35 Females per 100 Males in Fairview.
What is the Median Population Age in Fairview?
Median Population Age in Fairview is 34.9 Years.
What is the Average Family Size in Fairview
Average Family Size in Fairview is 3.2 People.
What is the Average Household Size in Fairview
Average Household Size in Fairview is 2.3 People.
How Large is the Labor Force in Fairview?
There are 248 People in the Labor Forcein in Fairview.
What is the Percentage of People in the Labor Force in Fairview?
59.6% of People are in the Labor Force in Fairview.
What is the Unemployment Rate in Fairview?
Unemployment Rate in Fairview is 11.7%.