Jessie, ND Map & Demographics
Jessie Map
Jessie Overview
$9,063
PER CAPITA INCOME
0.26
INEQUALITY / GINI INDEX
52
TOTAL POPULATION
43
MALE POPULATION
9
FEMALE POPULATION
477.78
MALES / 100 FEMALES
20.93
FEMALES / 100 MALES
13.4
MEDIAN AGE
5.3
AVG FAMILY SIZE
4.0
AVG HOUSEHOLD SIZE
19
LABOR FORCE [ PEOPLE ]
100.0%
PERCENT IN LABOR FORCE
21.1%
UNEMPLOYMENT RATE
Jessie Zip Codes
Jessie Area Codes
Income in Jessie
Income Overview in Jessie
| Characteristic | Number | Measure |
| Per Capita Income | 52 | $9,063 |
| Median Family Income | 9 | $0 |
| Mean Family Income | 9 | $0 |
| Median Household Income | 13 | $0 |
| Mean Household Income | 13 | $0 |
| Income Deficit | 9 | $0 |
| Wage / Income Gap (%) | 52 | 0.00% |
| Wage / Income Gap ($) | 52 | 100.00¢ per $1 |
| Gini / Inequality Index | 52 | 0.26 |
Earnings by Sex in Jessie
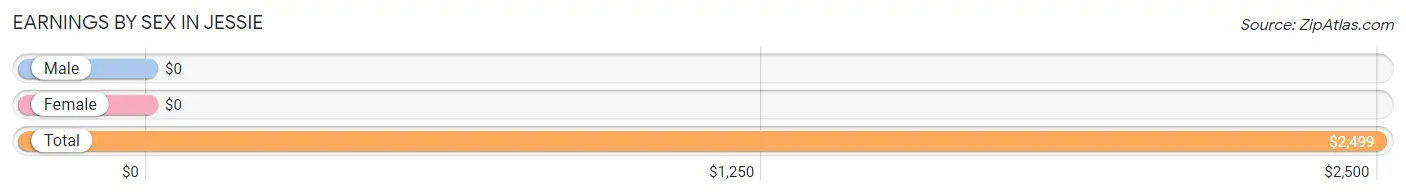
| Sex | Number | Average Earnings |
| Male | 10 (52.6%) | $0 |
| Female | 9 (47.4%) | $0 |
| Total | 19 (100.0%) | $2,499 |
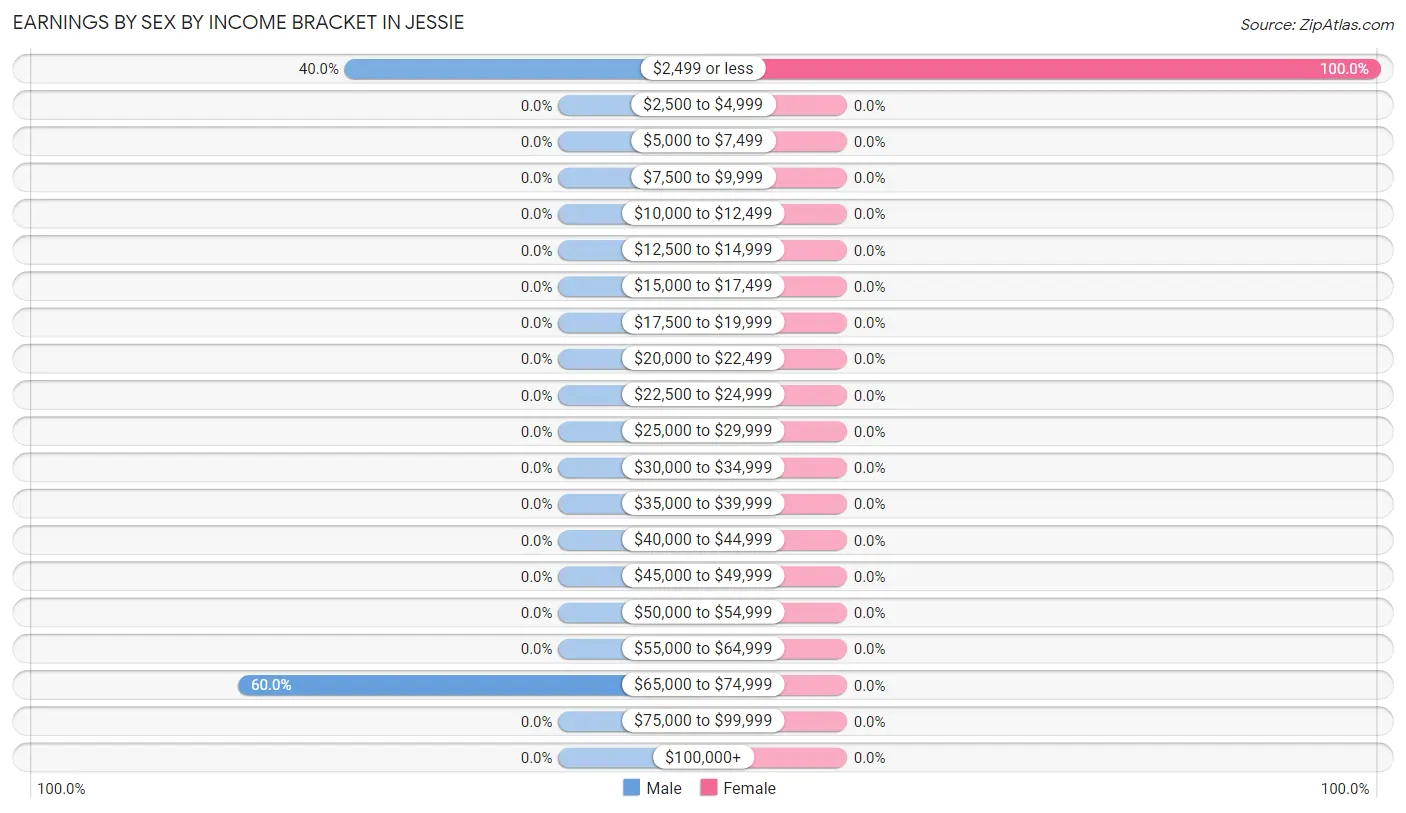
Earnings by Sex by Income Bracket in Jessie
The most common earnings brackets in Jessie are $65,000 to $74,999 for men (6 | 60.0%) and $2,499 or less for women (9 | 100.0%).
| Income | Male | Female |
| $2,499 or less | 4 (40.0%) | 9 (100.0%) |
| $2,500 to $4,999 | 0 (0.0%) | 0 (0.0%) |
| $5,000 to $7,499 | 0 (0.0%) | 0 (0.0%) |
| $7,500 to $9,999 | 0 (0.0%) | 0 (0.0%) |
| $10,000 to $12,499 | 0 (0.0%) | 0 (0.0%) |
| $12,500 to $14,999 | 0 (0.0%) | 0 (0.0%) |
| $15,000 to $17,499 | 0 (0.0%) | 0 (0.0%) |
| $17,500 to $19,999 | 0 (0.0%) | 0 (0.0%) |
| $20,000 to $22,499 | 0 (0.0%) | 0 (0.0%) |
| $22,500 to $24,999 | 0 (0.0%) | 0 (0.0%) |
| $25,000 to $29,999 | 0 (0.0%) | 0 (0.0%) |
| $30,000 to $34,999 | 0 (0.0%) | 0 (0.0%) |
| $35,000 to $39,999 | 0 (0.0%) | 0 (0.0%) |
| $40,000 to $44,999 | 0 (0.0%) | 0 (0.0%) |
| $45,000 to $49,999 | 0 (0.0%) | 0 (0.0%) |
| $50,000 to $54,999 | 0 (0.0%) | 0 (0.0%) |
| $55,000 to $64,999 | 0 (0.0%) | 0 (0.0%) |
| $65,000 to $74,999 | 6 (60.0%) | 0 (0.0%) |
| $75,000 to $99,999 | 0 (0.0%) | 0 (0.0%) |
| $100,000+ | 0 (0.0%) | 0 (0.0%) |
| Total | 10 (100.0%) | 9 (100.0%) |
Earnings by Sex by Educational Attainment in Jessie
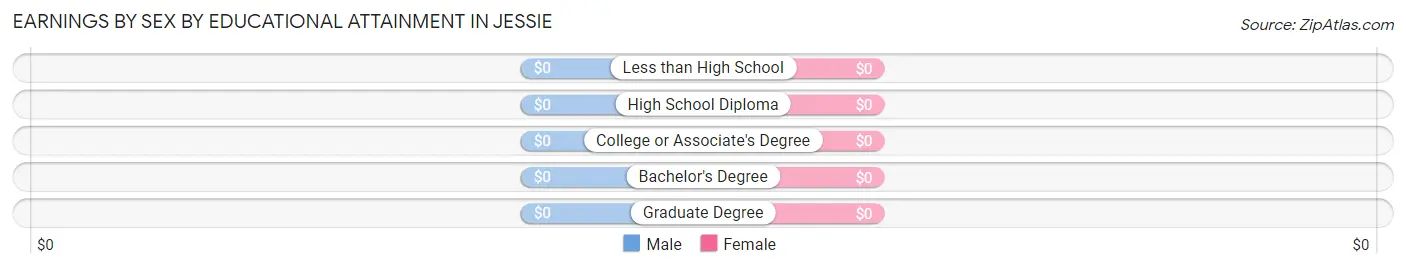
| Educational Attainment | Male Income | Female Income |
| Less than High School | - | - |
| High School Diploma | - | - |
| College or Associate's Degree | - | - |
| Bachelor's Degree | - | - |
| Graduate Degree | - | - |
| Total | - | - |
Family Income in Jessie
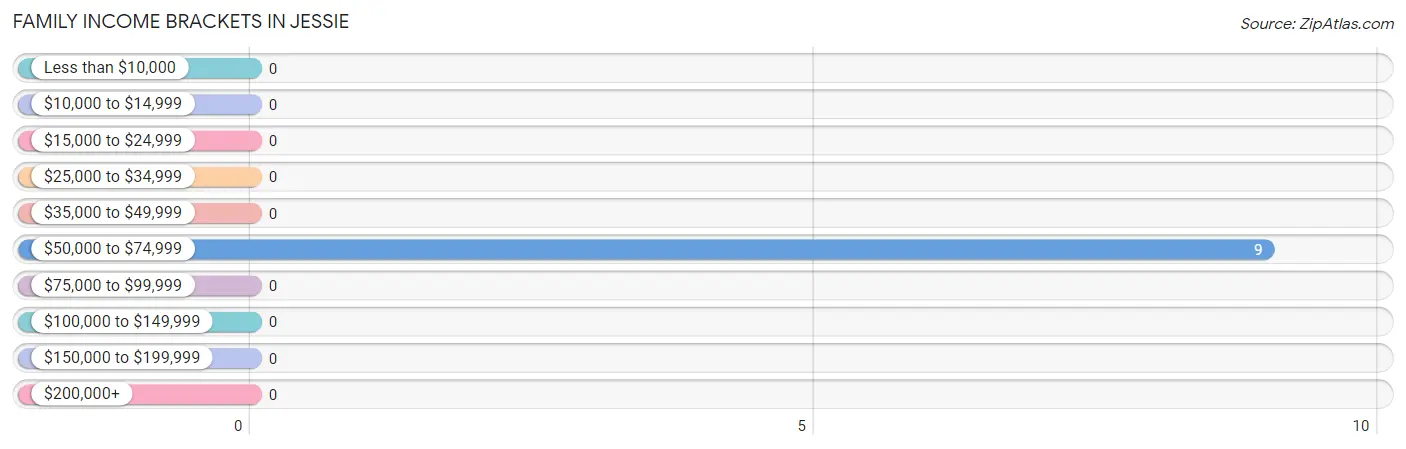
Family Income Brackets in Jessie
According to the Jessie family income data, there are 9 families falling into the $50,000 to $74,999 income range, which is the most common income bracket and makes up 100.0% of all families.
| Income Bracket | # Families | % Families |
| Less than $10,000 | 0 | 0.0% |
| $10,000 to $14,999 | 0 | 0.0% |
| $15,000 to $24,999 | 0 | 0.0% |
| $25,000 to $34,999 | 0 | 0.0% |
| $35,000 to $49,999 | 0 | 0.0% |
| $50,000 to $74,999 | 9 | 100.0% |
| $75,000 to $99,999 | 0 | 0.0% |
| $100,000 to $149,999 | 0 | 0.0% |
| $150,000 to $199,999 | 0 | 0.0% |
| $200,000+ | 0 | 0.0% |
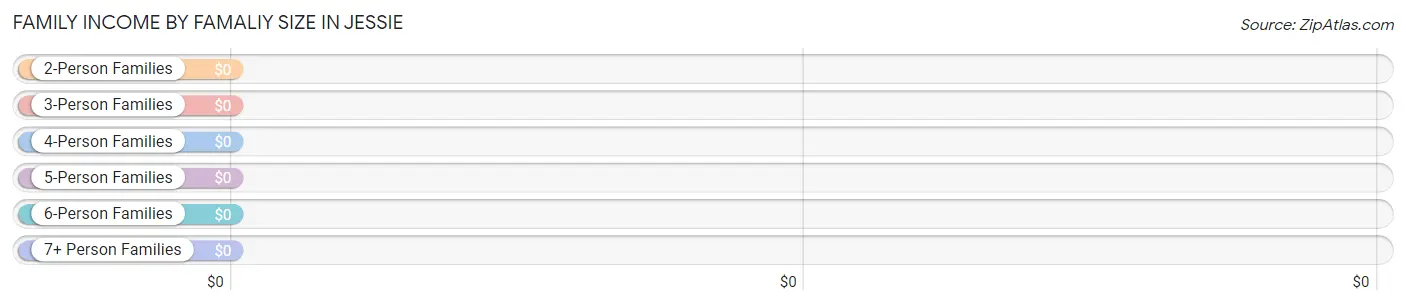
Family Income by Famaliy Size in Jessie
| Income Bracket | # Families | Median Income |
| 2-Person Families | 0 (0.0%) | $0 |
| 3-Person Families | 0 (0.0%) | $0 |
| 4-Person Families | 0 (0.0%) | $0 |
| 5-Person Families | 9 (100.0%) | $0 |
| 6-Person Families | 0 (0.0%) | $0 |
| 7+ Person Families | 0 (0.0%) | $0 |
| Total | 9 (100.0%) | $0 |
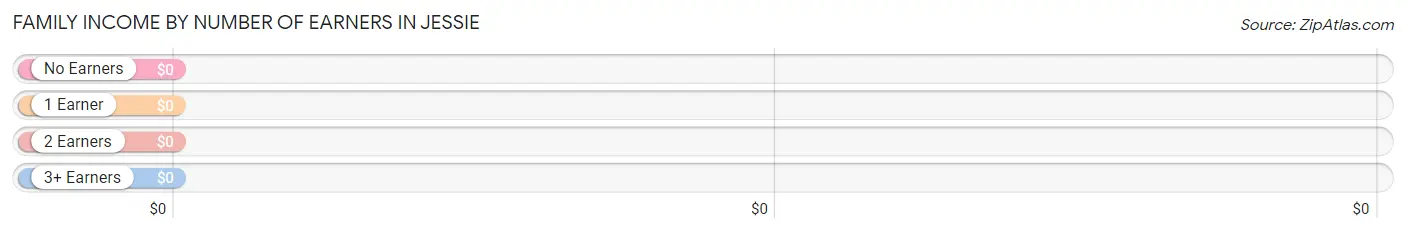
Family Income by Number of Earners in Jessie
| Number of Earners | # Families | Median Income |
| No Earners | 0 (0.0%) | $0 |
| 1 Earner | 0 (0.0%) | $0 |
| 2 Earners | 9 (100.0%) | $0 |
| 3+ Earners | 0 (0.0%) | $0 |
| Total | 9 (100.0%) | $0 |
Household Income in Jessie
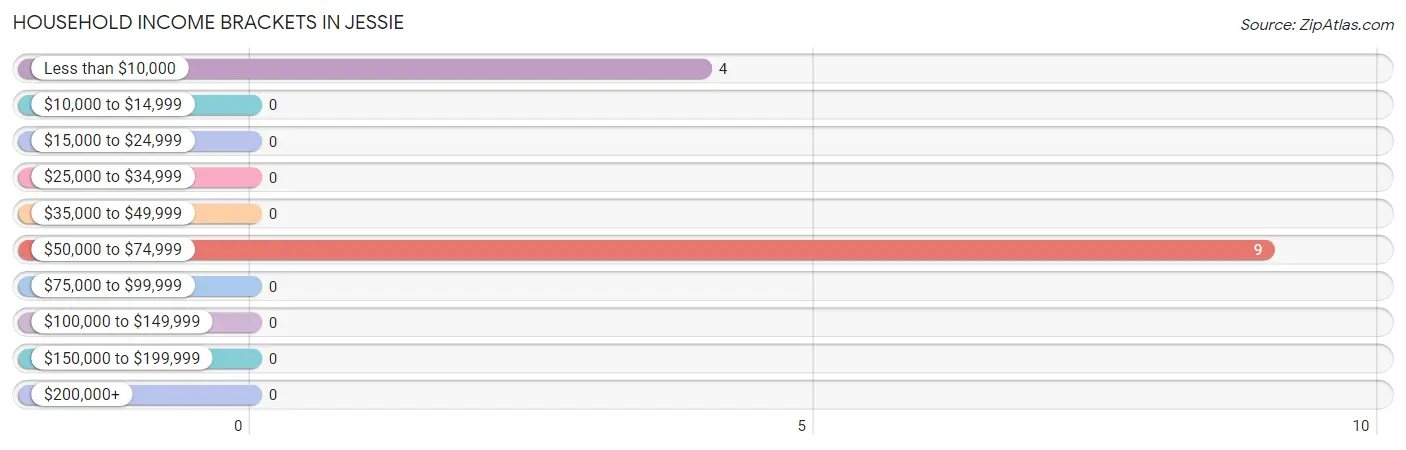
Household Income Brackets in Jessie
With 9 households falling in the category, the $50,000 to $74,999 income range is the most frequent in Jessie, accounting for 69.2% of all households.
| Income Bracket | # Households | % Households |
| Less than $10,000 | 4 | 30.8% |
| $10,000 to $14,999 | 0 | 0.0% |
| $15,000 to $24,999 | 0 | 0.0% |
| $25,000 to $34,999 | 0 | 0.0% |
| $35,000 to $49,999 | 0 | 0.0% |
| $50,000 to $74,999 | 9 | 69.2% |
| $75,000 to $99,999 | 0 | 0.0% |
| $100,000 to $149,999 | 0 | 0.0% |
| $150,000 to $199,999 | 0 | 0.0% |
| $200,000+ | 0 | 0.0% |
Household Income by Householder Age in Jessie
| Income Bracket | # Households | Median Income |
| 15 to 24 Years | 0 (0.0%) | $0 |
| 25 to 44 Years | 9 (69.2%) | $0 |
| 45 to 64 Years | 0 (0.0%) | $0 |
| 65+ Years | 4 (30.8%) | $0 |
| Total | 13 (100.0%) | $0 |
Poverty in Jessie
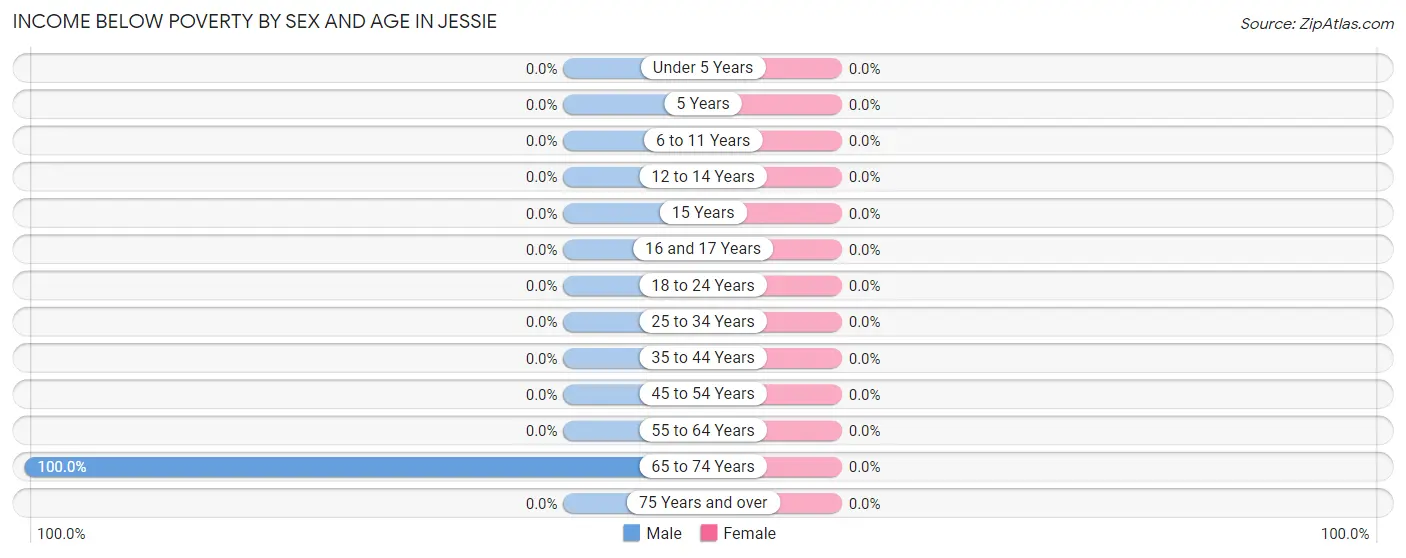
Income Below Poverty by Sex and Age in Jessie
| Age Bracket | Male | Female |
| Under 5 Years | 0 (0.0%) | 0 (0.0%) |
| 5 Years | 0 (0.0%) | 0 (0.0%) |
| 6 to 11 Years | 0 (0.0%) | 0 (0.0%) |
| 12 to 14 Years | 0 (0.0%) | 0 (0.0%) |
| 15 Years | 0 (0.0%) | 0 (0.0%) |
| 16 and 17 Years | 0 (0.0%) | 0 (0.0%) |
| 18 to 24 Years | 0 (0.0%) | 0 (0.0%) |
| 25 to 34 Years | 0 (0.0%) | 0 (0.0%) |
| 35 to 44 Years | 0 (0.0%) | 0 (0.0%) |
| 45 to 54 Years | 0 (0.0%) | 0 (0.0%) |
| 55 to 64 Years | 0 (0.0%) | 0 (0.0%) |
| 65 to 74 Years | 4 (100.0%) | 0 (0.0%) |
| 75 Years and over | 0 (0.0%) | 0 (0.0%) |
| Total | 4 (9.3%) | 0 (0.0%) |
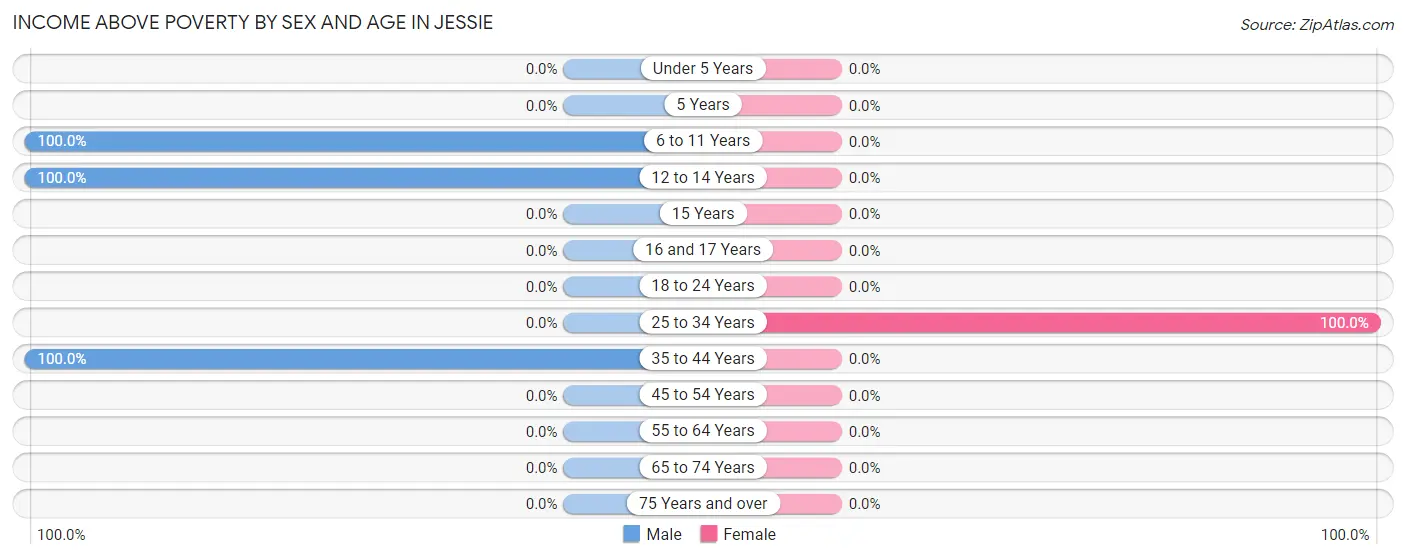
Income Above Poverty by Sex and Age in Jessie
According to the poverty statistics in Jessie, males aged 6 to 11 years and females aged 25 to 34 years are the age groups that are most secure financially, with 100.0% of males and 100.0% of females in these age groups living above the poverty line.
| Age Bracket | Male | Female |
| Under 5 Years | 0 (0.0%) | 0 (0.0%) |
| 5 Years | 0 (0.0%) | 0 (0.0%) |
| 6 to 11 Years | 22 (100.0%) | 0 (0.0%) |
| 12 to 14 Years | 11 (100.0%) | 0 (0.0%) |
| 15 Years | 0 (0.0%) | 0 (0.0%) |
| 16 and 17 Years | 0 (0.0%) | 0 (0.0%) |
| 18 to 24 Years | 0 (0.0%) | 0 (0.0%) |
| 25 to 34 Years | 0 (0.0%) | 9 (100.0%) |
| 35 to 44 Years | 6 (100.0%) | 0 (0.0%) |
| 45 to 54 Years | 0 (0.0%) | 0 (0.0%) |
| 55 to 64 Years | 0 (0.0%) | 0 (0.0%) |
| 65 to 74 Years | 0 (0.0%) | 0 (0.0%) |
| 75 Years and over | 0 (0.0%) | 0 (0.0%) |
| Total | 39 (90.7%) | 9 (100.0%) |
Income Below Poverty Among Married-Couple Families in Jessie
| Children | Above Poverty | Below Poverty |
| No Children | 0 (0.0%) | 0 (0.0%) |
| 1 or 2 Children | 0 (0.0%) | 0 (0.0%) |
| 3 or 4 Children | 9 (100.0%) | 0 (0.0%) |
| 5 or more Children | 0 (0.0%) | 0 (0.0%) |
| Total | 9 (100.0%) | 0 (0.0%) |
Income Below Poverty Among Single-Parent Households in Jessie
| Children | Single Father | Single Mother |
| No Children | 0 (0.0%) | 0 (0.0%) |
| 1 or 2 Children | 0 (0.0%) | 0 (0.0%) |
| 3 or 4 Children | 0 (0.0%) | 0 (0.0%) |
| 5 or more Children | 0 (0.0%) | 0 (0.0%) |
| Total | 0 (0.0%) | 0 (0.0%) |
Income Below Poverty Among Married-Couple vs Single-Parent Households in Jessie
| Children | Married-Couple Families | Single-Parent Households |
| No Children | 0 (0.0%) | 0 (0.0%) |
| 1 or 2 Children | 0 (0.0%) | 0 (0.0%) |
| 3 or 4 Children | 0 (0.0%) | 0 (0.0%) |
| 5 or more Children | 0 (0.0%) | 0 (0.0%) |
| Total | 0 (0.0%) | 0 (0.0%) |
Race in Jessie
The most populous races in Jessie are , and White / Caucasian (52 | 100.0%).
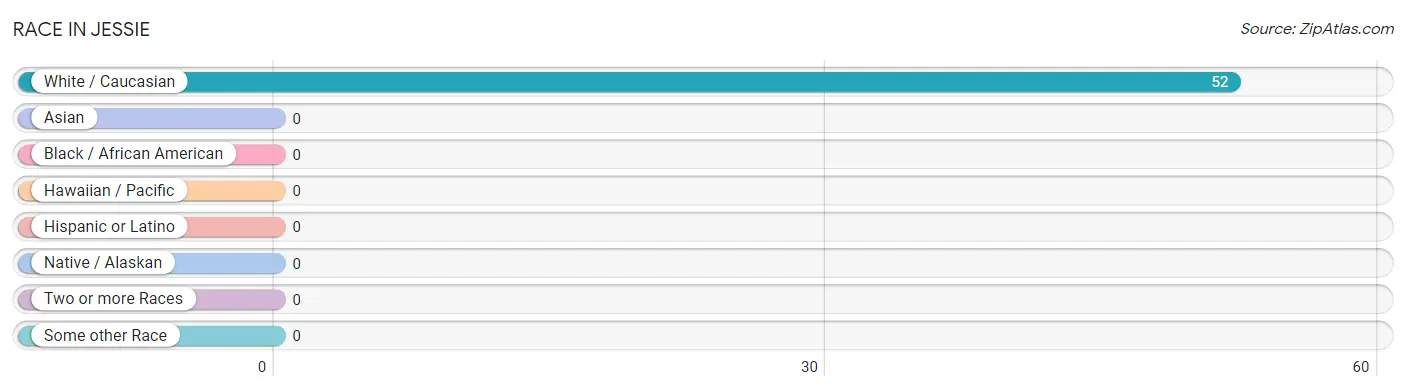
| Race | # Population | % Population |
| Asian | 0 | 0.0% |
| Black / African American | 0 | 0.0% |
| Hawaiian / Pacific | 0 | 0.0% |
| Hispanic or Latino | 0 | 0.0% |
| Native / Alaskan | 0 | 0.0% |
| White / Caucasian | 52 | 100.0% |
| Two or more Races | 0 | 0.0% |
| Some other Race | 0 | 0.0% |
| Total | 52 | 100.0% |
Ancestry in Jessie
The most populous ancestries reported in Jessie are German (4 | 7.7%), and Italian (4 | 7.7%), together accounting for 15.4% of all Jessie residents.
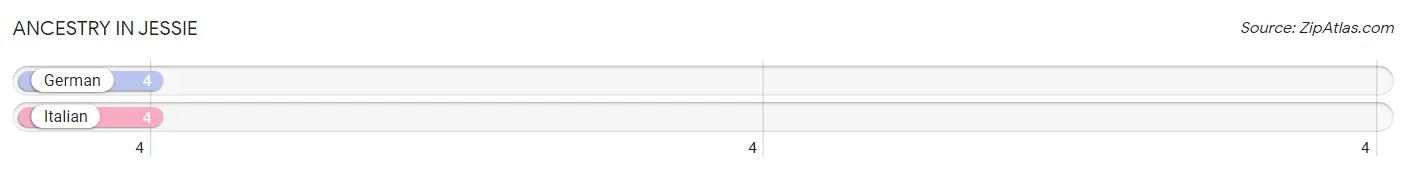
| Ancestry | # Population | % Population |
| German | 4 | 7.7% |
| Italian | 4 | 7.7% | View All 2 Rows |
Immigrants in Jessie

| Immigration Origin | # Population | % Population | View All 0 Rows |
Sex and Age in Jessie
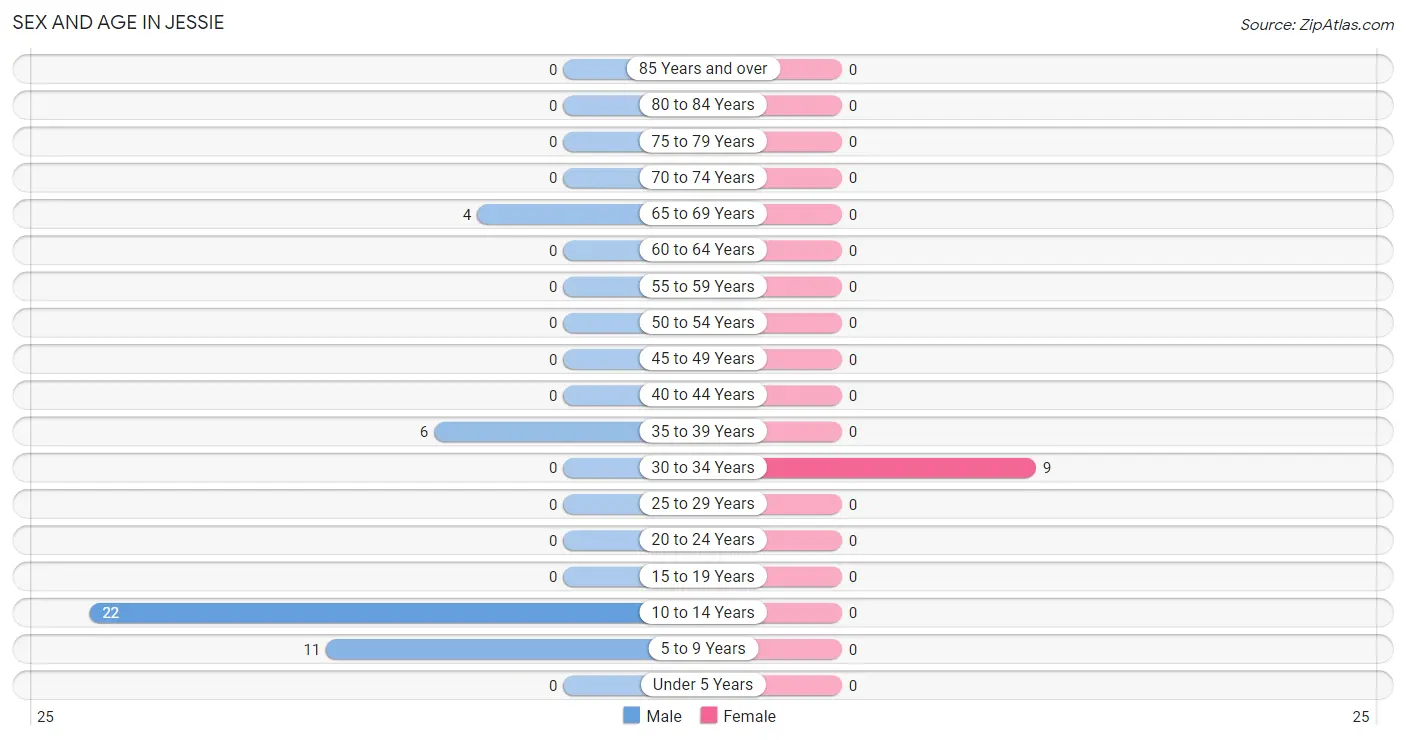
Sex and Age in Jessie
The most populous age groups in Jessie are 10 to 14 Years (22 | 51.2%) for men and 30 to 34 Years (9 | 100.0%) for women.
| Age Bracket | Male | Female |
| Under 5 Years | 0 (0.0%) | 0 (0.0%) |
| 5 to 9 Years | 11 (25.6%) | 0 (0.0%) |
| 10 to 14 Years | 22 (51.2%) | 0 (0.0%) |
| 15 to 19 Years | 0 (0.0%) | 0 (0.0%) |
| 20 to 24 Years | 0 (0.0%) | 0 (0.0%) |
| 25 to 29 Years | 0 (0.0%) | 0 (0.0%) |
| 30 to 34 Years | 0 (0.0%) | 9 (100.0%) |
| 35 to 39 Years | 6 (14.0%) | 0 (0.0%) |
| 40 to 44 Years | 0 (0.0%) | 0 (0.0%) |
| 45 to 49 Years | 0 (0.0%) | 0 (0.0%) |
| 50 to 54 Years | 0 (0.0%) | 0 (0.0%) |
| 55 to 59 Years | 0 (0.0%) | 0 (0.0%) |
| 60 to 64 Years | 0 (0.0%) | 0 (0.0%) |
| 65 to 69 Years | 4 (9.3%) | 0 (0.0%) |
| 70 to 74 Years | 0 (0.0%) | 0 (0.0%) |
| 75 to 79 Years | 0 (0.0%) | 0 (0.0%) |
| 80 to 84 Years | 0 (0.0%) | 0 (0.0%) |
| 85 Years and over | 0 (0.0%) | 0 (0.0%) |
| Total | 43 (100.0%) | 9 (100.0%) |
Families and Households in Jessie
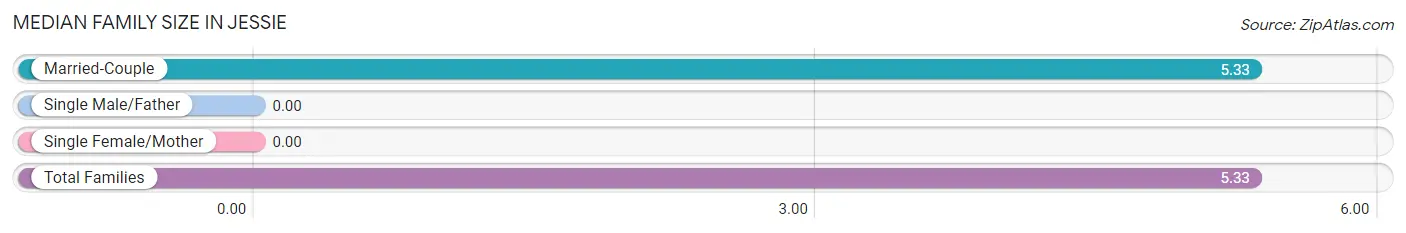
Median Family Size in Jessie
| Family Type | # Families | Family Size |
| Married-Couple | 9 (100.0%) | 5.33 |
| Single Male/Father | 0 (0.0%) | - |
| Single Female/Mother | 0 (0.0%) | - |
| Total Families | 9 (100.0%) | 5.33 |
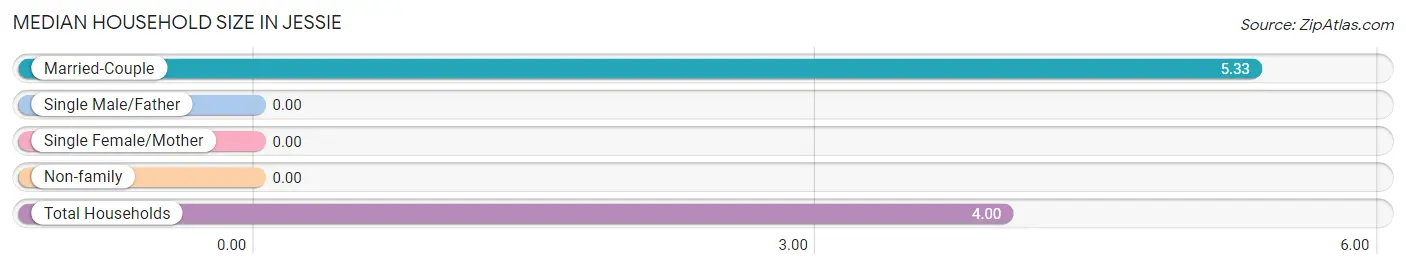
Median Household Size in Jessie
| Household Type | # Households | Household Size |
| Married-Couple | 9 (69.2%) | 5.33 |
| Single Male/Father | 0 (0.0%) | - |
| Single Female/Mother | 0 (0.0%) | - |
| Non-family | 4 (30.8%) | - |
| Total Households | 13 (100.0%) | 4.00 |
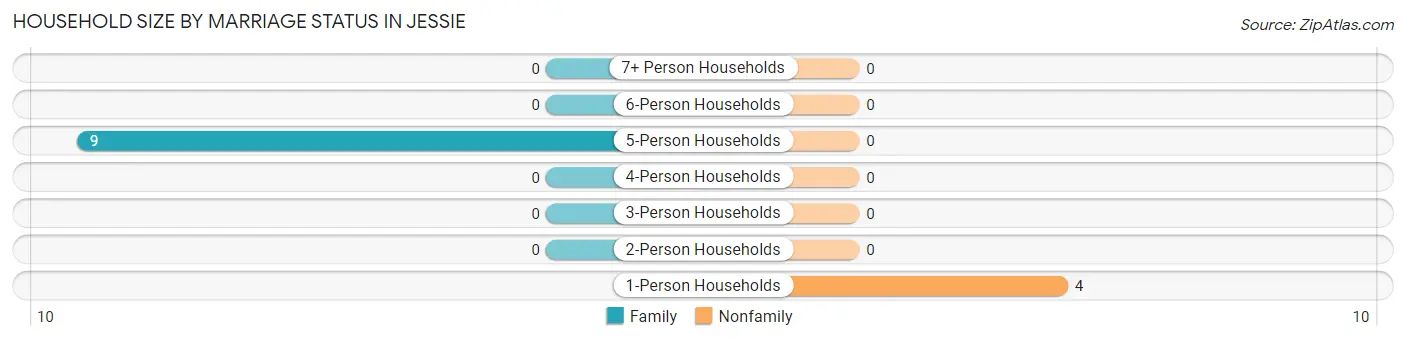
Household Size by Marriage Status in Jessie
Out of a total of 13 households in Jessie, 9 (69.2%) are family households, while 4 (30.8%) are nonfamily households. The most numerous type of family households are 5-person households, comprising 9, and the most common type of nonfamily households are 1-person households, comprising 4.
| Household Size | Family Households | Nonfamily Households |
| 1-Person Households | - | 4 (30.8%) |
| 2-Person Households | 0 (0.0%) | 0 (0.0%) |
| 3-Person Households | 0 (0.0%) | 0 (0.0%) |
| 4-Person Households | 0 (0.0%) | 0 (0.0%) |
| 5-Person Households | 9 (69.2%) | 0 (0.0%) |
| 6-Person Households | 0 (0.0%) | 0 (0.0%) |
| 7+ Person Households | 0 (0.0%) | 0 (0.0%) |
| Total | 9 (69.2%) | 4 (30.8%) |
Female Fertility in Jessie
Fertility by Age in Jessie
| Age Bracket | Women with Births | Births / 1,000 Women |
| 15 to 19 years | 0 (0.0%) | 0.0 |
| 20 to 34 years | 0 (0.0%) | 0.0 |
| 35 to 50 years | 0 (0.0%) | 0.0 |
| Total | 0 (0.0%) | 0.0 |
Fertility by Age by Marriage Status in Jessie
| Age Bracket | Married | Unmarried |
| 15 to 19 years | 0 (0.0%) | 0 (0.0%) |
| 20 to 34 years | 0 (0.0%) | 0 (0.0%) |
| 35 to 50 years | 0 (0.0%) | 0 (0.0%) |
| Total | 0 (0.0%) | 0 (0.0%) |
Fertility by Education in Jessie
| Educational Attainment | Women with Births | Births / 1,000 Women |
| Less than High School | 0 (0.0%) | 0.0 |
| High School Diploma | 0 (0.0%) | 0.0 |
| College or Associate's Degree | 0 (0.0%) | 0.0 |
| Bachelor's Degree | 0 (0.0%) | 0.0 |
| Graduate Degree | 0 (0.0%) | 0.0 |
| Total | 0 (0.0%) | 0.0 |
Fertility by Education by Marriage Status in Jessie
| Educational Attainment | Married | Unmarried |
| Less than High School | 0 (0.0%) | 0 (0.0%) |
| High School Diploma | 0 (0.0%) | 0 (0.0%) |
| College or Associate's Degree | 0 (0.0%) | 0 (0.0%) |
| Bachelor's Degree | 0 (0.0%) | 0 (0.0%) |
| Graduate Degree | 0 (0.0%) | 0 (0.0%) |
| Total | 0 (0.0%) | 0 (0.0%) |
Employment Characteristics in Jessie
Employment by Class of Employer in Jessie
Among the 15 employed individuals in Jessie, self-employed (not incorporated) (9 | 60.0%), and private company employees (6 | 40.0%) make up the most common classes of employment.
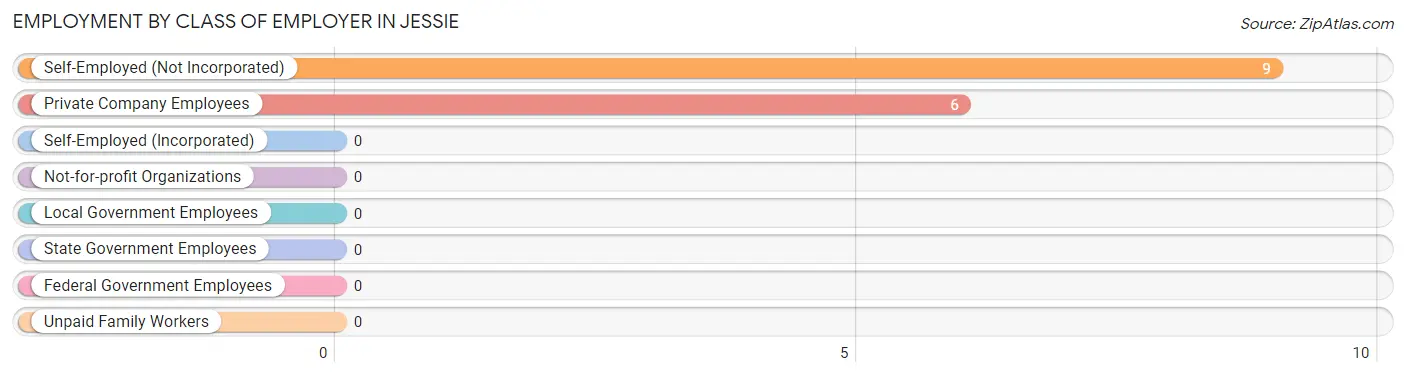
| Employer Class | # Employees | % Employees |
| Private Company Employees | 6 | 40.0% |
| Self-Employed (Incorporated) | 0 | 0.0% |
| Self-Employed (Not Incorporated) | 9 | 60.0% |
| Not-for-profit Organizations | 0 | 0.0% |
| Local Government Employees | 0 | 0.0% |
| State Government Employees | 0 | 0.0% |
| Federal Government Employees | 0 | 0.0% |
| Unpaid Family Workers | 0 | 0.0% |
| Total | 15 | 100.0% |
Employment Status by Age in Jessie
According to the labor force statistics for Jessie, out of the total population over 16 years of age (19), 100.0% or 19 individuals are in the labor force, with 21.1% or 4 of them unemployed. The age group with the highest labor force participation rate is 30 to 34 years, with 100.0% or 9 individuals in the labor force. Within the labor force, the 65 to 74 years age range has the highest percentage of unemployed individuals, with 100.0% or 4 of them being unemployed.
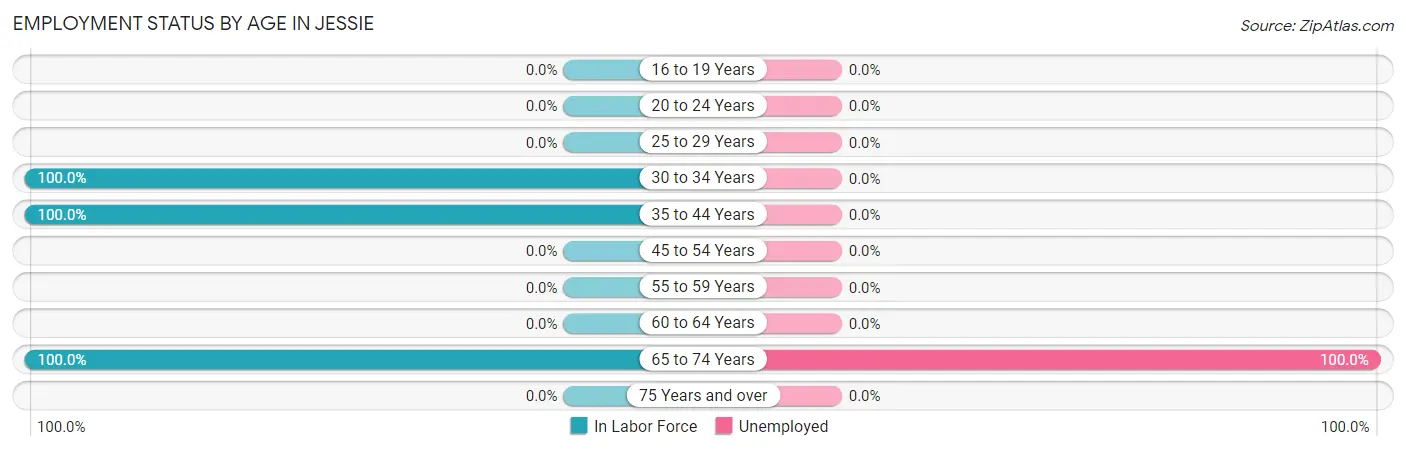
| Age Bracket | In Labor Force | Unemployed |
| 16 to 19 Years | 0 (0.0%) | 0 (0.0%) |
| 20 to 24 Years | 0 (0.0%) | 0 (0.0%) |
| 25 to 29 Years | 0 (0.0%) | 0 (0.0%) |
| 30 to 34 Years | 9 (100.0%) | 0 (0.0%) |
| 35 to 44 Years | 6 (100.0%) | 0 (0.0%) |
| 45 to 54 Years | 0 (0.0%) | 0 (0.0%) |
| 55 to 59 Years | 0 (0.0%) | 0 (0.0%) |
| 60 to 64 Years | 0 (0.0%) | 0 (0.0%) |
| 65 to 74 Years | 4 (100.0%) | 4 (100.0%) |
| 75 Years and over | 0 (0.0%) | 0 (0.0%) |
| Total | 19 (100.0%) | 4 (21.1%) |
Employment Status by Educational Attainment in Jessie
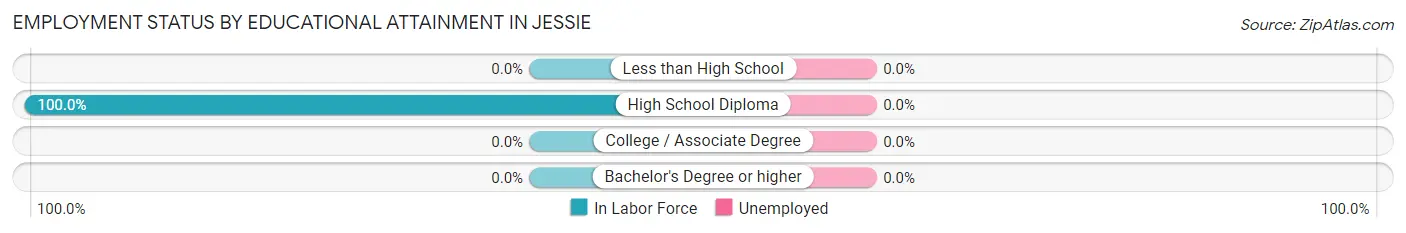
| Educational Attainment | In Labor Force | Unemployed |
| Less than High School | 0 (0.0%) | 0 (0.0%) |
| High School Diploma | 15 (100.0%) | 0 (0.0%) |
| College / Associate Degree | 0 (0.0%) | 0 (0.0%) |
| Bachelor's Degree or higher | 0 (0.0%) | 0 (0.0%) |
| Total | 15 (100.0%) | 0 (0.0%) |
Employment Occupations by Sex in Jessie
Management, Business, Science and Arts Occupations
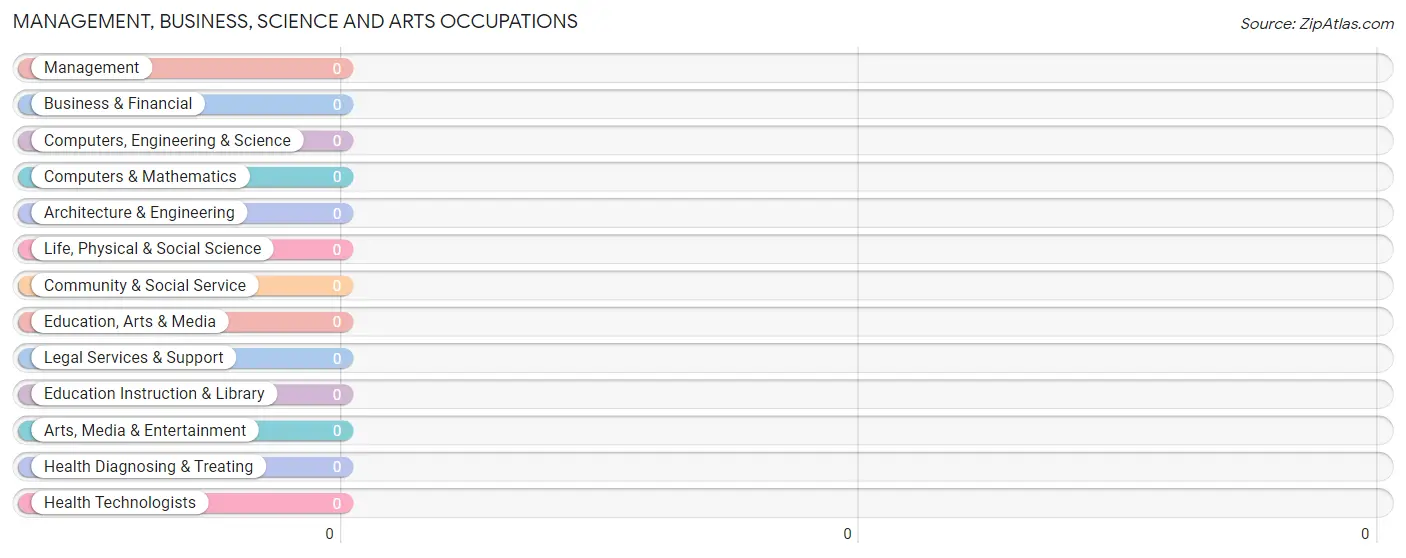
Management, Business, Science and Arts Occupations by Sex
| Occupation | Male | Female |
| Management | 0 (0.0%) | 0 (0.0%) |
| Business & Financial | 0 (0.0%) | 0 (0.0%) |
| Computers, Engineering & Science | 0 (0.0%) | 0 (0.0%) |
| Computers & Mathematics | 0 (0.0%) | 0 (0.0%) |
| Architecture & Engineering | 0 (0.0%) | 0 (0.0%) |
| Life, Physical & Social Science | 0 (0.0%) | 0 (0.0%) |
| Community & Social Service | 0 (0.0%) | 0 (0.0%) |
| Education, Arts & Media | 0 (0.0%) | 0 (0.0%) |
| Legal Services & Support | 0 (0.0%) | 0 (0.0%) |
| Education Instruction & Library | 0 (0.0%) | 0 (0.0%) |
| Arts, Media & Entertainment | 0 (0.0%) | 0 (0.0%) |
| Health Diagnosing & Treating | 0 (0.0%) | 0 (0.0%) |
| Health Technologists | 0 (0.0%) | 0 (0.0%) |
| Total (Category) | 0 (0.0%) | 0 (0.0%) |
| Total (Overall) | 6 (40.0%) | 9 (60.0%) |
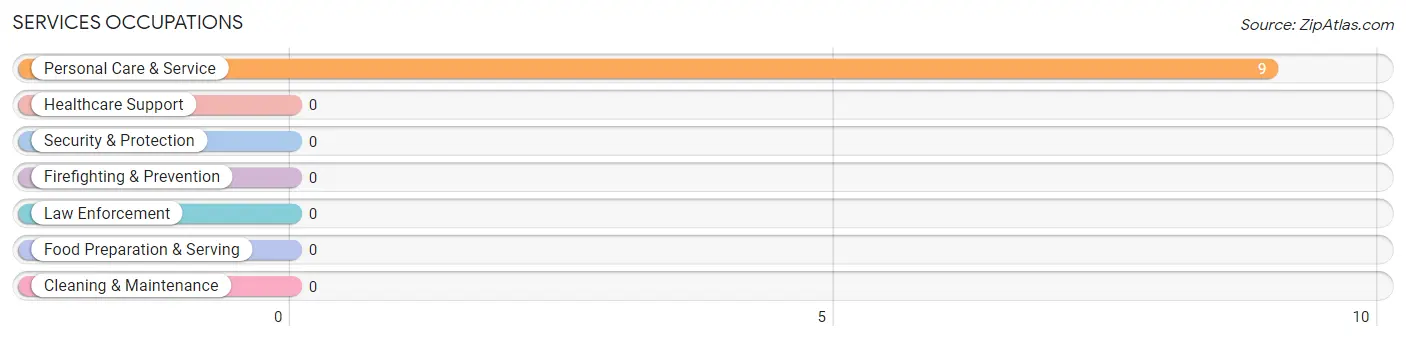
Services Occupations
The most common Services occupations in Jessie are , and Personal Care & Service (9 | 60.0%).
Services Occupations by Sex
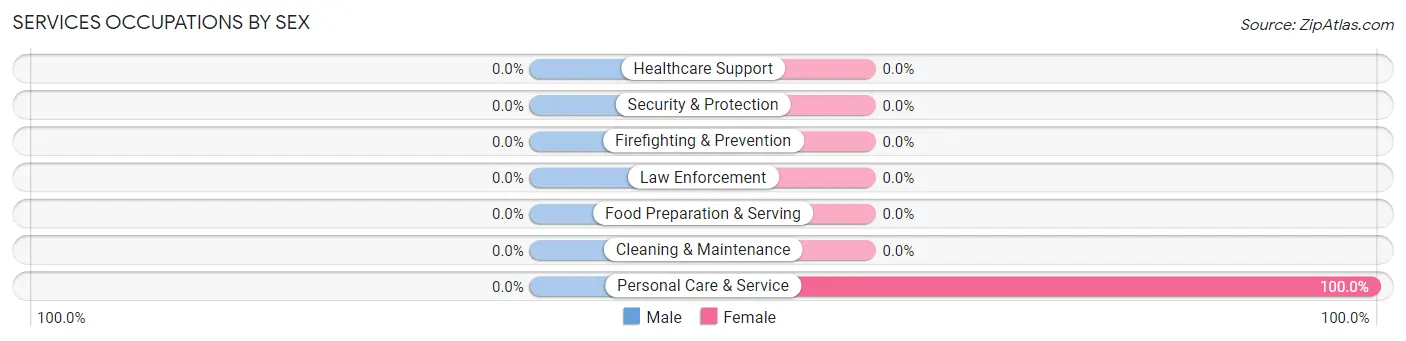
| Occupation | Male | Female |
| Healthcare Support | 0 (0.0%) | 0 (0.0%) |
| Security & Protection | 0 (0.0%) | 0 (0.0%) |
| Firefighting & Prevention | 0 (0.0%) | 0 (0.0%) |
| Law Enforcement | 0 (0.0%) | 0 (0.0%) |
| Food Preparation & Serving | 0 (0.0%) | 0 (0.0%) |
| Cleaning & Maintenance | 0 (0.0%) | 0 (0.0%) |
| Personal Care & Service | 0 (0.0%) | 9 (100.0%) |
| Total (Category) | 0 (0.0%) | 9 (100.0%) |
| Total (Overall) | 6 (40.0%) | 9 (60.0%) |
Sales and Office Occupations
Sales and Office Occupations by Sex
| Occupation | Male | Female |
| Sales & Related | 0 (0.0%) | 0 (0.0%) |
| Office & Administration | 0 (0.0%) | 0 (0.0%) |
| Total (Category) | 0 (0.0%) | 0 (0.0%) |
| Total (Overall) | 6 (40.0%) | 9 (60.0%) |
Natural Resources, Construction and Maintenance Occupations
Natural Resources, Construction and Maintenance Occupations by Sex
| Occupation | Male | Female |
| Farming, Fishing & Forestry | 0 (0.0%) | 0 (0.0%) |
| Construction & Extraction | 0 (0.0%) | 0 (0.0%) |
| Installation, Maintenance & Repair | 0 (0.0%) | 0 (0.0%) |
| Total (Category) | 0 (0.0%) | 0 (0.0%) |
| Total (Overall) | 6 (40.0%) | 9 (60.0%) |
Production, Transportation and Moving Occupations
The most common Production, Transportation and Moving occupations in Jessie are , and Material Moving (6 | 40.0%).
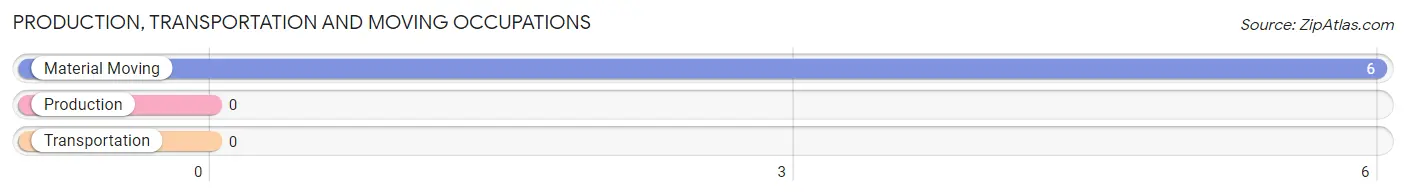
Production, Transportation and Moving Occupations by Sex
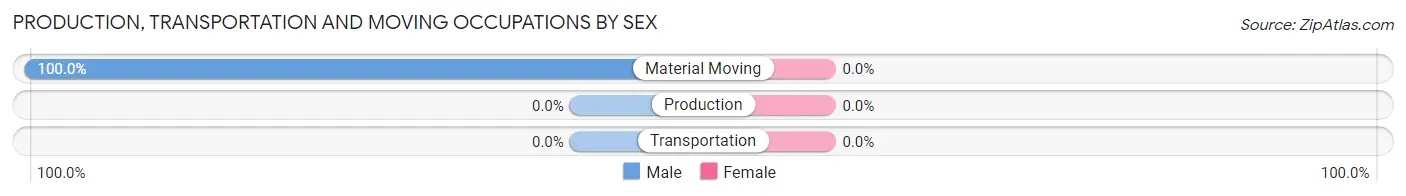
| Occupation | Male | Female |
| Production | 0 (0.0%) | 0 (0.0%) |
| Transportation | 0 (0.0%) | 0 (0.0%) |
| Material Moving | 6 (100.0%) | 0 (0.0%) |
| Total (Category) | 6 (100.0%) | 0 (0.0%) |
| Total (Overall) | 6 (40.0%) | 9 (60.0%) |
Employment Industries by Sex in Jessie
Employment Industries in Jessie
The major employment industries in Jessie include Health Care & Social Assistance (9 | 60.0%), and Wholesale Trade (6 | 40.0%).
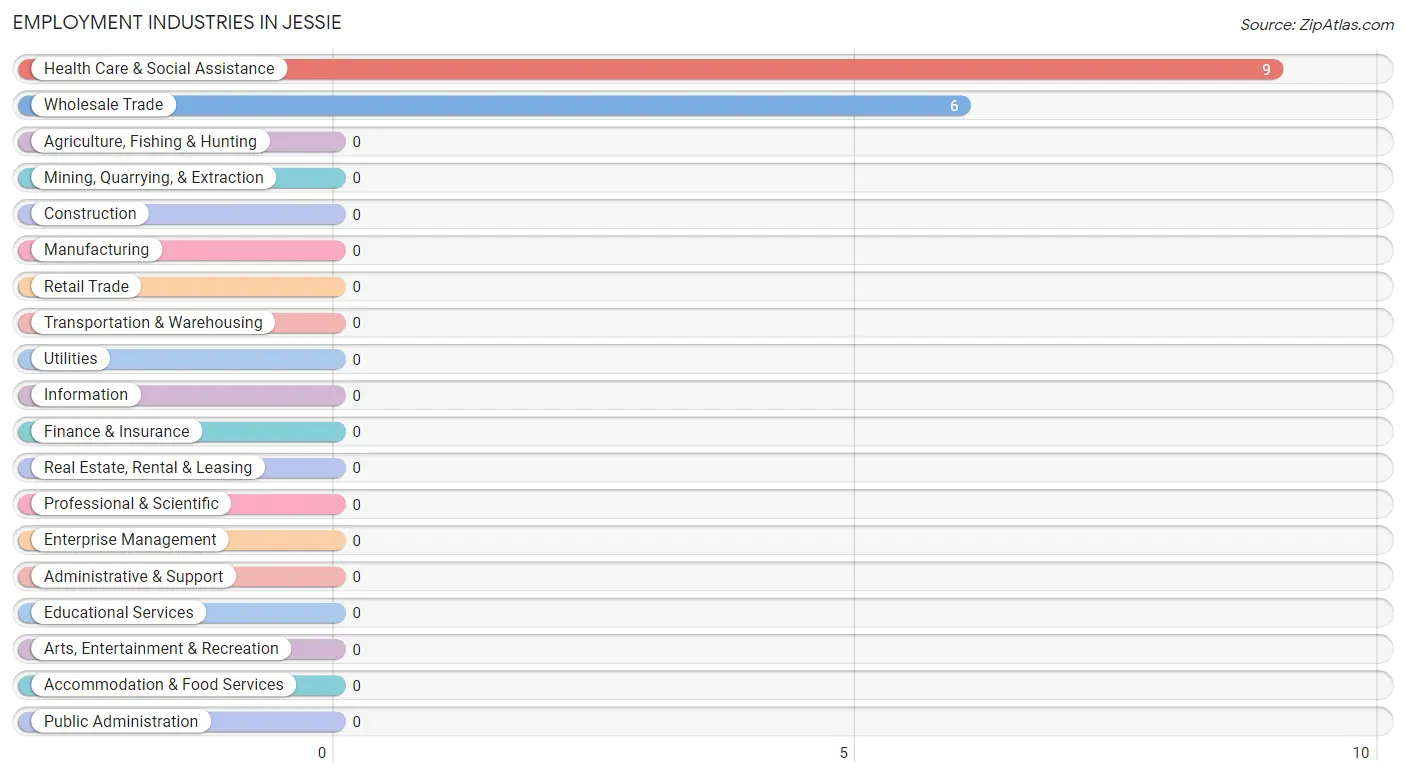
Employment Industries by Sex in Jessie
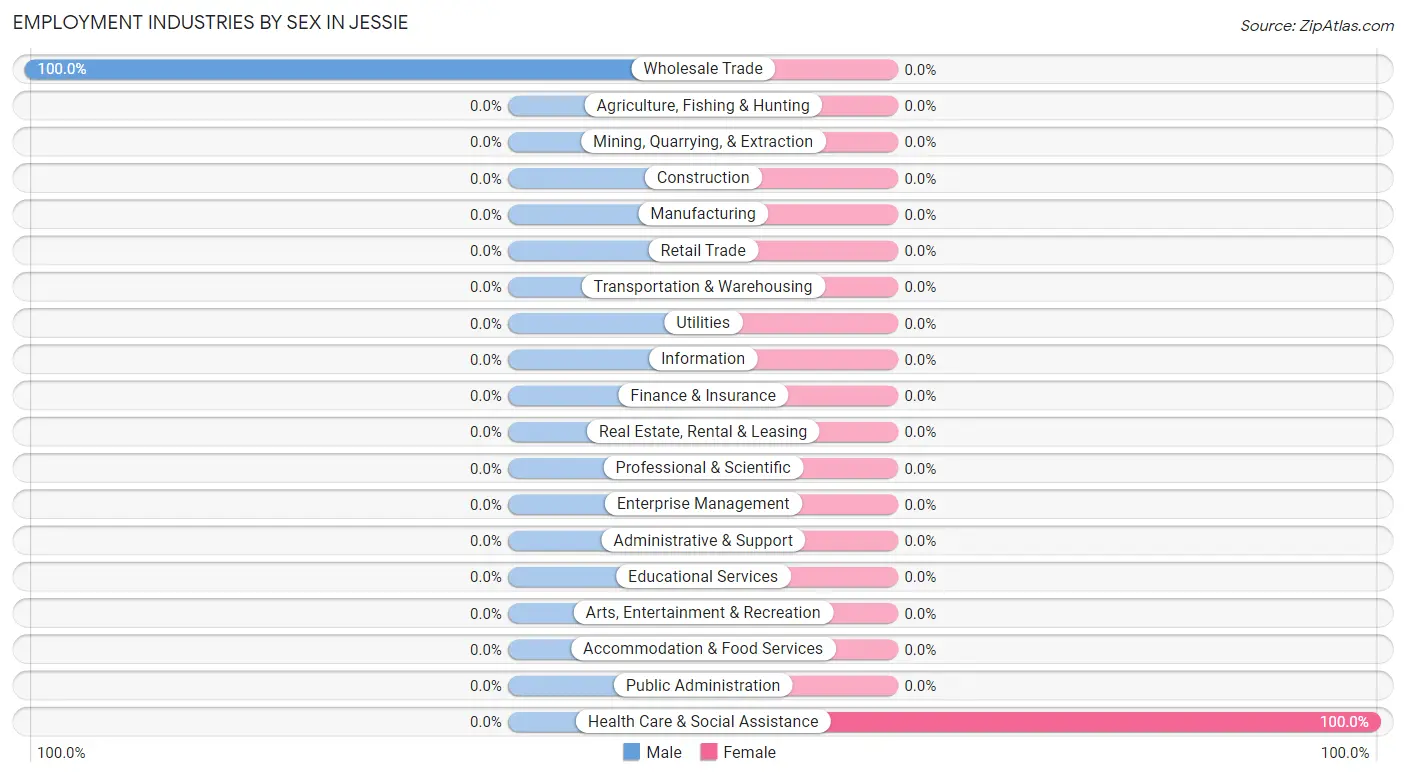
| Industry | Male | Female |
| Agriculture, Fishing & Hunting | 0 (0.0%) | 0 (0.0%) |
| Mining, Quarrying, & Extraction | 0 (0.0%) | 0 (0.0%) |
| Construction | 0 (0.0%) | 0 (0.0%) |
| Manufacturing | 0 (0.0%) | 0 (0.0%) |
| Wholesale Trade | 6 (100.0%) | 0 (0.0%) |
| Retail Trade | 0 (0.0%) | 0 (0.0%) |
| Transportation & Warehousing | 0 (0.0%) | 0 (0.0%) |
| Utilities | 0 (0.0%) | 0 (0.0%) |
| Information | 0 (0.0%) | 0 (0.0%) |
| Finance & Insurance | 0 (0.0%) | 0 (0.0%) |
| Real Estate, Rental & Leasing | 0 (0.0%) | 0 (0.0%) |
| Professional & Scientific | 0 (0.0%) | 0 (0.0%) |
| Enterprise Management | 0 (0.0%) | 0 (0.0%) |
| Administrative & Support | 0 (0.0%) | 0 (0.0%) |
| Educational Services | 0 (0.0%) | 0 (0.0%) |
| Health Care & Social Assistance | 0 (0.0%) | 9 (100.0%) |
| Arts, Entertainment & Recreation | 0 (0.0%) | 0 (0.0%) |
| Accommodation & Food Services | 0 (0.0%) | 0 (0.0%) |
| Public Administration | 0 (0.0%) | 0 (0.0%) |
| Total | 6 (40.0%) | 9 (60.0%) |
Education in Jessie
School Enrollment in Jessie
The most common levels of schooling among the 33 students in Jessie are elementary school (22 | 66.7%), and middle school (11 | 33.3%).
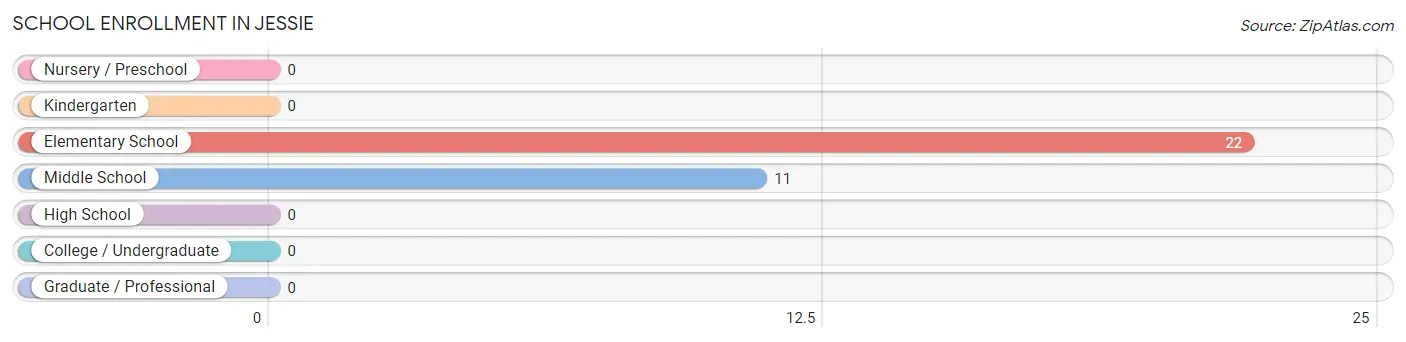
| School Level | # Students | % Students |
| Nursery / Preschool | 0 | 0.0% |
| Kindergarten | 0 | 0.0% |
| Elementary School | 22 | 66.7% |
| Middle School | 11 | 33.3% |
| High School | 0 | 0.0% |
| College / Undergraduate | 0 | 0.0% |
| Graduate / Professional | 0 | 0.0% |
| Total | 33 | 100.0% |
School Enrollment by Age by Funding Source in Jessie
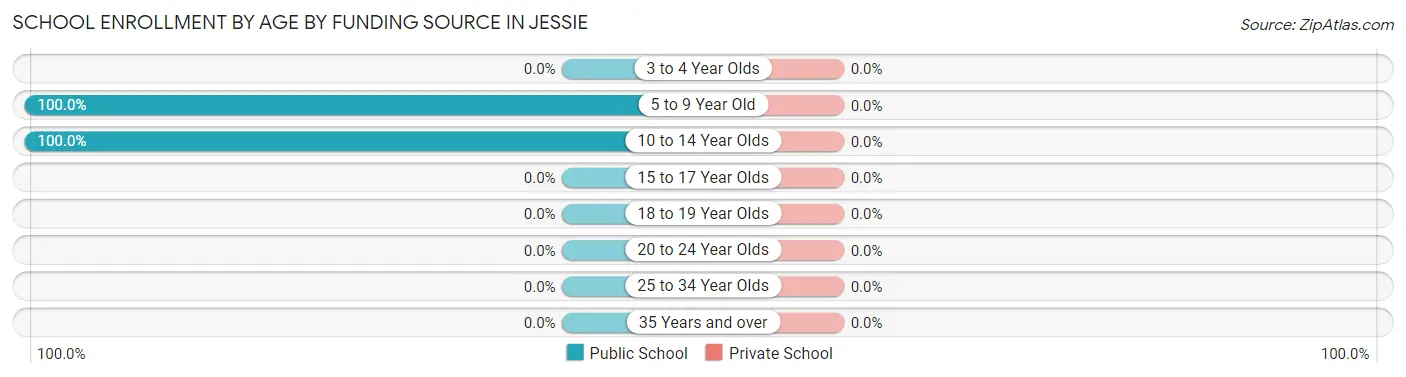
| Age Bracket | Public School | Private School |
| 3 to 4 Year Olds | 0 (0.0%) | 0 (0.0%) |
| 5 to 9 Year Old | 11 (100.0%) | 0 (0.0%) |
| 10 to 14 Year Olds | 22 (100.0%) | 0 (0.0%) |
| 15 to 17 Year Olds | 0 (0.0%) | 0 (0.0%) |
| 18 to 19 Year Olds | 0 (0.0%) | 0 (0.0%) |
| 20 to 24 Year Olds | 0 (0.0%) | 0 (0.0%) |
| 25 to 34 Year Olds | 0 (0.0%) | 0 (0.0%) |
| 35 Years and over | 0 (0.0%) | 0 (0.0%) |
| Total | 33 (100.0%) | 0 (0.0%) |
Educational Attainment by Field of Study in Jessie
Social sciences (4 | 50.0%), and liberal arts & history (4 | 50.0%) are the most common fields of study among 8 individuals in Jessie who have obtained a bachelor's degree or higher.
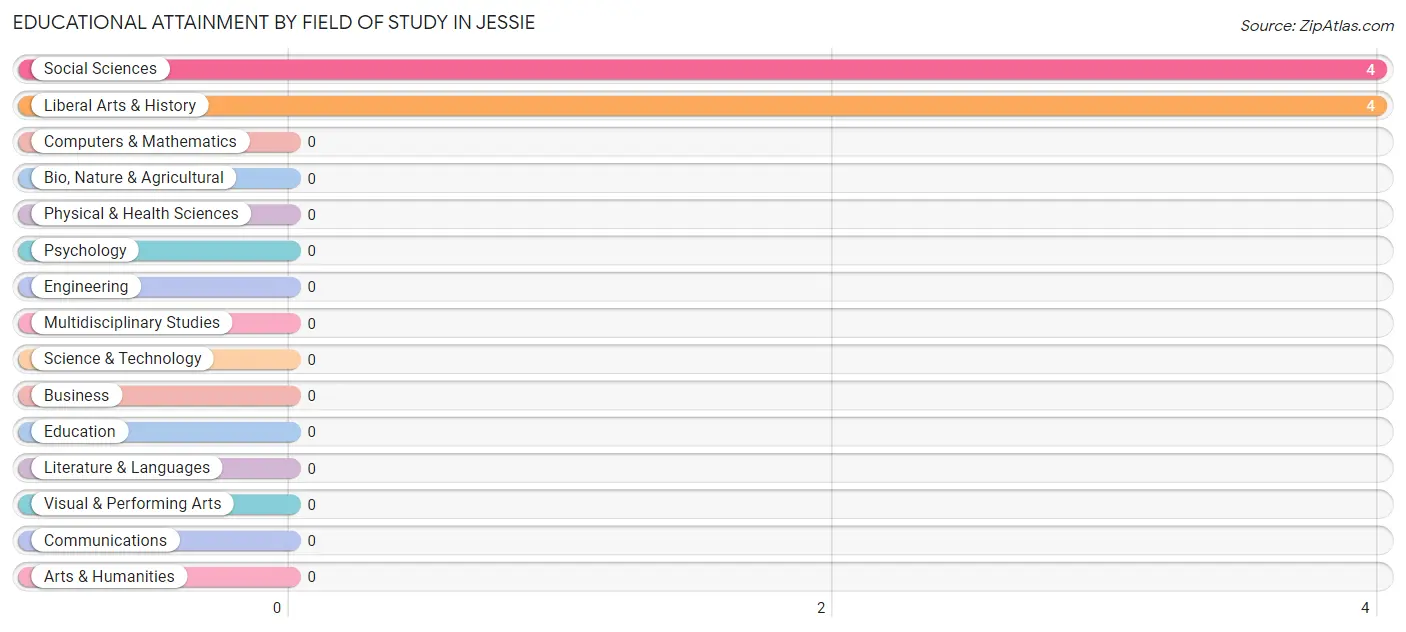
| Field of Study | # Graduates | % Graduates |
| Computers & Mathematics | 0 | 0.0% |
| Bio, Nature & Agricultural | 0 | 0.0% |
| Physical & Health Sciences | 0 | 0.0% |
| Psychology | 0 | 0.0% |
| Social Sciences | 4 | 50.0% |
| Engineering | 0 | 0.0% |
| Multidisciplinary Studies | 0 | 0.0% |
| Science & Technology | 0 | 0.0% |
| Business | 0 | 0.0% |
| Education | 0 | 0.0% |
| Literature & Languages | 0 | 0.0% |
| Liberal Arts & History | 4 | 50.0% |
| Visual & Performing Arts | 0 | 0.0% |
| Communications | 0 | 0.0% |
| Arts & Humanities | 0 | 0.0% |
| Total | 8 | 100.0% |
Transportation & Commute in Jessie
Vehicle Availability by Sex in Jessie
The most prevalent vehicle ownership categories in Jessie are males with 3 vehicles (6, accounting for 100.0%) and females with 3 vehicles (9, making up 66.7%).
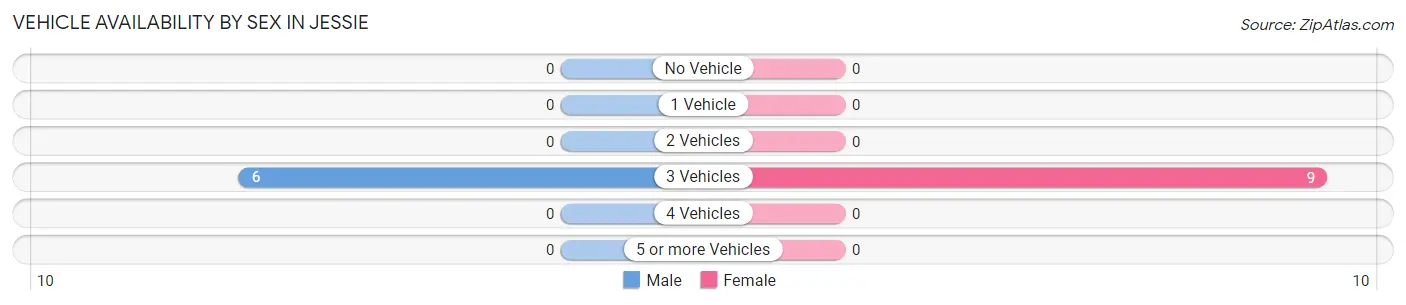
| Vehicles Available | Male | Female |
| No Vehicle | 0 (0.0%) | 0 (0.0%) |
| 1 Vehicle | 0 (0.0%) | 0 (0.0%) |
| 2 Vehicles | 0 (0.0%) | 0 (0.0%) |
| 3 Vehicles | 6 (100.0%) | 9 (100.0%) |
| 4 Vehicles | 0 (0.0%) | 0 (0.0%) |
| 5 or more Vehicles | 0 (0.0%) | 0 (0.0%) |
| Total | 6 (100.0%) | 9 (100.0%) |
Commute Time in Jessie
The most frequently occuring commute durations in Jessie are less than 5 minutes (9 commuters, 60.0%), 25 to 29 minutes (6 commuters, 40.0%), and 5 to 9 minutes (0 commuters, 0.0%).
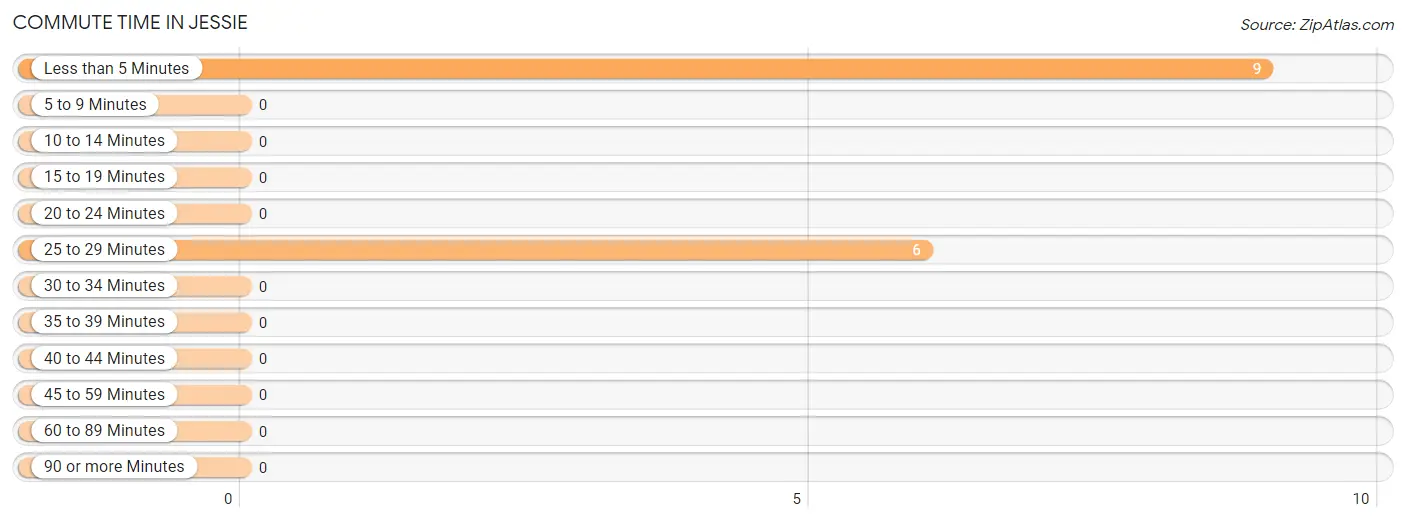
| Commute Time | # Commuters | % Commuters |
| Less than 5 Minutes | 9 | 60.0% |
| 5 to 9 Minutes | 0 | 0.0% |
| 10 to 14 Minutes | 0 | 0.0% |
| 15 to 19 Minutes | 0 | 0.0% |
| 20 to 24 Minutes | 0 | 0.0% |
| 25 to 29 Minutes | 6 | 40.0% |
| 30 to 34 Minutes | 0 | 0.0% |
| 35 to 39 Minutes | 0 | 0.0% |
| 40 to 44 Minutes | 0 | 0.0% |
| 45 to 59 Minutes | 0 | 0.0% |
| 60 to 89 Minutes | 0 | 0.0% |
| 90 or more Minutes | 0 | 0.0% |
Commute Time by Sex in Jessie
The most common commute times in Jessie are 25 to 29 minutes (6 commuters, 100.0%) for males and less than 5 minutes (9 commuters, 100.0%) for females.
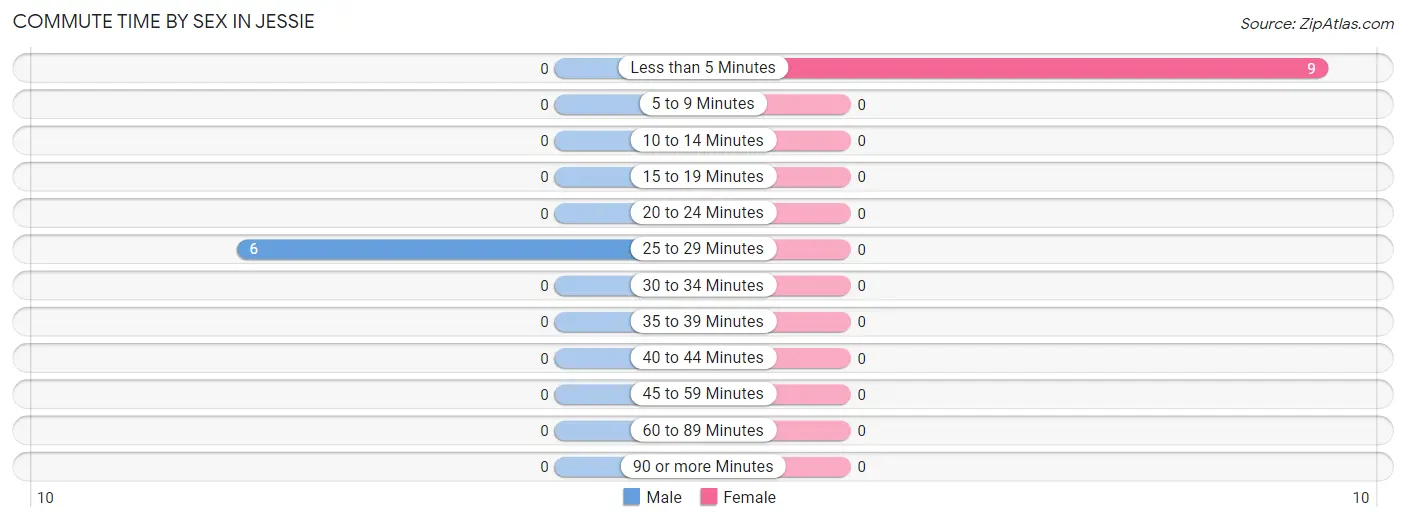
| Commute Time | Male | Female |
| Less than 5 Minutes | 0 (0.0%) | 9 (100.0%) |
| 5 to 9 Minutes | 0 (0.0%) | 0 (0.0%) |
| 10 to 14 Minutes | 0 (0.0%) | 0 (0.0%) |
| 15 to 19 Minutes | 0 (0.0%) | 0 (0.0%) |
| 20 to 24 Minutes | 0 (0.0%) | 0 (0.0%) |
| 25 to 29 Minutes | 6 (100.0%) | 0 (0.0%) |
| 30 to 34 Minutes | 0 (0.0%) | 0 (0.0%) |
| 35 to 39 Minutes | 0 (0.0%) | 0 (0.0%) |
| 40 to 44 Minutes | 0 (0.0%) | 0 (0.0%) |
| 45 to 59 Minutes | 0 (0.0%) | 0 (0.0%) |
| 60 to 89 Minutes | 0 (0.0%) | 0 (0.0%) |
| 90 or more Minutes | 0 (0.0%) | 0 (0.0%) |
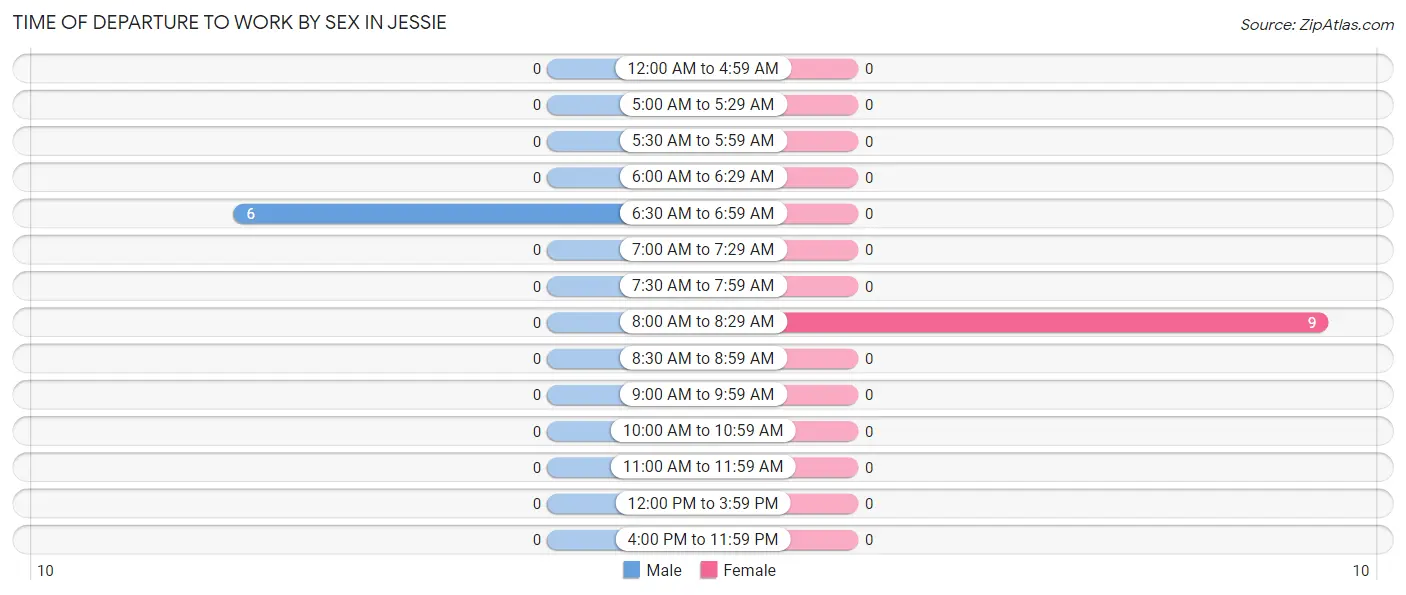
Time of Departure to Work by Sex in Jessie
The most frequent times of departure to work in Jessie are 6:30 AM to 6:59 AM (6, 100.0%) for males and 8:00 AM to 8:29 AM (9, 100.0%) for females.
| Time of Departure | Male | Female |
| 12:00 AM to 4:59 AM | 0 (0.0%) | 0 (0.0%) |
| 5:00 AM to 5:29 AM | 0 (0.0%) | 0 (0.0%) |
| 5:30 AM to 5:59 AM | 0 (0.0%) | 0 (0.0%) |
| 6:00 AM to 6:29 AM | 0 (0.0%) | 0 (0.0%) |
| 6:30 AM to 6:59 AM | 6 (100.0%) | 0 (0.0%) |
| 7:00 AM to 7:29 AM | 0 (0.0%) | 0 (0.0%) |
| 7:30 AM to 7:59 AM | 0 (0.0%) | 0 (0.0%) |
| 8:00 AM to 8:29 AM | 0 (0.0%) | 9 (100.0%) |
| 8:30 AM to 8:59 AM | 0 (0.0%) | 0 (0.0%) |
| 9:00 AM to 9:59 AM | 0 (0.0%) | 0 (0.0%) |
| 10:00 AM to 10:59 AM | 0 (0.0%) | 0 (0.0%) |
| 11:00 AM to 11:59 AM | 0 (0.0%) | 0 (0.0%) |
| 12:00 PM to 3:59 PM | 0 (0.0%) | 0 (0.0%) |
| 4:00 PM to 11:59 PM | 0 (0.0%) | 0 (0.0%) |
| Total | 6 (100.0%) | 9 (100.0%) |
Housing Occupancy in Jessie
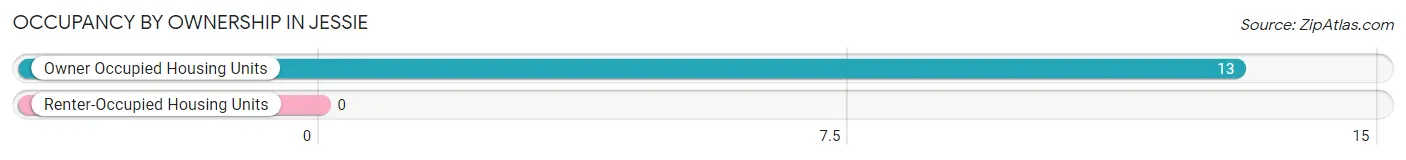
Occupancy by Ownership in Jessie
Of the total 13 dwellings in Jessie, owner-occupied units account for 13 (100.0%), while renter-occupied units make up 0 (0.0%).
| Occupancy | # Housing Units | % Housing Units |
| Owner Occupied Housing Units | 13 | 100.0% |
| Renter-Occupied Housing Units | 0 | 0.0% |
| Total Occupied Housing Units | 13 | 100.0% |
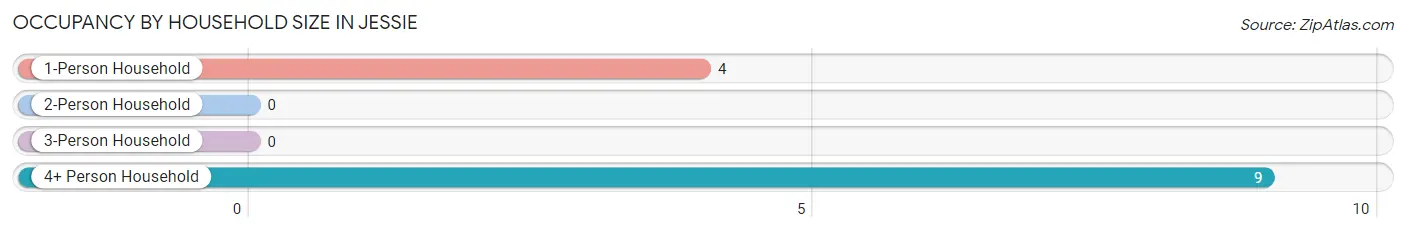
Occupancy by Household Size in Jessie
| Household Size | # Housing Units | % Housing Units |
| 1-Person Household | 4 | 30.8% |
| 2-Person Household | 0 | 0.0% |
| 3-Person Household | 0 | 0.0% |
| 4+ Person Household | 9 | 69.2% |
| Total Housing Units | 13 | 100.0% |
Occupancy by Ownership by Household Size in Jessie
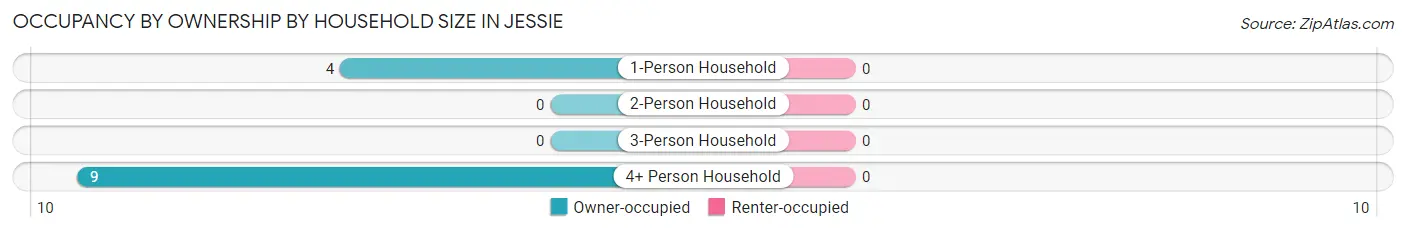
| Household Size | Owner-occupied | Renter-occupied |
| 1-Person Household | 4 (100.0%) | 0 (0.0%) |
| 2-Person Household | 0 (0.0%) | 0 (0.0%) |
| 3-Person Household | 0 (0.0%) | 0 (0.0%) |
| 4+ Person Household | 9 (100.0%) | 0 (0.0%) |
| Total Housing Units | 13 (100.0%) | 0 (0.0%) |
Occupancy by Educational Attainment in Jessie
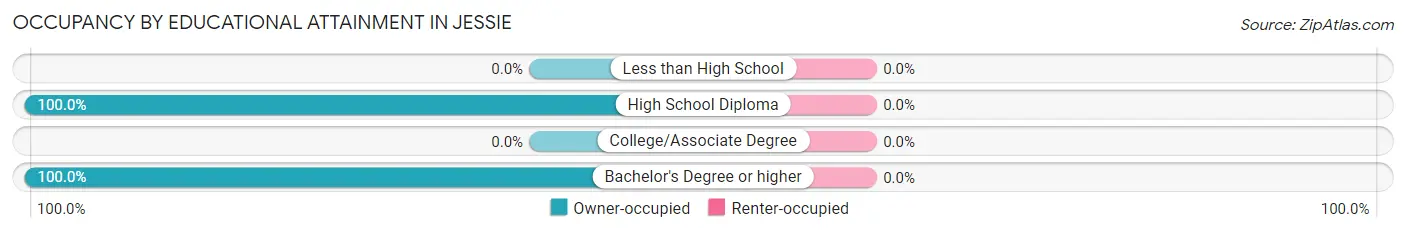
| Household Size | Owner-occupied | Renter-occupied |
| Less than High School | 0 (0.0%) | 0 (0.0%) |
| High School Diploma | 9 (100.0%) | 0 (0.0%) |
| College/Associate Degree | 0 (0.0%) | 0 (0.0%) |
| Bachelor's Degree or higher | 4 (100.0%) | 0 (0.0%) |
Occupancy by Age of Householder in Jessie
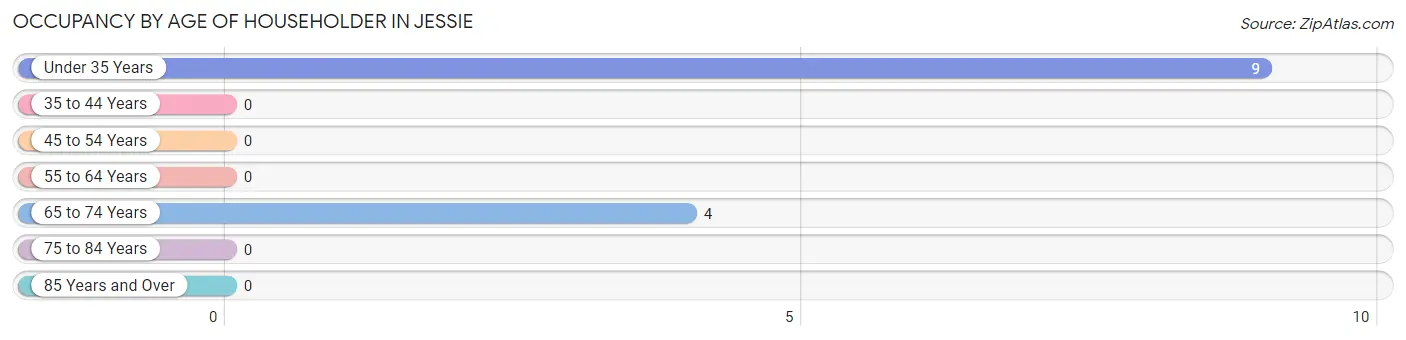
| Age Bracket | # Households | % Households |
| Under 35 Years | 9 | 69.2% |
| 35 to 44 Years | 0 | 0.0% |
| 45 to 54 Years | 0 | 0.0% |
| 55 to 64 Years | 0 | 0.0% |
| 65 to 74 Years | 4 | 30.8% |
| 75 to 84 Years | 0 | 0.0% |
| 85 Years and Over | 0 | 0.0% |
| Total | 13 | 100.0% |
Housing Finances in Jessie
Median Income by Occupancy in Jessie
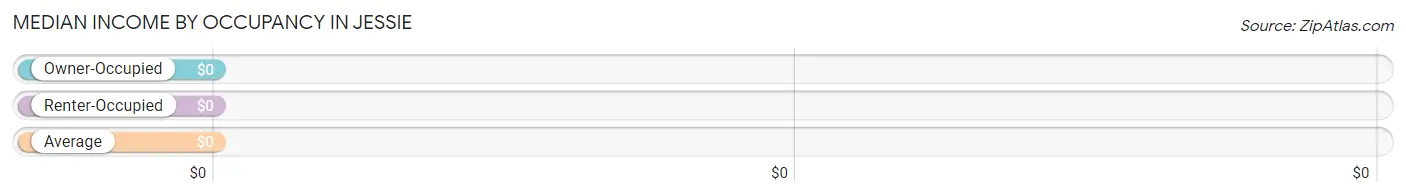
| Occupancy Type | # Households | Median Income |
| Owner-Occupied | 13 (100.0%) | $0 |
| Renter-Occupied | 0 (0.0%) | $0 |
| Average | 13 (100.0%) | $0 |
Occupancy by Householder Income Bracket in Jessie
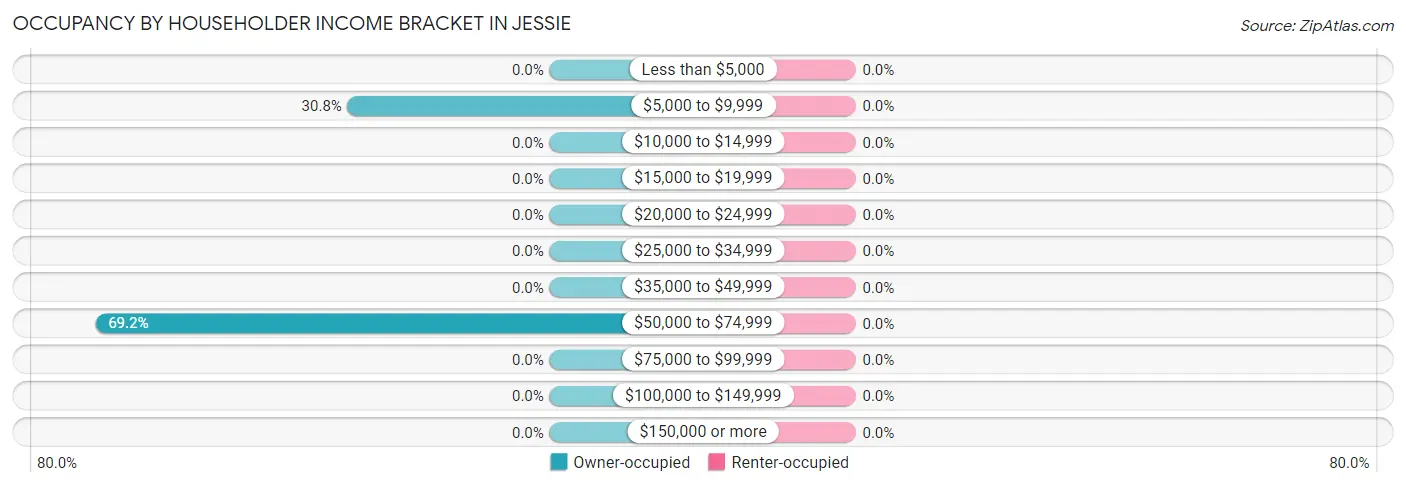
| Income Bracket | Owner-occupied | Renter-occupied |
| Less than $5,000 | 0 (0.0%) | 0 (0.0%) |
| $5,000 to $9,999 | 4 (30.8%) | 0 (0.0%) |
| $10,000 to $14,999 | 0 (0.0%) | 0 (0.0%) |
| $15,000 to $19,999 | 0 (0.0%) | 0 (0.0%) |
| $20,000 to $24,999 | 0 (0.0%) | 0 (0.0%) |
| $25,000 to $34,999 | 0 (0.0%) | 0 (0.0%) |
| $35,000 to $49,999 | 0 (0.0%) | 0 (0.0%) |
| $50,000 to $74,999 | 9 (69.2%) | 0 (0.0%) |
| $75,000 to $99,999 | 0 (0.0%) | 0 (0.0%) |
| $100,000 to $149,999 | 0 (0.0%) | 0 (0.0%) |
| $150,000 or more | 0 (0.0%) | 0 (0.0%) |
| Total | 13 (100.0%) | 0 (0.0%) |
Monthly Housing Cost Tiers in Jessie
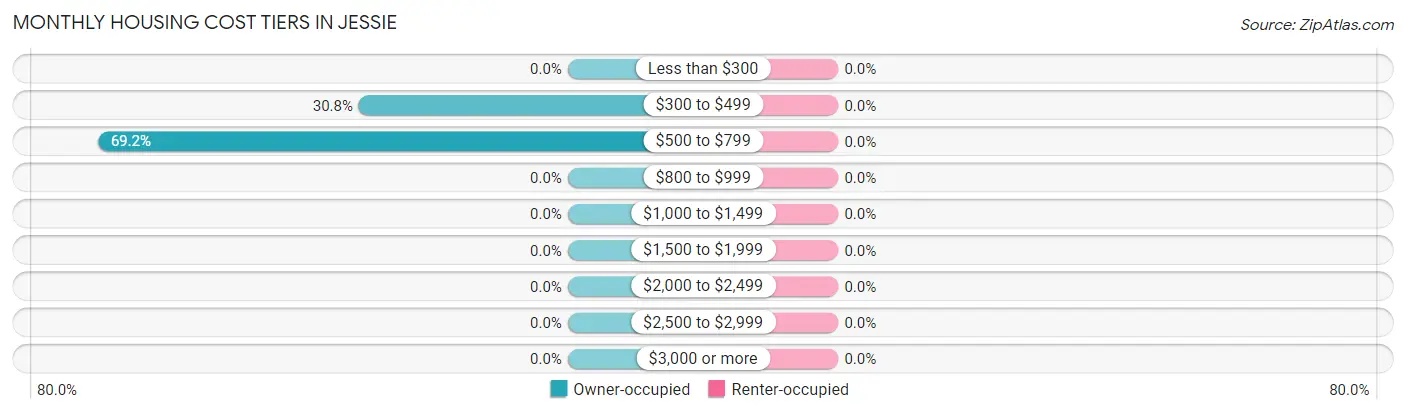
| Monthly Cost | Owner-occupied | Renter-occupied |
| Less than $300 | 0 (0.0%) | 0 (0.0%) |
| $300 to $499 | 4 (30.8%) | 0 (0.0%) |
| $500 to $799 | 9 (69.2%) | 0 (0.0%) |
| $800 to $999 | 0 (0.0%) | 0 (0.0%) |
| $1,000 to $1,499 | 0 (0.0%) | 0 (0.0%) |
| $1,500 to $1,999 | 0 (0.0%) | 0 (0.0%) |
| $2,000 to $2,499 | 0 (0.0%) | 0 (0.0%) |
| $2,500 to $2,999 | 0 (0.0%) | 0 (0.0%) |
| $3,000 or more | 0 (0.0%) | 0 (0.0%) |
| Total | 13 (100.0%) | 0 (0.0%) |
Physical Housing Characteristics in Jessie
Housing Structures in Jessie
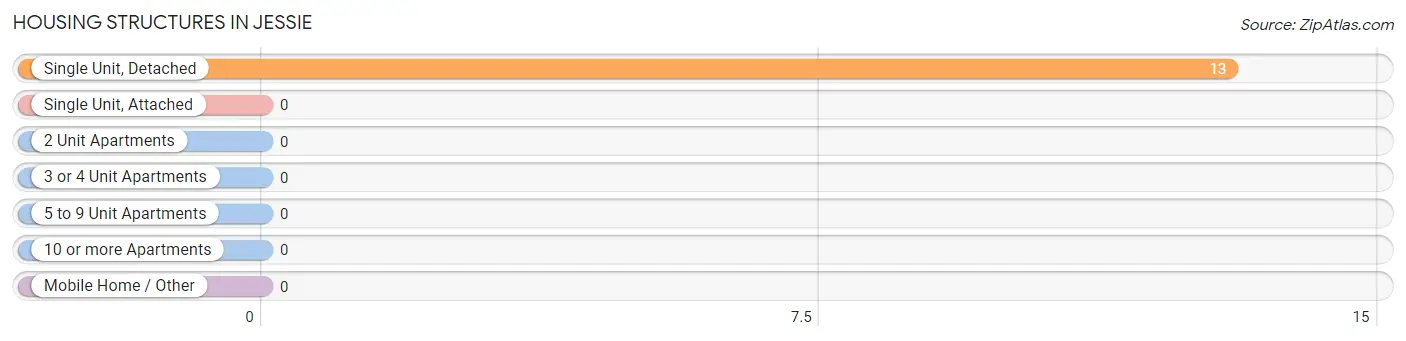
| Structure Type | # Housing Units | % Housing Units |
| Single Unit, Detached | 13 | 100.0% |
| Single Unit, Attached | 0 | 0.0% |
| 2 Unit Apartments | 0 | 0.0% |
| 3 or 4 Unit Apartments | 0 | 0.0% |
| 5 to 9 Unit Apartments | 0 | 0.0% |
| 10 or more Apartments | 0 | 0.0% |
| Mobile Home / Other | 0 | 0.0% |
| Total | 13 | 100.0% |
Housing Structures by Occupancy in Jessie
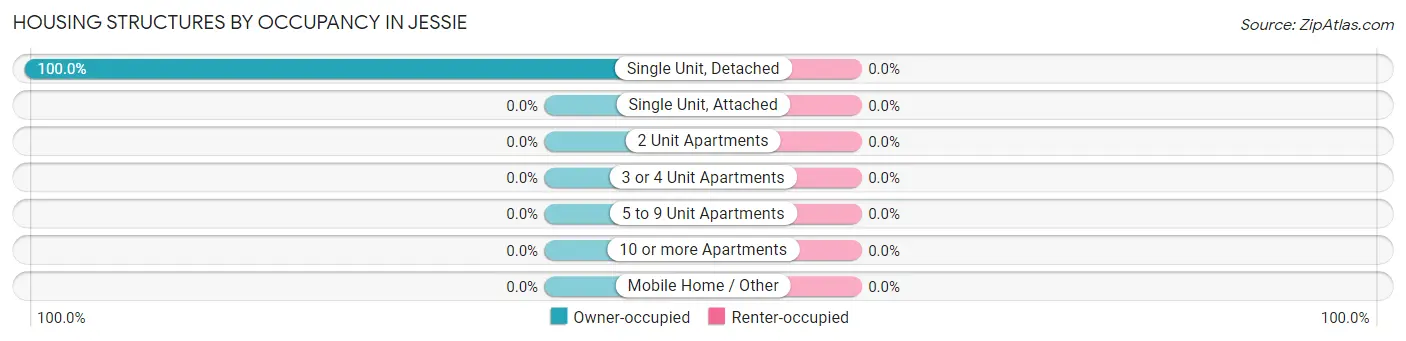
| Structure Type | Owner-occupied | Renter-occupied |
| Single Unit, Detached | 13 (100.0%) | 0 (0.0%) |
| Single Unit, Attached | 0 (0.0%) | 0 (0.0%) |
| 2 Unit Apartments | 0 (0.0%) | 0 (0.0%) |
| 3 or 4 Unit Apartments | 0 (0.0%) | 0 (0.0%) |
| 5 to 9 Unit Apartments | 0 (0.0%) | 0 (0.0%) |
| 10 or more Apartments | 0 (0.0%) | 0 (0.0%) |
| Mobile Home / Other | 0 (0.0%) | 0 (0.0%) |
| Total | 13 (100.0%) | 0 (0.0%) |
Housing Structures by Number of Rooms in Jessie
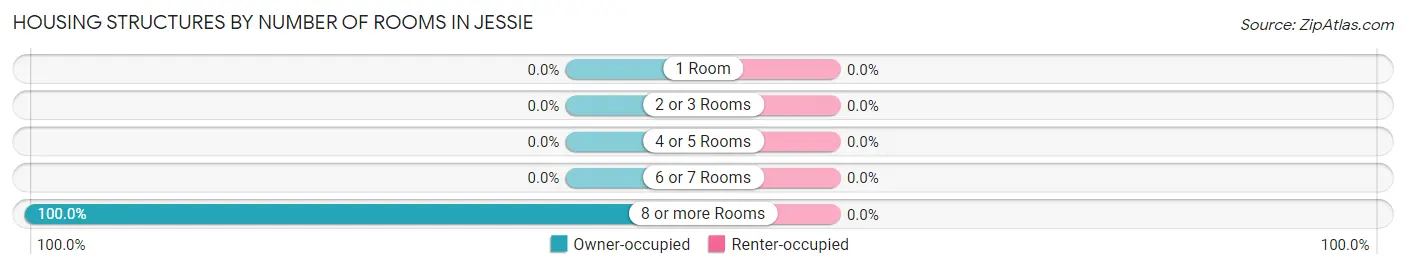
| Number of Rooms | Owner-occupied | Renter-occupied |
| 1 Room | 0 (0.0%) | 0 (0.0%) |
| 2 or 3 Rooms | 0 (0.0%) | 0 (0.0%) |
| 4 or 5 Rooms | 0 (0.0%) | 0 (0.0%) |
| 6 or 7 Rooms | 0 (0.0%) | 0 (0.0%) |
| 8 or more Rooms | 13 (100.0%) | 0 (0.0%) |
| Total | 13 (100.0%) | 0 (0.0%) |
Housing Structure by Heating Type in Jessie
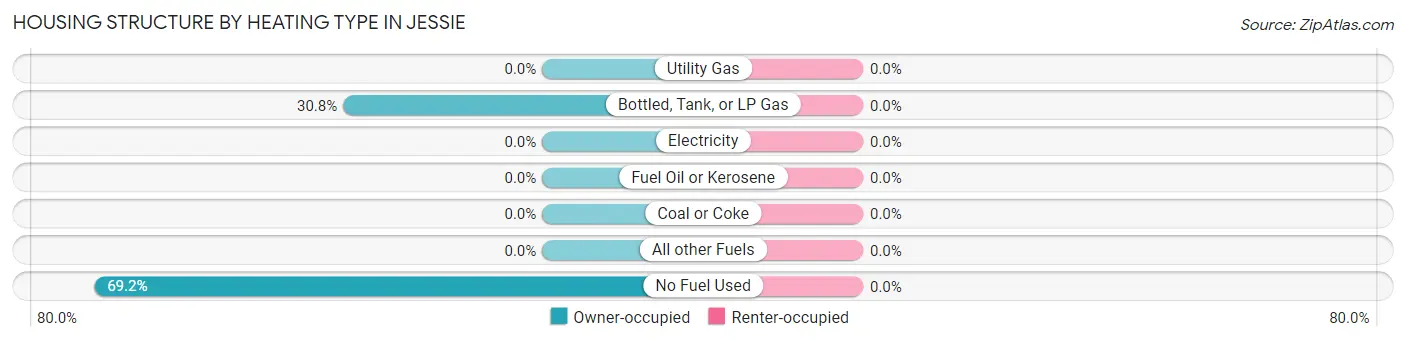
| Heating Type | Owner-occupied | Renter-occupied |
| Utility Gas | 0 (0.0%) | 0 (0.0%) |
| Bottled, Tank, or LP Gas | 4 (30.8%) | 0 (0.0%) |
| Electricity | 0 (0.0%) | 0 (0.0%) |
| Fuel Oil or Kerosene | 0 (0.0%) | 0 (0.0%) |
| Coal or Coke | 0 (0.0%) | 0 (0.0%) |
| All other Fuels | 0 (0.0%) | 0 (0.0%) |
| No Fuel Used | 9 (69.2%) | 0 (0.0%) |
| Total | 13 (100.0%) | 0 (0.0%) |
Household Vehicle Usage in Jessie
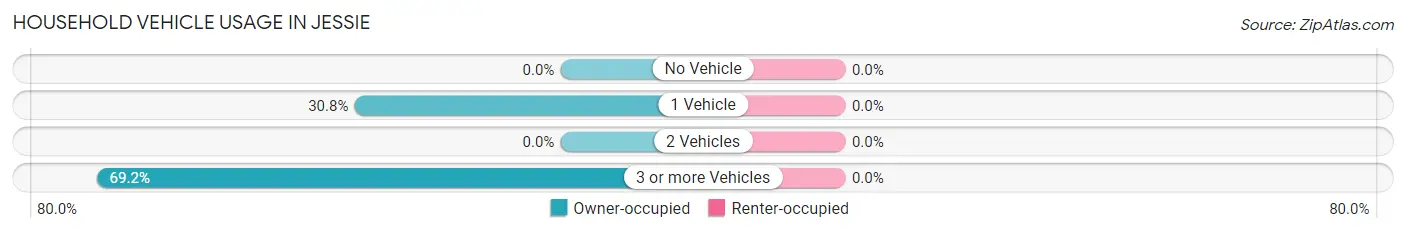
| Vehicles per Household | Owner-occupied | Renter-occupied |
| No Vehicle | 0 (0.0%) | 0 (0.0%) |
| 1 Vehicle | 4 (30.8%) | 0 (0.0%) |
| 2 Vehicles | 0 (0.0%) | 0 (0.0%) |
| 3 or more Vehicles | 9 (69.2%) | 0 (0.0%) |
| Total | 13 (100.0%) | 0 (0.0%) |
Real Estate & Mortgages in Jessie
Real Estate and Mortgage Overview in Jessie
| Characteristic | Without Mortgage | With Mortgage |
| Housing Units | 13 | 0 |
| Median Property Value | - | - |
| Median Household Income | - | - |
| Monthly Housing Costs | - | - |
| Real Estate Taxes | - | - |
Property Value by Mortgage Status in Jessie
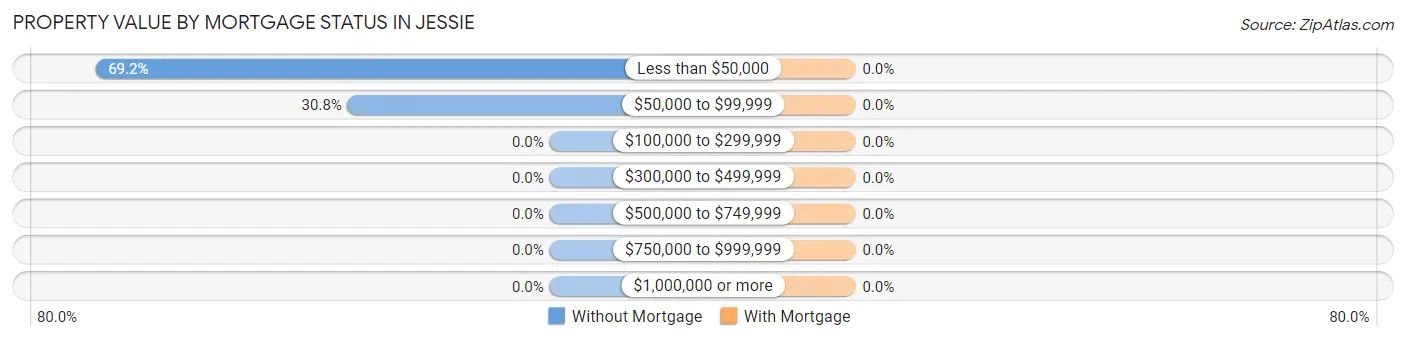
| Property Value | Without Mortgage | With Mortgage |
| Less than $50,000 | 9 (69.2%) | 0 (0.0%) |
| $50,000 to $99,999 | 4 (30.8%) | 0 (0.0%) |
| $100,000 to $299,999 | 0 (0.0%) | 0 (0.0%) |
| $300,000 to $499,999 | 0 (0.0%) | 0 (0.0%) |
| $500,000 to $749,999 | 0 (0.0%) | 0 (0.0%) |
| $750,000 to $999,999 | 0 (0.0%) | 0 (0.0%) |
| $1,000,000 or more | 0 (0.0%) | 0 (0.0%) |
| Total | 13 (100.0%) | 0 (0.0%) |
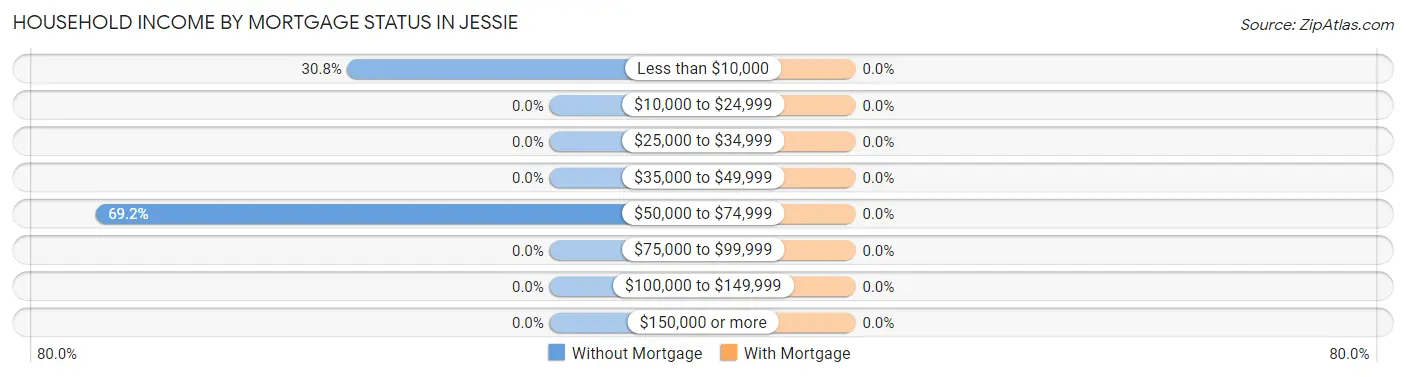
Household Income by Mortgage Status in Jessie
| Household Income | Without Mortgage | With Mortgage |
| Less than $10,000 | 4 (30.8%) | 0 (0.0%) |
| $10,000 to $24,999 | 0 (0.0%) | 0 (0.0%) |
| $25,000 to $34,999 | 0 (0.0%) | 0 (0.0%) |
| $35,000 to $49,999 | 0 (0.0%) | 0 (0.0%) |
| $50,000 to $74,999 | 9 (69.2%) | 0 (0.0%) |
| $75,000 to $99,999 | 0 (0.0%) | 0 (0.0%) |
| $100,000 to $149,999 | 0 (0.0%) | 0 (0.0%) |
| $150,000 or more | 0 (0.0%) | 0 (0.0%) |
| Total | 13 (100.0%) | 0 (0.0%) |
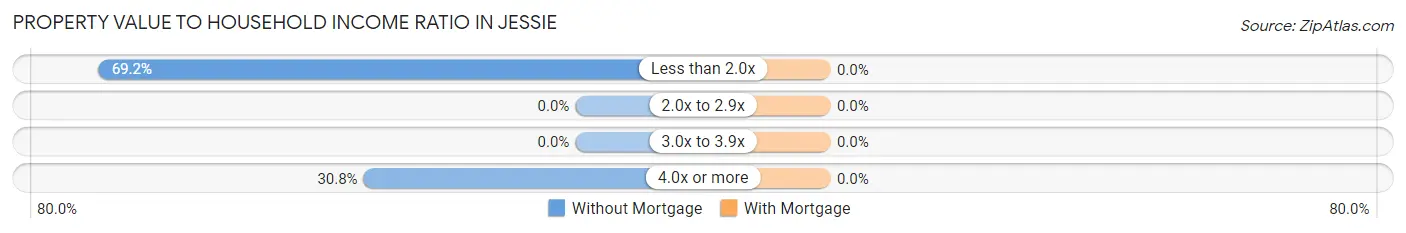
Property Value to Household Income Ratio in Jessie
| Value-to-Income Ratio | Without Mortgage | With Mortgage |
| Less than 2.0x | 9 (69.2%) | 0 (0.0%) |
| 2.0x to 2.9x | 0 (0.0%) | 0 (0.0%) |
| 3.0x to 3.9x | 0 (0.0%) | 0 (0.0%) |
| 4.0x or more | 4 (30.8%) | 0 (0.0%) |
| Total | 13 (100.0%) | 0 (0.0%) |
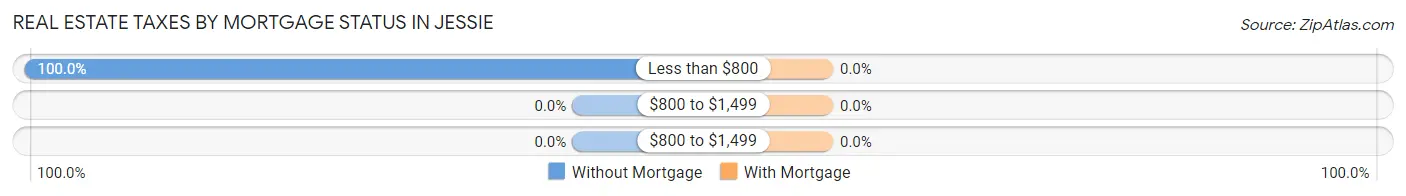
Real Estate Taxes by Mortgage Status in Jessie
| Property Taxes | Without Mortgage | With Mortgage |
| Less than $800 | 13 (100.0%) | 0 (0.0%) |
| $800 to $1,499 | 0 (0.0%) | 0 (0.0%) |
| $800 to $1,499 | 0 (0.0%) | 0 (0.0%) |
| Total | 13 (100.0%) | 0 (0.0%) |
Health & Disability in Jessie
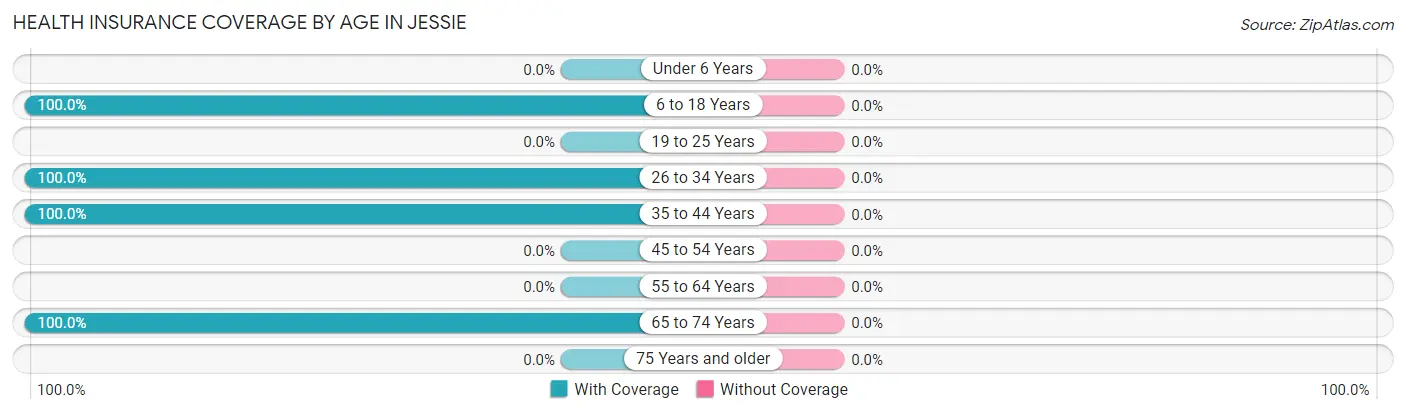
Health Insurance Coverage by Age in Jessie
| Age Bracket | With Coverage | Without Coverage |
| Under 6 Years | 0 (0.0%) | 0 (0.0%) |
| 6 to 18 Years | 33 (100.0%) | 0 (0.0%) |
| 19 to 25 Years | 0 (0.0%) | 0 (0.0%) |
| 26 to 34 Years | 9 (100.0%) | 0 (0.0%) |
| 35 to 44 Years | 6 (100.0%) | 0 (0.0%) |
| 45 to 54 Years | 0 (0.0%) | 0 (0.0%) |
| 55 to 64 Years | 0 (0.0%) | 0 (0.0%) |
| 65 to 74 Years | 4 (100.0%) | 0 (0.0%) |
| 75 Years and older | 0 (0.0%) | 0 (0.0%) |
| Total | 52 (100.0%) | 0 (0.0%) |
Health Insurance Coverage by Citizenship Status in Jessie
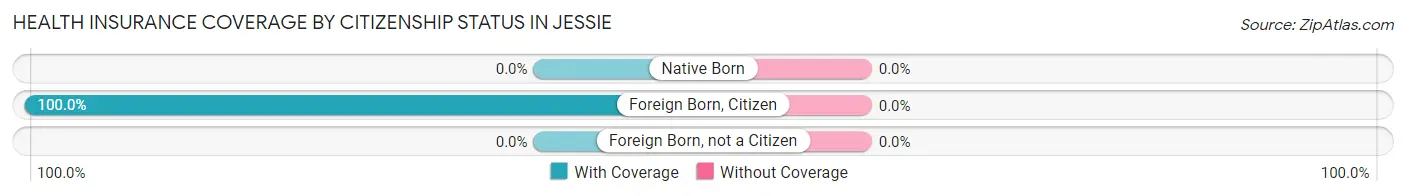
| Citizenship Status | With Coverage | Without Coverage |
| Native Born | 0 (0.0%) | 0 (0.0%) |
| Foreign Born, Citizen | 33 (100.0%) | 0 (0.0%) |
| Foreign Born, not a Citizen | 0 (0.0%) | 0 (0.0%) |
Health Insurance Coverage by Household Income in Jessie
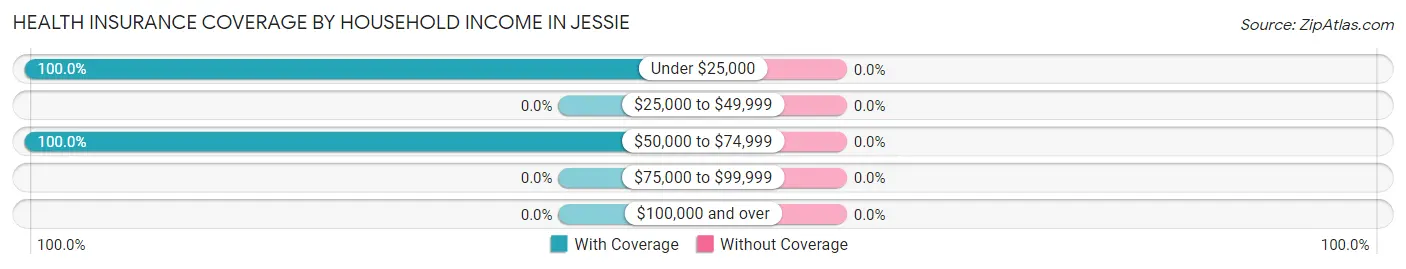
| Household Income | With Coverage | Without Coverage |
| Under $25,000 | 4 (100.0%) | 0 (0.0%) |
| $25,000 to $49,999 | 0 (0.0%) | 0 (0.0%) |
| $50,000 to $74,999 | 48 (100.0%) | 0 (0.0%) |
| $75,000 to $99,999 | 0 (0.0%) | 0 (0.0%) |
| $100,000 and over | 0 (0.0%) | 0 (0.0%) |
Public vs Private Health Insurance Coverage by Age in Jessie
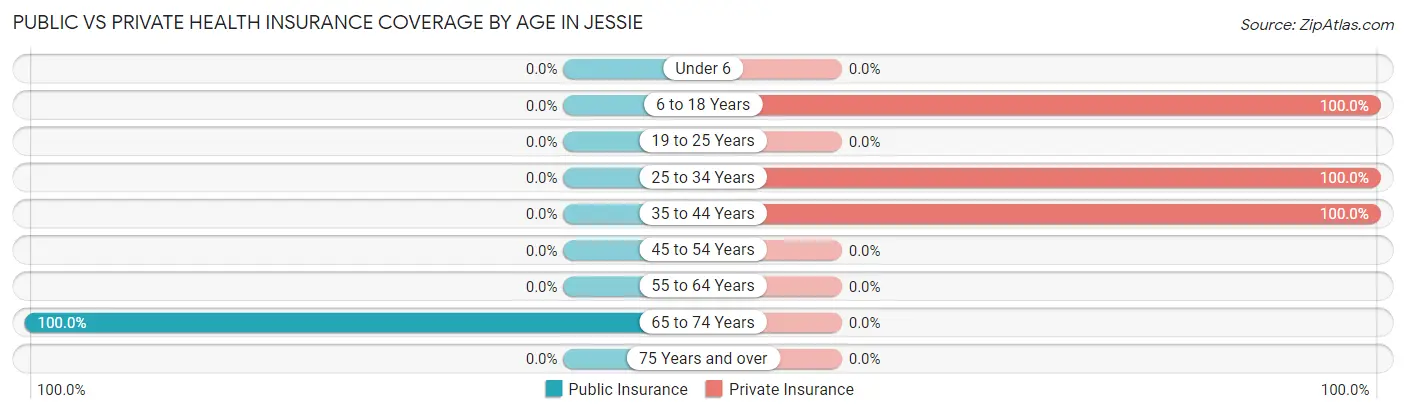
| Age Bracket | Public Insurance | Private Insurance |
| Under 6 | 0 (0.0%) | 0 (0.0%) |
| 6 to 18 Years | 0 (0.0%) | 33 (100.0%) |
| 19 to 25 Years | 0 (0.0%) | 0 (0.0%) |
| 25 to 34 Years | 0 (0.0%) | 9 (100.0%) |
| 35 to 44 Years | 0 (0.0%) | 6 (100.0%) |
| 45 to 54 Years | 0 (0.0%) | 0 (0.0%) |
| 55 to 64 Years | 0 (0.0%) | 0 (0.0%) |
| 65 to 74 Years | 4 (100.0%) | 0 (0.0%) |
| 75 Years and over | 0 (0.0%) | 0 (0.0%) |
| Total | 4 (7.7%) | 48 (92.3%) |
Disability Status by Sex by Age in Jessie
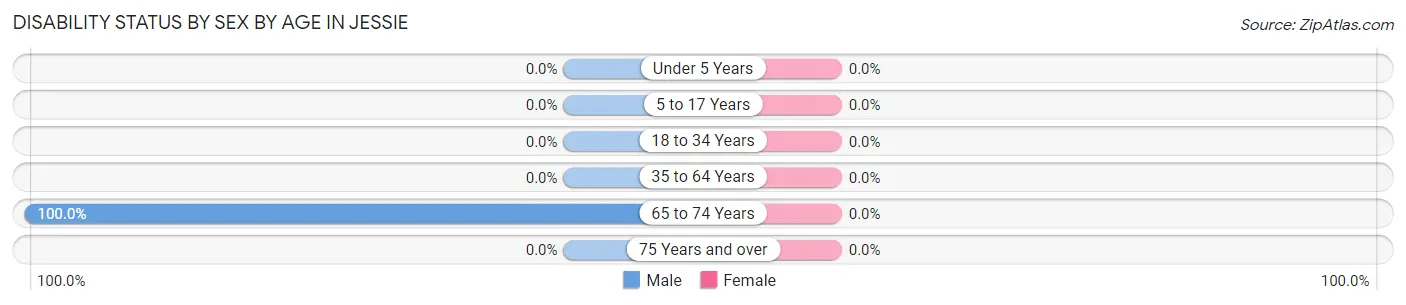
| Age Bracket | Male | Female |
| Under 5 Years | 0 (0.0%) | 0 (0.0%) |
| 5 to 17 Years | 0 (0.0%) | 0 (0.0%) |
| 18 to 34 Years | 0 (0.0%) | 0 (0.0%) |
| 35 to 64 Years | 0 (0.0%) | 0 (0.0%) |
| 65 to 74 Years | 4 (100.0%) | 0 (0.0%) |
| 75 Years and over | 0 (0.0%) | 0 (0.0%) |
Disability Class by Sex by Age in Jessie
Disability Class: Hearing Difficulty
| Age Bracket | Male | Female |
| Under 5 Years | 0 (0.0%) | 0 (0.0%) |
| 5 to 17 Years | 0 (0.0%) | 0 (0.0%) |
| 18 to 34 Years | 0 (0.0%) | 0 (0.0%) |
| 35 to 64 Years | 0 (0.0%) | 0 (0.0%) |
| 65 to 74 Years | 0 (0.0%) | 0 (0.0%) |
| 75 Years and over | 0 (0.0%) | 0 (0.0%) |
Disability Class: Vision Difficulty
| Age Bracket | Male | Female |
| Under 5 Years | 0 (0.0%) | 0 (0.0%) |
| 5 to 17 Years | 0 (0.0%) | 0 (0.0%) |
| 18 to 34 Years | 0 (0.0%) | 0 (0.0%) |
| 35 to 64 Years | 0 (0.0%) | 0 (0.0%) |
| 65 to 74 Years | 0 (0.0%) | 0 (0.0%) |
| 75 Years and over | 0 (0.0%) | 0 (0.0%) |
Disability Class: Cognitive Difficulty
| Age Bracket | Male | Female |
| 5 to 17 Years | 0 (0.0%) | 0 (0.0%) |
| 18 to 34 Years | 0 (0.0%) | 0 (0.0%) |
| 35 to 64 Years | 0 (0.0%) | 0 (0.0%) |
| 65 to 74 Years | 4 (100.0%) | 0 (0.0%) |
| 75 Years and over | 0 (0.0%) | 0 (0.0%) |
Disability Class: Ambulatory Difficulty
| Age Bracket | Male | Female |
| 5 to 17 Years | 0 (0.0%) | 0 (0.0%) |
| 18 to 34 Years | 0 (0.0%) | 0 (0.0%) |
| 35 to 64 Years | 0 (0.0%) | 0 (0.0%) |
| 65 to 74 Years | 0 (0.0%) | 0 (0.0%) |
| 75 Years and over | 0 (0.0%) | 0 (0.0%) |
Disability Class: Self-Care Difficulty
| Age Bracket | Male | Female |
| 5 to 17 Years | 0 (0.0%) | 0 (0.0%) |
| 18 to 34 Years | 0 (0.0%) | 0 (0.0%) |
| 35 to 64 Years | 0 (0.0%) | 0 (0.0%) |
| 65 to 74 Years | 0 (0.0%) | 0 (0.0%) |
| 75 Years and over | 0 (0.0%) | 0 (0.0%) |
Technology Access in Jessie
Computing Device Access in Jessie
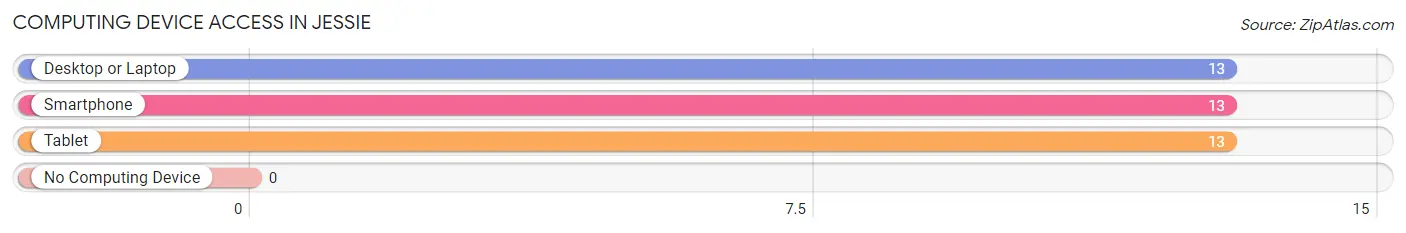
| Device Type | # Households | % Households |
| Desktop or Laptop | 13 | 100.0% |
| Smartphone | 13 | 100.0% |
| Tablet | 13 | 100.0% |
| No Computing Device | 0 | 0.0% |
| Total | 13 | 100.0% |
Internet Access in Jessie
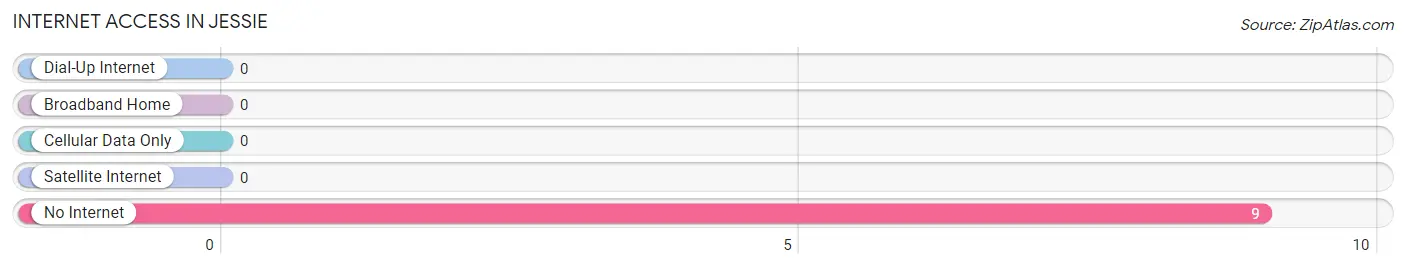
| Internet Type | # Households | % Households |
| Dial-Up Internet | 0 | 0.0% |
| Broadband Home | 0 | 0.0% |
| Cellular Data Only | 0 | 0.0% |
| Satellite Internet | 0 | 0.0% |
| No Internet | 9 | 69.2% |
| Total | 13 | 100.0% |
Jessie Summary
History
The history of North Dakota is a long and varied one, stretching back to the days of the Native Americans who first inhabited the area. The first known inhabitants of the area were the Mandan, Hidatsa, and Arikara tribes, who lived in the area for centuries before the arrival of Europeans. The first Europeans to explore the area were French fur traders, who arrived in the late 1700s. The area was then part of the Louisiana Purchase in 1803, and was part of the Dakota Territory in 1861.
In 1889, North Dakota became the 39th state in the Union. The state was largely rural and agricultural, and the population was largely made up of immigrants from Scandinavia and Germany. The economy was based on farming, ranching, and mining. The state also had a strong Native American presence, with many tribes living on reservations in the state.
The early 20th century saw the development of the state’s oil and gas industry, as well as the growth of the state’s agricultural sector. The Great Depression hit the state hard, and the population declined significantly. However, the state’s economy recovered in the 1940s and 1950s, and the population began to grow again.
In the late 20th century, the state’s economy diversified, with the development of the energy industry, tourism, and technology. The state also saw an influx of new residents, as people moved to the state from other parts of the country.
Geography
North Dakota is located in the northern Great Plains region of the United States. It is bordered by Minnesota to the east, South Dakota to the south, Montana to the west, and Canada to the north. The state is divided into 53 counties, and its capital is Bismarck.
The state is largely rural, with most of the population living in small towns and cities. The landscape is mostly flat, with rolling hills in the east and west. The state is home to the Badlands National Park, Theodore Roosevelt National Park, and the Little Missouri National Grassland.
The climate of North Dakota is continental, with cold winters and hot summers. The average annual temperature is around 45°F (7°C). The state receives an average of 16 inches (41 cm) of precipitation per year.
Economy
North Dakota’s economy is largely based on agriculture, energy, and tourism. The state is the second-largest producer of wheat in the United States, and is also a major producer of barley, oats, and other grains. The state is also a major producer of oil and natural gas, and is home to several large oil refineries.
The state’s tourism industry is also an important part of the economy. The state is home to several national parks and monuments, as well as numerous historic sites. The state also has a thriving arts and culture scene, with several museums and galleries.
Demographics
As of the 2010 census, the population of North Dakota was 672,591. The population is largely white (90.2%), with small percentages of Native Americans (5.3%), African Americans (2.2%), and Asians (1.2%). The median age of the population is 37.7 years, and the median household income is $53,906.
The largest cities in the state are Fargo (population 105,549), Bismarck (population 61,272), Grand Forks (population 52,838), and Minot (population 40,888). The state is also home to several Native American reservations, including the Standing Rock Sioux Reservation, the Turtle Mountain Band of Chippewa Indians Reservation, and the Spirit Lake Nation Reservation.
Common Questions
What is Per Capita Income in Jessie?
Per Capita income in Jessie is $9,063.
What is Inequality or Gini Index in Jessie?
Inequality or Gini Index in Jessie is 0.26.
What is the Total Population of Jessie?
Total Population of Jessie is 52.
What is the Total Male Population of Jessie?
Total Male Population of Jessie is 43.
What is the Total Female Population of Jessie?
Total Female Population of Jessie is 9.
What is the Ratio of Males per 100 Females in Jessie?
There are 477.78 Males per 100 Females in Jessie.
What is the Ratio of Females per 100 Males in Jessie?
There are 20.93 Females per 100 Males in Jessie.
What is the Median Population Age in Jessie?
Median Population Age in Jessie is 13.4 Years.
What is the Average Family Size in Jessie
Average Family Size in Jessie is 5.3 People.
What is the Average Household Size in Jessie
Average Household Size in Jessie is 4.0 People.
How Large is the Labor Force in Jessie?
There are 19 People in the Labor Forcein in Jessie.
What is the Percentage of People in the Labor Force in Jessie?
100.0% of People are in the Labor Force in Jessie.
What is the Unemployment Rate in Jessie?
Unemployment Rate in Jessie is 21.1%.