Watson, LA Map & Demographics
Watson Map
Watson Overview
$41,106
PER CAPITA INCOME
$131,458
AVG FAMILY INCOME
$130,764
AVG HOUSEHOLD INCOME
40.4%
WAGE / INCOME GAP [ % ]
59.6¢/ $1
WAGE / INCOME GAP [ $ ]
0.38
INEQUALITY / GINI INDEX
1,445
TOTAL POPULATION
837
MALE POPULATION
608
FEMALE POPULATION
137.66
MALES / 100 FEMALES
72.64
FEMALES / 100 MALES
42.2
MEDIAN AGE
3.8
AVG FAMILY SIZE
3.0
AVG HOUSEHOLD SIZE
570
LABOR FORCE [ PEOPLE ]
48.4%
PERCENT IN LABOR FORCE
12.5%
UNEMPLOYMENT RATE
Watson Area Codes
Income in Watson
Income Overview in Watson
Per Capita Income in Watson is $41,106, while median incomes of families and households are $131,458 and $130,764 respectively.
| Characteristic | Number | Measure |
| Per Capita Income | 1,445 | $41,106 |
| Median Family Income | 349 | $131,458 |
| Mean Family Income | 349 | $140,286 |
| Median Household Income | 481 | $130,764 |
| Mean Household Income | 481 | $126,310 |
| Income Deficit | 349 | $0 |
| Wage / Income Gap (%) | 1,445 | 40.38% |
| Wage / Income Gap ($) | 1,445 | 59.62¢ per $1 |
| Gini / Inequality Index | 1,445 | 0.38 |
Earnings by Sex in Watson
Average Earnings in Watson are $98,333, $128,327 for men and $76,510 for women, a difference of 40.4%.
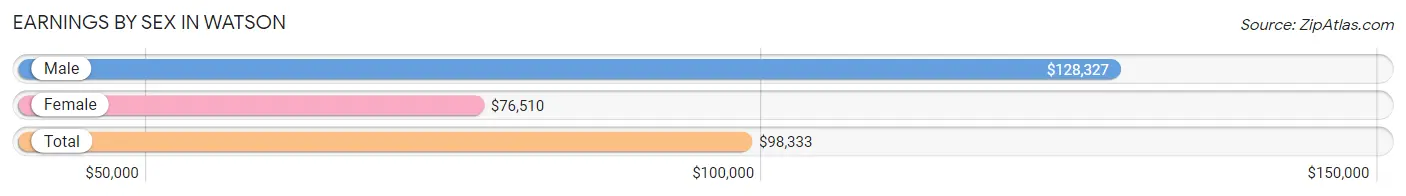
| Sex | Number | Average Earnings |
| Male | 341 (65.3%) | $128,327 |
| Female | 181 (34.7%) | $76,510 |
| Total | 522 (100.0%) | $98,333 |
Earnings by Sex by Income Bracket in Watson
The most common earnings brackets in Watson are $100,000+ for men (202 | 59.2%) and $75,000 to $99,999 for women (90 | 49.7%).
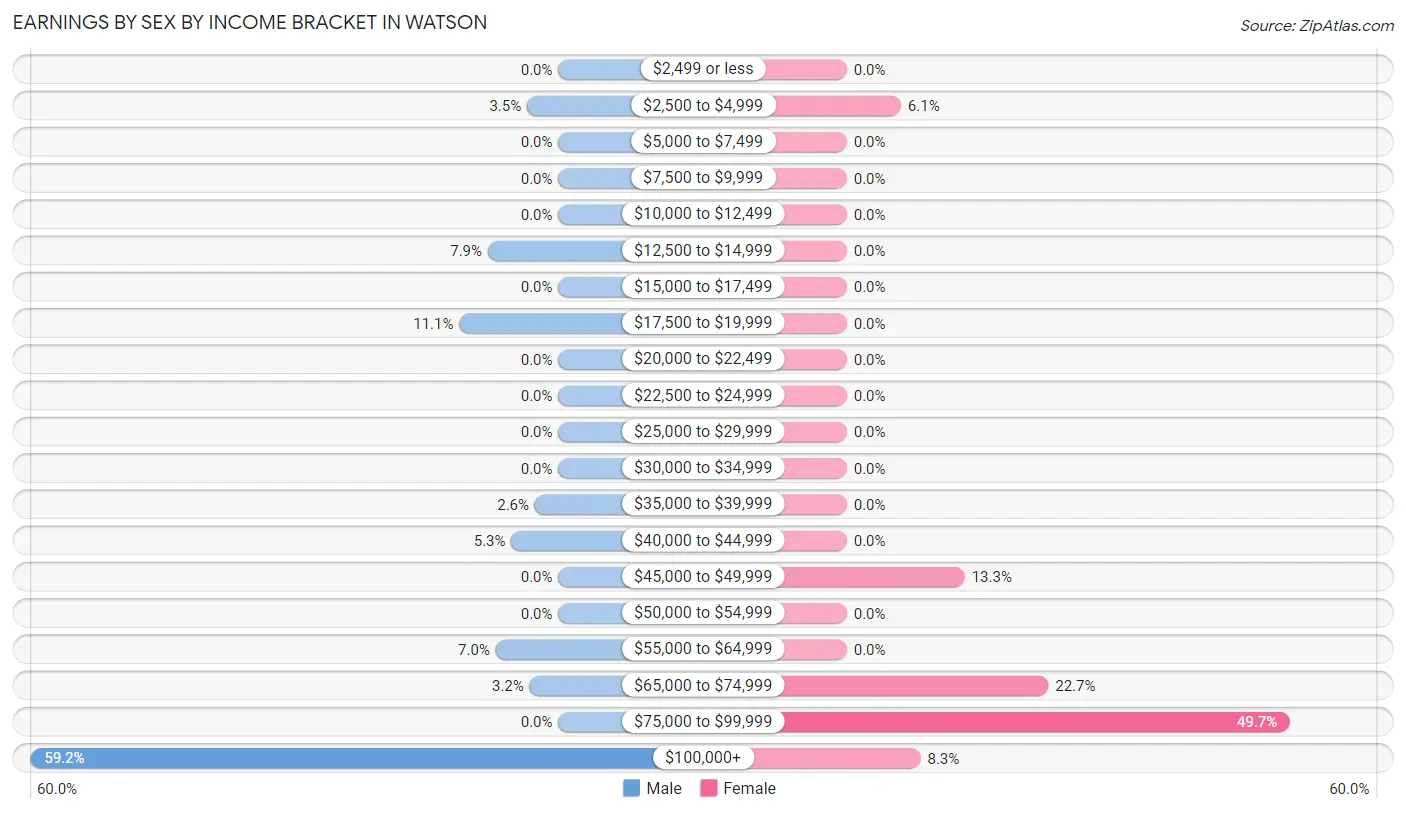
| Income | Male | Female |
| $2,499 or less | 0 (0.0%) | 0 (0.0%) |
| $2,500 to $4,999 | 12 (3.5%) | 11 (6.1%) |
| $5,000 to $7,499 | 0 (0.0%) | 0 (0.0%) |
| $7,500 to $9,999 | 0 (0.0%) | 0 (0.0%) |
| $10,000 to $12,499 | 0 (0.0%) | 0 (0.0%) |
| $12,500 to $14,999 | 27 (7.9%) | 0 (0.0%) |
| $15,000 to $17,499 | 0 (0.0%) | 0 (0.0%) |
| $17,500 to $19,999 | 38 (11.1%) | 0 (0.0%) |
| $20,000 to $22,499 | 0 (0.0%) | 0 (0.0%) |
| $22,500 to $24,999 | 0 (0.0%) | 0 (0.0%) |
| $25,000 to $29,999 | 0 (0.0%) | 0 (0.0%) |
| $30,000 to $34,999 | 0 (0.0%) | 0 (0.0%) |
| $35,000 to $39,999 | 9 (2.6%) | 0 (0.0%) |
| $40,000 to $44,999 | 18 (5.3%) | 0 (0.0%) |
| $45,000 to $49,999 | 0 (0.0%) | 24 (13.3%) |
| $50,000 to $54,999 | 0 (0.0%) | 0 (0.0%) |
| $55,000 to $64,999 | 24 (7.0%) | 0 (0.0%) |
| $65,000 to $74,999 | 11 (3.2%) | 41 (22.7%) |
| $75,000 to $99,999 | 0 (0.0%) | 90 (49.7%) |
| $100,000+ | 202 (59.2%) | 15 (8.3%) |
| Total | 341 (100.0%) | 181 (100.0%) |
Earnings by Sex by Educational Attainment in Watson
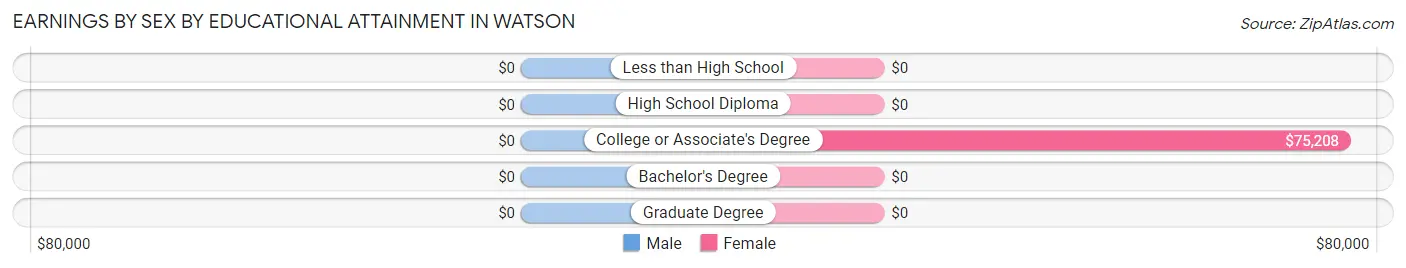
| Educational Attainment | Male Income | Female Income |
| Less than High School | - | - |
| High School Diploma | - | - |
| College or Associate's Degree | - | - |
| Bachelor's Degree | - | - |
| Graduate Degree | - | - |
| Total | $128,327 | $76,510 |
Family Income in Watson
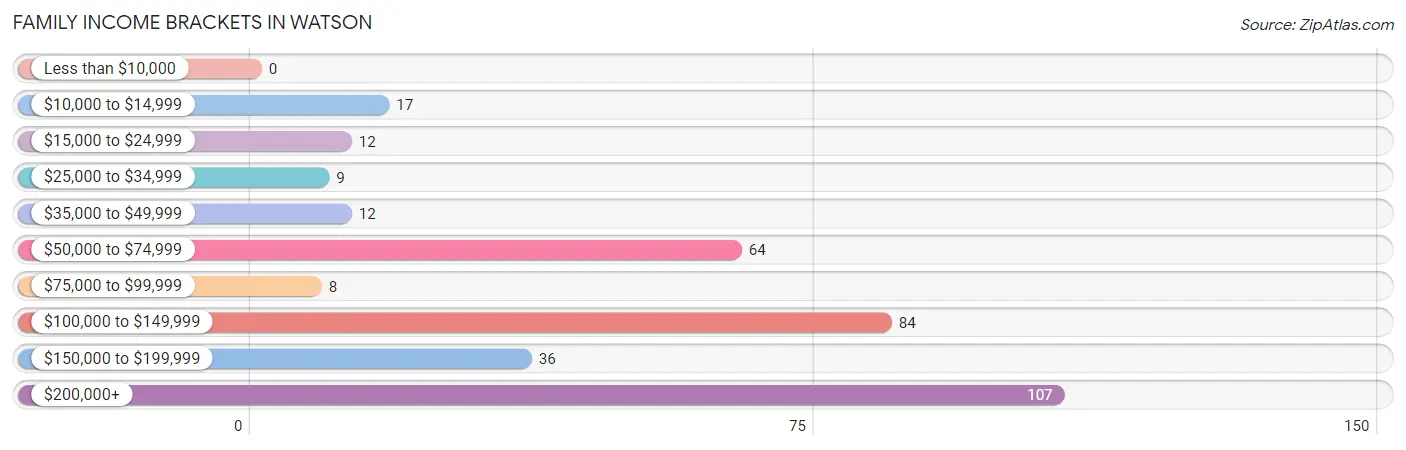
Family Income Brackets in Watson
According to the Watson family income data, there are 107 families falling into the $200,000+ income range, which is the most common income bracket and makes up 30.7% of all families.
| Income Bracket | # Families | % Families |
| Less than $10,000 | 0 | 0.0% |
| $10,000 to $14,999 | 17 | 4.9% |
| $15,000 to $24,999 | 12 | 3.4% |
| $25,000 to $34,999 | 9 | 2.6% |
| $35,000 to $49,999 | 12 | 3.4% |
| $50,000 to $74,999 | 64 | 18.3% |
| $75,000 to $99,999 | 8 | 2.3% |
| $100,000 to $149,999 | 84 | 24.1% |
| $150,000 to $199,999 | 36 | 10.3% |
| $200,000+ | 107 | 30.7% |
Family Income by Famaliy Size in Watson
| Income Bracket | # Families | Median Income |
| 2-Person Families | 164 (47.0%) | $0 |
| 3-Person Families | 24 (6.9%) | $0 |
| 4-Person Families | 83 (23.8%) | $0 |
| 5-Person Families | 54 (15.5%) | $0 |
| 6-Person Families | 24 (6.9%) | $0 |
| 7+ Person Families | 0 (0.0%) | $0 |
| Total | 349 (100.0%) | $131,458 |
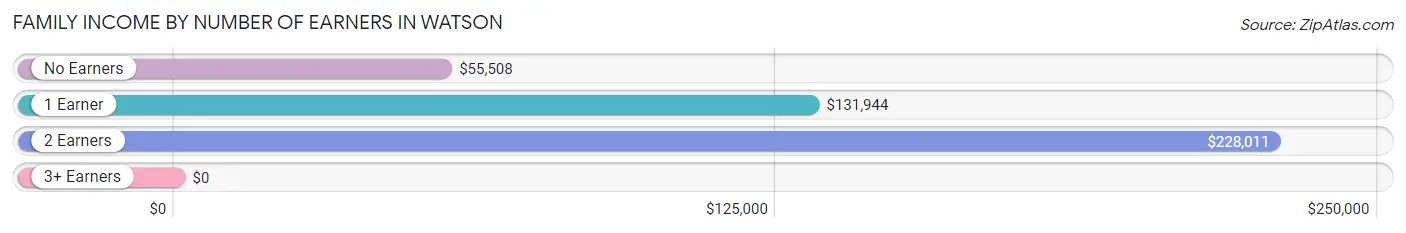
Family Income by Number of Earners in Watson
| Number of Earners | # Families | Median Income |
| No Earners | 102 (29.2%) | $55,508 |
| 1 Earner | 80 (22.9%) | $131,944 |
| 2 Earners | 167 (47.8%) | $228,011 |
| 3+ Earners | 0 (0.0%) | $0 |
| Total | 349 (100.0%) | $131,458 |
Household Income in Watson
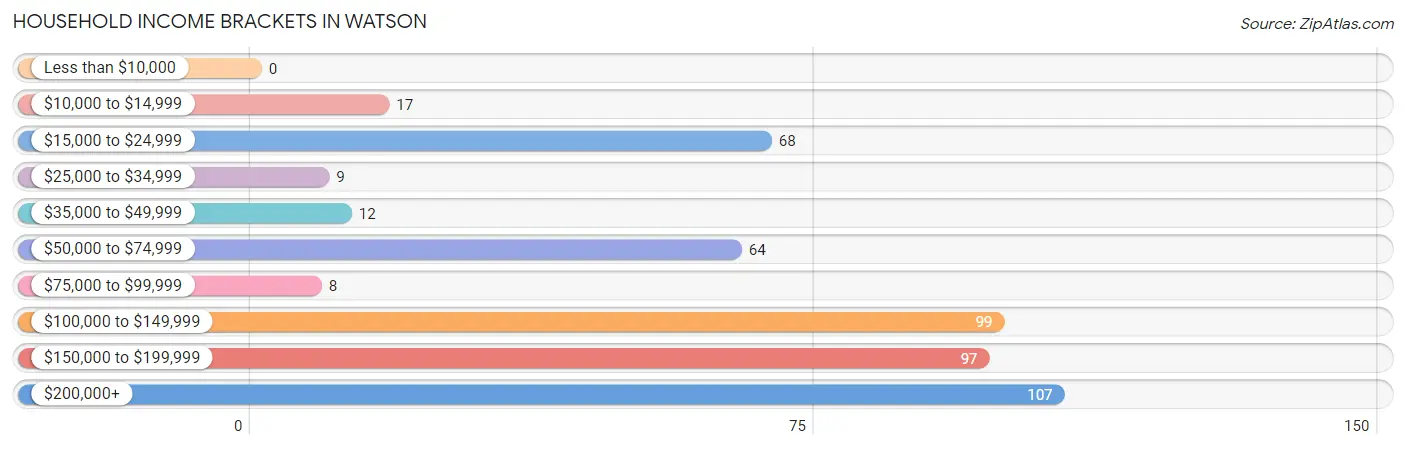
Household Income Brackets in Watson
With 107 households falling in the category, the $200,000+ income range is the most frequent in Watson, accounting for 22.3% of all households.
| Income Bracket | # Households | % Households |
| Less than $10,000 | 0 | 0.0% |
| $10,000 to $14,999 | 17 | 3.5% |
| $15,000 to $24,999 | 68 | 14.1% |
| $25,000 to $34,999 | 9 | 1.9% |
| $35,000 to $49,999 | 12 | 2.5% |
| $50,000 to $74,999 | 64 | 13.3% |
| $75,000 to $99,999 | 8 | 1.7% |
| $100,000 to $149,999 | 99 | 20.6% |
| $150,000 to $199,999 | 97 | 20.2% |
| $200,000+ | 107 | 22.2% |
Household Income by Householder Age in Watson
The median household income in Watson is $130,764, with the highest median household income of $227,841 found in the 25 to 44 years age bracket for the primary householder. A total of 114 households (23.7%) fall into this category.
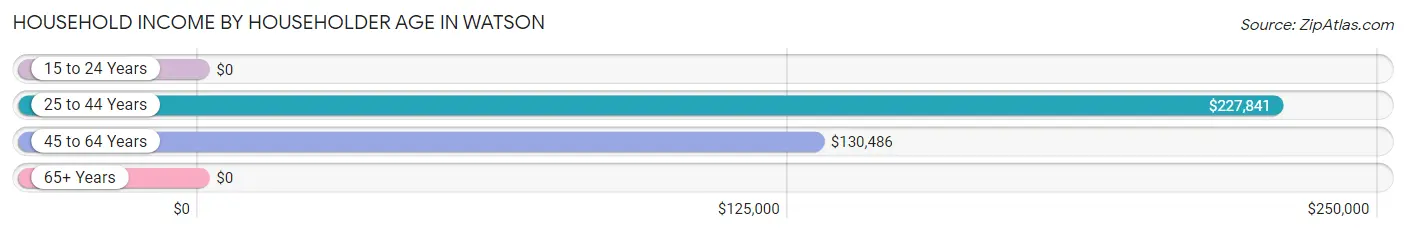
| Income Bracket | # Households | Median Income |
| 15 to 24 Years | 0 (0.0%) | $0 |
| 25 to 44 Years | 114 (23.7%) | $227,841 |
| 45 to 64 Years | 305 (63.4%) | $130,486 |
| 65+ Years | 62 (12.9%) | $0 |
| Total | 481 (100.0%) | $130,764 |
Poverty in Watson
Income Below Poverty by Sex and Age in Watson
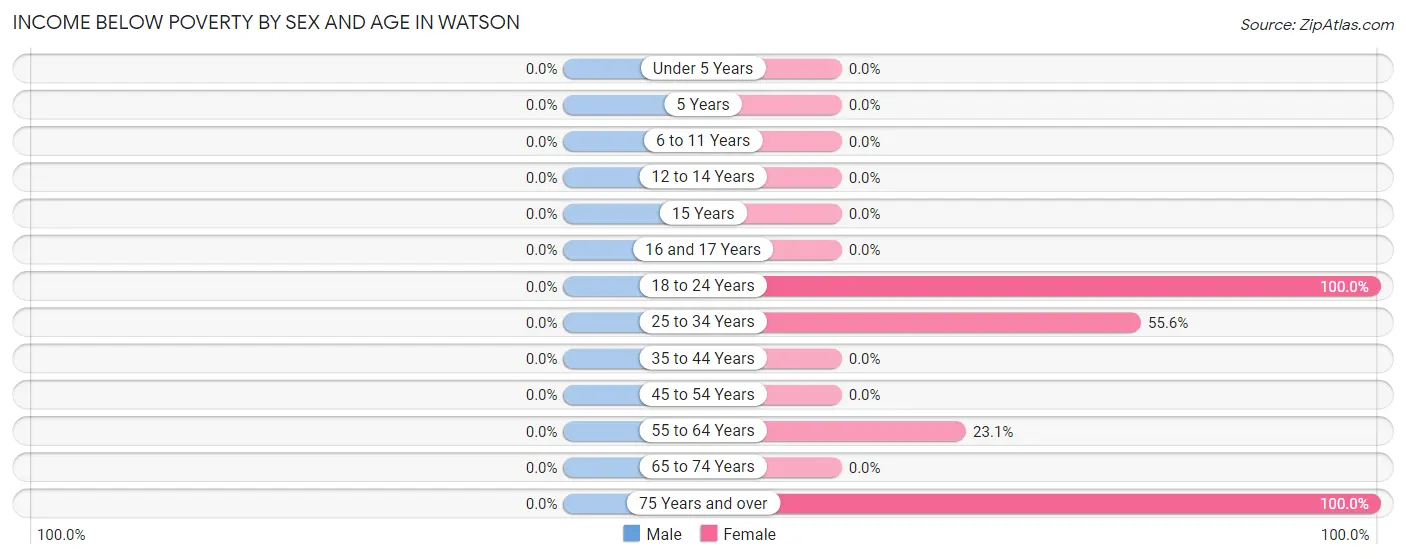
| Age Bracket | Male | Female |
| Under 5 Years | 0 (0.0%) | 0 (0.0%) |
| 5 Years | 0 (0.0%) | 0 (0.0%) |
| 6 to 11 Years | 0 (0.0%) | 0 (0.0%) |
| 12 to 14 Years | 0 (0.0%) | 0 (0.0%) |
| 15 Years | 0 (0.0%) | 0 (0.0%) |
| 16 and 17 Years | 0 (0.0%) | 0 (0.0%) |
| 18 to 24 Years | 0 (0.0%) | 28 (100.0%) |
| 25 to 34 Years | 0 (0.0%) | 30 (55.6%) |
| 35 to 44 Years | 0 (0.0%) | 0 (0.0%) |
| 45 to 54 Years | 0 (0.0%) | 0 (0.0%) |
| 55 to 64 Years | 0 (0.0%) | 33 (23.1%) |
| 65 to 74 Years | 0 (0.0%) | 0 (0.0%) |
| 75 Years and over | 0 (0.0%) | 17 (100.0%) |
| Total | 0 (0.0%) | 108 (17.8%) |
Income Above Poverty by Sex and Age in Watson
According to the poverty statistics in Watson, males aged under 5 years and females aged under 5 years are the age groups that are most secure financially, with 100.0% of males and 100.0% of females in these age groups living above the poverty line.
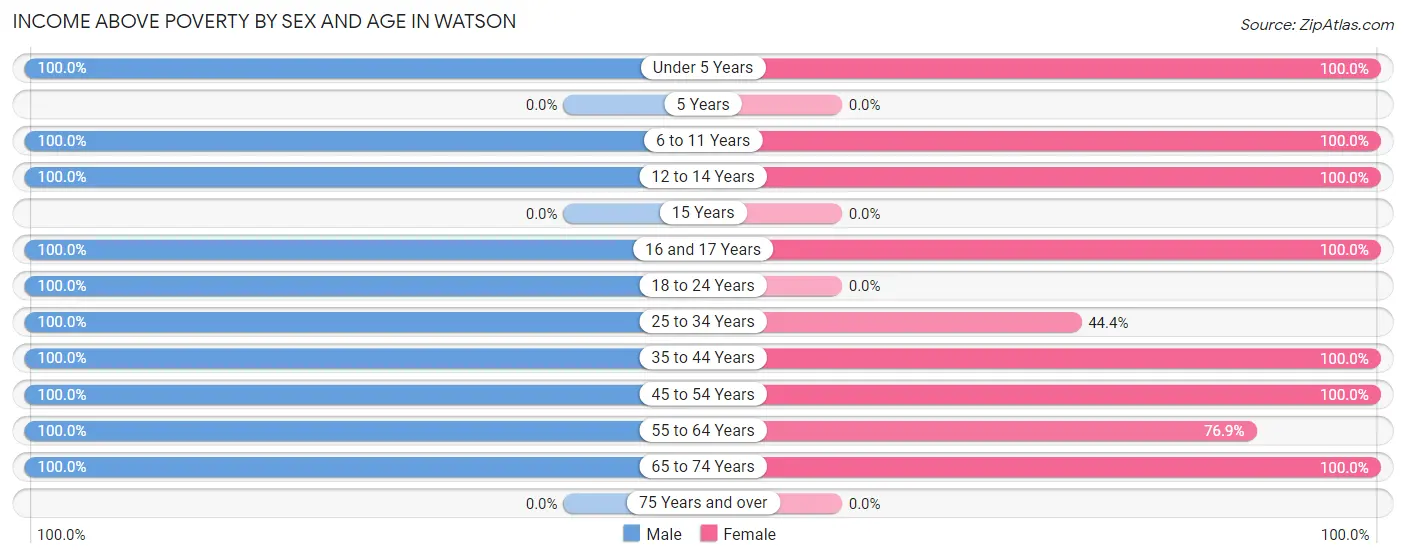
| Age Bracket | Male | Female |
| Under 5 Years | 23 (100.0%) | 22 (100.0%) |
| 5 Years | 0 (0.0%) | 0 (0.0%) |
| 6 to 11 Years | 92 (100.0%) | 24 (100.0%) |
| 12 to 14 Years | 18 (100.0%) | 89 (100.0%) |
| 15 Years | 0 (0.0%) | 0 (0.0%) |
| 16 and 17 Years | 55 (100.0%) | 19 (100.0%) |
| 18 to 24 Years | 155 (100.0%) | 0 (0.0%) |
| 25 to 34 Years | 11 (100.0%) | 24 (44.4%) |
| 35 to 44 Years | 173 (100.0%) | 90 (100.0%) |
| 45 to 54 Years | 117 (100.0%) | 77 (100.0%) |
| 55 to 64 Years | 100 (100.0%) | 110 (76.9%) |
| 65 to 74 Years | 93 (100.0%) | 45 (100.0%) |
| 75 Years and over | 0 (0.0%) | 0 (0.0%) |
| Total | 837 (100.0%) | 500 (82.2%) |
Income Below Poverty Among Married-Couple Families in Watson
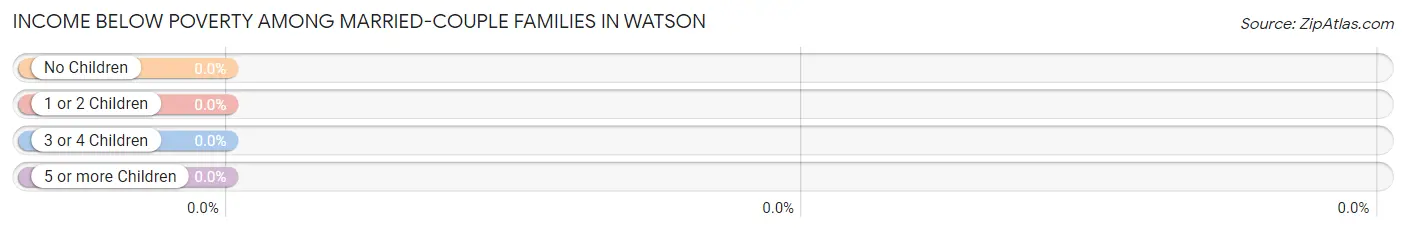
| Children | Above Poverty | Below Poverty |
| No Children | 134 (100.0%) | 0 (0.0%) |
| 1 or 2 Children | 144 (100.0%) | 0 (0.0%) |
| 3 or 4 Children | 24 (100.0%) | 0 (0.0%) |
| 5 or more Children | 0 (0.0%) | 0 (0.0%) |
| Total | 302 (100.0%) | 0 (0.0%) |
Income Below Poverty Among Single-Parent Households in Watson
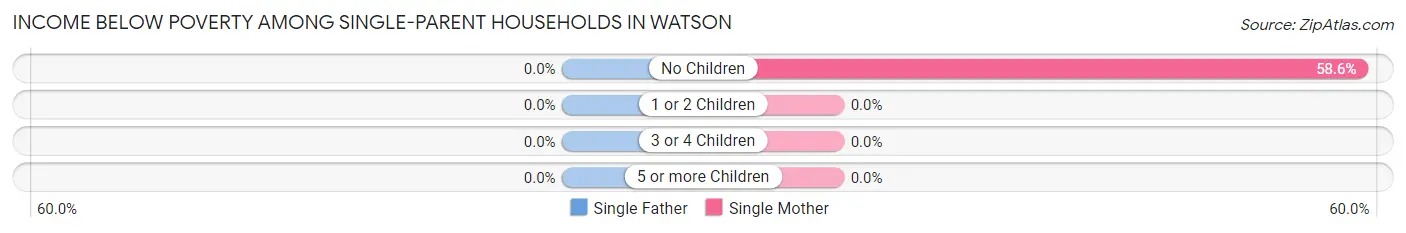
| Children | Single Father | Single Mother |
| No Children | 0 (0.0%) | 17 (58.6%) |
| 1 or 2 Children | 0 (0.0%) | 0 (0.0%) |
| 3 or 4 Children | 0 (0.0%) | 0 (0.0%) |
| 5 or more Children | 0 (0.0%) | 0 (0.0%) |
| Total | 0 (0.0%) | 17 (58.6%) |
Income Below Poverty Among Married-Couple vs Single-Parent Households in Watson
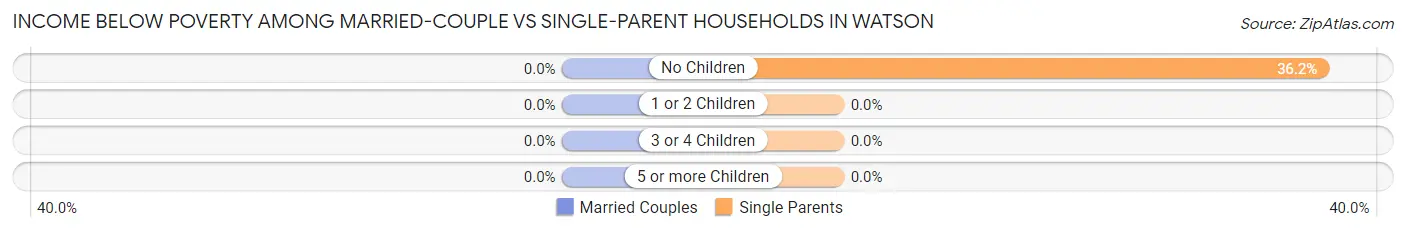
| Children | Married-Couple Families | Single-Parent Households |
| No Children | 0 (0.0%) | 17 (36.2%) |
| 1 or 2 Children | 0 (0.0%) | 0 (0.0%) |
| 3 or 4 Children | 0 (0.0%) | 0 (0.0%) |
| 5 or more Children | 0 (0.0%) | 0 (0.0%) |
| Total | 0 (0.0%) | 17 (36.2%) |
Race in Watson
The most populous races in Watson are White / Caucasian (1,407 | 97.4%), Hispanic or Latino (82 | 5.7%), and Two or more Races (38 | 2.6%).
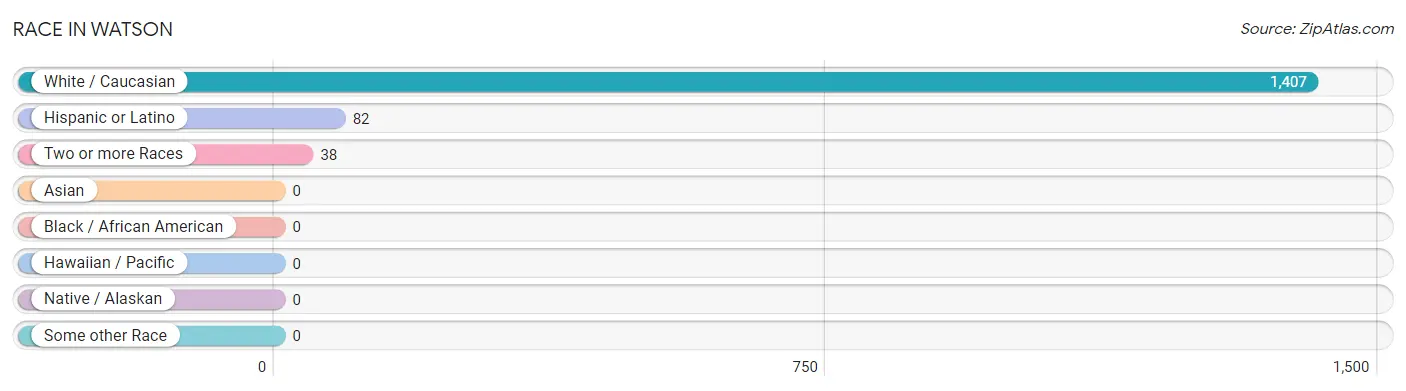
| Race | # Population | % Population |
| Asian | 0 | 0.0% |
| Black / African American | 0 | 0.0% |
| Hawaiian / Pacific | 0 | 0.0% |
| Hispanic or Latino | 82 | 5.7% |
| Native / Alaskan | 0 | 0.0% |
| White / Caucasian | 1,407 | 97.4% |
| Two or more Races | 38 | 2.6% |
| Some other Race | 0 | 0.0% |
| Total | 1,445 | 100.0% |
Ancestry in Watson
The most populous ancestries reported in Watson are French (556 | 38.5%), Irish (317 | 21.9%), German (145 | 10.0%), English (125 | 8.6%), and Cuban (82 | 5.7%), together accounting for 84.8% of all Watson residents.
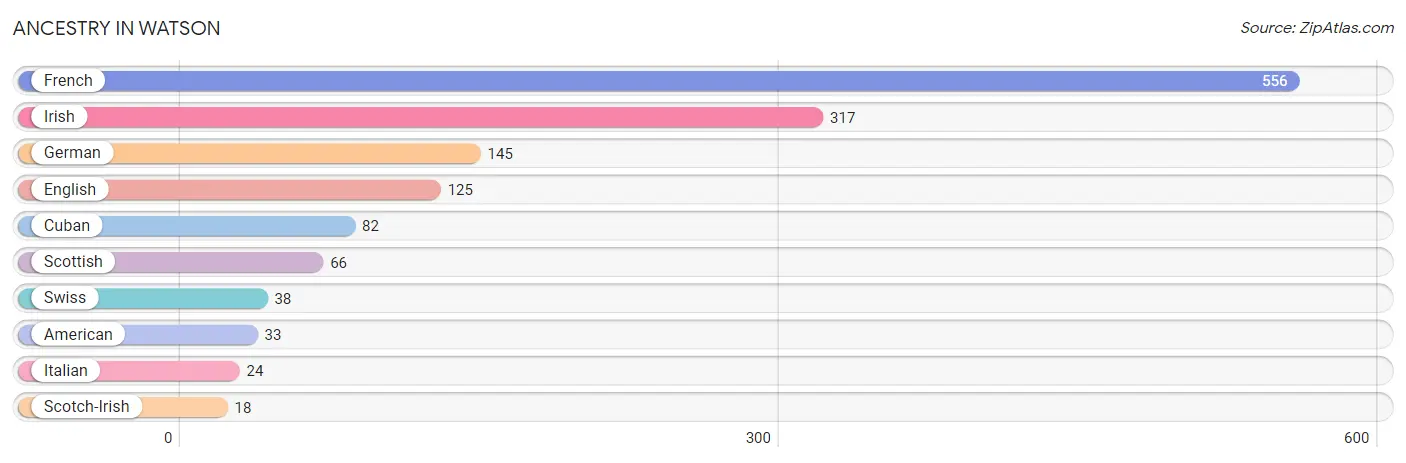
| Ancestry | # Population | % Population |
| American | 33 | 2.3% |
| Cuban | 82 | 5.7% |
| English | 125 | 8.6% |
| French | 556 | 38.5% |
| German | 145 | 10.0% |
| Irish | 317 | 21.9% |
| Italian | 24 | 1.7% |
| Scotch-Irish | 18 | 1.3% |
| Scottish | 66 | 4.6% |
| Swiss | 38 | 2.6% | View All 10 Rows |
Immigrants in Watson
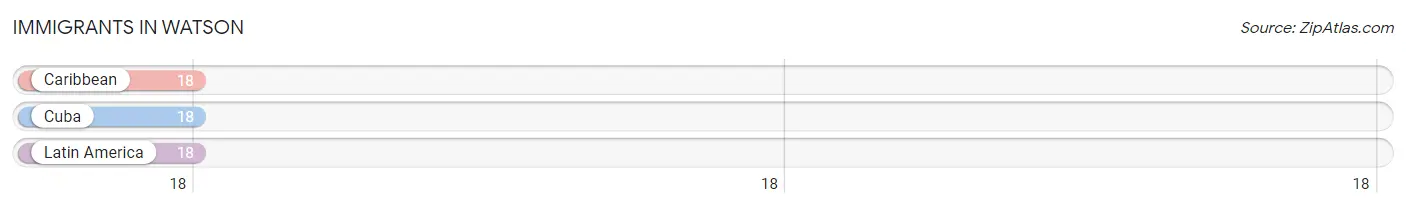
The most numerous immigrant groups reported in Watson came from Caribbean (18 | 1.3%), Cuba (18 | 1.3%), and Latin America (18 | 1.3%), together accounting for 3.8% of all Watson residents.
| Immigration Origin | # Population | % Population |
| Caribbean | 18 | 1.3% |
| Cuba | 18 | 1.3% |
| Latin America | 18 | 1.3% | View All 3 Rows |
Sex and Age in Watson
Sex and Age in Watson
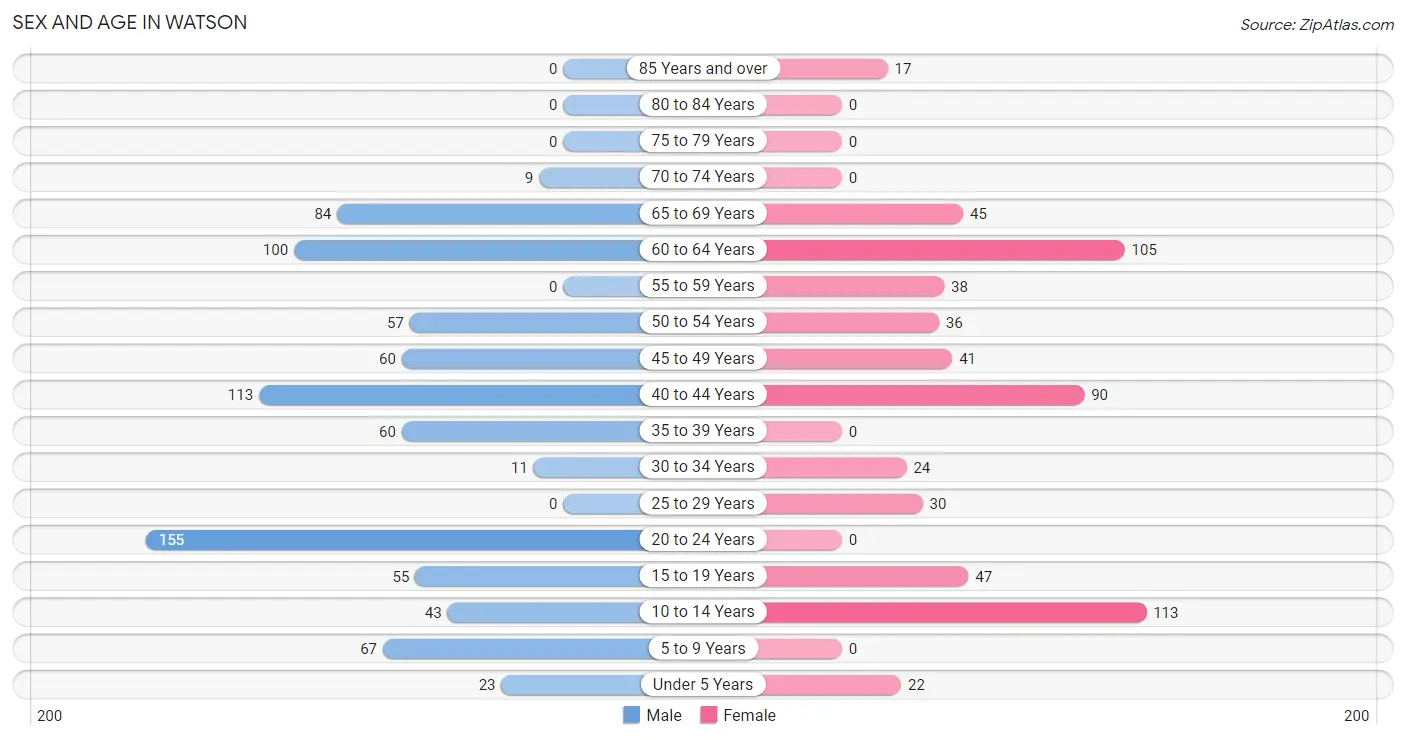
The most populous age groups in Watson are 20 to 24 Years (155 | 18.5%) for men and 10 to 14 Years (113 | 18.6%) for women.
| Age Bracket | Male | Female |
| Under 5 Years | 23 (2.8%) | 22 (3.6%) |
| 5 to 9 Years | 67 (8.0%) | 0 (0.0%) |
| 10 to 14 Years | 43 (5.1%) | 113 (18.6%) |
| 15 to 19 Years | 55 (6.6%) | 47 (7.7%) |
| 20 to 24 Years | 155 (18.5%) | 0 (0.0%) |
| 25 to 29 Years | 0 (0.0%) | 30 (4.9%) |
| 30 to 34 Years | 11 (1.3%) | 24 (4.0%) |
| 35 to 39 Years | 60 (7.2%) | 0 (0.0%) |
| 40 to 44 Years | 113 (13.5%) | 90 (14.8%) |
| 45 to 49 Years | 60 (7.2%) | 41 (6.7%) |
| 50 to 54 Years | 57 (6.8%) | 36 (5.9%) |
| 55 to 59 Years | 0 (0.0%) | 38 (6.2%) |
| 60 to 64 Years | 100 (11.9%) | 105 (17.3%) |
| 65 to 69 Years | 84 (10.0%) | 45 (7.4%) |
| 70 to 74 Years | 9 (1.1%) | 0 (0.0%) |
| 75 to 79 Years | 0 (0.0%) | 0 (0.0%) |
| 80 to 84 Years | 0 (0.0%) | 0 (0.0%) |
| 85 Years and over | 0 (0.0%) | 17 (2.8%) |
| Total | 837 (100.0%) | 608 (100.0%) |
Families and Households in Watson
Median Family Size in Watson
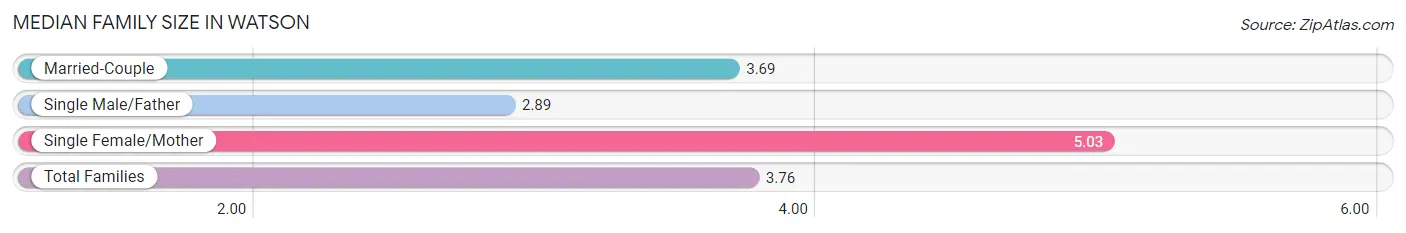
The median family size in Watson is 3.76 persons per family, with single female/mother families (29 | 8.3%) accounting for the largest median family size of 5.03 persons per family. On the other hand, single male/father families (18 | 5.2%) represent the smallest median family size with 2.89 persons per family.
| Family Type | # Families | Family Size |
| Married-Couple | 302 (86.5%) | 3.69 |
| Single Male/Father | 18 (5.2%) | 2.89 |
| Single Female/Mother | 29 (8.3%) | 5.03 |
| Total Families | 349 (100.0%) | 3.76 |
Median Household Size in Watson
| Household Type | # Households | Household Size |
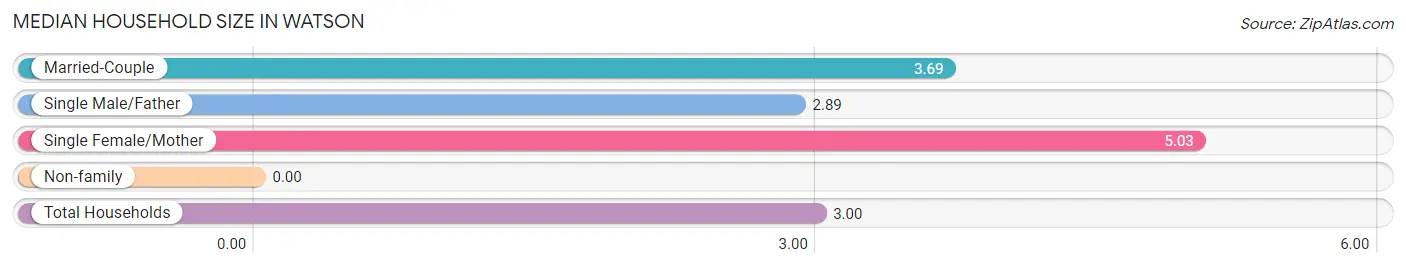
| Married-Couple | 302 (62.8%) | 3.69 |
| Single Male/Father | 18 (3.7%) | 2.89 |
| Single Female/Mother | 29 (6.0%) | 5.03 |
| Non-family | 132 (27.4%) | - |
| Total Households | 481 (100.0%) | 3.00 |
Household Size by Marriage Status in Watson
Out of a total of 481 households in Watson, 349 (72.6%) are family households, while 132 (27.4%) are nonfamily households. The most numerous type of family households are 2-person households, comprising 164, and the most common type of nonfamily households are 1-person households, comprising 132.
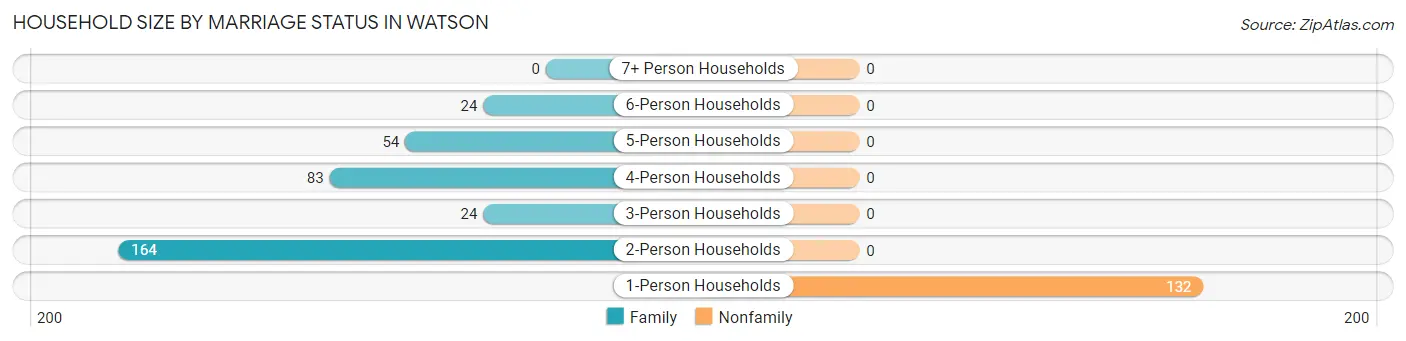
| Household Size | Family Households | Nonfamily Households |
| 1-Person Households | - | 132 (27.4%) |
| 2-Person Households | 164 (34.1%) | 0 (0.0%) |
| 3-Person Households | 24 (5.0%) | 0 (0.0%) |
| 4-Person Households | 83 (17.3%) | 0 (0.0%) |
| 5-Person Households | 54 (11.2%) | 0 (0.0%) |
| 6-Person Households | 24 (5.0%) | 0 (0.0%) |
| 7+ Person Households | 0 (0.0%) | 0 (0.0%) |
| Total | 349 (72.6%) | 132 (27.4%) |
Female Fertility in Watson
Fertility by Age in Watson
Average fertility rate in Watson is 103.0 births per 1,000 women. Women in the age bracket of 20 to 34 years have the highest fertility rate with 444.0 births per 1,000 women. Women in the age bracket of 20 to 34 years acount for 100.0% of all women with births.
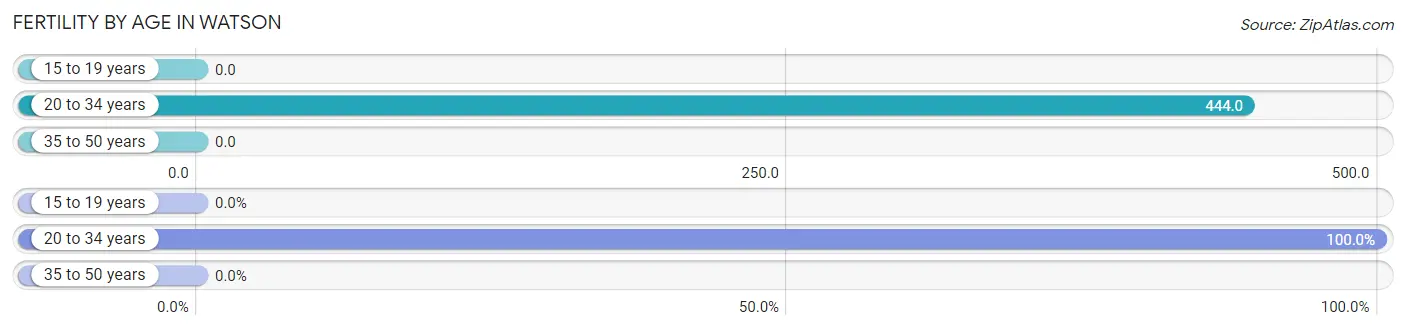
| Age Bracket | Women with Births | Births / 1,000 Women |
| 15 to 19 years | 0 (0.0%) | 0.0 |
| 20 to 34 years | 24 (100.0%) | 444.0 |
| 35 to 50 years | 0 (0.0%) | 0.0 |
| Total | 24 (100.0%) | 103.0 |
Fertility by Age by Marriage Status in Watson
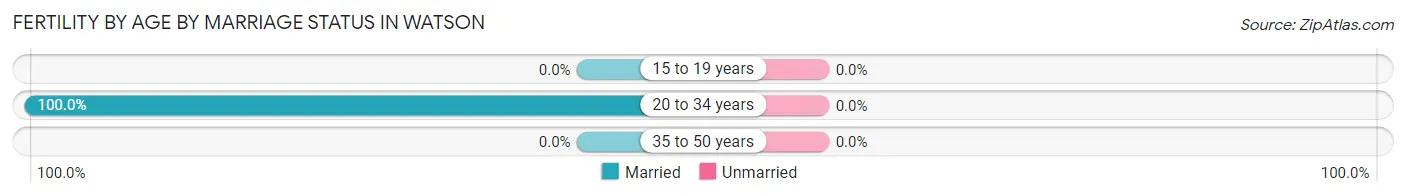
| Age Bracket | Married | Unmarried |
| 15 to 19 years | 0 (0.0%) | 0 (0.0%) |
| 20 to 34 years | 24 (100.0%) | 0 (0.0%) |
| 35 to 50 years | 0 (0.0%) | 0 (0.0%) |
| Total | 24 (100.0%) | 0 (0.0%) |
Fertility by Education in Watson
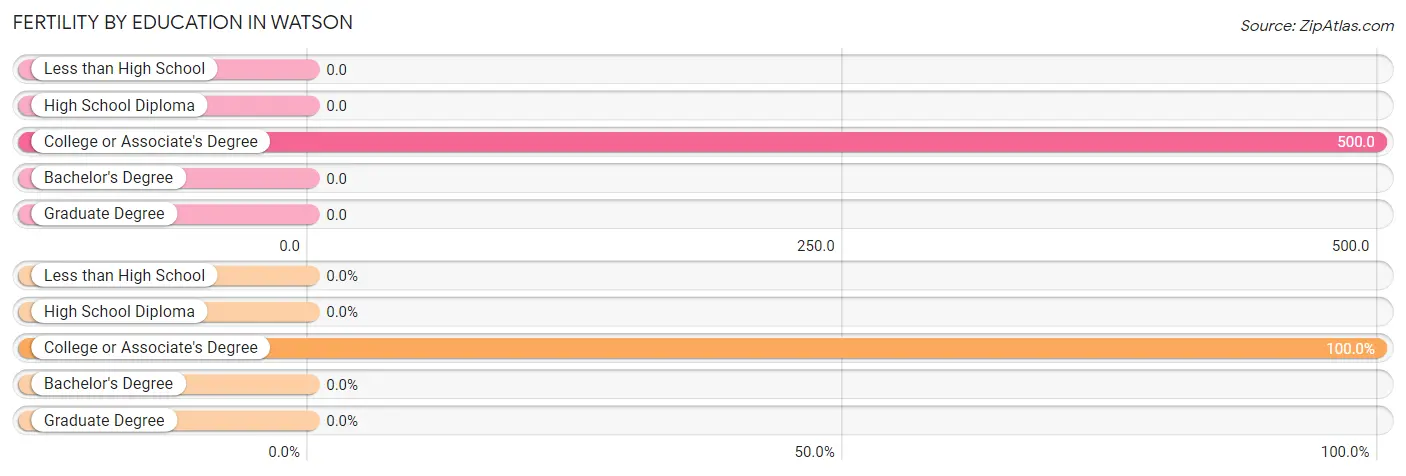
| Educational Attainment | Women with Births | Births / 1,000 Women |
| Less than High School | 0 (0.0%) | 0.0 |
| High School Diploma | 0 (0.0%) | 0.0 |
| College or Associate's Degree | 24 (100.0%) | 500.0 |
| Bachelor's Degree | 0 (0.0%) | 0.0 |
| Graduate Degree | 0 (0.0%) | 0.0 |
| Total | 24 (100.0%) | 103.0 |
Fertility by Education by Marriage Status in Watson
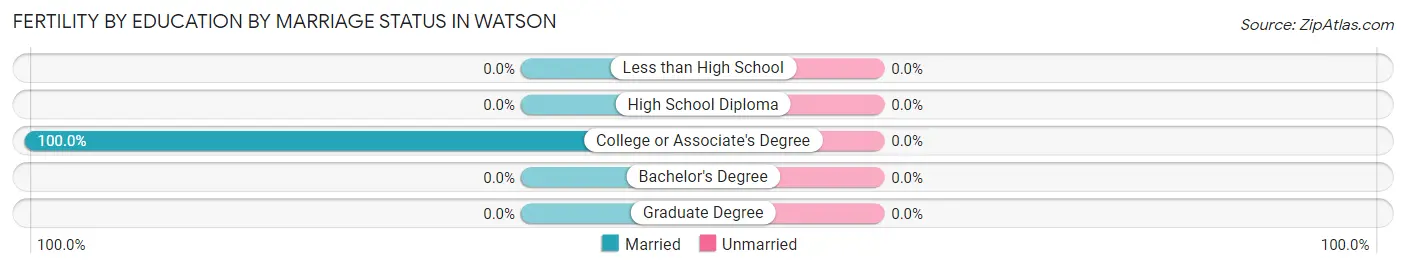
| Educational Attainment | Married | Unmarried |
| Less than High School | 0 (0.0%) | 0 (0.0%) |
| High School Diploma | 0 (0.0%) | 0 (0.0%) |
| College or Associate's Degree | 24 (100.0%) | 0 (0.0%) |
| Bachelor's Degree | 0 (0.0%) | 0 (0.0%) |
| Graduate Degree | 0 (0.0%) | 0 (0.0%) |
| Total | 24 (100.0%) | 0 (0.0%) |
Employment Characteristics in Watson
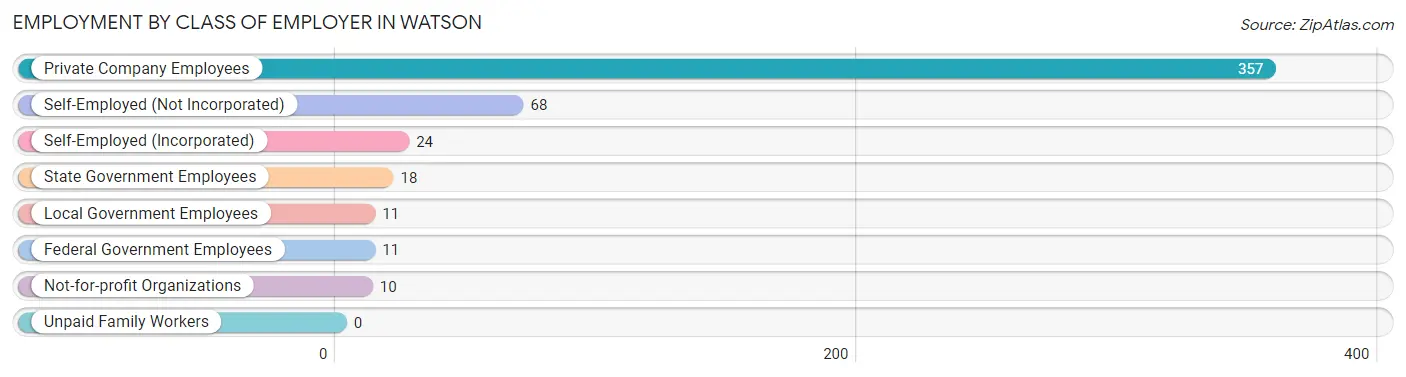
Employment by Class of Employer in Watson
Among the 499 employed individuals in Watson, private company employees (357 | 71.5%), self-employed (not incorporated) (68 | 13.6%), and self-employed (incorporated) (24 | 4.8%) make up the most common classes of employment.
| Employer Class | # Employees | % Employees |
| Private Company Employees | 357 | 71.5% |
| Self-Employed (Incorporated) | 24 | 4.8% |
| Self-Employed (Not Incorporated) | 68 | 13.6% |
| Not-for-profit Organizations | 10 | 2.0% |
| Local Government Employees | 11 | 2.2% |
| State Government Employees | 18 | 3.6% |
| Federal Government Employees | 11 | 2.2% |
| Unpaid Family Workers | 0 | 0.0% |
| Total | 499 | 100.0% |
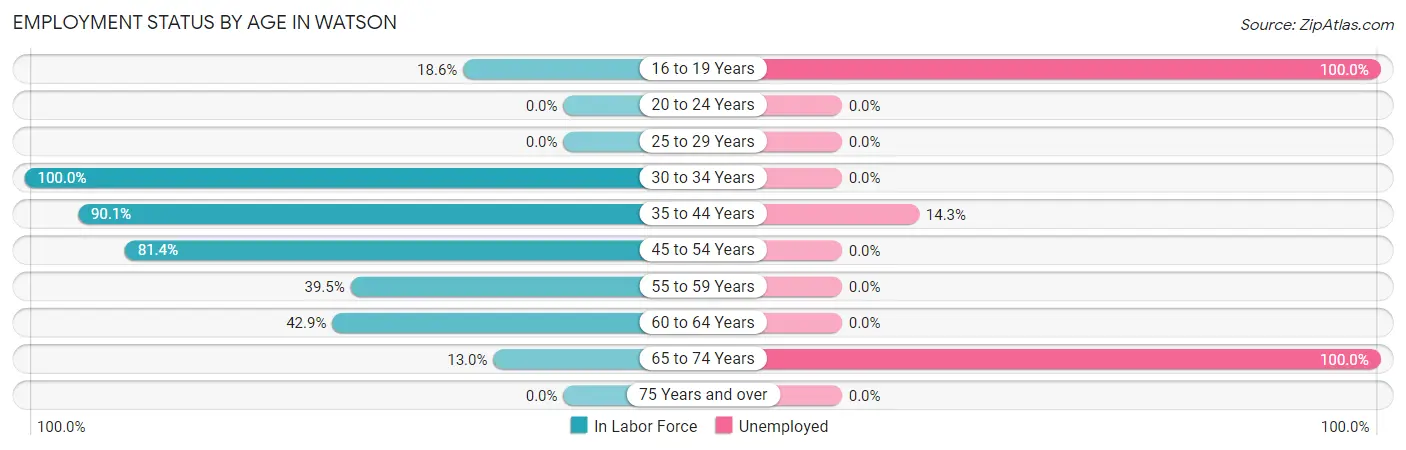
Employment Status by Age in Watson
According to the labor force statistics for Watson, out of the total population over 16 years of age (1,177), 48.4% or 570 individuals are in the labor force, with 12.5% or 71 of them unemployed. The age group with the highest labor force participation rate is 30 to 34 years, with 100.0% or 35 individuals in the labor force. Within the labor force, the 16 to 19 years age range has the highest percentage of unemployed individuals, with 100.0% or 19 of them being unemployed.
| Age Bracket | In Labor Force | Unemployed |
| 16 to 19 Years | 19 (18.6%) | 19 (100.0%) |
| 20 to 24 Years | 0 (0.0%) | 0 (0.0%) |
| 25 to 29 Years | 0 (0.0%) | 0 (0.0%) |
| 30 to 34 Years | 35 (100.0%) | 0 (0.0%) |
| 35 to 44 Years | 237 (90.1%) | 34 (14.3%) |
| 45 to 54 Years | 158 (81.4%) | 0 (0.0%) |
| 55 to 59 Years | 15 (39.5%) | 0 (0.0%) |
| 60 to 64 Years | 88 (42.9%) | 0 (0.0%) |
| 65 to 74 Years | 18 (13.0%) | 18 (100.0%) |
| 75 Years and over | 0 (0.0%) | 0 (0.0%) |
| Total | 570 (48.4%) | 71 (12.5%) |
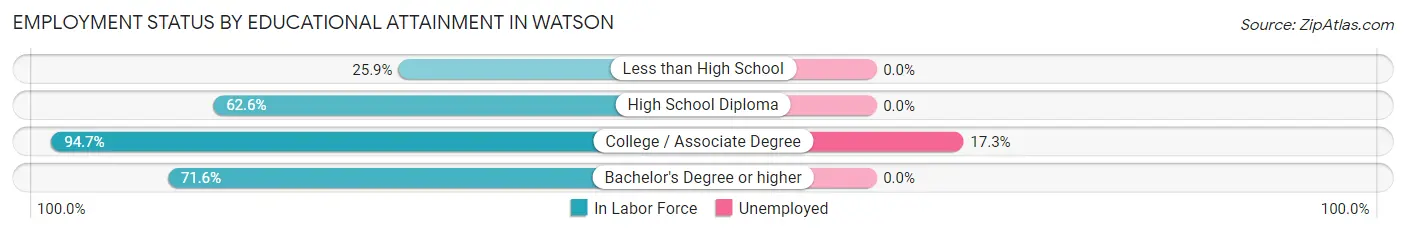
Employment Status by Educational Attainment in Watson
According to labor force statistics for Watson, 69.7% of individuals (533) out of the total population between 25 and 64 years of age (765) are in the labor force, with 6.4% or 34 of them being unemployed. The group with the highest labor force participation rate are those with the educational attainment of college / associate degree, with 94.7% or 196 individuals in the labor force. Within the labor force, individuals with college / associate degree education have the highest percentage of unemployment, with 17.3% or 34 of them being unemployed.
| Educational Attainment | In Labor Force | Unemployed |
| Less than High School | 22 (25.9%) | 0 (0.0%) |
| High School Diploma | 164 (62.6%) | 0 (0.0%) |
| College / Associate Degree | 196 (94.7%) | 36 (17.3%) |
| Bachelor's Degree or higher | 151 (71.6%) | 0 (0.0%) |
| Total | 533 (69.7%) | 49 (6.4%) |
Employment Occupations by Sex in Watson
Management, Business, Science and Arts Occupations
The most common Management, Business, Science and Arts occupations in Watson are Business & Financial (149 | 29.9%), Community & Social Service (31 | 6.2%), Arts, Media & Entertainment (31 | 6.2%), Management (15 | 3.0%), and Health Diagnosing & Treating (10 | 2.0%).
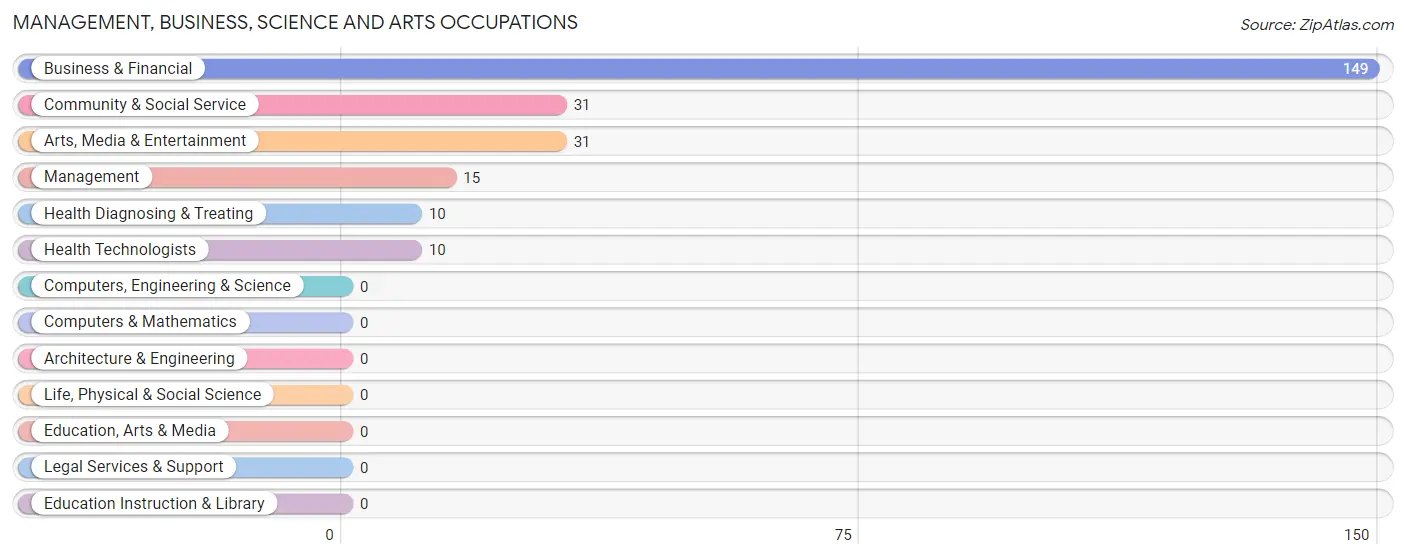
Management, Business, Science and Arts Occupations by Sex
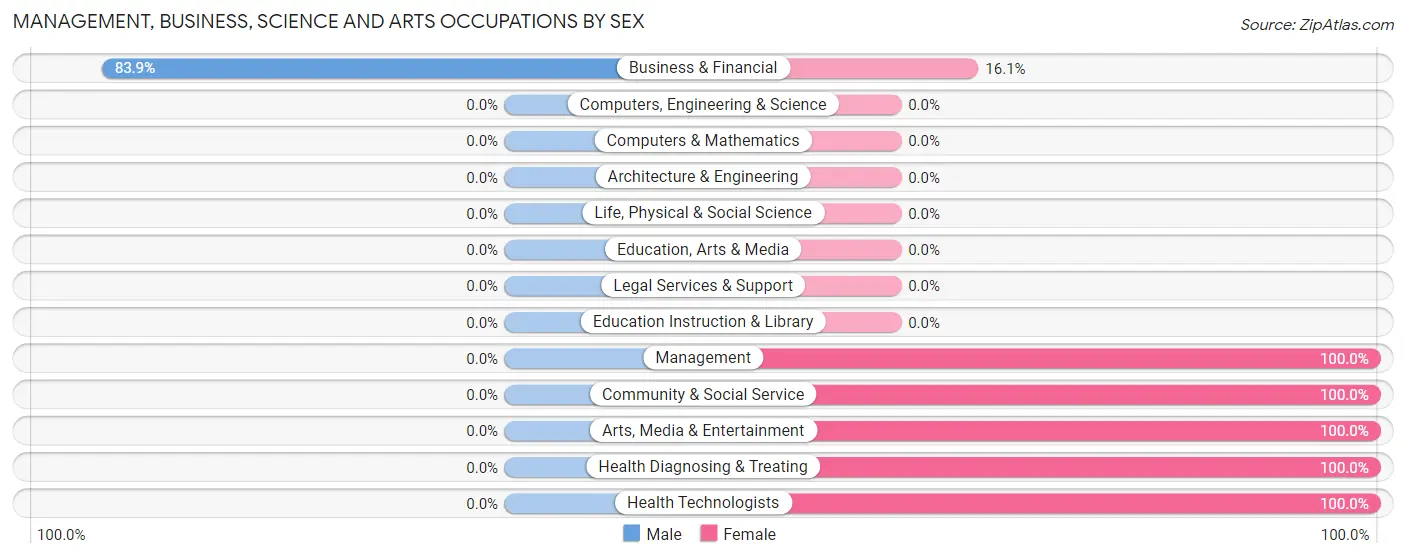
| Occupation | Male | Female |
| Management | 0 (0.0%) | 15 (100.0%) |
| Business & Financial | 125 (83.9%) | 24 (16.1%) |
| Computers, Engineering & Science | 0 (0.0%) | 0 (0.0%) |
| Computers & Mathematics | 0 (0.0%) | 0 (0.0%) |
| Architecture & Engineering | 0 (0.0%) | 0 (0.0%) |
| Life, Physical & Social Science | 0 (0.0%) | 0 (0.0%) |
| Community & Social Service | 0 (0.0%) | 31 (100.0%) |
| Education, Arts & Media | 0 (0.0%) | 0 (0.0%) |
| Legal Services & Support | 0 (0.0%) | 0 (0.0%) |
| Education Instruction & Library | 0 (0.0%) | 0 (0.0%) |
| Arts, Media & Entertainment | 0 (0.0%) | 31 (100.0%) |
| Health Diagnosing & Treating | 0 (0.0%) | 10 (100.0%) |
| Health Technologists | 0 (0.0%) | 10 (100.0%) |
| Total (Category) | 125 (61.0%) | 80 (39.0%) |
| Total (Overall) | 329 (65.9%) | 170 (34.1%) |
Services Occupations
The most common Services occupations in Watson are Personal Care & Service (24 | 4.8%), Security & Protection (11 | 2.2%), and Firefighting & Prevention (11 | 2.2%).
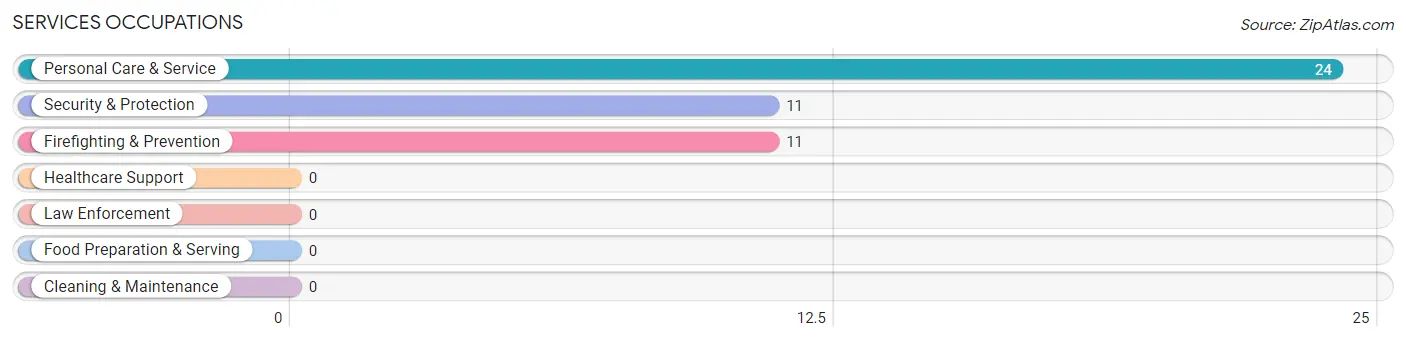
Services Occupations by Sex
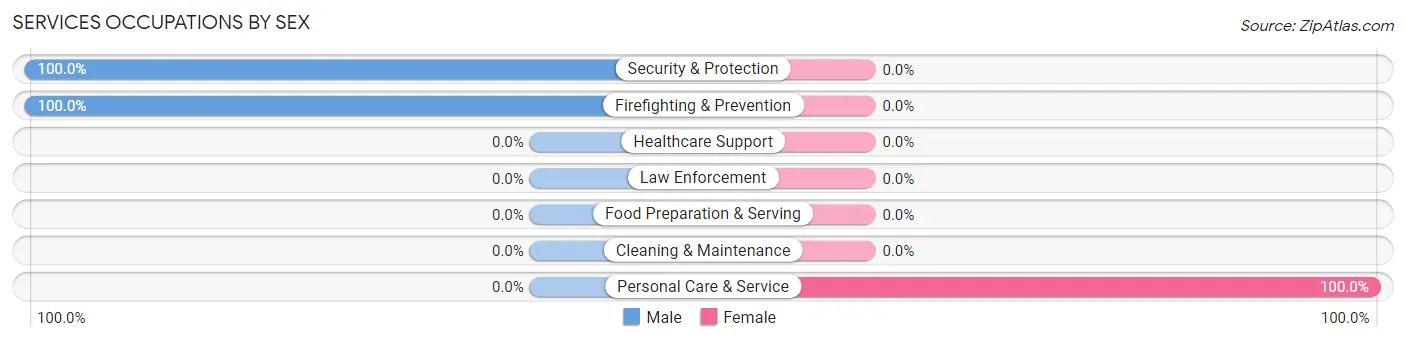
| Occupation | Male | Female |
| Healthcare Support | 0 (0.0%) | 0 (0.0%) |
| Security & Protection | 11 (100.0%) | 0 (0.0%) |
| Firefighting & Prevention | 11 (100.0%) | 0 (0.0%) |
| Law Enforcement | 0 (0.0%) | 0 (0.0%) |
| Food Preparation & Serving | 0 (0.0%) | 0 (0.0%) |
| Cleaning & Maintenance | 0 (0.0%) | 0 (0.0%) |
| Personal Care & Service | 0 (0.0%) | 24 (100.0%) |
| Total (Category) | 11 (31.4%) | 24 (68.6%) |
| Total (Overall) | 329 (65.9%) | 170 (34.1%) |
Sales and Office Occupations
The most common Sales and Office occupations in Watson are , and Sales & Related (90 | 18.0%).
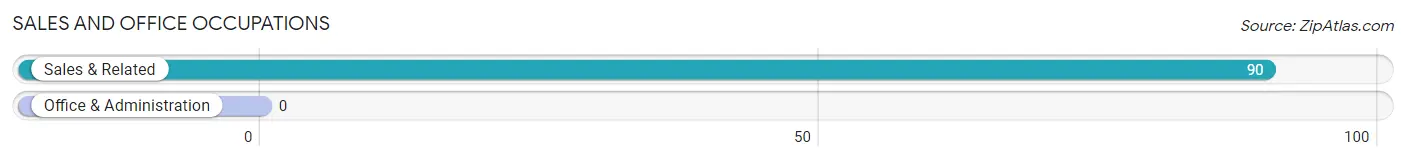
Sales and Office Occupations by Sex
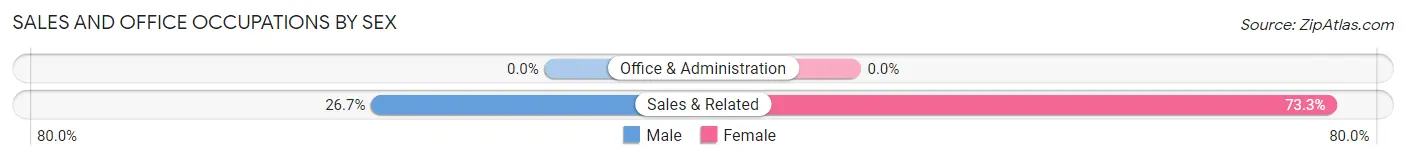
| Occupation | Male | Female |
| Sales & Related | 24 (26.7%) | 66 (73.3%) |
| Office & Administration | 0 (0.0%) | 0 (0.0%) |
| Total (Category) | 24 (26.7%) | 66 (73.3%) |
| Total (Overall) | 329 (65.9%) | 170 (34.1%) |
Natural Resources, Construction and Maintenance Occupations
The most common Natural Resources, Construction and Maintenance occupations in Watson are , and Installation, Maintenance & Repair (62 | 12.4%).
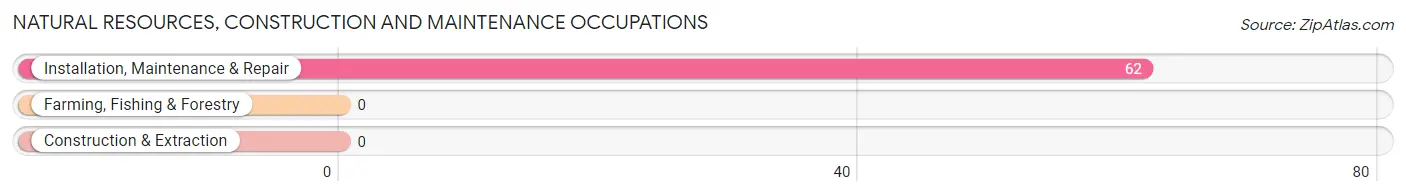
Natural Resources, Construction and Maintenance Occupations by Sex
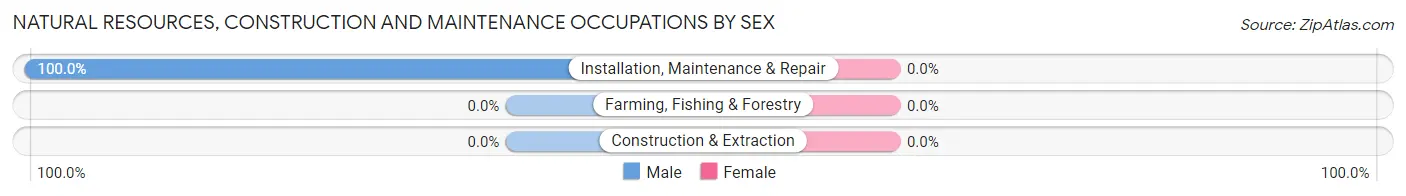
| Occupation | Male | Female |
| Farming, Fishing & Forestry | 0 (0.0%) | 0 (0.0%) |
| Construction & Extraction | 0 (0.0%) | 0 (0.0%) |
| Installation, Maintenance & Repair | 62 (100.0%) | 0 (0.0%) |
| Total (Category) | 62 (100.0%) | 0 (0.0%) |
| Total (Overall) | 329 (65.9%) | 170 (34.1%) |
Production, Transportation and Moving Occupations
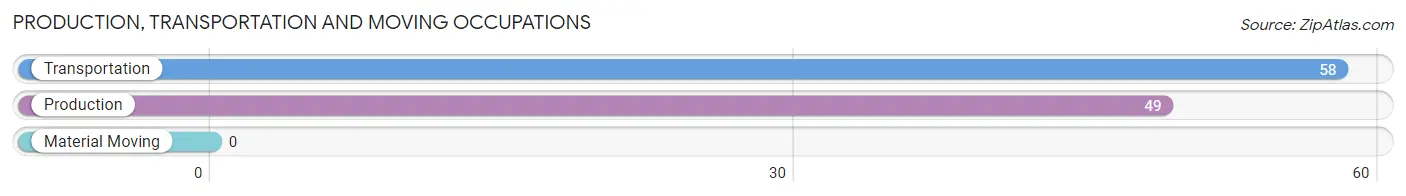
The most common Production, Transportation and Moving occupations in Watson are Transportation (58 | 11.6%), and Production (49 | 9.8%).
Production, Transportation and Moving Occupations by Sex
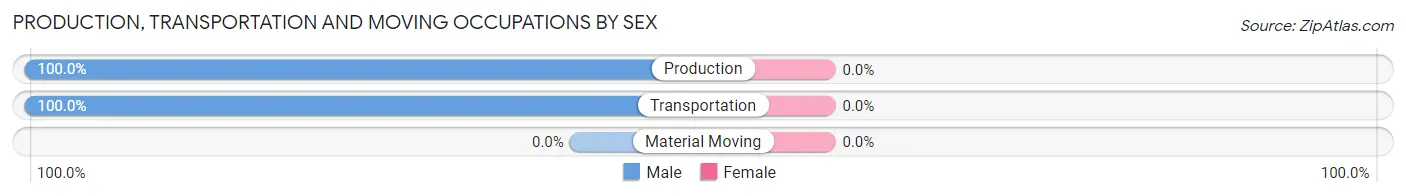
| Occupation | Male | Female |
| Production | 49 (100.0%) | 0 (0.0%) |
| Transportation | 58 (100.0%) | 0 (0.0%) |
| Material Moving | 0 (0.0%) | 0 (0.0%) |
| Total (Category) | 107 (100.0%) | 0 (0.0%) |
| Total (Overall) | 329 (65.9%) | 170 (34.1%) |
Employment Industries by Sex in Watson
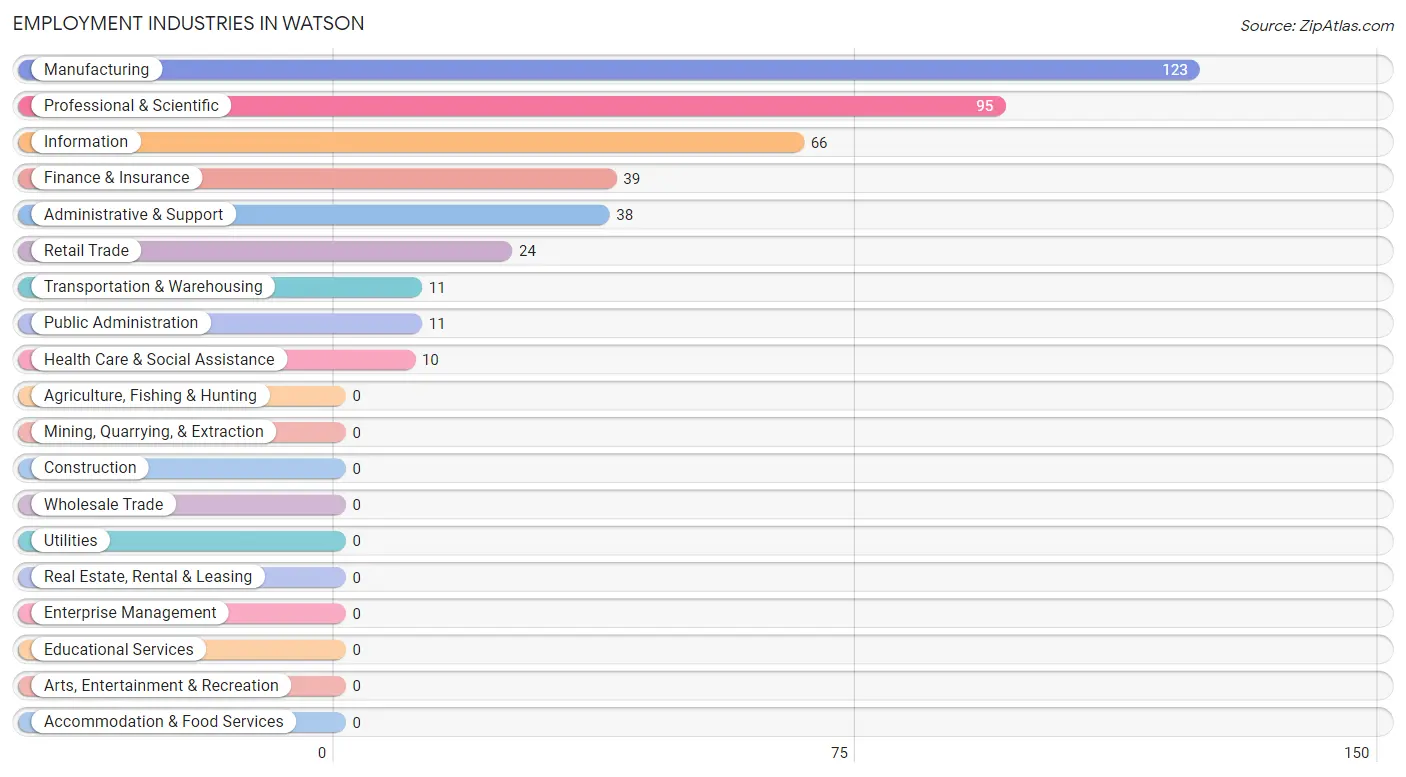
Employment Industries in Watson
The major employment industries in Watson include Manufacturing (123 | 24.6%), Professional & Scientific (95 | 19.0%), Information (66 | 13.2%), Finance & Insurance (39 | 7.8%), and Administrative & Support (38 | 7.6%).
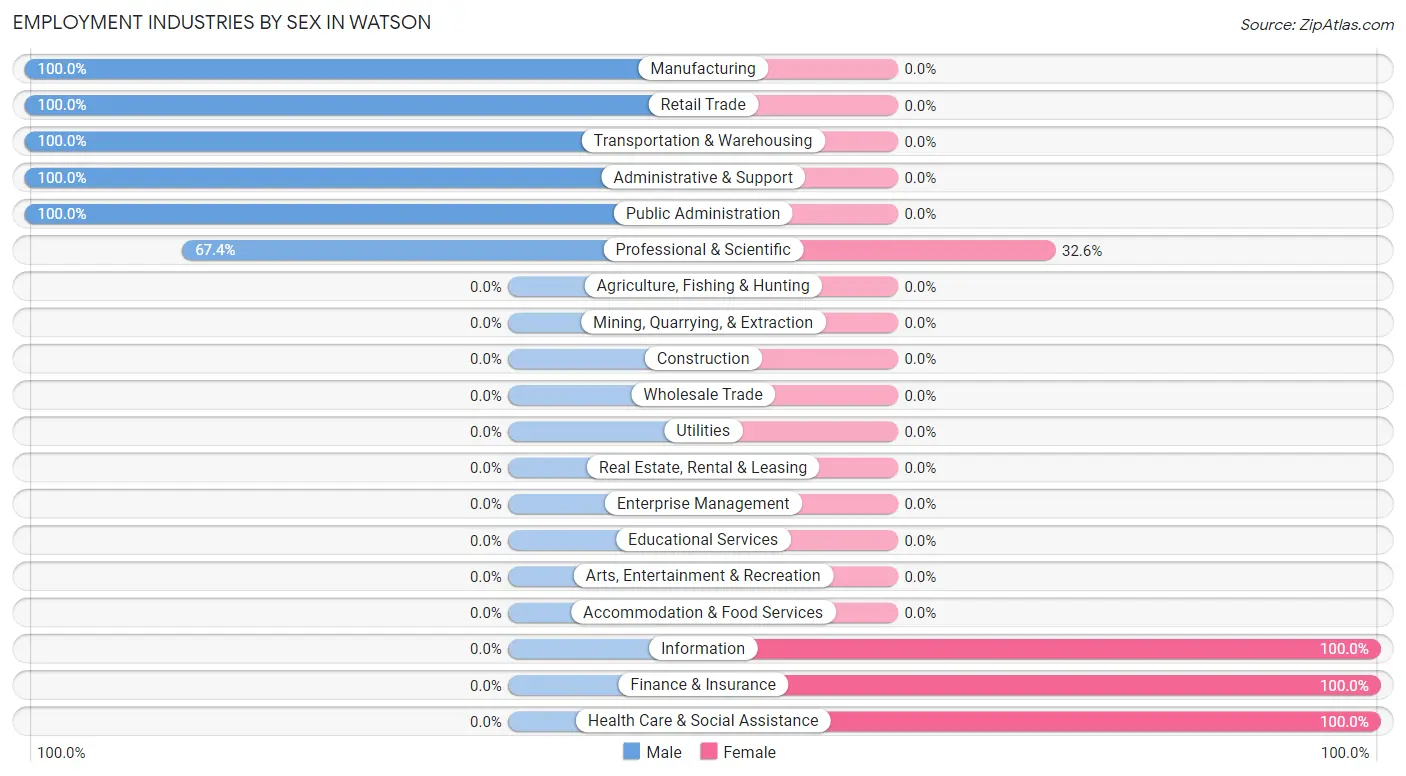
Employment Industries by Sex in Watson
The Watson industries that see more men than women are Manufacturing (100.0%), Retail Trade (100.0%), and Transportation & Warehousing (100.0%), whereas the industries that tend to have a higher number of women are Information (100.0%), Finance & Insurance (100.0%), and Health Care & Social Assistance (100.0%).
| Industry | Male | Female |
| Agriculture, Fishing & Hunting | 0 (0.0%) | 0 (0.0%) |
| Mining, Quarrying, & Extraction | 0 (0.0%) | 0 (0.0%) |
| Construction | 0 (0.0%) | 0 (0.0%) |
| Manufacturing | 123 (100.0%) | 0 (0.0%) |
| Wholesale Trade | 0 (0.0%) | 0 (0.0%) |
| Retail Trade | 24 (100.0%) | 0 (0.0%) |
| Transportation & Warehousing | 11 (100.0%) | 0 (0.0%) |
| Utilities | 0 (0.0%) | 0 (0.0%) |
| Information | 0 (0.0%) | 66 (100.0%) |
| Finance & Insurance | 0 (0.0%) | 39 (100.0%) |
| Real Estate, Rental & Leasing | 0 (0.0%) | 0 (0.0%) |
| Professional & Scientific | 64 (67.4%) | 31 (32.6%) |
| Enterprise Management | 0 (0.0%) | 0 (0.0%) |
| Administrative & Support | 38 (100.0%) | 0 (0.0%) |
| Educational Services | 0 (0.0%) | 0 (0.0%) |
| Health Care & Social Assistance | 0 (0.0%) | 10 (100.0%) |
| Arts, Entertainment & Recreation | 0 (0.0%) | 0 (0.0%) |
| Accommodation & Food Services | 0 (0.0%) | 0 (0.0%) |
| Public Administration | 11 (100.0%) | 0 (0.0%) |
| Total | 329 (65.9%) | 170 (34.1%) |
Education in Watson
School Enrollment in Watson
The most common levels of schooling among the 420 students in Watson are middle school (156 | 37.1%), college / undergraduate (155 | 36.9%), and elementary school (67 | 16.0%).
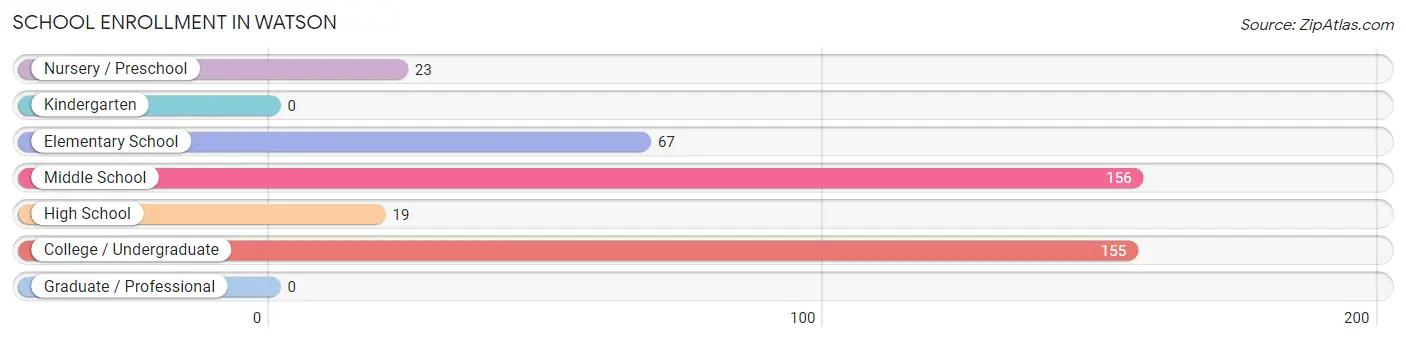
| School Level | # Students | % Students |
| Nursery / Preschool | 23 | 5.5% |
| Kindergarten | 0 | 0.0% |
| Elementary School | 67 | 16.0% |
| Middle School | 156 | 37.1% |
| High School | 19 | 4.5% |
| College / Undergraduate | 155 | 36.9% |
| Graduate / Professional | 0 | 0.0% |
| Total | 420 | 100.0% |
School Enrollment by Age by Funding Source in Watson
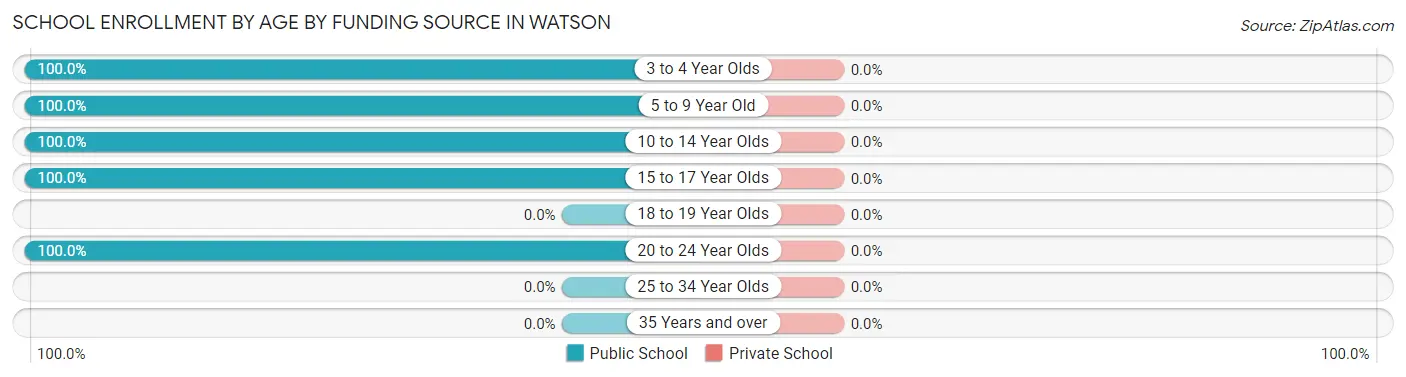
| Age Bracket | Public School | Private School |
| 3 to 4 Year Olds | 23 (100.0%) | 0 (0.0%) |
| 5 to 9 Year Old | 67 (100.0%) | 0 (0.0%) |
| 10 to 14 Year Olds | 156 (100.0%) | 0 (0.0%) |
| 15 to 17 Year Olds | 19 (100.0%) | 0 (0.0%) |
| 18 to 19 Year Olds | 0 (0.0%) | 0 (0.0%) |
| 20 to 24 Year Olds | 155 (100.0%) | 0 (0.0%) |
| 25 to 34 Year Olds | 0 (0.0%) | 0 (0.0%) |
| 35 Years and over | 0 (0.0%) | 0 (0.0%) |
| Total | 420 (100.0%) | 0 (0.0%) |
Educational Attainment by Field of Study in Watson
Business (84 | 37.0%), engineering (62 | 27.3%), psychology (36 | 15.9%), physical & health sciences (12 | 5.3%), and education (12 | 5.3%) are the most common fields of study among 227 individuals in Watson who have obtained a bachelor's degree or higher.
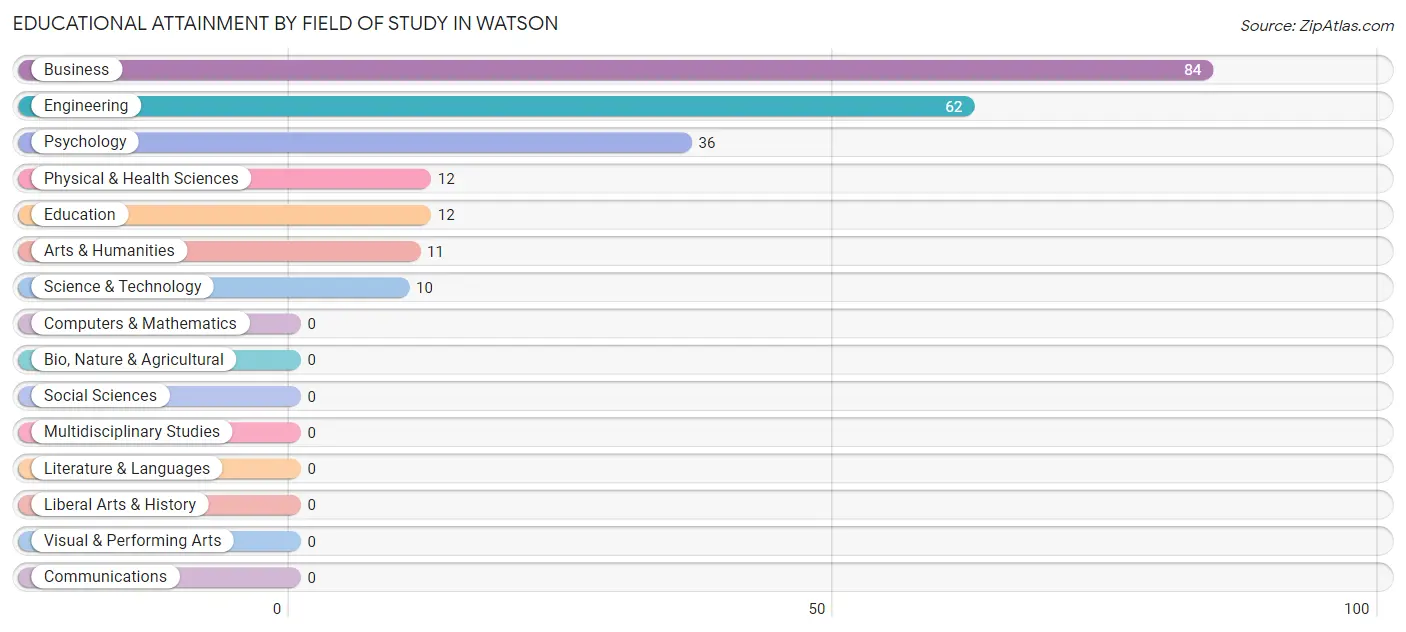
| Field of Study | # Graduates | % Graduates |
| Computers & Mathematics | 0 | 0.0% |
| Bio, Nature & Agricultural | 0 | 0.0% |
| Physical & Health Sciences | 12 | 5.3% |
| Psychology | 36 | 15.9% |
| Social Sciences | 0 | 0.0% |
| Engineering | 62 | 27.3% |
| Multidisciplinary Studies | 0 | 0.0% |
| Science & Technology | 10 | 4.4% |
| Business | 84 | 37.0% |
| Education | 12 | 5.3% |
| Literature & Languages | 0 | 0.0% |
| Liberal Arts & History | 0 | 0.0% |
| Visual & Performing Arts | 0 | 0.0% |
| Communications | 0 | 0.0% |
| Arts & Humanities | 11 | 4.9% |
| Total | 227 | 100.0% |
Transportation & Commute in Watson
Vehicle Availability by Sex in Watson
The most prevalent vehicle ownership categories in Watson are males with 2 vehicles (194, accounting for 59.0%) and females with 2 vehicles (146, making up 114.1%).
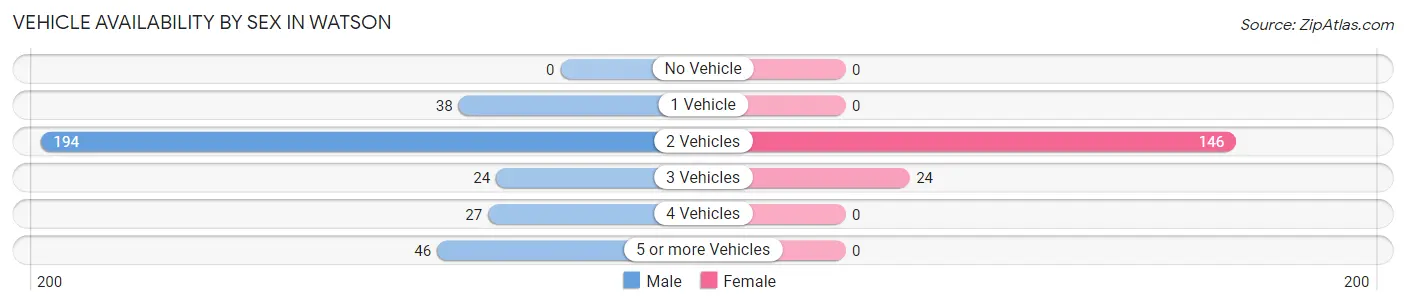
| Vehicles Available | Male | Female |
| No Vehicle | 0 (0.0%) | 0 (0.0%) |
| 1 Vehicle | 38 (11.6%) | 0 (0.0%) |
| 2 Vehicles | 194 (59.0%) | 146 (85.9%) |
| 3 Vehicles | 24 (7.3%) | 24 (14.1%) |
| 4 Vehicles | 27 (8.2%) | 0 (0.0%) |
| 5 or more Vehicles | 46 (14.0%) | 0 (0.0%) |
| Total | 329 (100.0%) | 170 (100.0%) |
Commute Time in Watson
The most frequently occuring commute durations in Watson are 45 to 59 minutes (152 commuters, 33.6%), 40 to 44 minutes (108 commuters, 23.8%), and 25 to 29 minutes (66 commuters, 14.6%).
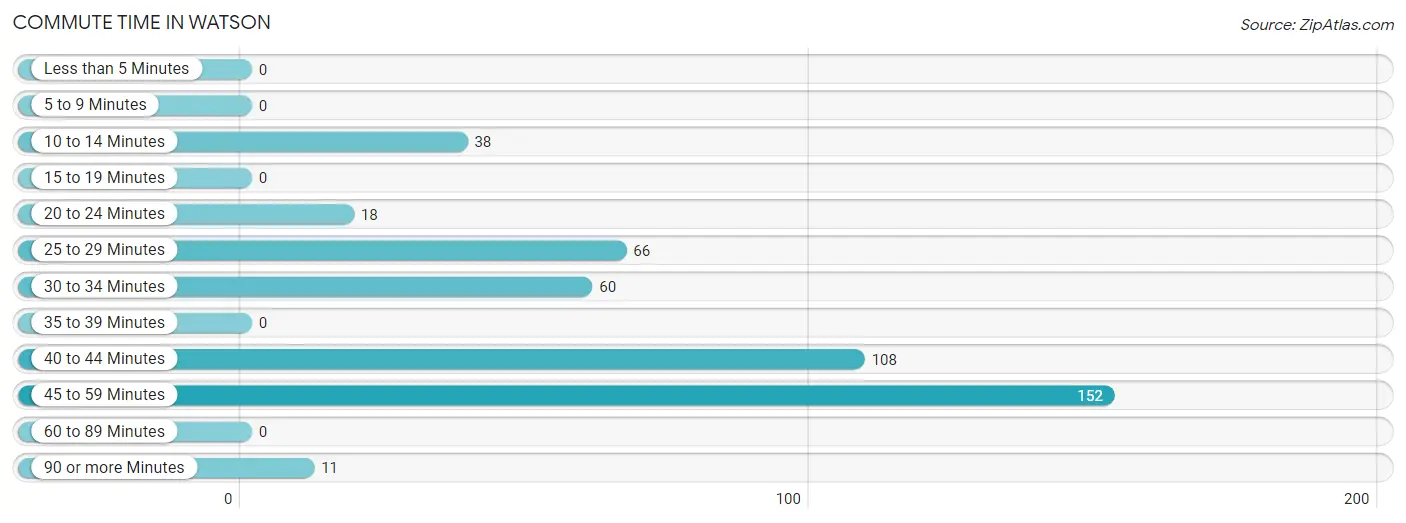
| Commute Time | # Commuters | % Commuters |
| Less than 5 Minutes | 0 | 0.0% |
| 5 to 9 Minutes | 0 | 0.0% |
| 10 to 14 Minutes | 38 | 8.4% |
| 15 to 19 Minutes | 0 | 0.0% |
| 20 to 24 Minutes | 18 | 4.0% |
| 25 to 29 Minutes | 66 | 14.6% |
| 30 to 34 Minutes | 60 | 13.3% |
| 35 to 39 Minutes | 0 | 0.0% |
| 40 to 44 Minutes | 108 | 23.8% |
| 45 to 59 Minutes | 152 | 33.6% |
| 60 to 89 Minutes | 0 | 0.0% |
| 90 or more Minutes | 11 | 2.4% |
Commute Time by Sex in Watson
The most common commute times in Watson are 45 to 59 minutes (118 commuters, 35.9%) for males and 25 to 29 minutes (66 commuters, 53.2%) for females.
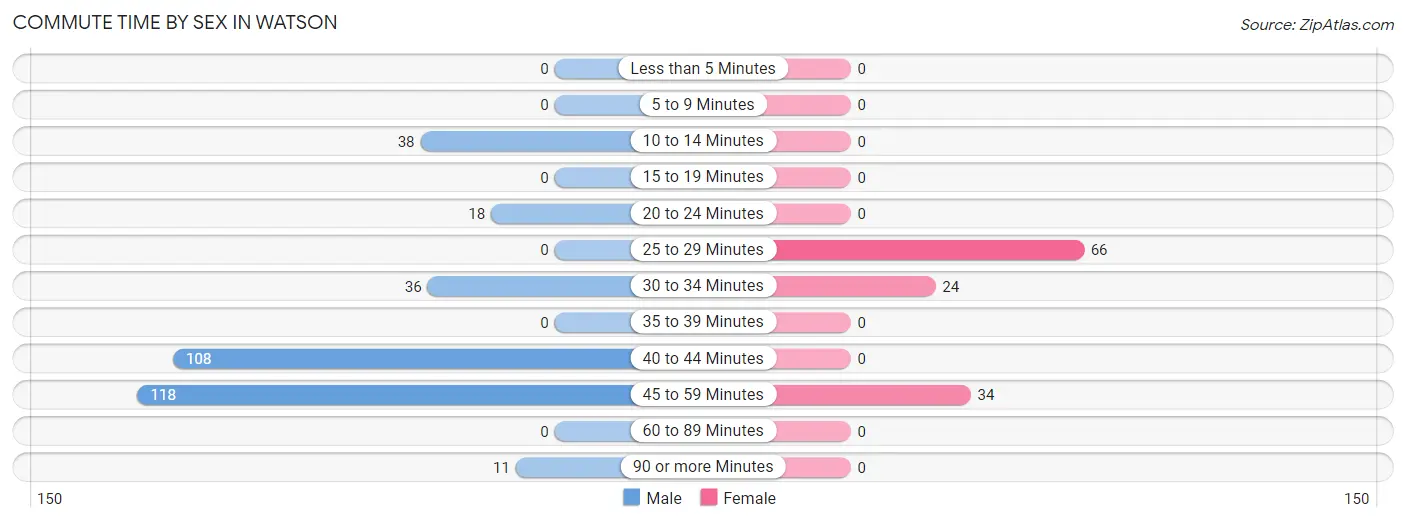
| Commute Time | Male | Female |
| Less than 5 Minutes | 0 (0.0%) | 0 (0.0%) |
| 5 to 9 Minutes | 0 (0.0%) | 0 (0.0%) |
| 10 to 14 Minutes | 38 (11.6%) | 0 (0.0%) |
| 15 to 19 Minutes | 0 (0.0%) | 0 (0.0%) |
| 20 to 24 Minutes | 18 (5.5%) | 0 (0.0%) |
| 25 to 29 Minutes | 0 (0.0%) | 66 (53.2%) |
| 30 to 34 Minutes | 36 (10.9%) | 24 (19.4%) |
| 35 to 39 Minutes | 0 (0.0%) | 0 (0.0%) |
| 40 to 44 Minutes | 108 (32.8%) | 0 (0.0%) |
| 45 to 59 Minutes | 118 (35.9%) | 34 (27.4%) |
| 60 to 89 Minutes | 0 (0.0%) | 0 (0.0%) |
| 90 or more Minutes | 11 (3.3%) | 0 (0.0%) |
Time of Departure to Work by Sex in Watson
The most frequent times of departure to work in Watson are 12:00 AM to 4:59 AM (134, 40.7%) for males and 7:00 AM to 7:29 AM (90, 72.6%) for females.
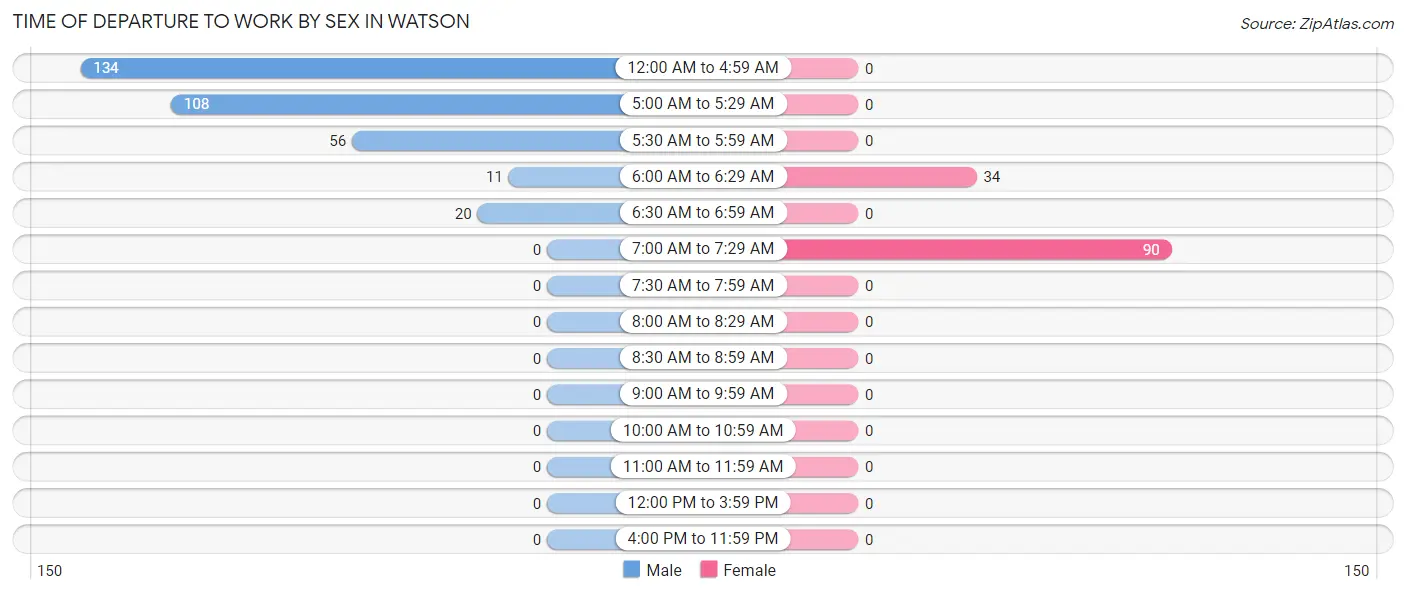
| Time of Departure | Male | Female |
| 12:00 AM to 4:59 AM | 134 (40.7%) | 0 (0.0%) |
| 5:00 AM to 5:29 AM | 108 (32.8%) | 0 (0.0%) |
| 5:30 AM to 5:59 AM | 56 (17.0%) | 0 (0.0%) |
| 6:00 AM to 6:29 AM | 11 (3.3%) | 34 (27.4%) |
| 6:30 AM to 6:59 AM | 20 (6.1%) | 0 (0.0%) |
| 7:00 AM to 7:29 AM | 0 (0.0%) | 90 (72.6%) |
| 7:30 AM to 7:59 AM | 0 (0.0%) | 0 (0.0%) |
| 8:00 AM to 8:29 AM | 0 (0.0%) | 0 (0.0%) |
| 8:30 AM to 8:59 AM | 0 (0.0%) | 0 (0.0%) |
| 9:00 AM to 9:59 AM | 0 (0.0%) | 0 (0.0%) |
| 10:00 AM to 10:59 AM | 0 (0.0%) | 0 (0.0%) |
| 11:00 AM to 11:59 AM | 0 (0.0%) | 0 (0.0%) |
| 12:00 PM to 3:59 PM | 0 (0.0%) | 0 (0.0%) |
| 4:00 PM to 11:59 PM | 0 (0.0%) | 0 (0.0%) |
| Total | 329 (100.0%) | 124 (100.0%) |
Housing Occupancy in Watson
Occupancy by Ownership in Watson
Of the total 481 dwellings in Watson, owner-occupied units account for 450 (93.6%), while renter-occupied units make up 31 (6.4%).
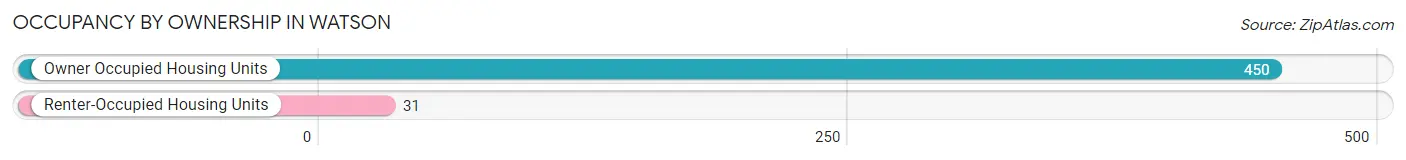
| Occupancy | # Housing Units | % Housing Units |
| Owner Occupied Housing Units | 450 | 93.6% |
| Renter-Occupied Housing Units | 31 | 6.4% |
| Total Occupied Housing Units | 481 | 100.0% |
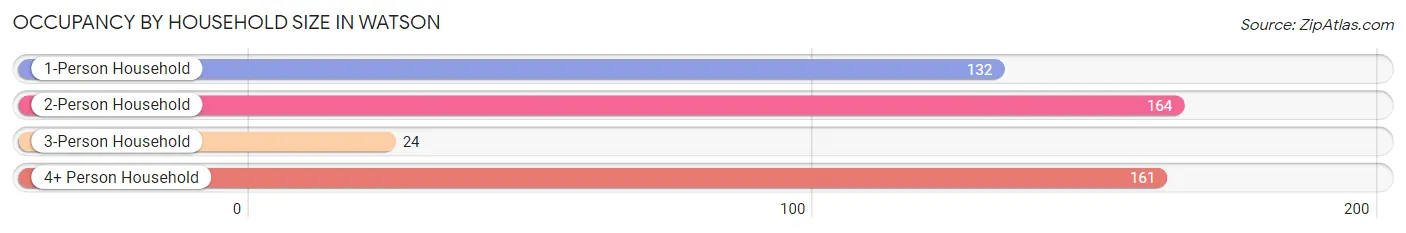
Occupancy by Household Size in Watson
| Household Size | # Housing Units | % Housing Units |
| 1-Person Household | 132 | 27.4% |
| 2-Person Household | 164 | 34.1% |
| 3-Person Household | 24 | 5.0% |
| 4+ Person Household | 161 | 33.5% |
| Total Housing Units | 481 | 100.0% |
Occupancy by Ownership by Household Size in Watson
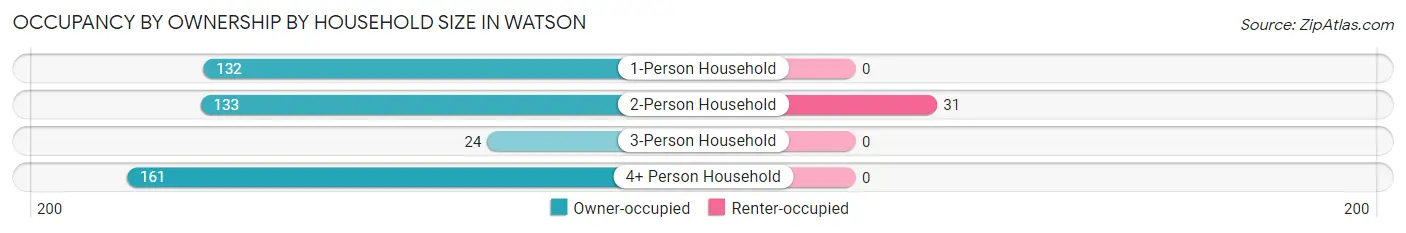
| Household Size | Owner-occupied | Renter-occupied |
| 1-Person Household | 132 (100.0%) | 0 (0.0%) |
| 2-Person Household | 133 (81.1%) | 31 (18.9%) |
| 3-Person Household | 24 (100.0%) | 0 (0.0%) |
| 4+ Person Household | 161 (100.0%) | 0 (0.0%) |
| Total Housing Units | 450 (93.6%) | 31 (6.4%) |
Occupancy by Educational Attainment in Watson
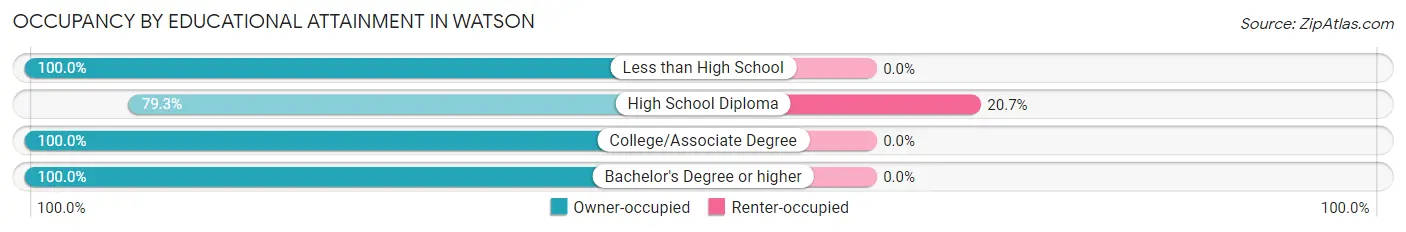
| Household Size | Owner-occupied | Renter-occupied |
| Less than High School | 35 (100.0%) | 0 (0.0%) |
| High School Diploma | 119 (79.3%) | 31 (20.7%) |
| College/Associate Degree | 142 (100.0%) | 0 (0.0%) |
| Bachelor's Degree or higher | 154 (100.0%) | 0 (0.0%) |
Occupancy by Age of Householder in Watson
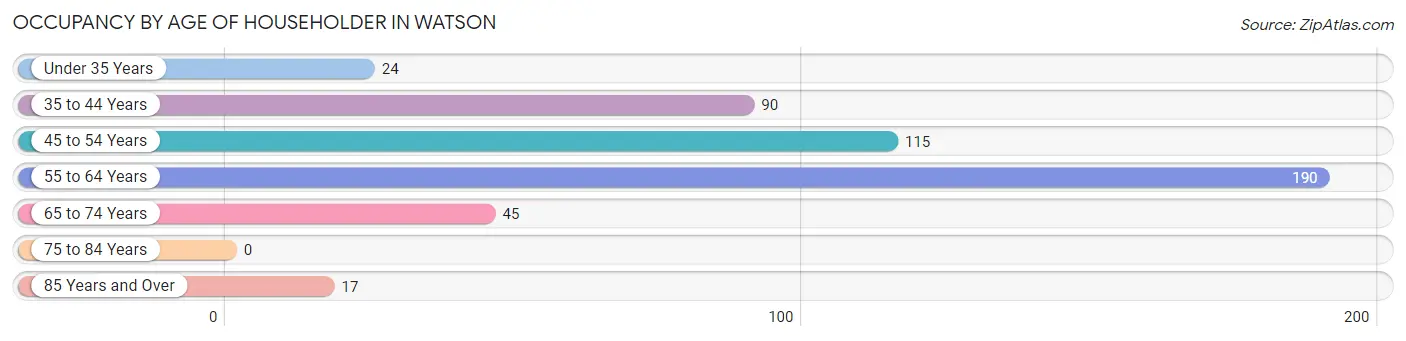
| Age Bracket | # Households | % Households |
| Under 35 Years | 24 | 5.0% |
| 35 to 44 Years | 90 | 18.7% |
| 45 to 54 Years | 115 | 23.9% |
| 55 to 64 Years | 190 | 39.5% |
| 65 to 74 Years | 45 | 9.4% |
| 75 to 84 Years | 0 | 0.0% |
| 85 Years and Over | 17 | 3.5% |
| Total | 481 | 100.0% |
Housing Finances in Watson
Median Income by Occupancy in Watson
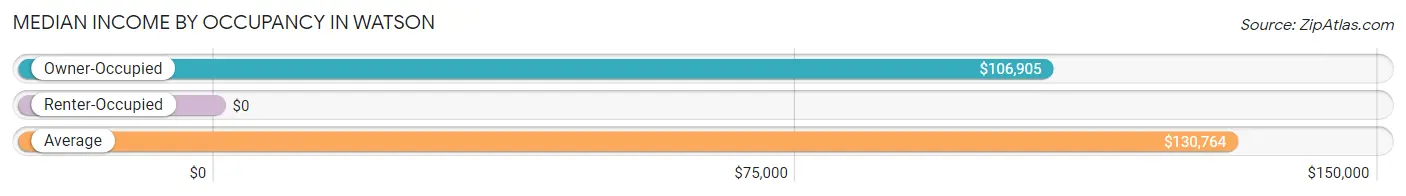
| Occupancy Type | # Households | Median Income |
| Owner-Occupied | 450 (93.6%) | $106,905 |
| Renter-Occupied | 31 (6.4%) | $0 |
| Average | 481 (100.0%) | $130,764 |
Occupancy by Householder Income Bracket in Watson
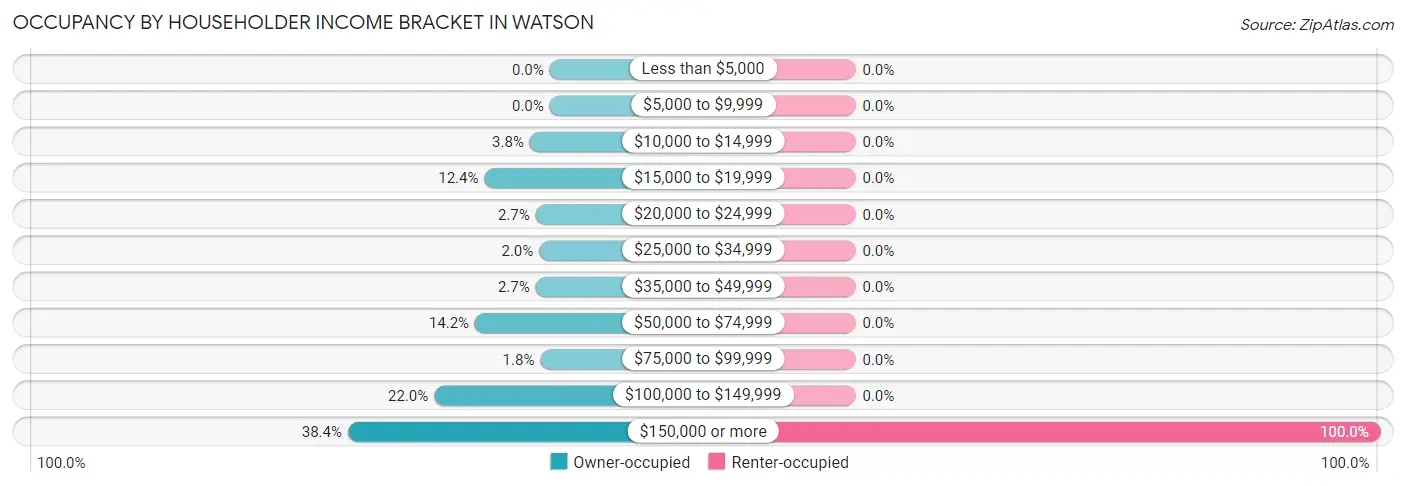
| Income Bracket | Owner-occupied | Renter-occupied |
| Less than $5,000 | 0 (0.0%) | 0 (0.0%) |
| $5,000 to $9,999 | 0 (0.0%) | 0 (0.0%) |
| $10,000 to $14,999 | 17 (3.8%) | 0 (0.0%) |
| $15,000 to $19,999 | 56 (12.4%) | 0 (0.0%) |
| $20,000 to $24,999 | 12 (2.7%) | 0 (0.0%) |
| $25,000 to $34,999 | 9 (2.0%) | 0 (0.0%) |
| $35,000 to $49,999 | 12 (2.7%) | 0 (0.0%) |
| $50,000 to $74,999 | 64 (14.2%) | 0 (0.0%) |
| $75,000 to $99,999 | 8 (1.8%) | 0 (0.0%) |
| $100,000 to $149,999 | 99 (22.0%) | 0 (0.0%) |
| $150,000 or more | 173 (38.4%) | 31 (100.0%) |
| Total | 450 (100.0%) | 31 (100.0%) |
Monthly Housing Cost Tiers in Watson
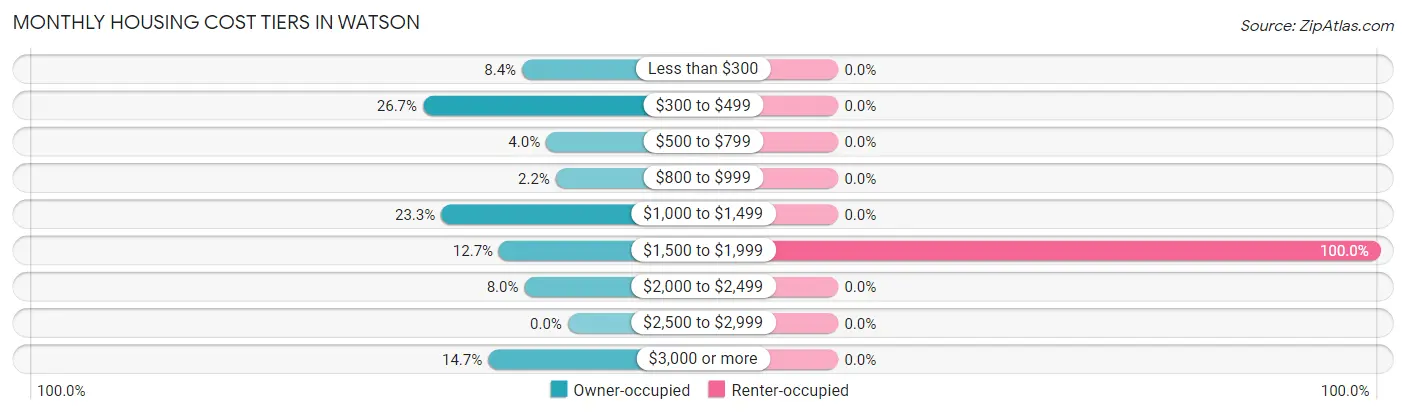
| Monthly Cost | Owner-occupied | Renter-occupied |
| Less than $300 | 38 (8.4%) | 0 (0.0%) |
| $300 to $499 | 120 (26.7%) | 0 (0.0%) |
| $500 to $799 | 18 (4.0%) | 0 (0.0%) |
| $800 to $999 | 10 (2.2%) | 0 (0.0%) |
| $1,000 to $1,499 | 105 (23.3%) | 0 (0.0%) |
| $1,500 to $1,999 | 57 (12.7%) | 31 (100.0%) |
| $2,000 to $2,499 | 36 (8.0%) | 0 (0.0%) |
| $2,500 to $2,999 | 0 (0.0%) | 0 (0.0%) |
| $3,000 or more | 66 (14.7%) | 0 (0.0%) |
| Total | 450 (100.0%) | 31 (100.0%) |
Physical Housing Characteristics in Watson
Housing Structures in Watson
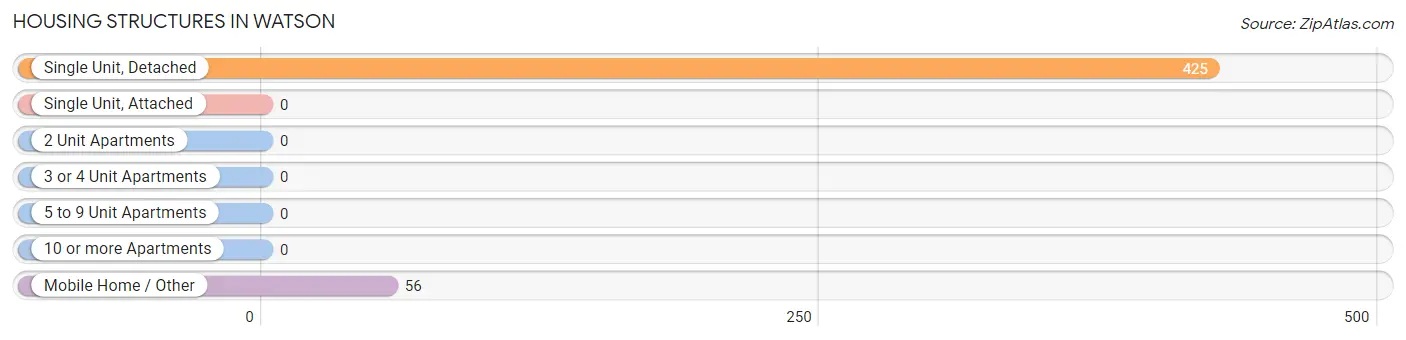
| Structure Type | # Housing Units | % Housing Units |
| Single Unit, Detached | 425 | 88.4% |
| Single Unit, Attached | 0 | 0.0% |
| 2 Unit Apartments | 0 | 0.0% |
| 3 or 4 Unit Apartments | 0 | 0.0% |
| 5 to 9 Unit Apartments | 0 | 0.0% |
| 10 or more Apartments | 0 | 0.0% |
| Mobile Home / Other | 56 | 11.6% |
| Total | 481 | 100.0% |
Housing Structures by Occupancy in Watson
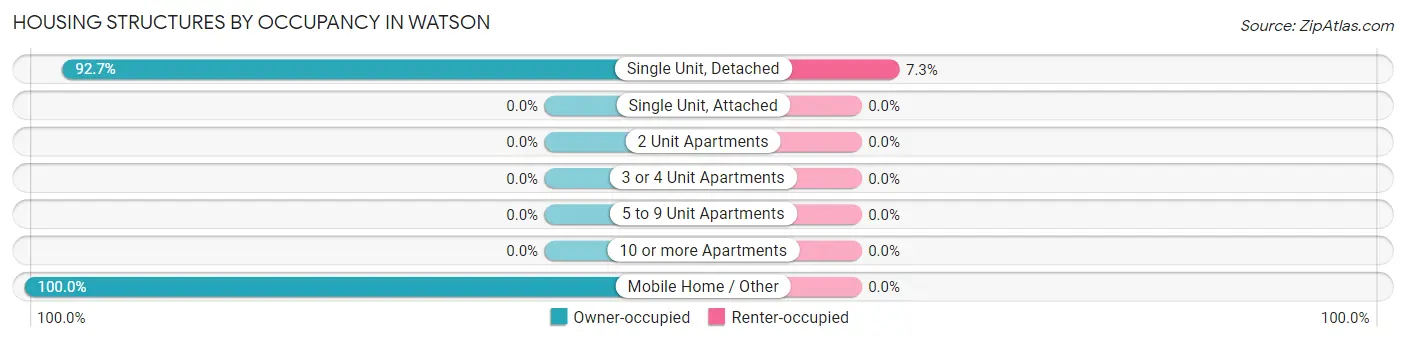
| Structure Type | Owner-occupied | Renter-occupied |
| Single Unit, Detached | 394 (92.7%) | 31 (7.3%) |
| Single Unit, Attached | 0 (0.0%) | 0 (0.0%) |
| 2 Unit Apartments | 0 (0.0%) | 0 (0.0%) |
| 3 or 4 Unit Apartments | 0 (0.0%) | 0 (0.0%) |
| 5 to 9 Unit Apartments | 0 (0.0%) | 0 (0.0%) |
| 10 or more Apartments | 0 (0.0%) | 0 (0.0%) |
| Mobile Home / Other | 56 (100.0%) | 0 (0.0%) |
| Total | 450 (93.6%) | 31 (6.4%) |
Housing Structures by Number of Rooms in Watson
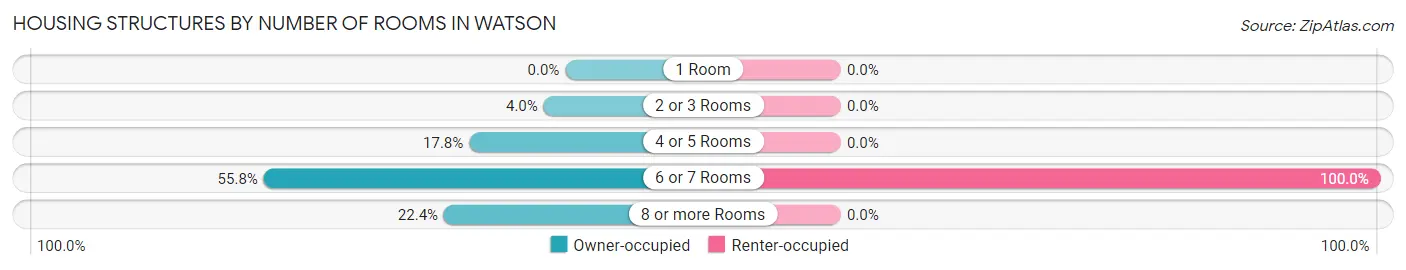
| Number of Rooms | Owner-occupied | Renter-occupied |
| 1 Room | 0 (0.0%) | 0 (0.0%) |
| 2 or 3 Rooms | 18 (4.0%) | 0 (0.0%) |
| 4 or 5 Rooms | 80 (17.8%) | 0 (0.0%) |
| 6 or 7 Rooms | 251 (55.8%) | 31 (100.0%) |
| 8 or more Rooms | 101 (22.4%) | 0 (0.0%) |
| Total | 450 (100.0%) | 31 (100.0%) |
Housing Structure by Heating Type in Watson
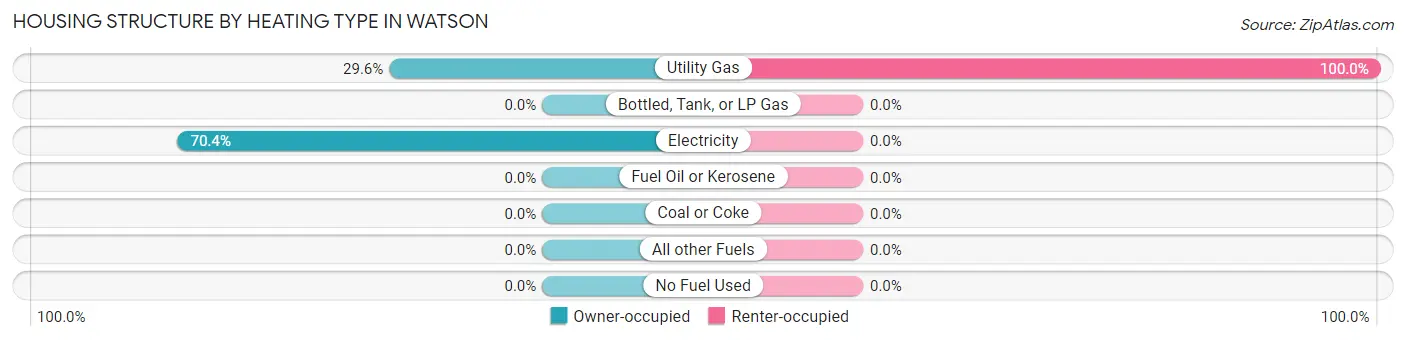
| Heating Type | Owner-occupied | Renter-occupied |
| Utility Gas | 133 (29.6%) | 31 (100.0%) |
| Bottled, Tank, or LP Gas | 0 (0.0%) | 0 (0.0%) |
| Electricity | 317 (70.4%) | 0 (0.0%) |
| Fuel Oil or Kerosene | 0 (0.0%) | 0 (0.0%) |
| Coal or Coke | 0 (0.0%) | 0 (0.0%) |
| All other Fuels | 0 (0.0%) | 0 (0.0%) |
| No Fuel Used | 0 (0.0%) | 0 (0.0%) |
| Total | 450 (100.0%) | 31 (100.0%) |
Household Vehicle Usage in Watson
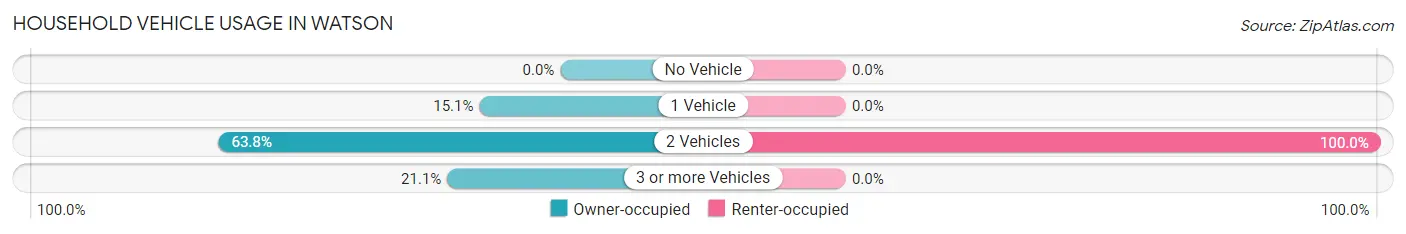
| Vehicles per Household | Owner-occupied | Renter-occupied |
| No Vehicle | 0 (0.0%) | 0 (0.0%) |
| 1 Vehicle | 68 (15.1%) | 0 (0.0%) |
| 2 Vehicles | 287 (63.8%) | 31 (100.0%) |
| 3 or more Vehicles | 95 (21.1%) | 0 (0.0%) |
| Total | 450 (100.0%) | 31 (100.0%) |
Real Estate & Mortgages in Watson
Real Estate and Mortgage Overview in Watson
| Characteristic | Without Mortgage | With Mortgage |
| Housing Units | 186 | 264 |
| Median Property Value | $182,400 | $253,100 |
| Median Household Income | - | - |
| Monthly Housing Costs | $436 | $66 |
| Real Estate Taxes | $199 | $61 |
Property Value by Mortgage Status in Watson
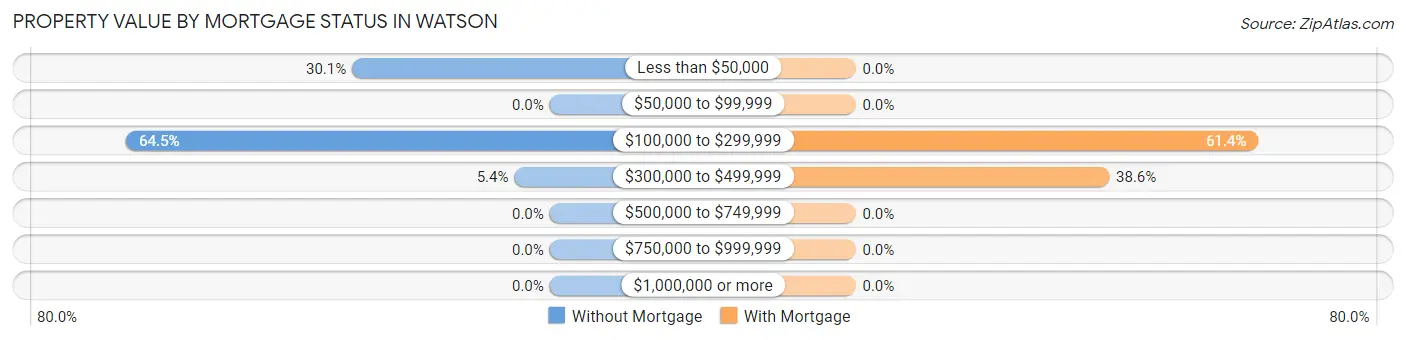
| Property Value | Without Mortgage | With Mortgage |
| Less than $50,000 | 56 (30.1%) | 0 (0.0%) |
| $50,000 to $99,999 | 0 (0.0%) | 0 (0.0%) |
| $100,000 to $299,999 | 120 (64.5%) | 162 (61.4%) |
| $300,000 to $499,999 | 10 (5.4%) | 102 (38.6%) |
| $500,000 to $749,999 | 0 (0.0%) | 0 (0.0%) |
| $750,000 to $999,999 | 0 (0.0%) | 0 (0.0%) |
| $1,000,000 or more | 0 (0.0%) | 0 (0.0%) |
| Total | 186 (100.0%) | 264 (100.0%) |
Household Income by Mortgage Status in Watson
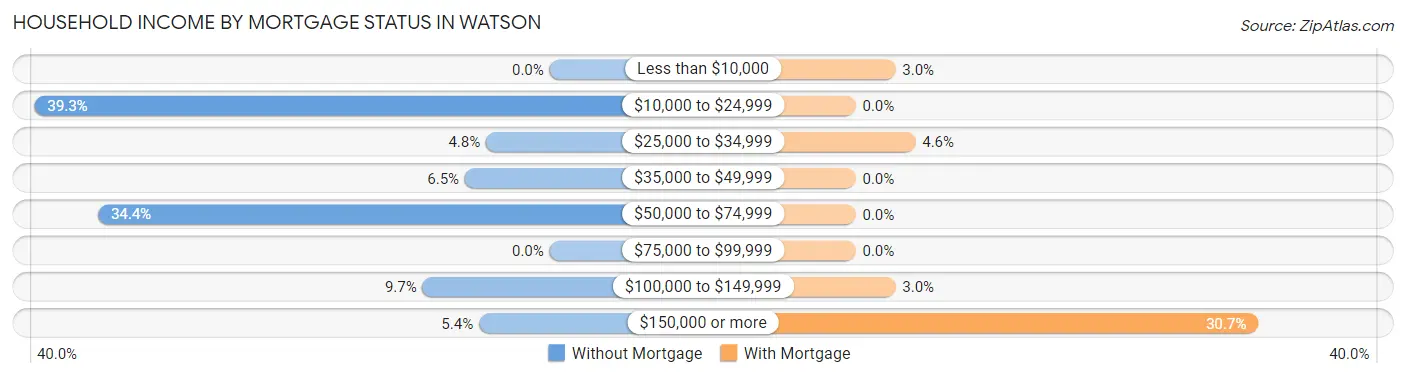
| Household Income | Without Mortgage | With Mortgage |
| Less than $10,000 | 0 (0.0%) | 8 (3.0%) |
| $10,000 to $24,999 | 73 (39.3%) | 0 (0.0%) |
| $25,000 to $34,999 | 9 (4.8%) | 12 (4.5%) |
| $35,000 to $49,999 | 12 (6.5%) | 0 (0.0%) |
| $50,000 to $74,999 | 64 (34.4%) | 0 (0.0%) |
| $75,000 to $99,999 | 0 (0.0%) | 0 (0.0%) |
| $100,000 to $149,999 | 18 (9.7%) | 8 (3.0%) |
| $150,000 or more | 10 (5.4%) | 81 (30.7%) |
| Total | 186 (100.0%) | 264 (100.0%) |
Property Value to Household Income Ratio in Watson
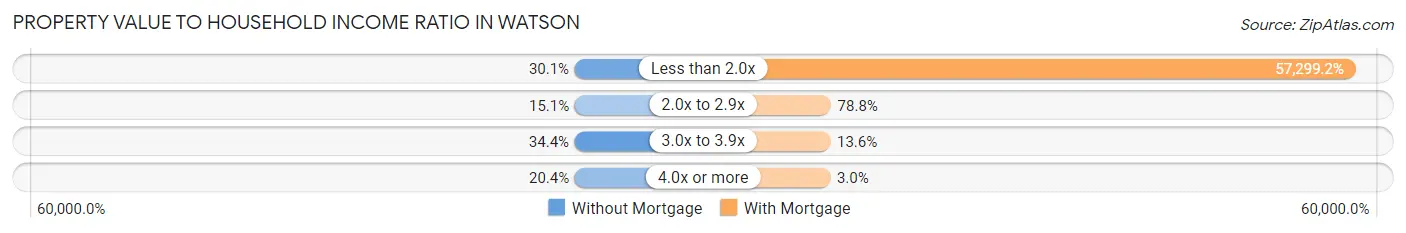
| Value-to-Income Ratio | Without Mortgage | With Mortgage |
| Less than 2.0x | 56 (30.1%) | 151,270 (57,299.2%) |
| 2.0x to 2.9x | 28 (15.0%) | 208 (78.8%) |
| 3.0x to 3.9x | 64 (34.4%) | 36 (13.6%) |
| 4.0x or more | 38 (20.4%) | 8 (3.0%) |
| Total | 186 (100.0%) | 264 (100.0%) |
Real Estate Taxes by Mortgage Status in Watson
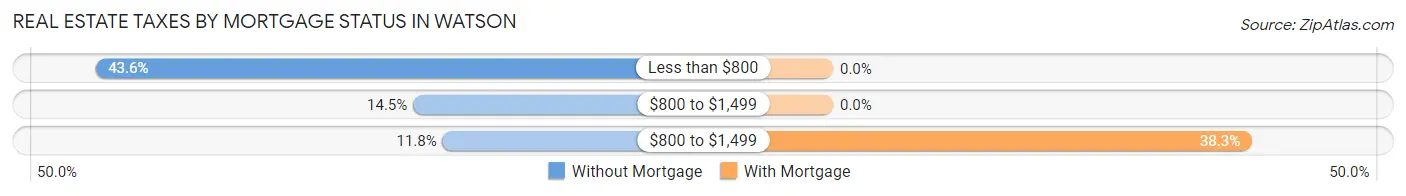
| Property Taxes | Without Mortgage | With Mortgage |
| Less than $800 | 81 (43.5%) | 0 (0.0%) |
| $800 to $1,499 | 27 (14.5%) | 0 (0.0%) |
| $800 to $1,499 | 22 (11.8%) | 101 (38.3%) |
| Total | 186 (100.0%) | 264 (100.0%) |
Health & Disability in Watson
Health Insurance Coverage by Age in Watson
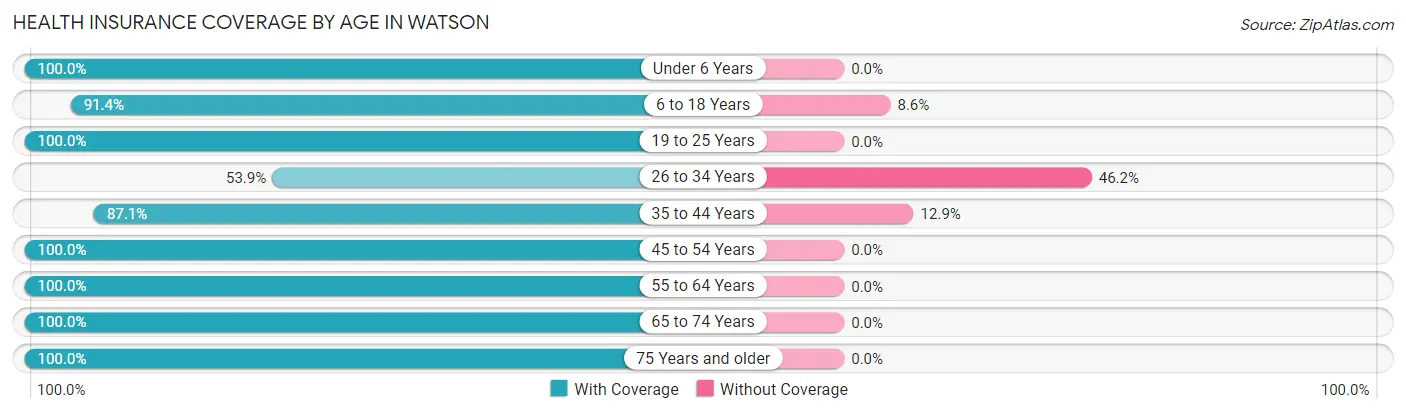
| Age Bracket | With Coverage | Without Coverage |
| Under 6 Years | 45 (100.0%) | 0 (0.0%) |
| 6 to 18 Years | 297 (91.4%) | 28 (8.6%) |
| 19 to 25 Years | 155 (100.0%) | 0 (0.0%) |
| 26 to 34 Years | 35 (53.8%) | 30 (46.2%) |
| 35 to 44 Years | 229 (87.1%) | 34 (12.9%) |
| 45 to 54 Years | 194 (100.0%) | 0 (0.0%) |
| 55 to 64 Years | 243 (100.0%) | 0 (0.0%) |
| 65 to 74 Years | 138 (100.0%) | 0 (0.0%) |
| 75 Years and older | 17 (100.0%) | 0 (0.0%) |
| Total | 1,353 (93.6%) | 92 (6.4%) |
Health Insurance Coverage by Citizenship Status in Watson
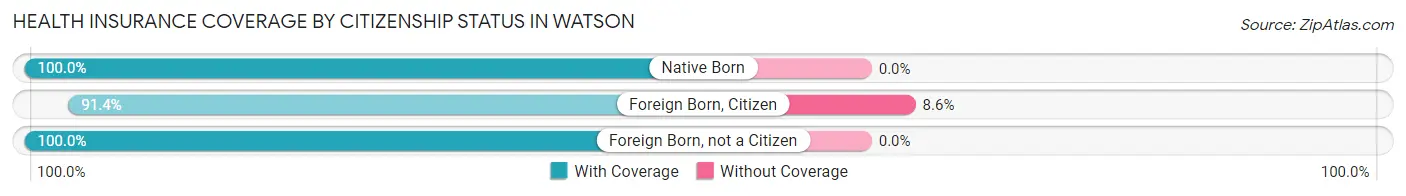
| Citizenship Status | With Coverage | Without Coverage |
| Native Born | 45 (100.0%) | 0 (0.0%) |
| Foreign Born, Citizen | 297 (91.4%) | 28 (8.6%) |
| Foreign Born, not a Citizen | 155 (100.0%) | 0 (0.0%) |
Health Insurance Coverage by Household Income in Watson
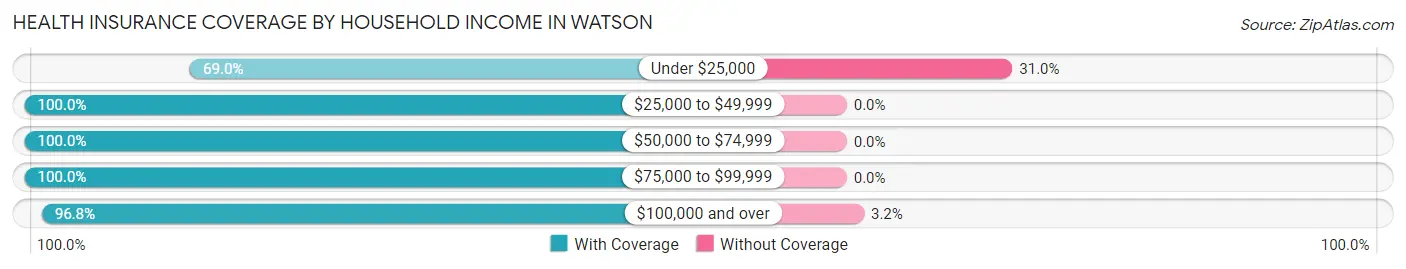
| Household Income | With Coverage | Without Coverage |
| Under $25,000 | 129 (69.0%) | 58 (31.0%) |
| $25,000 to $49,999 | 56 (100.0%) | 0 (0.0%) |
| $50,000 to $74,999 | 132 (100.0%) | 0 (0.0%) |
| $75,000 to $99,999 | 17 (100.0%) | 0 (0.0%) |
| $100,000 and over | 1,019 (96.8%) | 34 (3.2%) |
Public vs Private Health Insurance Coverage by Age in Watson
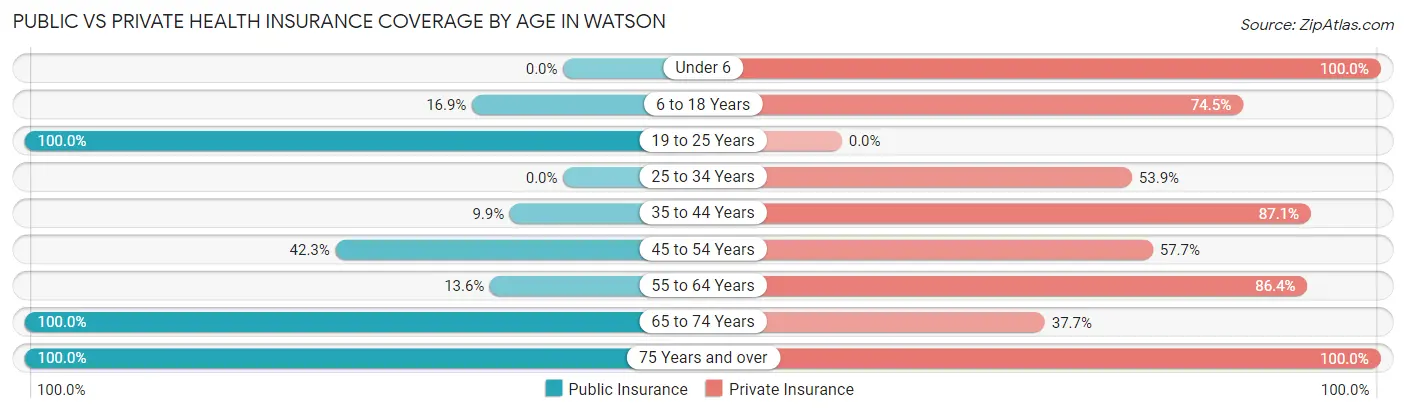
| Age Bracket | Public Insurance | Private Insurance |
| Under 6 | 0 (0.0%) | 45 (100.0%) |
| 6 to 18 Years | 55 (16.9%) | 242 (74.5%) |
| 19 to 25 Years | 155 (100.0%) | 0 (0.0%) |
| 25 to 34 Years | 0 (0.0%) | 35 (53.8%) |
| 35 to 44 Years | 26 (9.9%) | 229 (87.1%) |
| 45 to 54 Years | 82 (42.3%) | 112 (57.7%) |
| 55 to 64 Years | 33 (13.6%) | 210 (86.4%) |
| 65 to 74 Years | 138 (100.0%) | 52 (37.7%) |
| 75 Years and over | 17 (100.0%) | 17 (100.0%) |
| Total | 506 (35.0%) | 942 (65.2%) |
Disability Status by Sex by Age in Watson
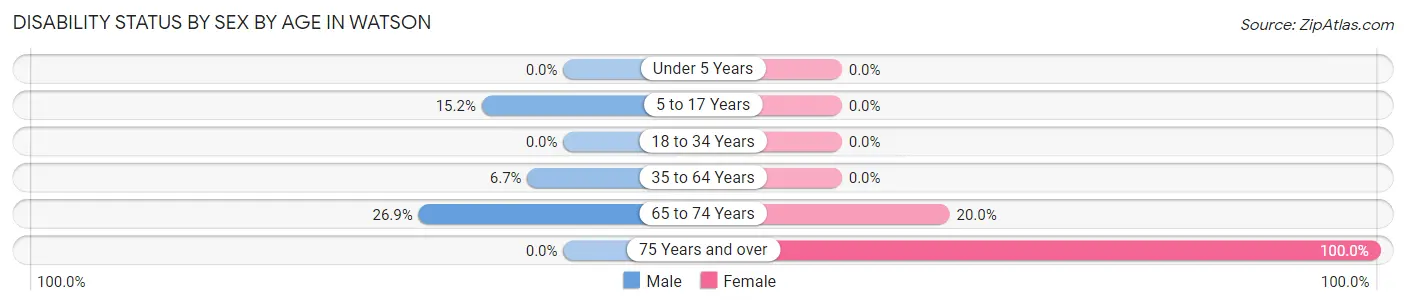
| Age Bracket | Male | Female |
| Under 5 Years | 0 (0.0%) | 0 (0.0%) |
| 5 to 17 Years | 25 (15.1%) | 0 (0.0%) |
| 18 to 34 Years | 0 (0.0%) | 0 (0.0%) |
| 35 to 64 Years | 26 (6.7%) | 0 (0.0%) |
| 65 to 74 Years | 25 (26.9%) | 9 (20.0%) |
| 75 Years and over | 0 (0.0%) | 17 (100.0%) |
Disability Class by Sex by Age in Watson
Disability Class: Hearing Difficulty
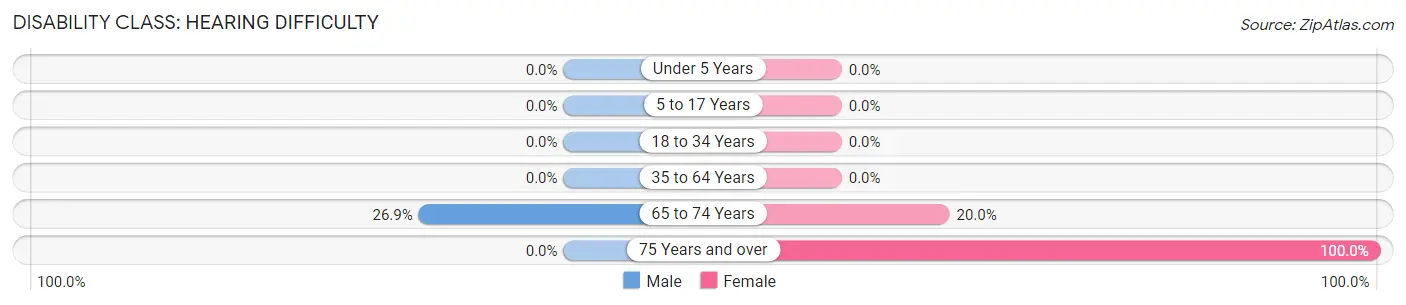
| Age Bracket | Male | Female |
| Under 5 Years | 0 (0.0%) | 0 (0.0%) |
| 5 to 17 Years | 0 (0.0%) | 0 (0.0%) |
| 18 to 34 Years | 0 (0.0%) | 0 (0.0%) |
| 35 to 64 Years | 0 (0.0%) | 0 (0.0%) |
| 65 to 74 Years | 25 (26.9%) | 9 (20.0%) |
| 75 Years and over | 0 (0.0%) | 17 (100.0%) |
Disability Class: Vision Difficulty
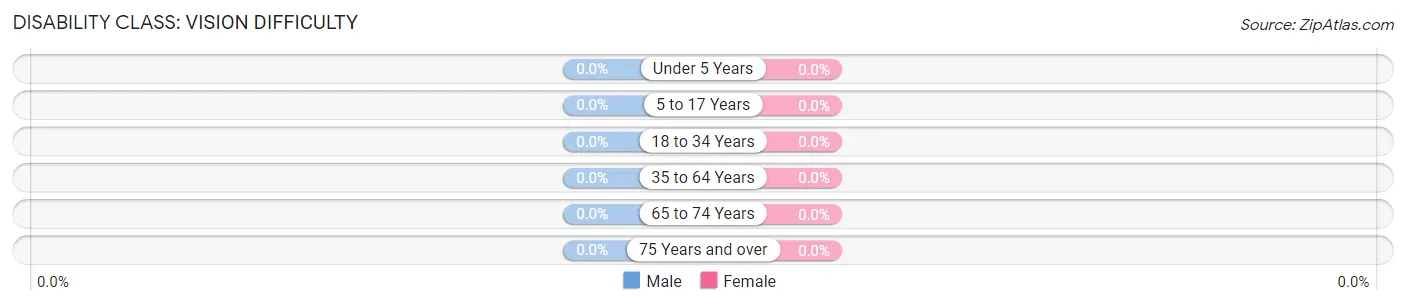
| Age Bracket | Male | Female |
| Under 5 Years | 0 (0.0%) | 0 (0.0%) |
| 5 to 17 Years | 0 (0.0%) | 0 (0.0%) |
| 18 to 34 Years | 0 (0.0%) | 0 (0.0%) |
| 35 to 64 Years | 0 (0.0%) | 0 (0.0%) |
| 65 to 74 Years | 0 (0.0%) | 0 (0.0%) |
| 75 Years and over | 0 (0.0%) | 0 (0.0%) |
Disability Class: Cognitive Difficulty
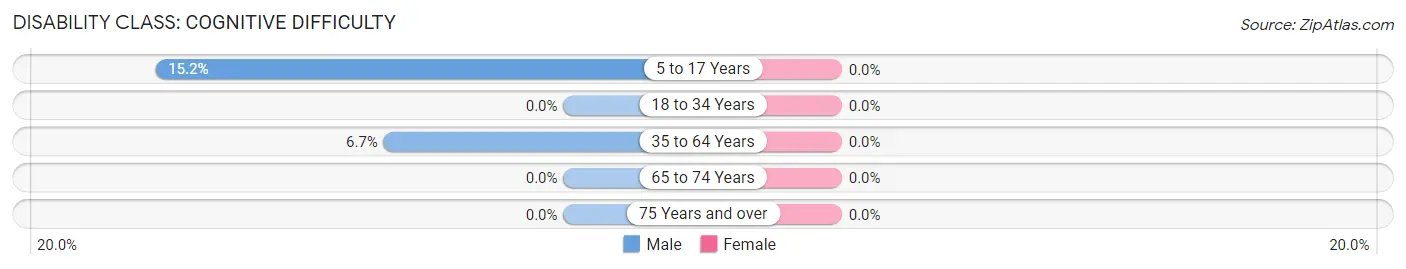
| Age Bracket | Male | Female |
| 5 to 17 Years | 25 (15.1%) | 0 (0.0%) |
| 18 to 34 Years | 0 (0.0%) | 0 (0.0%) |
| 35 to 64 Years | 26 (6.7%) | 0 (0.0%) |
| 65 to 74 Years | 0 (0.0%) | 0 (0.0%) |
| 75 Years and over | 0 (0.0%) | 0 (0.0%) |
Disability Class: Ambulatory Difficulty
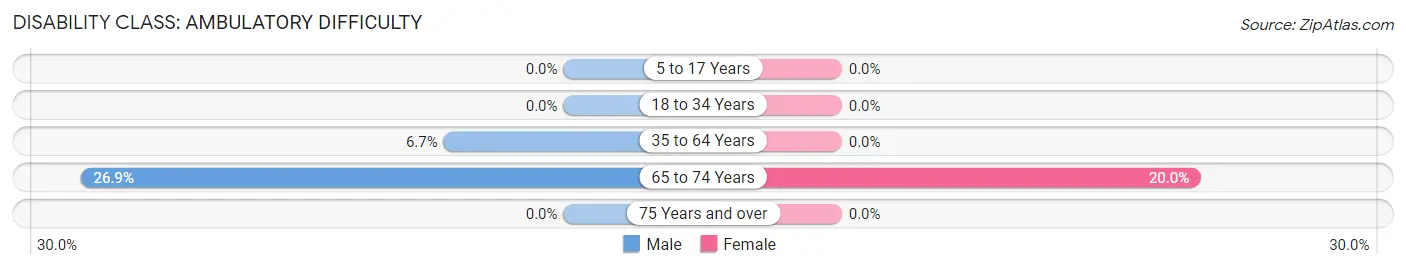
| Age Bracket | Male | Female |
| 5 to 17 Years | 0 (0.0%) | 0 (0.0%) |
| 18 to 34 Years | 0 (0.0%) | 0 (0.0%) |
| 35 to 64 Years | 26 (6.7%) | 0 (0.0%) |
| 65 to 74 Years | 25 (26.9%) | 9 (20.0%) |
| 75 Years and over | 0 (0.0%) | 0 (0.0%) |
Disability Class: Self-Care Difficulty
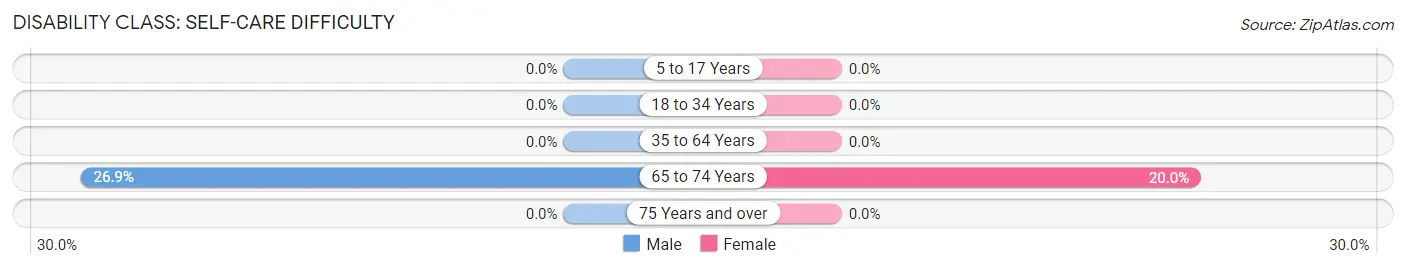
| Age Bracket | Male | Female |
| 5 to 17 Years | 0 (0.0%) | 0 (0.0%) |
| 18 to 34 Years | 0 (0.0%) | 0 (0.0%) |
| 35 to 64 Years | 0 (0.0%) | 0 (0.0%) |
| 65 to 74 Years | 25 (26.9%) | 9 (20.0%) |
| 75 Years and over | 0 (0.0%) | 0 (0.0%) |
Technology Access in Watson
Computing Device Access in Watson
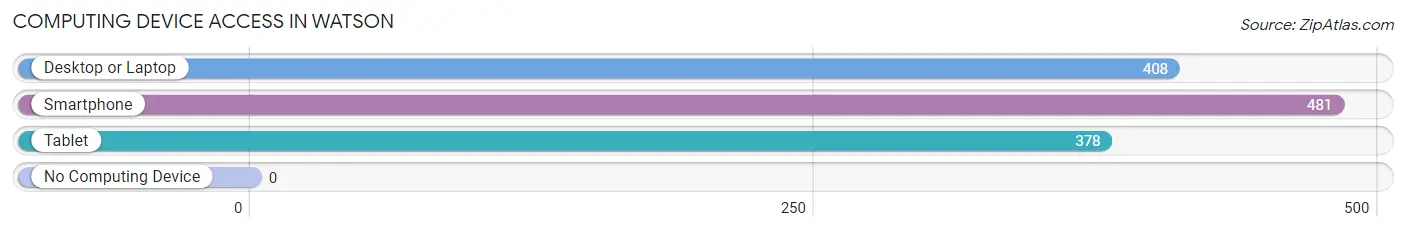
| Device Type | # Households | % Households |
| Desktop or Laptop | 408 | 84.8% |
| Smartphone | 481 | 100.0% |
| Tablet | 378 | 78.6% |
| No Computing Device | 0 | 0.0% |
| Total | 481 | 100.0% |
Internet Access in Watson
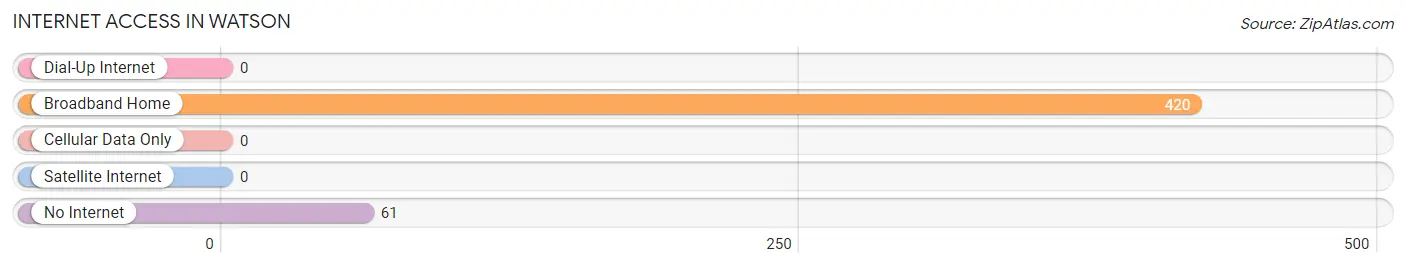
| Internet Type | # Households | % Households |
| Dial-Up Internet | 0 | 0.0% |
| Broadband Home | 420 | 87.3% |
| Cellular Data Only | 0 | 0.0% |
| Satellite Internet | 0 | 0.0% |
| No Internet | 61 | 12.7% |
| Total | 481 | 100.0% |
Watson Summary
The city of Watson, Louisiana is located in the northern part of the state, in the parish of Livingston. It is situated on the banks of the Amite River, and is part of the Baton Rouge Metropolitan Statistical Area. Watson is a small town with a population of just over 2,000 people, and is known for its rural charm and friendly atmosphere.
History
The area that is now Watson was first settled in the early 1800s by French and Spanish settlers. The town was originally known as “La Pointe”, and was a small farming community. In 1845, the town was renamed Watson in honor of a local landowner, William Watson. The town was officially incorporated in 1891.
In the early 1900s, Watson began to grow and develop. The town was home to several businesses, including a sawmill, a cotton gin, and a general store. The town also had a post office, a bank, and a hotel.
Geography
Watson is located in the northern part of Livingston Parish, in the southeastern part of Louisiana. The town is situated on the banks of the Amite River, and is part of the Baton Rouge Metropolitan Statistical Area. The town is located about 25 miles north of Baton Rouge, and about 50 miles south of New Orleans.
The terrain of Watson is mostly flat, with some rolling hills. The town is surrounded by forests and wetlands, and is home to a variety of wildlife. The climate in Watson is humid subtropical, with hot, humid summers and mild winters.
Economy
The economy of Watson is largely based on agriculture and forestry. The town is home to several farms, and the surrounding area is home to a variety of timber and paper mills. The town is also home to several small businesses, including restaurants, retail stores, and service providers.
Demographics
As of the 2010 census, the population of Watson was 2,072. The racial makeup of the town was 79.3% White, 17.2% African American, 0.7% Native American, 0.3% Asian, 0.1% Pacific Islander, and 2.4% from other races. The median household income in Watson was $37,917, and the median family income was $45,938.
Conclusion
Watson, Louisiana is a small town with a population of just over 2,000 people. The town is situated on the banks of the Amite River, and is part of the Baton Rouge Metropolitan Statistical Area. The economy of Watson is largely based on agriculture and forestry, and the town is home to several small businesses. The racial makeup of the town is mostly White, with a small percentage of African American, Native American, Asian, and Pacific Islander residents. Watson is known for its rural charm and friendly atmosphere, and is a great place to live and work.
Common Questions
What is Per Capita Income in Watson?
Per Capita income in Watson is $41,106.
What is the Median Family Income in Watson?
Median Family Income in Watson is $131,458.
What is the Median Household income in Watson?
Median Household Income in Watson is $130,764.
What is Income or Wage Gap in Watson?
Income or Wage Gap in Watson is 40.4%.
Women in Watson earn 59.6 cents for every dollar earned by a man.
What is Inequality or Gini Index in Watson?
Inequality or Gini Index in Watson is 0.38.
What is the Total Population of Watson?
Total Population of Watson is 1,445.
What is the Total Male Population of Watson?
Total Male Population of Watson is 837.
What is the Total Female Population of Watson?
Total Female Population of Watson is 608.
What is the Ratio of Males per 100 Females in Watson?
There are 137.66 Males per 100 Females in Watson.
What is the Ratio of Females per 100 Males in Watson?
There are 72.64 Females per 100 Males in Watson.
What is the Median Population Age in Watson?
Median Population Age in Watson is 42.2 Years.
What is the Average Family Size in Watson
Average Family Size in Watson is 3.8 People.
What is the Average Household Size in Watson
Average Household Size in Watson is 3.0 People.
How Large is the Labor Force in Watson?
There are 570 People in the Labor Forcein in Watson.
What is the Percentage of People in the Labor Force in Watson?
48.4% of People are in the Labor Force in Watson.
What is the Unemployment Rate in Watson?
Unemployment Rate in Watson is 12.5%.