South Carolina Map & Demographics
South Carolina Map
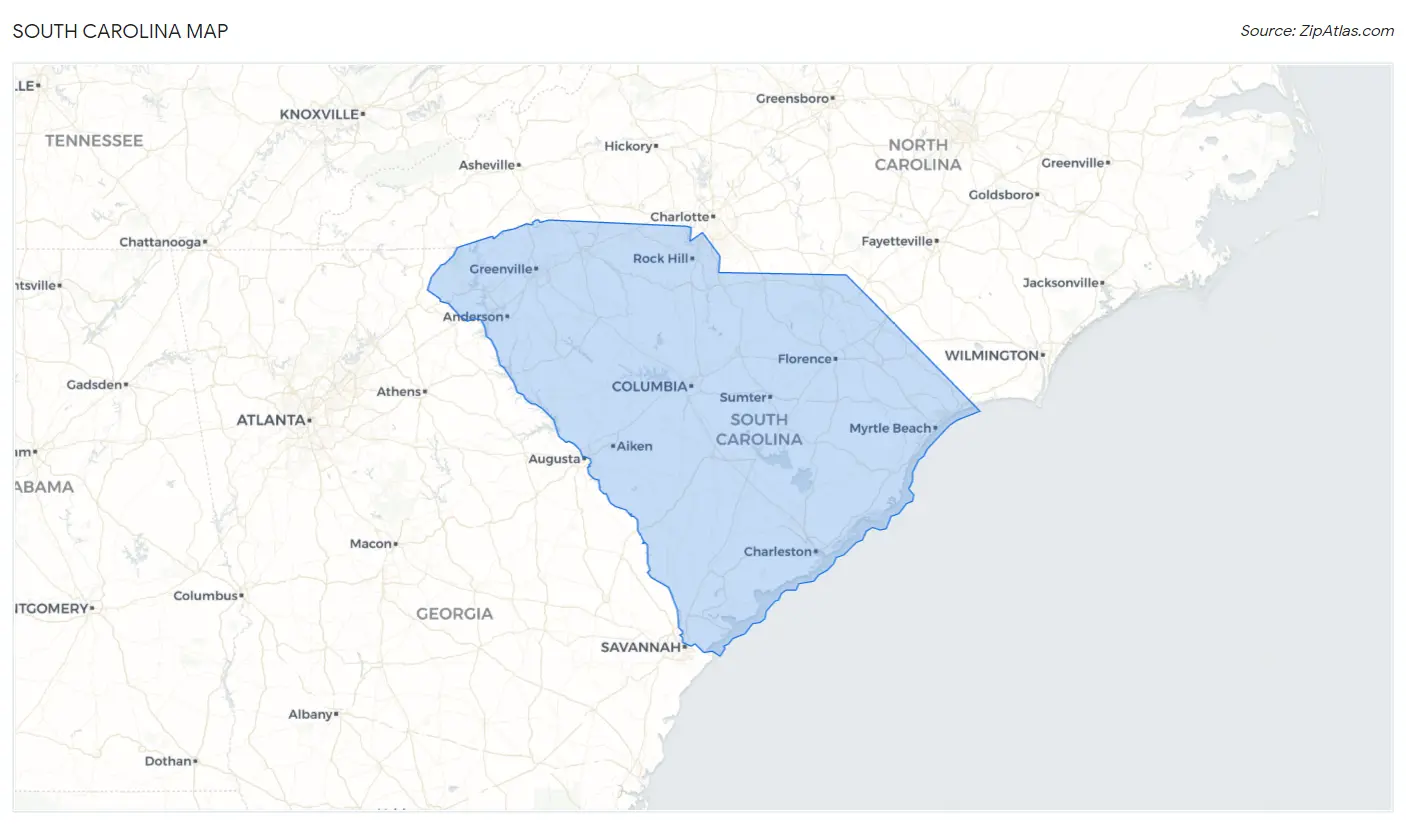
South Carolina Overview
May 23, 1788
INCORPORATED
32,021
TOTAL AREA [ SQ MI ]
30,070
LAND AREA [ SQ MI ]
1,951
WATER AREA [ SQ MI ]
350
ELEVATION AVG [ FT ]
3,560
ELEVATION HIGH [ FT ]
Sea Level
ELEVATION LOW [ FT ]
171.0
POP DENSITY [ PPL / SQ MI ]
$36,072
PER CAPITA INCOME
$79,830
AVG FAMILY INCOME
$63,623
AVG HOUSEHOLD INCOME
28.0%
WAGE / INCOME GAP [ % ]
72.0¢/ $1
WAGE / INCOME GAP [ $ ]
$10,884
FAMILY INCOME DEFICIT
0.48
INEQUALITY / GINI INDEX
29072
LARGEST ZIP CODE
Charleston
LARGEST CITY
Greenville County
LARGEST COUNTY
5,142,750
TOTAL POPULATION
2,510,019
MALE POPULATION
2,632,731
FEMALE POPULATION
95.34
MALES / 100 FEMALES
104.89
FEMALES / 100 MALES
40.0
MEDIAN AGE
3.1
AVG FAMILY SIZE
2.5
AVG HOUSEHOLD SIZE
2,516,635
LABOR FORCE [ PEOPLE ]
60.4%
PERCENT IN LABOR FORCE
5.2%
UNEMPLOYMENT RATE
Income in South Carolina
Income Overview in South Carolina
Per Capita Income in South Carolina is $36,072, while median incomes of families and households are $79,830 and $63,623 respectively.
| Characteristic | Number | Measure |
| Per Capita Income | 5,142,750 | $36,072 |
| Median Family Income | 1,318,317 | $79,830 |
| Mean Family Income | 1,318,317 | $104,941 |
| Median Household Income | 2,023,085 | $63,623 |
| Mean Household Income | 2,023,085 | $88,488 |
| Income Deficit | 1,318,317 | $10,884 |
| Wage / Income Gap (%) | 5,142,750 | 27.97% |
| Wage / Income Gap ($) | 5,142,750 | 72.03¢ per $1 |
| Gini / Inequality Index | 5,142,750 | 0.48 |
Earnings by Sex in South Carolina
Average Earnings in South Carolina are $37,583, $44,652 for men and $32,164 for women, a difference of 28.0%.
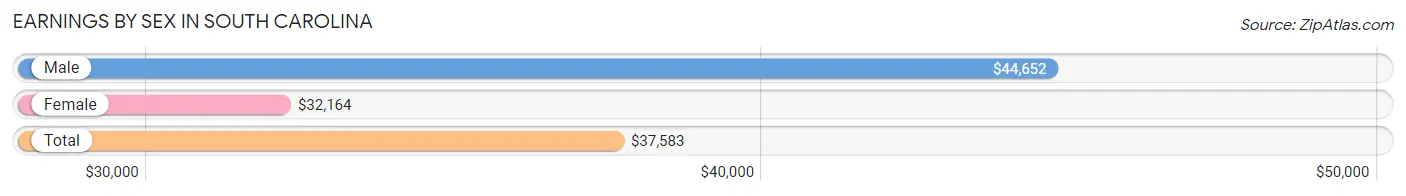
| Sex | Number | Average Earnings |
| Male | 1,363,043 (51.8%) | $44,652 |
| Female | 1,267,835 (48.2%) | $32,164 |
| Total | 2,630,878 (100.0%) | $37,583 |
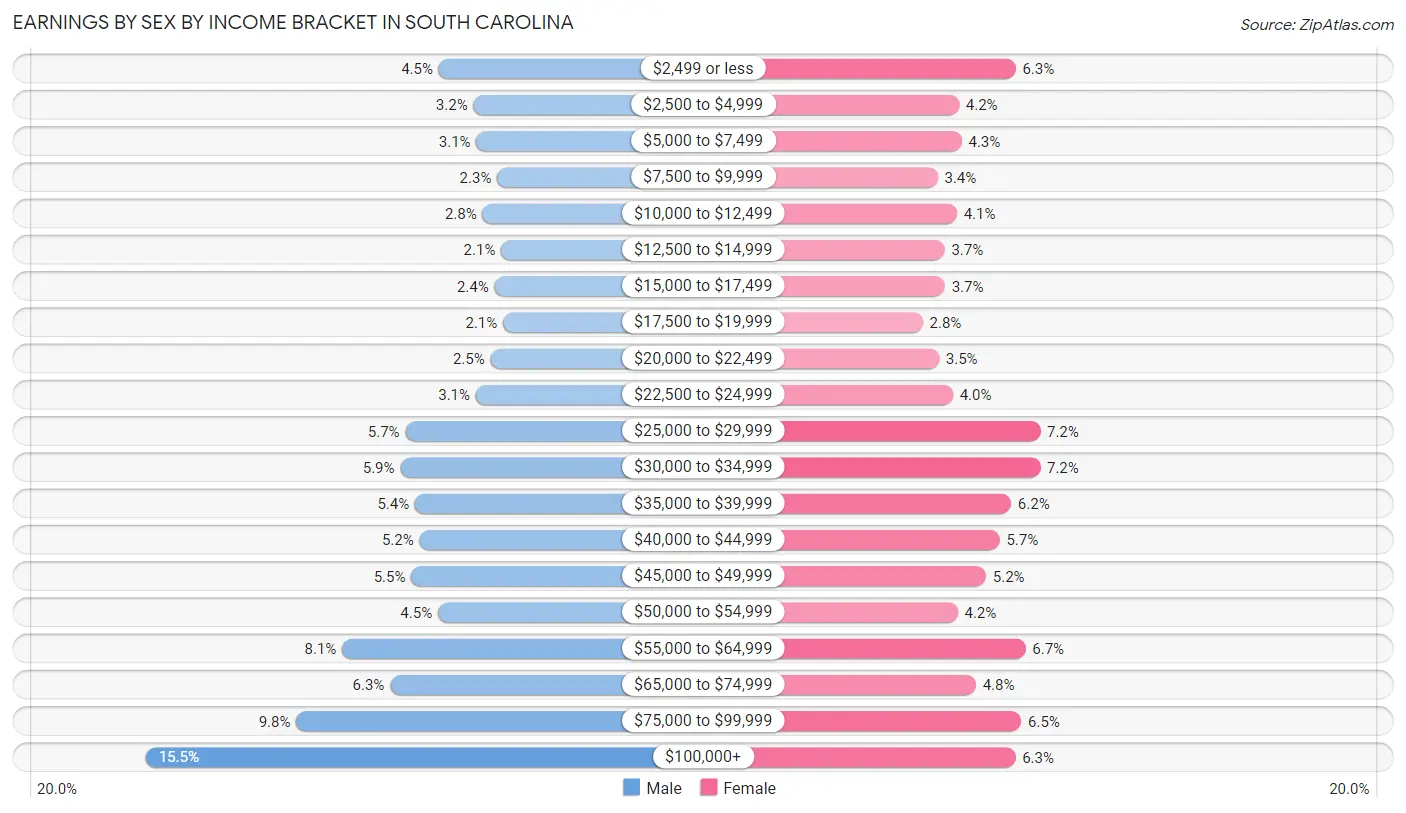
Earnings by Sex by Income Bracket in South Carolina
The most common earnings brackets in South Carolina are $100,000+ for men (210,714 | 15.5%) and $25,000 to $29,999 for women (91,848 | 7.2%).
| Income | Male | Female |
| $2,499 or less | 61,037 (4.5%) | 80,161 (6.3%) |
| $2,500 to $4,999 | 43,369 (3.2%) | 53,207 (4.2%) |
| $5,000 to $7,499 | 41,800 (3.1%) | 54,497 (4.3%) |
| $7,500 to $9,999 | 31,249 (2.3%) | 43,096 (3.4%) |
| $10,000 to $12,499 | 38,699 (2.8%) | 52,261 (4.1%) |
| $12,500 to $14,999 | 29,121 (2.1%) | 46,352 (3.7%) |
| $15,000 to $17,499 | 32,523 (2.4%) | 46,490 (3.7%) |
| $17,500 to $19,999 | 28,268 (2.1%) | 36,002 (2.8%) |
| $20,000 to $22,499 | 34,636 (2.5%) | 43,700 (3.5%) |
| $22,500 to $24,999 | 42,176 (3.1%) | 50,297 (4.0%) |
| $25,000 to $29,999 | 78,114 (5.7%) | 91,848 (7.2%) |
| $30,000 to $34,999 | 80,736 (5.9%) | 91,831 (7.2%) |
| $35,000 to $39,999 | 73,213 (5.4%) | 78,026 (6.1%) |
| $40,000 to $44,999 | 70,849 (5.2%) | 72,562 (5.7%) |
| $45,000 to $49,999 | 75,097 (5.5%) | 66,061 (5.2%) |
| $50,000 to $54,999 | 61,426 (4.5%) | 52,563 (4.2%) |
| $55,000 to $64,999 | 110,359 (8.1%) | 84,808 (6.7%) |
| $65,000 to $74,999 | 85,846 (6.3%) | 61,235 (4.8%) |
| $75,000 to $99,999 | 133,811 (9.8%) | 82,840 (6.5%) |
| $100,000+ | 210,714 (15.5%) | 79,998 (6.3%) |
| Total | 1,363,043 (100.0%) | 1,267,835 (100.0%) |
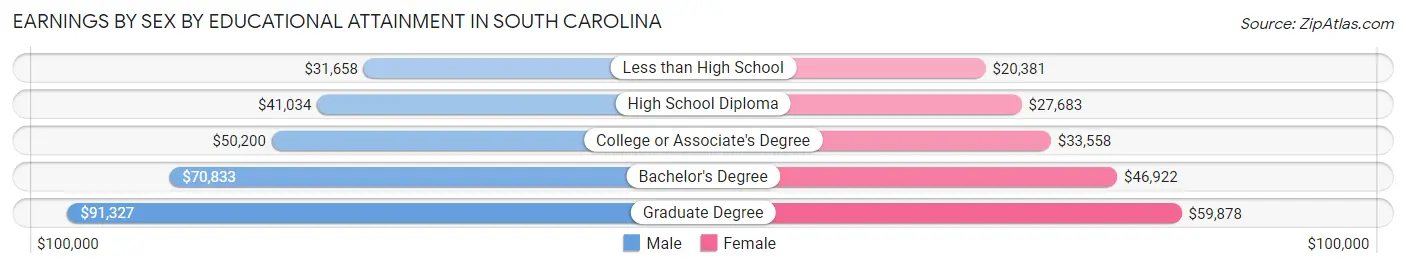
Earnings by Sex by Educational Attainment in South Carolina
Average earnings in South Carolina are $51,210 for men and $36,718 for women, a difference of 28.3%. Men with an educational attainment of graduate degree enjoy the highest average annual earnings of $91,327, while those with less than high school education earn the least with $31,658. Women with an educational attainment of graduate degree earn the most with the average annual earnings of $59,878, while those with less than high school education have the smallest earnings of $20,381.
| Educational Attainment | Male Income | Female Income |
| Less than High School | $31,658 | $20,381 |
| High School Diploma | $41,034 | $27,683 |
| College or Associate's Degree | $50,200 | $33,558 |
| Bachelor's Degree | $70,833 | $46,922 |
| Graduate Degree | $91,327 | $59,878 |
| Total | $51,210 | $36,718 |
Family Income in South Carolina
Family Income Brackets in South Carolina
According to the South Carolina family income data, there are 257,072 families falling into the $100,000 to $149,999 income range, which is the most common income bracket and makes up 19.5% of all families. Conversely, the $10,000 to $14,999 income bracket is the least frequent group with only 27,685 families (2.1%) belonging to this category.
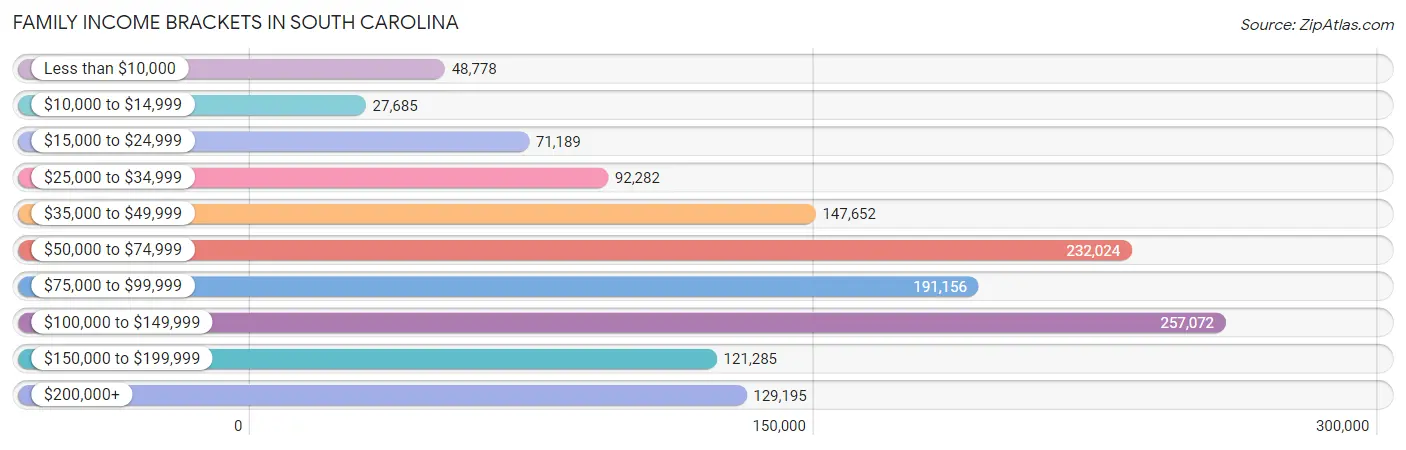
| Income Bracket | # Families | % Families |
| Less than $10,000 | 48,778 | 3.7% |
| $10,000 to $14,999 | 27,685 | 2.1% |
| $15,000 to $24,999 | 71,189 | 5.4% |
| $25,000 to $34,999 | 92,282 | 7.0% |
| $35,000 to $49,999 | 147,652 | 11.2% |
| $50,000 to $74,999 | 232,024 | 17.6% |
| $75,000 to $99,999 | 191,156 | 14.5% |
| $100,000 to $149,999 | 257,072 | 19.5% |
| $150,000 to $199,999 | 121,285 | 9.2% |
| $200,000+ | 129,195 | 9.8% |
Family Income by Famaliy Size in South Carolina
4-person families (218,392 | 16.6%) account for the highest median family income in South Carolina with $98,172 per family, while 2-person families (674,848 | 51.2%) have the highest median income of $35,898 per family member.
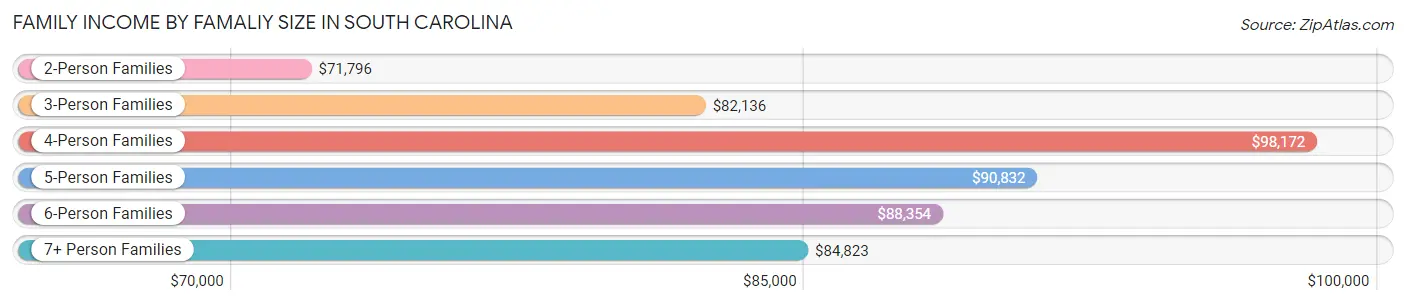
| Income Bracket | # Families | Median Income |
| 2-Person Families | 674,848 (51.2%) | $71,796 |
| 3-Person Families | 289,693 (22.0%) | $82,136 |
| 4-Person Families | 218,392 (16.6%) | $98,172 |
| 5-Person Families | 91,345 (6.9%) | $90,832 |
| 6-Person Families | 29,692 (2.2%) | $88,354 |
| 7+ Person Families | 14,347 (1.1%) | $84,823 |
| Total | 1,318,317 (100.0%) | $79,830 |
Family Income by Number of Earners in South Carolina
The median family income in South Carolina is $79,830, with families comprising 3+ earners (119,967) having the highest median family income of $130,721, while families with no earners (239,614) have the lowest median family income of $47,145, accounting for 9.1% and 18.2% of families, respectively.
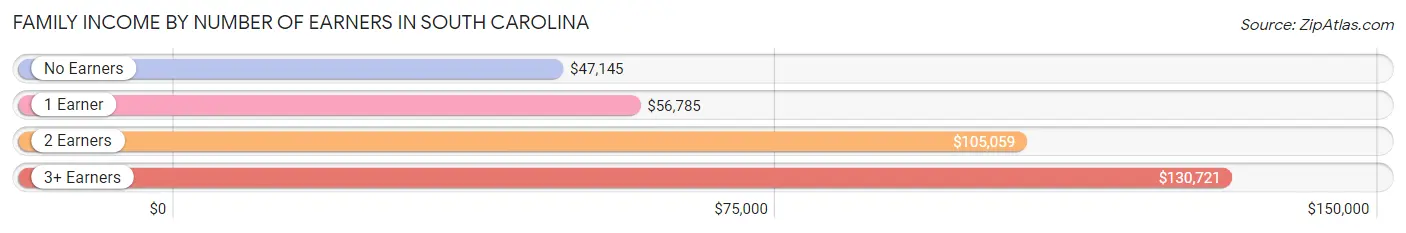
| Number of Earners | # Families | Median Income |
| No Earners | 239,614 (18.2%) | $47,145 |
| 1 Earner | 445,639 (33.8%) | $56,785 |
| 2 Earners | 513,097 (38.9%) | $105,059 |
| 3+ Earners | 119,967 (9.1%) | $130,721 |
| Total | 1,318,317 (100.0%) | $79,830 |
Household Income in South Carolina
Household Income Brackets in South Carolina
With 354,040 households falling in the category, the $50,000 to $74,999 income range is the most frequent in South Carolina, accounting for 17.5% of all households. In contrast, only 84,970 households (4.2%) fall into the $10,000 to $14,999 income bracket, making it the least populous group.
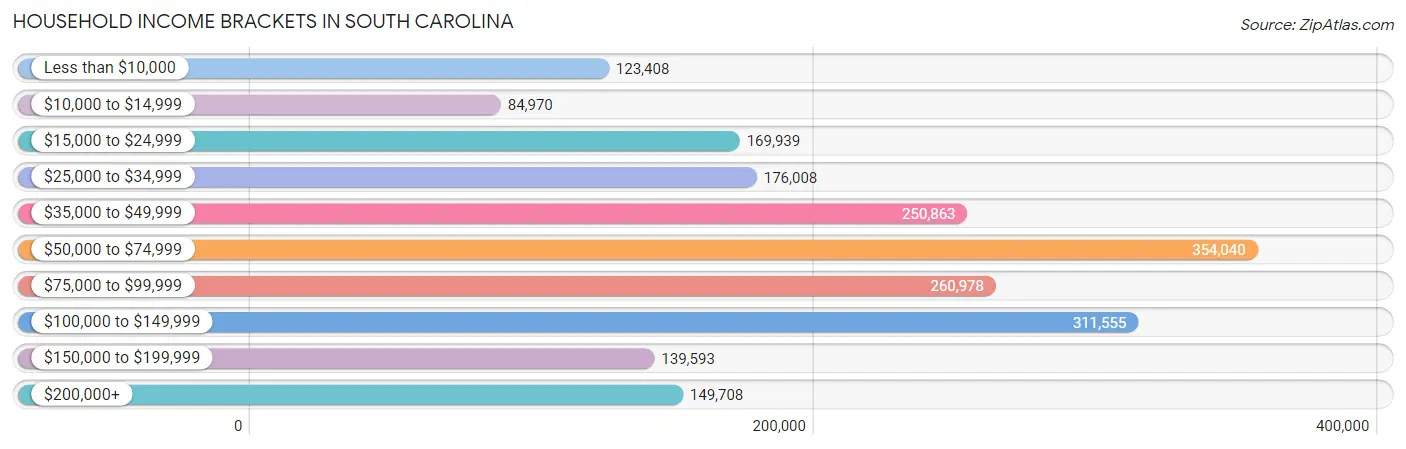
| Income Bracket | # Households | % Households |
| Less than $10,000 | 123,408 | 6.1% |
| $10,000 to $14,999 | 84,970 | 4.2% |
| $15,000 to $24,999 | 169,939 | 8.4% |
| $25,000 to $34,999 | 176,008 | 8.7% |
| $35,000 to $49,999 | 250,863 | 12.4% |
| $50,000 to $74,999 | 354,040 | 17.5% |
| $75,000 to $99,999 | 260,978 | 12.9% |
| $100,000 to $149,999 | 311,555 | 15.4% |
| $150,000 to $199,999 | 139,593 | 6.9% |
| $200,000+ | 149,708 | 7.4% |
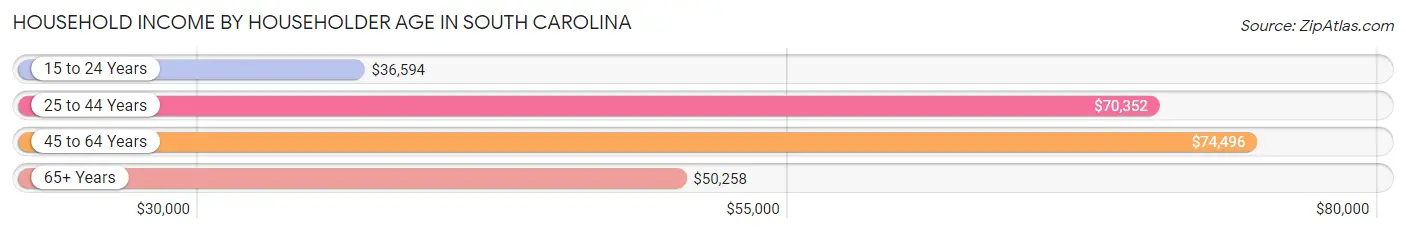
Household Income by Householder Age in South Carolina
The median household income in South Carolina is $63,623, with the highest median household income of $74,496 found in the 45 to 64 years age bracket for the primary householder. A total of 742,224 households (36.7%) fall into this category. Meanwhile, the 15 to 24 years age bracket for the primary householder has the lowest median household income of $36,594, with 73,976 households (3.7%) in this group.
| Income Bracket | # Households | Median Income |
| 15 to 24 Years | 73,976 (3.7%) | $36,594 |
| 25 to 44 Years | 620,568 (30.7%) | $70,352 |
| 45 to 64 Years | 742,224 (36.7%) | $74,496 |
| 65+ Years | 586,317 (29.0%) | $50,258 |
| Total | 2,023,085 (100.0%) | $63,623 |
Poverty in South Carolina
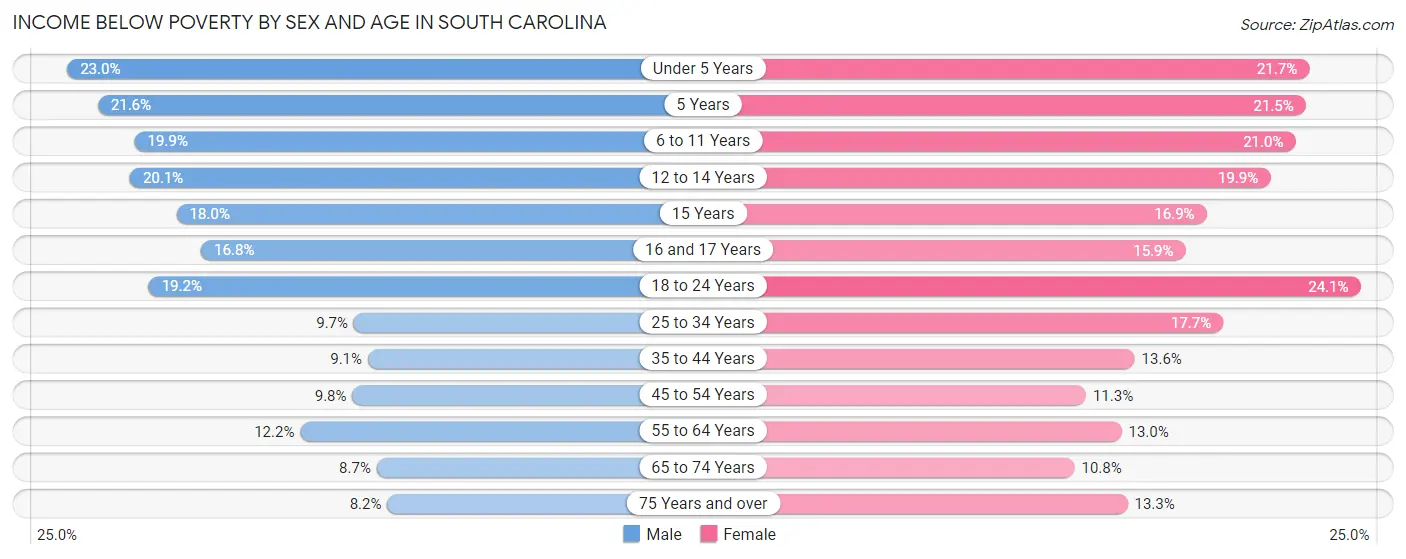
Income Below Poverty by Sex and Age in South Carolina
With 13.0% poverty level for males and 15.6% for females among the residents of South Carolina, under 5 year old males and 18 to 24 year old females are the most vulnerable to poverty, with 32,938 males (23.0%) and 48,868 females (24.1%) in their respective age groups living below the poverty level.
| Age Bracket | Male | Female |
| Under 5 Years | 32,938 (23.0%) | 29,277 (21.7%) |
| 5 Years | 6,077 (21.6%) | 6,046 (21.5%) |
| 6 to 11 Years | 37,218 (19.9%) | 38,188 (21.0%) |
| 12 to 14 Years | 19,911 (20.1%) | 18,526 (19.9%) |
| 15 Years | 5,902 (17.9%) | 5,443 (16.9%) |
| 16 and 17 Years | 10,931 (16.8%) | 9,773 (15.9%) |
| 18 to 24 Years | 41,030 (19.2%) | 48,868 (24.1%) |
| 25 to 34 Years | 30,884 (9.7%) | 59,139 (17.7%) |
| 35 to 44 Years | 27,356 (9.1%) | 43,525 (13.6%) |
| 45 to 54 Years | 29,808 (9.8%) | 36,513 (11.3%) |
| 55 to 64 Years | 39,462 (12.2%) | 46,395 (13.0%) |
| 65 to 74 Years | 22,731 (8.7%) | 32,992 (10.8%) |
| 75 Years and over | 12,104 (8.2%) | 26,812 (13.3%) |
| Total | 316,352 (13.0%) | 401,497 (15.6%) |
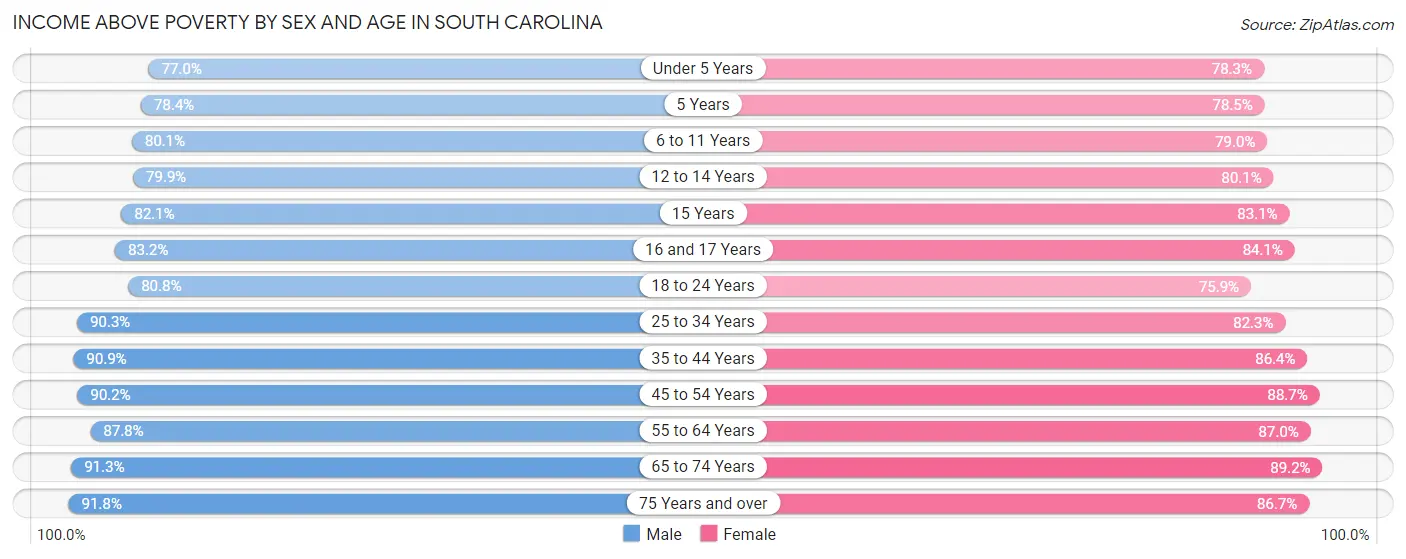
Income Above Poverty by Sex and Age in South Carolina
According to the poverty statistics in South Carolina, males aged 75 years and over and females aged 65 to 74 years are the age groups that are most secure financially, with 91.8% of males and 89.2% of females in these age groups living above the poverty line.
| Age Bracket | Male | Female |
| Under 5 Years | 110,122 (77.0%) | 105,753 (78.3%) |
| 5 Years | 22,062 (78.4%) | 22,049 (78.5%) |
| 6 to 11 Years | 149,826 (80.1%) | 143,332 (79.0%) |
| 12 to 14 Years | 79,103 (79.9%) | 74,709 (80.1%) |
| 15 Years | 26,984 (82.1%) | 26,735 (83.1%) |
| 16 and 17 Years | 54,100 (83.2%) | 51,550 (84.1%) |
| 18 to 24 Years | 172,209 (80.8%) | 154,230 (75.9%) |
| 25 to 34 Years | 286,938 (90.3%) | 275,260 (82.3%) |
| 35 to 44 Years | 274,092 (90.9%) | 276,668 (86.4%) |
| 45 to 54 Years | 274,538 (90.2%) | 285,619 (88.7%) |
| 55 to 64 Years | 283,730 (87.8%) | 310,943 (87.0%) |
| 65 to 74 Years | 239,881 (91.3%) | 272,604 (89.2%) |
| 75 Years and over | 136,028 (91.8%) | 175,418 (86.7%) |
| Total | 2,109,613 (87.0%) | 2,174,870 (84.4%) |
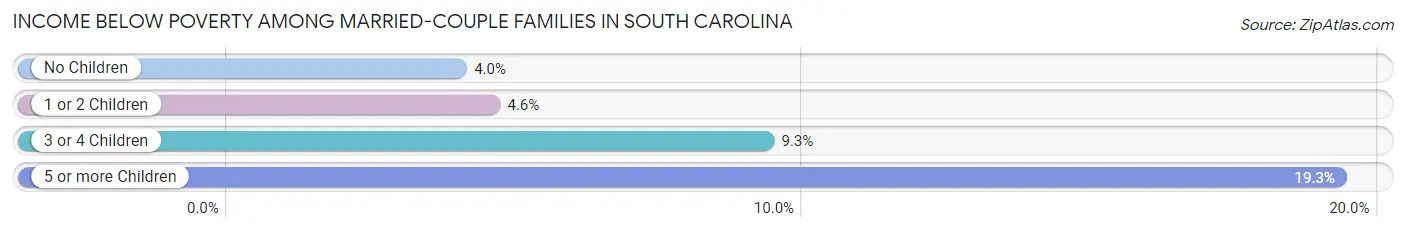
Income Below Poverty Among Married-Couple Families in South Carolina
The poverty statistics for married-couple families in South Carolina show that 4.6% or 43,852 of the total 951,952 families live below the poverty line. Families with 5 or more children have the highest poverty rate of 19.3%, comprising of 918 families. On the other hand, families with no children have the lowest poverty rate of 4.0%, which includes 23,830 families.
| Children | Above Poverty | Below Poverty |
| No Children | 573,193 (96.0%) | 23,830 (4.0%) |
| 1 or 2 Children | 272,043 (95.4%) | 13,023 (4.6%) |
| 3 or 4 Children | 59,026 (90.7%) | 6,081 (9.3%) |
| 5 or more Children | 3,838 (80.7%) | 918 (19.3%) |
| Total | 908,100 (95.4%) | 43,852 (4.6%) |
Income Below Poverty Among Single-Parent Households in South Carolina
According to the poverty data in South Carolina, 15.6% or 14,151 single-father households and 27.7% or 76,306 single-mother households are living below the poverty line. Among single-father households, those with 5 or more children have the highest poverty rate, with 180 households (39.5%) experiencing poverty. Likewise, among single-mother households, those with 5 or more children have the highest poverty rate, with 2,450 households (79.9%) falling below the poverty line.
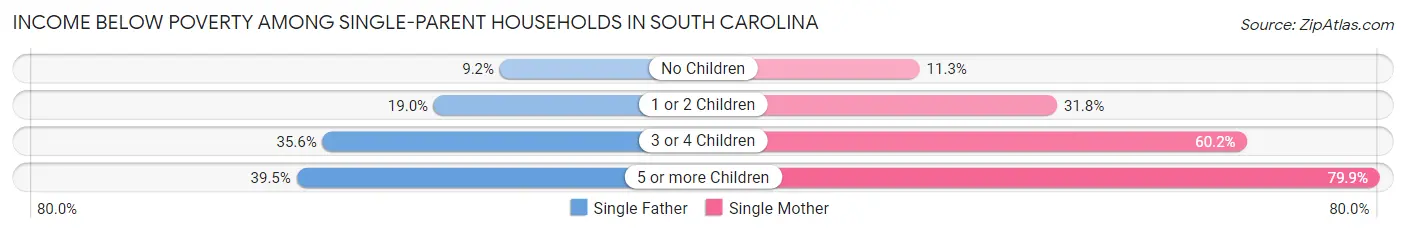
| Children | Single Father | Single Mother |
| No Children | 4,094 (9.2%) | 11,762 (11.3%) |
| 1 or 2 Children | 7,254 (19.0%) | 44,286 (31.8%) |
| 3 or 4 Children | 2,623 (35.6%) | 17,808 (60.2%) |
| 5 or more Children | 180 (39.5%) | 2,450 (79.9%) |
| Total | 14,151 (15.6%) | 76,306 (27.7%) |
Income Below Poverty Among Married-Couple vs Single-Parent Households in South Carolina
The poverty data for South Carolina shows that 43,852 of the married-couple family households (4.6%) and 90,457 of the single-parent households (24.7%) are living below the poverty level. Within the married-couple family households, those with 5 or more children have the highest poverty rate, with 918 households (19.3%) falling below the poverty line. Among the single-parent households, those with 5 or more children have the highest poverty rate, with 2,630 household (74.7%) living below poverty.
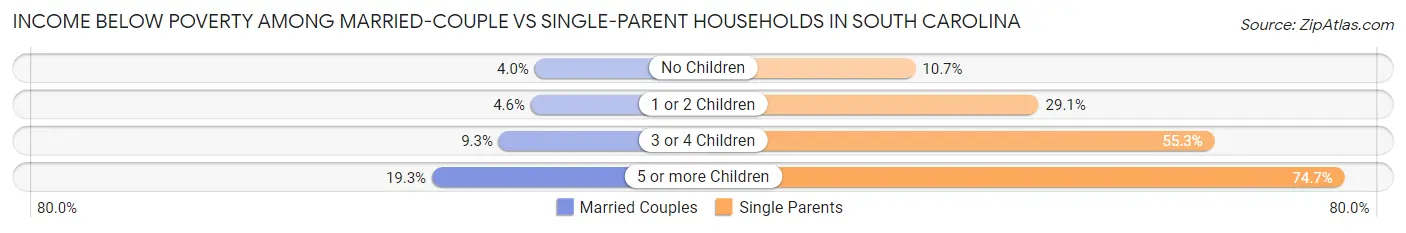
| Children | Married-Couple Families | Single-Parent Households |
| No Children | 23,830 (4.0%) | 15,856 (10.7%) |
| 1 or 2 Children | 13,023 (4.6%) | 51,540 (29.0%) |
| 3 or 4 Children | 6,081 (9.3%) | 20,431 (55.3%) |
| 5 or more Children | 918 (19.3%) | 2,630 (74.7%) |
| Total | 43,852 (4.6%) | 90,457 (24.7%) |
Largest Zip Codes by Population in South Carolina
The largest zip codes in South Carolina by population are 29072 (67,669), 29681 (66,168), 29445 (60,419), 29485 (58,946), and 29732 (57,182).
1.29072
67,669 (1.32%)
2.29681
66,168 (1.29%)
3.29445
60,419 (1.17%)
4.29485
58,946 (1.15%)
5.29732
57,182 (1.11%)
6.29483
56,758 (1.10%)
7.29730
56,727 (1.10%)
8.29651
53,804 (1.05%)
9.29588
52,899 (1.03%)
10.29720
52,308 (1.02%)
11.29223
51,354 (1.00%)
12.29464
51,259 (1.00%)
13.29073
49,849 (0.97%)
14.29526
49,383 (0.96%)
15.29579
49,113 (0.95%)
16.29229
49,097 (0.95%)
17.29910
47,927 (0.93%)
18.29501
47,406 (0.92%)
19.29621
44,260 (0.86%)
20.29414
44,196 (0.86%)
21.29486
43,513 (0.85%)
22.29607
43,466 (0.85%)
23.29687
43,398 (0.84%)
24.29466
43,233 (0.84%)
25.29461
42,217 (0.82%)
26.29708
42,028 (0.82%)
27.29715
41,581 (0.81%)
28.29203
41,205 (0.80%)
29.29210
40,923 (0.80%)
30.29412
40,307 (0.78%)
Largest Cities by Population in South Carolina
The largest cities in South Carolina by population are Charleston (149,960), Columbia (136,754), North Charleston (115,755), Mount Pleasant (90,945), and Rock Hill (74,170).
149,960 (2.92%)
2.Columbia
136,754 (2.66%)
115,755 (2.25%)
90,945 (1.77%)
74,170 (1.44%)
70,838 (1.38%)
50,839 (0.99%)
45,858 (0.89%)
9.Sumter
43,046 (0.84%)
10.Florence
39,931 (0.78%)
11.Spartanburg
38,301 (0.74%)
37,708 (0.73%)
13.Greer
37,010 (0.72%)
14.Myrtle Beach
36,064 (0.70%)
15.Aiken
32,014 (0.62%)
16.Bluffton
29,375 (0.57%)
17.Anderson
29,345 (0.57%)
18.Fort Mill
26,022 (0.51%)
19.Mauldin
25,267 (0.49%)
20.Conway
25,121 (0.49%)
24,823 (0.48%)
22.Socastee
24,464 (0.48%)
24,425 (0.47%)
24.Simpsonville
24,133 (0.47%)
25.Lexington
23,665 (0.46%)
26.Easley
23,135 (0.45%)
27.Taylors
23,005 (0.45%)
28.Greenwood
22,528 (0.44%)
29.St Andrews
21,909 (0.43%)
30.Wade Hampton
21,029 (0.41%)
Largest Counties by Population in South Carolina
The largest counties in South Carolina by population are Greenville County (528,251), Richland County (416,161), Charleston County (409,840), Horry County (356,578), and Spartanburg County (330,119).
528,251 (10.27%)
416,161 (8.09%)
409,840 (7.97%)
356,578 (6.93%)
330,119 (6.42%)
295,934 (5.75%)
282,987 (5.50%)
231,419 (4.50%)
204,592 (3.98%)
189,071 (3.68%)
11.Aiken County
169,865 (3.30%)
162,139 (3.15%)
137,015 (2.66%)
131,106 (2.55%)
105,199 (2.05%)
97,611 (1.90%)
84,159 (1.64%)
78,775 (1.53%)
69,309 (1.35%)
67,456 (1.31%)
65,779 (1.28%)
63,594 (1.24%)
63,025 (1.23%)
56,200 (1.09%)
43,536 (0.85%)
38,561 (0.75%)
37,918 (0.74%)
32,171 (0.63%)
31,163 (0.61%)
30,879 (0.60%)
Race in South Carolina
The most populous races in South Carolina are White / Caucasian (3,342,861 | 65.0%), Black / African American (1,326,209 | 25.8%), and Hispanic or Latino (318,875 | 6.2%).
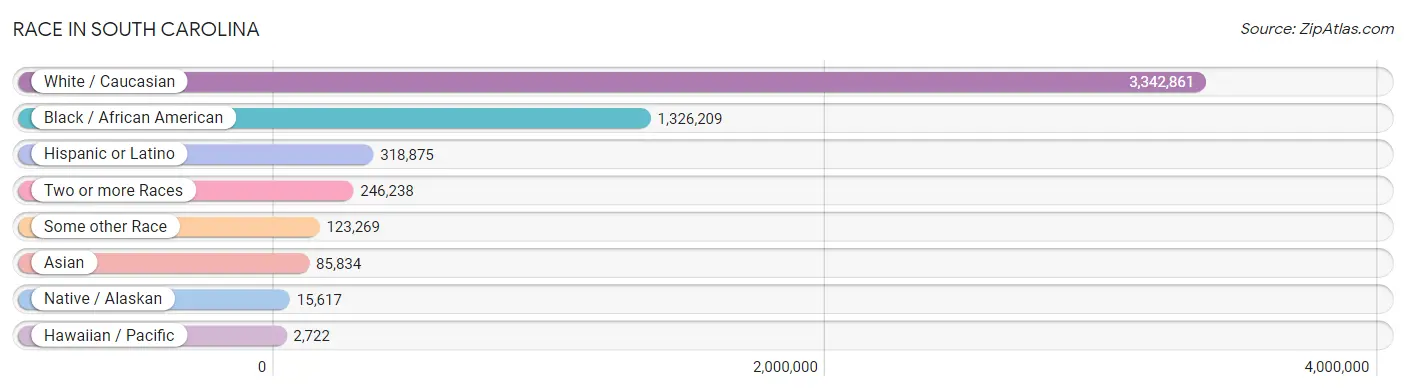
| Race | # Population | % Population |
| Asian | 85,834 | 1.7% |
| Black / African American | 1,326,209 | 25.8% |
| Hawaiian / Pacific | 2,722 | 0.1% |
| Hispanic or Latino | 318,875 | 6.2% |
| Native / Alaskan | 15,617 | 0.3% |
| White / Caucasian | 3,342,861 | 65.0% |
| Two or more Races | 246,238 | 4.8% |
| Some other Race | 123,269 | 2.4% |
| Total | 5,142,750 | 100.0% |
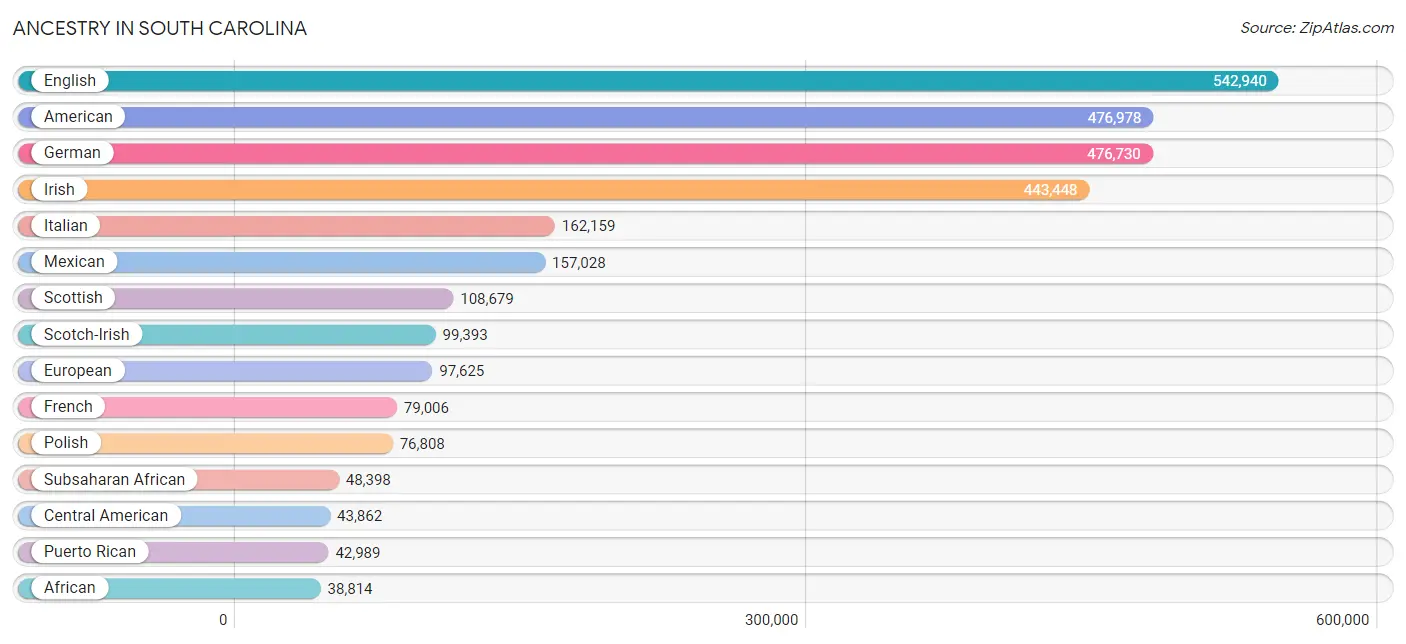
Ancestry in South Carolina
The most populous ancestries reported in South Carolina are English (542,940 | 10.6%), American (476,978 | 9.3%), German (476,730 | 9.3%), Irish (443,448 | 8.6%), and Italian (162,159 | 3.2%), together accounting for 40.9% of all South Carolina residents.
| Ancestry | # Population | % Population |
| Afghan | 142 | 0.0% |
| African | 38,814 | 0.7% |
| Alaska Native | 18 | 0.0% |
| Alaskan Athabascan | 62 | 0.0% |
| Albanian | 1,334 | 0.0% |
| Aleut | 45 | 0.0% |
| Alsatian | 136 | 0.0% |
| American | 476,978 | 9.3% |
| Apache | 589 | 0.0% |
| Arab | 15,767 | 0.3% |
| Arapaho | 1 | 0.0% |
| Argentinean | 1,930 | 0.0% |
| Armenian | 2,605 | 0.1% |
| Assyrian / Chaldean / Syriac | 132 | 0.0% |
| Australian | 724 | 0.0% |
| Austrian | 6,958 | 0.1% |
| Bahamian | 682 | 0.0% |
| Bangladeshi | 1,565 | 0.0% |
| Barbadian | 340 | 0.0% |
| Basque | 241 | 0.0% |
| Belgian | 2,600 | 0.1% |
| Belizean | 127 | 0.0% |
| Bermudan | 154 | 0.0% |
| Bhutanese | 7,700 | 0.2% |
| Blackfeet | 2,500 | 0.1% |
| Bolivian | 868 | 0.0% |
| Brazilian | 5,032 | 0.1% |
| British | 28,613 | 0.6% |
| British West Indian | 741 | 0.0% |
| Bulgarian | 1,088 | 0.0% |
| Burmese | 9,844 | 0.2% |
| Cajun | 613 | 0.0% |
| Cambodian | 166 | 0.0% |
| Canadian | 6,311 | 0.1% |
| Cape Verdean | 175 | 0.0% |
| Carpatho Rusyn | 31 | 0.0% |
| Celtic | 1,122 | 0.0% |
| Central American | 43,862 | 0.9% |
| Central American Indian | 2,899 | 0.1% |
| Cherokee | 18,347 | 0.4% |
| Cheyenne | 82 | 0.0% |
| Chickasaw | 278 | 0.0% |
| Chilean | 1,017 | 0.0% |
| Chinese | 378 | 0.0% |
| Chippewa | 375 | 0.0% |
| Choctaw | 919 | 0.0% |
| Colombian | 17,195 | 0.3% |
| Comanche | 80 | 0.0% |
| Costa Rican | 2,374 | 0.1% |
| Cree | 71 | 0.0% |
| Creek | 282 | 0.0% |
| Croatian | 3,163 | 0.1% |
| Crow | 63 | 0.0% |
| Cuban | 11,511 | 0.2% |
| Cypriot | 244 | 0.0% |
| Czech | 8,297 | 0.2% |
| Czechoslovakian | 1,995 | 0.0% |
| Danish | 7,608 | 0.2% |
| Delaware | 62 | 0.0% |
| Dominican | 5,526 | 0.1% |
| Dutch | 34,763 | 0.7% |
| Dutch West Indian | 63 | 0.0% |
| Eastern European | 8,404 | 0.2% |
| Ecuadorian | 4,015 | 0.1% |
| Egyptian | 1,603 | 0.0% |
| English | 542,940 | 10.6% |
| Estonian | 275 | 0.0% |
| Ethiopian | 757 | 0.0% |
| European | 97,625 | 1.9% |
| Fijian | 10 | 0.0% |
| Filipino | 1,018 | 0.0% |
| Finnish | 6,087 | 0.1% |
| French | 79,006 | 1.5% |
| French American Indian | 272 | 0.0% |
| French Canadian | 16,801 | 0.3% |
| German | 476,730 | 9.3% |
| German Russian | 29 | 0.0% |
| Ghanaian | 680 | 0.0% |
| Greek | 15,363 | 0.3% |
| Guamanian / Chamorro | 1,344 | 0.0% |
| Guatemalan | 13,860 | 0.3% |
| Guyanese | 518 | 0.0% |
| Haitian | 3,675 | 0.1% |
| Honduran | 17,847 | 0.4% |
| Hopi | 94 | 0.0% |
| Houma | 67 | 0.0% |
| Hungarian | 11,527 | 0.2% |
| Icelander | 428 | 0.0% |
| Indian (Asian) | 18,586 | 0.4% |
| Indonesian | 987 | 0.0% |
| Inupiat | 195 | 0.0% |
| Iranian | 2,050 | 0.0% |
| Iraqi | 1,040 | 0.0% |
| Irish | 443,448 | 8.6% |
| Iroquois | 788 | 0.0% |
| Israeli | 1,285 | 0.0% |
| Italian | 162,159 | 3.2% |
| Jamaican | 10,450 | 0.2% |
| Japanese | 1,992 | 0.0% |
| Jordanian | 335 | 0.0% |
| Kenyan | 815 | 0.0% |
| Kiowa | 20 | 0.0% |
| Korean | 23,971 | 0.5% |
| Laotian | 650 | 0.0% |
| Latvian | 737 | 0.0% |
| Lebanese | 6,008 | 0.1% |
| Liberian | 464 | 0.0% |
| Lithuanian | 4,453 | 0.1% |
| Lumbee | 2,949 | 0.1% |
| Luxembourger | 163 | 0.0% |
| Macedonian | 239 | 0.0% |
| Malaysian | 2,451 | 0.1% |
| Maltese | 255 | 0.0% |
| Marshallese | 11 | 0.0% |
| Menominee | 6 | 0.0% |
| Mexican | 157,028 | 3.0% |
| Mexican American Indian | 2,341 | 0.1% |
| Mongolian | 47 | 0.0% |
| Moroccan | 985 | 0.0% |
| Native Hawaiian | 2,570 | 0.1% |
| Navajo | 439 | 0.0% |
| New Zealander | 93 | 0.0% |
| Nicaraguan | 1,323 | 0.0% |
| Nigerian | 3,300 | 0.1% |
| Northern European | 6,992 | 0.1% |
| Norwegian | 22,946 | 0.4% |
| Okinawan | 78 | 0.0% |
| Osage | 109 | 0.0% |
| Ottawa | 41 | 0.0% |
| Paiute | 33 | 0.0% |
| Pakistani | 3,413 | 0.1% |
| Palestinian | 829 | 0.0% |
| Panamanian | 2,461 | 0.1% |
| Paraguayan | 86 | 0.0% |
| Pennsylvania German | 1,618 | 0.0% |
| Peruvian | 2,544 | 0.1% |
| Pima | 7 | 0.0% |
| Polish | 76,808 | 1.5% |
| Portuguese | 10,322 | 0.2% |
| Potawatomi | 118 | 0.0% |
| Pueblo | 186 | 0.0% |
| Puerto Rican | 42,989 | 0.8% |
| Puget Sound Salish | 5 | 0.0% |
| Romanian | 4,115 | 0.1% |
| Russian | 20,427 | 0.4% |
| Salvadoran | 5,959 | 0.1% |
| Samoan | 976 | 0.0% |
| Scandinavian | 10,216 | 0.2% |
| Scotch-Irish | 99,393 | 1.9% |
| Scottish | 108,679 | 2.1% |
| Seminole | 385 | 0.0% |
| Senegalese | 319 | 0.0% |
| Serbian | 1,451 | 0.0% |
| Shoshone | 49 | 0.0% |
| Sierra Leonean | 69 | 0.0% |
| Sioux | 662 | 0.0% |
| Slavic | 1,804 | 0.0% |
| Slovak | 5,074 | 0.1% |
| Slovene | 1,205 | 0.0% |
| Somali | 18 | 0.0% |
| South African | 1,324 | 0.0% |
| South American | 33,841 | 0.7% |
| South American Indian | 295 | 0.0% |
| Spaniard | 5,670 | 0.1% |
| Spanish | 4,882 | 0.1% |
| Spanish American | 201 | 0.0% |
| Spanish American Indian | 5 | 0.0% |
| Sri Lankan | 12,477 | 0.2% |
| Subsaharan African | 48,398 | 0.9% |
| Sudanese | 171 | 0.0% |
| Swedish | 25,140 | 0.5% |
| Swiss | 7,704 | 0.2% |
| Syrian | 1,292 | 0.0% |
| Taiwanese | 14 | 0.0% |
| Thai | 28,950 | 0.6% |
| Tlingit-Haida | 38 | 0.0% |
| Tohono O'Odham | 15 | 0.0% |
| Trinidadian and Tobagonian | 1,573 | 0.0% |
| Turkish | 1,877 | 0.0% |
| U.S. Virgin Islander | 96 | 0.0% |
| Ugandan | 141 | 0.0% |
| Ukrainian | 12,753 | 0.3% |
| Uruguayan | 998 | 0.0% |
| Ute | 38 | 0.0% |
| Venezuelan | 4,895 | 0.1% |
| Vietnamese | 523 | 0.0% |
| Welsh | 25,014 | 0.5% |
| West Indian | 2,402 | 0.1% |
| Yaqui | 14 | 0.0% |
| Yugoslavian | 1,506 | 0.0% |
| Yup'ik | 36 | 0.0% |
| Zimbabwean | 72 | 0.0% | View All 192 Rows |
Immigrants in South Carolina
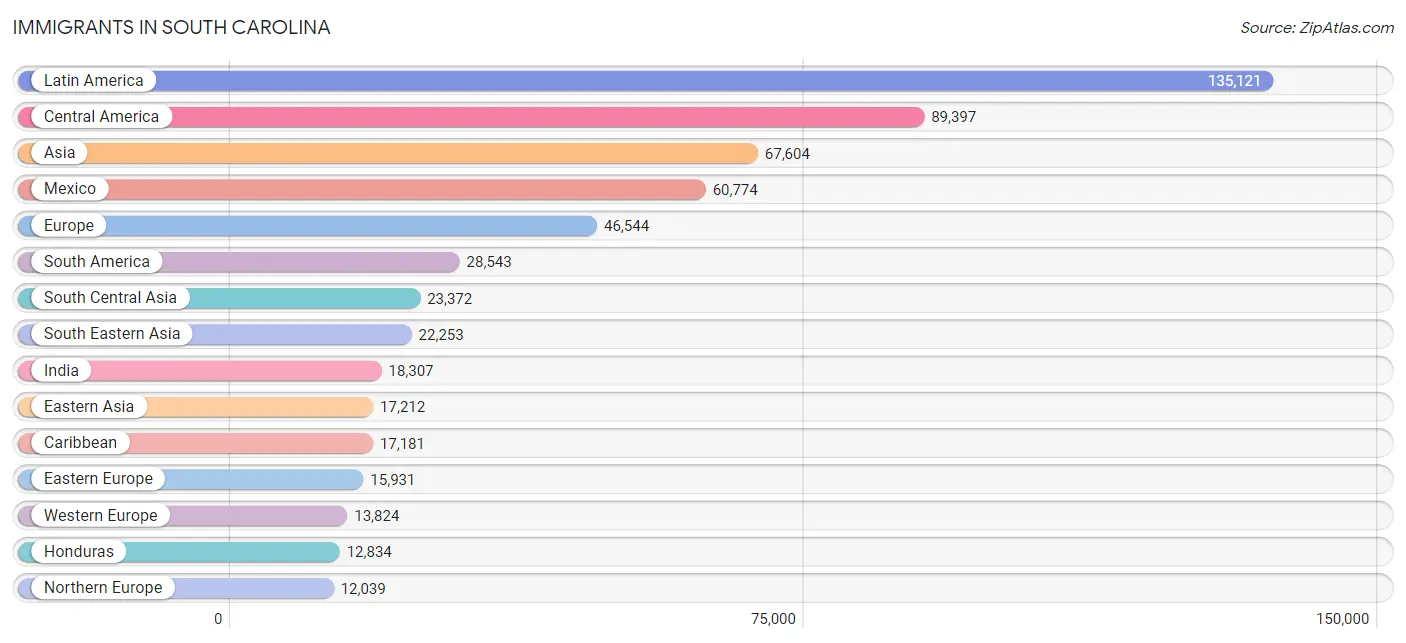
The most numerous immigrant groups reported in South Carolina came from Latin America (135,121 | 2.6%), Central America (89,397 | 1.7%), Asia (67,604 | 1.3%), Mexico (60,774 | 1.2%), and Europe (46,544 | 0.9%), together accounting for 7.8% of all South Carolina residents.
| Immigration Origin | # Population | % Population |
| Afghanistan | 191 | 0.0% |
| Africa | 11,018 | 0.2% |
| Albania | 495 | 0.0% |
| Argentina | 1,414 | 0.0% |
| Armenia | 59 | 0.0% |
| Asia | 67,604 | 1.3% |
| Australia | 553 | 0.0% |
| Austria | 457 | 0.0% |
| Azores | 35 | 0.0% |
| Bahamas | 445 | 0.0% |
| Bangladesh | 628 | 0.0% |
| Barbados | 194 | 0.0% |
| Belarus | 559 | 0.0% |
| Belgium | 285 | 0.0% |
| Belize | 202 | 0.0% |
| Bolivia | 698 | 0.0% |
| Bosnia and Herzegovina | 410 | 0.0% |
| Brazil | 5,344 | 0.1% |
| Bulgaria | 566 | 0.0% |
| Cabo Verde | 16 | 0.0% |
| Cambodia | 742 | 0.0% |
| Cameroon | 386 | 0.0% |
| Canada | 8,193 | 0.2% |
| Caribbean | 17,181 | 0.3% |
| Central America | 89,397 | 1.7% |
| Chile | 567 | 0.0% |
| China | 10,513 | 0.2% |
| Colombia | 11,533 | 0.2% |
| Congo | 170 | 0.0% |
| Costa Rica | 1,395 | 0.0% |
| Croatia | 114 | 0.0% |
| Cuba | 3,987 | 0.1% |
| Czechoslovakia | 436 | 0.0% |
| Denmark | 347 | 0.0% |
| Dominica | 109 | 0.0% |
| Dominican Republic | 2,357 | 0.1% |
| Eastern Africa | 3,036 | 0.1% |
| Eastern Asia | 17,212 | 0.3% |
| Eastern Europe | 15,931 | 0.3% |
| Ecuador | 2,502 | 0.1% |
| Egypt | 1,208 | 0.0% |
| El Salvador | 2,998 | 0.1% |
| England | 5,117 | 0.1% |
| Eritrea | 42 | 0.0% |
| Ethiopia | 594 | 0.0% |
| Europe | 46,544 | 0.9% |
| Fiji | 50 | 0.0% |
| France | 1,940 | 0.0% |
| Germany | 9,982 | 0.2% |
| Ghana | 540 | 0.0% |
| Greece | 1,296 | 0.0% |
| Grenada | 177 | 0.0% |
| Guatemala | 9,058 | 0.2% |
| Guyana | 598 | 0.0% |
| Haiti | 921 | 0.0% |
| Honduras | 12,834 | 0.3% |
| Hong Kong | 833 | 0.0% |
| Hungary | 622 | 0.0% |
| India | 18,307 | 0.4% |
| Indonesia | 269 | 0.0% |
| Iran | 1,270 | 0.0% |
| Iraq | 855 | 0.0% |
| Ireland | 1,080 | 0.0% |
| Israel | 598 | 0.0% |
| Italy | 1,444 | 0.0% |
| Jamaica | 7,073 | 0.1% |
| Japan | 2,055 | 0.0% |
| Jordan | 353 | 0.0% |
| Kazakhstan | 579 | 0.0% |
| Kenya | 1,298 | 0.0% |
| Korea | 4,513 | 0.1% |
| Kuwait | 301 | 0.0% |
| Laos | 1,192 | 0.0% |
| Latin America | 135,121 | 2.6% |
| Latvia | 253 | 0.0% |
| Lebanon | 345 | 0.0% |
| Liberia | 485 | 0.0% |
| Lithuania | 92 | 0.0% |
| Malaysia | 120 | 0.0% |
| Mexico | 60,774 | 1.2% |
| Micronesia | 505 | 0.0% |
| Middle Africa | 689 | 0.0% |
| Moldova | 770 | 0.0% |
| Morocco | 322 | 0.0% |
| Nepal | 293 | 0.0% |
| Netherlands | 727 | 0.0% |
| Nicaragua | 733 | 0.0% |
| Nigeria | 1,652 | 0.0% |
| North Macedonia | 128 | 0.0% |
| Northern Africa | 2,166 | 0.0% |
| Northern Europe | 12,039 | 0.2% |
| Norway | 215 | 0.0% |
| Oceania | 1,373 | 0.0% |
| Pakistan | 1,109 | 0.0% |
| Panama | 1,278 | 0.0% |
| Peru | 1,273 | 0.0% |
| Philippines | 11,031 | 0.2% |
| Poland | 1,691 | 0.0% |
| Portugal | 876 | 0.0% |
| Romania | 1,507 | 0.0% |
| Russia | 3,522 | 0.1% |
| Saudi Arabia | 165 | 0.0% |
| Scotland | 1,092 | 0.0% |
| Senegal | 228 | 0.0% |
| Serbia | 136 | 0.0% |
| Singapore | 159 | 0.0% |
| Somalia | 33 | 0.0% |
| South Africa | 1,091 | 0.0% |
| South America | 28,543 | 0.6% |
| South Central Asia | 23,372 | 0.4% |
| South Eastern Asia | 22,253 | 0.4% |
| Southern Europe | 4,587 | 0.1% |
| Spain | 971 | 0.0% |
| Sri Lanka | 147 | 0.0% |
| St. Vincent and the Grenadines | 3 | 0.0% |
| Sudan | 79 | 0.0% |
| Sweden | 707 | 0.0% |
| Switzerland | 403 | 0.0% |
| Syria | 335 | 0.0% |
| Taiwan | 959 | 0.0% |
| Thailand | 1,840 | 0.0% |
| Trinidad and Tobago | 1,084 | 0.0% |
| Turkey | 701 | 0.0% |
| Uganda | 312 | 0.0% |
| Ukraine | 3,877 | 0.1% |
| Uruguay | 561 | 0.0% |
| Uzbekistan | 687 | 0.0% |
| Venezuela | 3,822 | 0.1% |
| Vietnam | 6,308 | 0.1% |
| West Indies | 53 | 0.0% |
| Western Africa | 3,413 | 0.1% |
| Western Asia | 4,310 | 0.1% |
| Western Europe | 13,824 | 0.3% |
| Yemen | 155 | 0.0% |
| Zaire | 70 | 0.0% |
| Zimbabwe | 110 | 0.0% | View All 136 Rows |
Sex and Age in South Carolina
Sex and Age in South Carolina
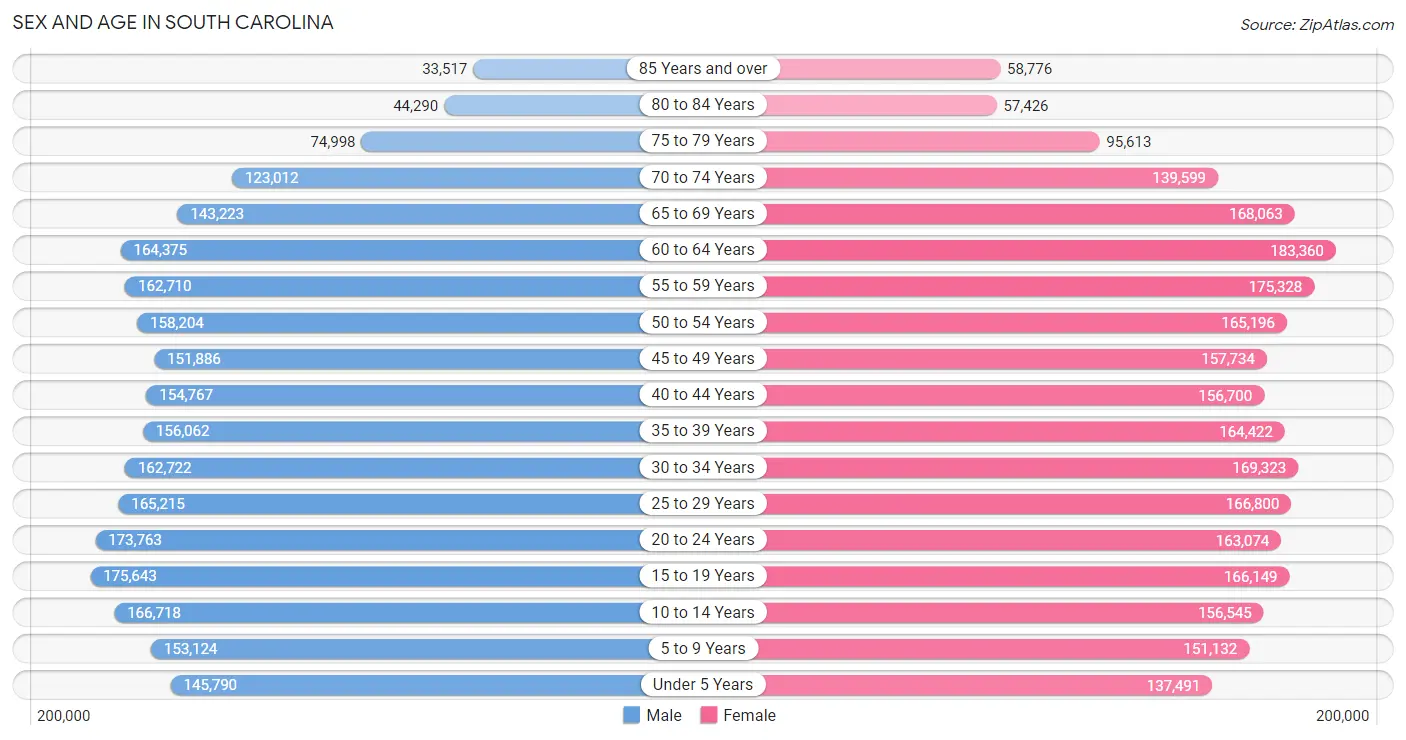
The most populous age groups in South Carolina are 15 to 19 Years (175,643 | 7.0%) for men and 60 to 64 Years (183,360 | 7.0%) for women.
| Age Bracket | Male | Female |
| Under 5 Years | 145,790 (5.8%) | 137,491 (5.2%) |
| 5 to 9 Years | 153,124 (6.1%) | 151,132 (5.7%) |
| 10 to 14 Years | 166,718 (6.6%) | 156,545 (5.9%) |
| 15 to 19 Years | 175,643 (7.0%) | 166,149 (6.3%) |
| 20 to 24 Years | 173,763 (6.9%) | 163,074 (6.2%) |
| 25 to 29 Years | 165,215 (6.6%) | 166,800 (6.3%) |
| 30 to 34 Years | 162,722 (6.5%) | 169,323 (6.4%) |
| 35 to 39 Years | 156,062 (6.2%) | 164,422 (6.2%) |
| 40 to 44 Years | 154,767 (6.2%) | 156,700 (5.9%) |
| 45 to 49 Years | 151,886 (6.0%) | 157,734 (6.0%) |
| 50 to 54 Years | 158,204 (6.3%) | 165,196 (6.3%) |
| 55 to 59 Years | 162,710 (6.5%) | 175,328 (6.7%) |
| 60 to 64 Years | 164,375 (6.6%) | 183,360 (7.0%) |
| 65 to 69 Years | 143,223 (5.7%) | 168,063 (6.4%) |
| 70 to 74 Years | 123,012 (4.9%) | 139,599 (5.3%) |
| 75 to 79 Years | 74,998 (3.0%) | 95,613 (3.6%) |
| 80 to 84 Years | 44,290 (1.8%) | 57,426 (2.2%) |
| 85 Years and over | 33,517 (1.3%) | 58,776 (2.2%) |
| Total | 2,510,019 (100.0%) | 2,632,731 (100.0%) |
Families and Households in South Carolina
Median Family Size in South Carolina
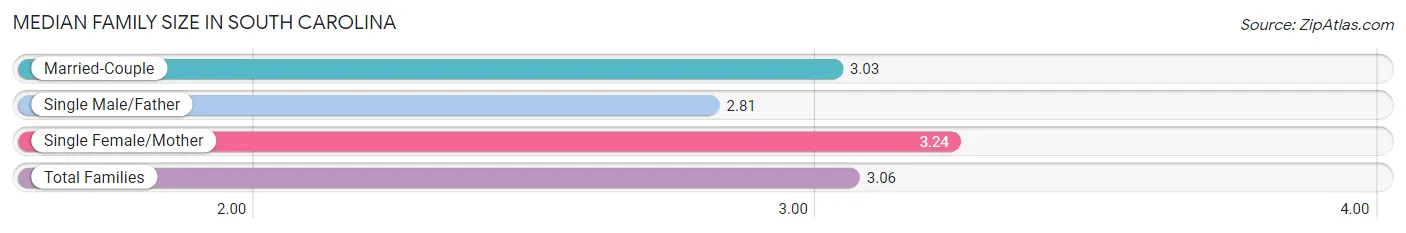
The median family size in South Carolina is 3.06 persons per family, with single female/mother families (275,800 | 20.9%) accounting for the largest median family size of 3.24 persons per family. On the other hand, single male/father families (90,565 | 6.9%) represent the smallest median family size with 2.81 persons per family.
| Family Type | # Families | Family Size |
| Married-Couple | 951,952 (72.2%) | 3.03 |
| Single Male/Father | 90,565 (6.9%) | 2.81 |
| Single Female/Mother | 275,800 (20.9%) | 3.24 |
| Total Families | 1,318,317 (100.0%) | 3.06 |
Median Household Size in South Carolina
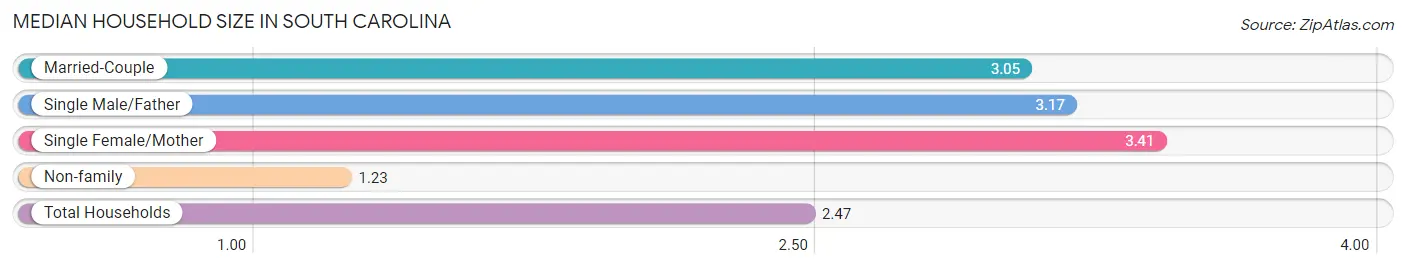
The median household size in South Carolina is 2.47 persons per household, with single female/mother households (275,800 | 13.6%) accounting for the largest median household size of 3.41 persons per household. non-family households (704,768 | 34.8%) represent the smallest median household size with 1.23 persons per household.
| Household Type | # Households | Household Size |
| Married-Couple | 951,952 (47.0%) | 3.05 |
| Single Male/Father | 90,565 (4.5%) | 3.17 |
| Single Female/Mother | 275,800 (13.6%) | 3.41 |
| Non-family | 704,768 (34.8%) | 1.23 |
| Total Households | 2,023,085 (100.0%) | 2.47 |
Household Size by Marriage Status in South Carolina
Out of a total of 2,023,085 households in South Carolina, 1,318,317 (65.2%) are family households, while 704,768 (34.8%) are nonfamily households. The most numerous type of family households are 2-person households, comprising 640,145, and the most common type of nonfamily households are 1-person households, comprising 588,947.
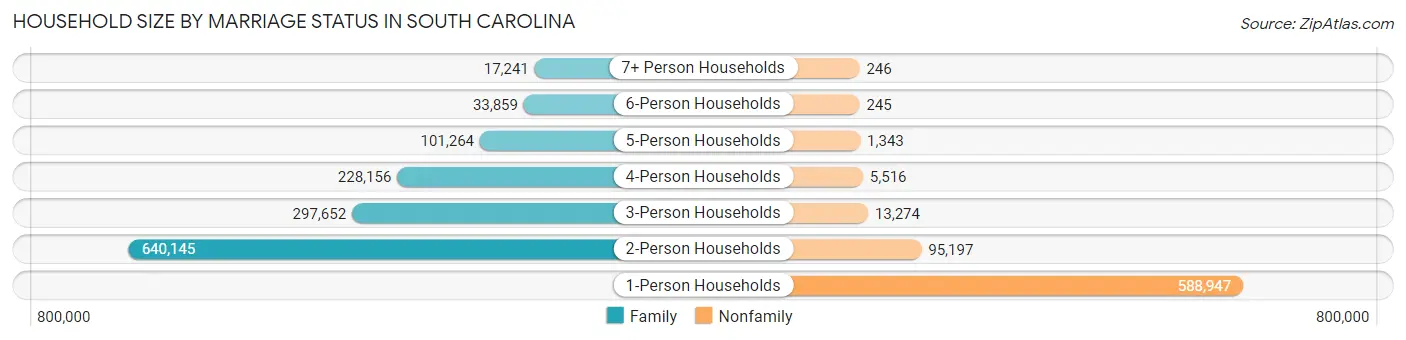
| Household Size | Family Households | Nonfamily Households |
| 1-Person Households | - | 588,947 (29.1%) |
| 2-Person Households | 640,145 (31.6%) | 95,197 (4.7%) |
| 3-Person Households | 297,652 (14.7%) | 13,274 (0.7%) |
| 4-Person Households | 228,156 (11.3%) | 5,516 (0.3%) |
| 5-Person Households | 101,264 (5.0%) | 1,343 (0.1%) |
| 6-Person Households | 33,859 (1.7%) | 245 (0.0%) |
| 7+ Person Households | 17,241 (0.9%) | 246 (0.0%) |
| Total | 1,318,317 (65.2%) | 704,768 (34.8%) |
Female Fertility in South Carolina
Fertility by Age in South Carolina
Average fertility rate in South Carolina is 53.0 births per 1,000 women. Women in the age bracket of 20 to 34 years have the highest fertility rate with 94.0 births per 1,000 women. Women in the age bracket of 20 to 34 years acount for 74.9% of all women with births.
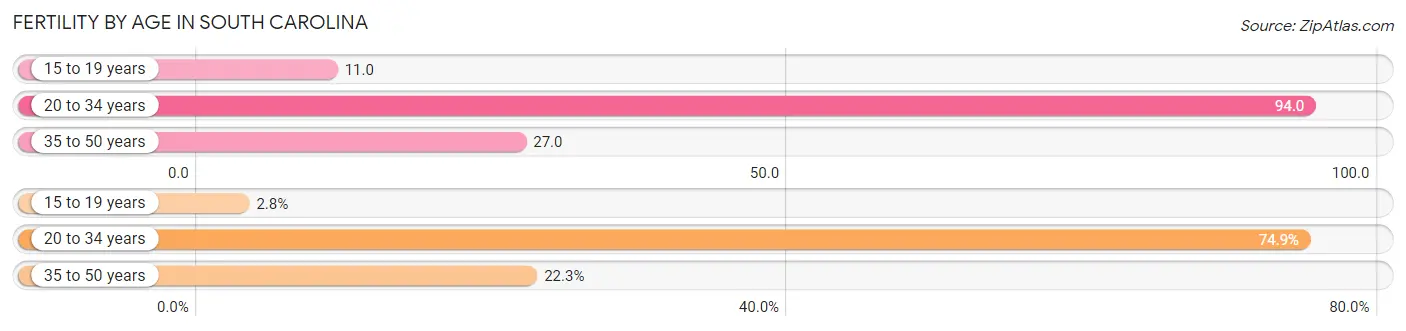
| Age Bracket | Women with Births | Births / 1,000 Women |
| 15 to 19 years | 1,765 (2.8%) | 11.0 |
| 20 to 34 years | 47,027 (74.9%) | 94.0 |
| 35 to 50 years | 14,038 (22.3%) | 27.0 |
| Total | 62,830 (100.0%) | 53.0 |
Fertility by Age by Marriage Status in South Carolina
59.0% of women with births (62,830) in South Carolina are married. The highest percentage of unmarried women with births falls into 15 to 19 years age bracket with 88.8% of them unmarried at the time of birth, while the lowest percentage of unmarried women with births belong to 35 to 50 years age bracket with 25.7% of them unmarried.
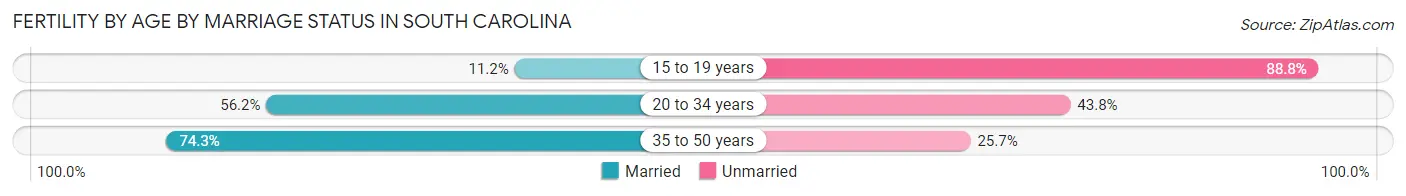
| Age Bracket | Married | Unmarried |
| 15 to 19 years | 198 (11.2%) | 1,567 (88.8%) |
| 20 to 34 years | 26,429 (56.2%) | 20,598 (43.8%) |
| 35 to 50 years | 10,430 (74.3%) | 3,608 (25.7%) |
| Total | 37,070 (59.0%) | 25,760 (41.0%) |
Fertility by Education in South Carolina
Average fertility rate in South Carolina is 53.0 births per 1,000 women. Women with the education attainment of bachelor's degree have the highest fertility rate of 61.0 births per 1,000 women, while women with the education attainment of less than high school have the lowest fertility at 37.0 births per 1,000 women. Women with the education attainment of college or associate's degree represent 33.8% of all women with births.
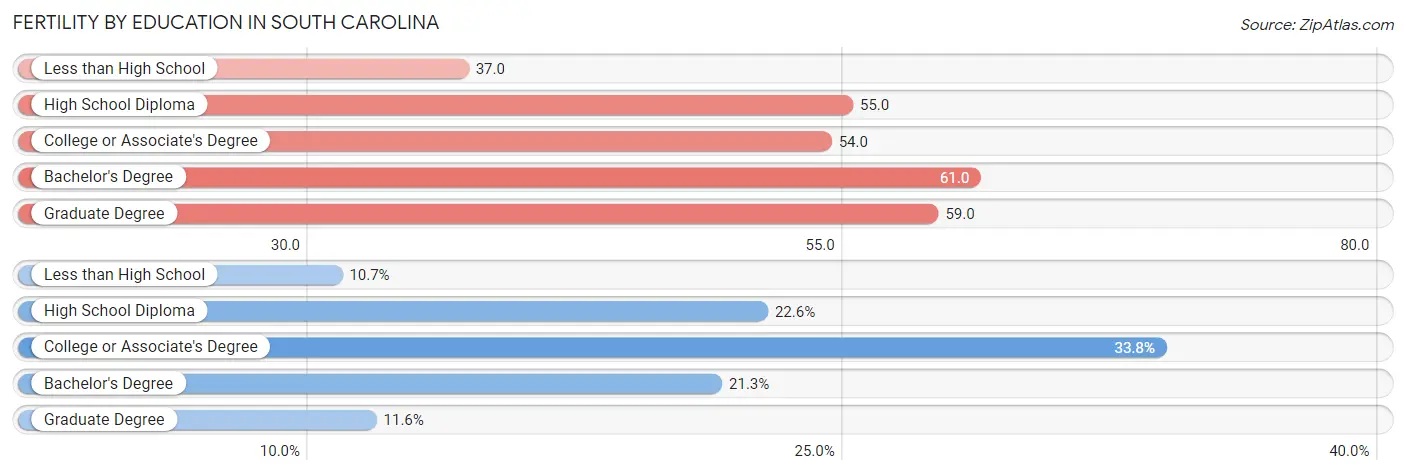
| Educational Attainment | Women with Births | Births / 1,000 Women |
| Less than High School | 6,693 (10.6%) | 37.0 |
| High School Diploma | 14,208 (22.6%) | 55.0 |
| College or Associate's Degree | 21,240 (33.8%) | 54.0 |
| Bachelor's Degree | 13,396 (21.3%) | 61.0 |
| Graduate Degree | 7,293 (11.6%) | 59.0 |
| Total | 62,830 (100.0%) | 53.0 |
Fertility by Education by Marriage Status in South Carolina
41.0% of women with births in South Carolina are unmarried. Women with the educational attainment of graduate degree are most likely to be married with 87.7% of them married at childbirth, while women with the educational attainment of less than high school are least likely to be married with 70.9% of them unmarried at childbirth.
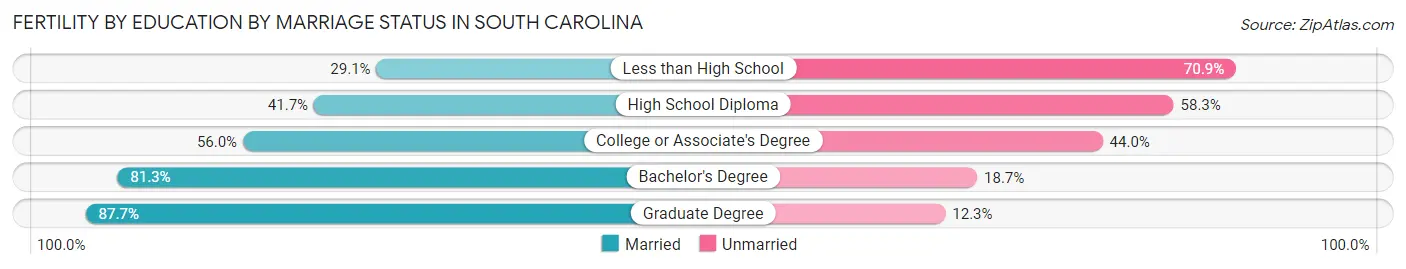
| Educational Attainment | Married | Unmarried |
| Less than High School | 1,948 (29.1%) | 4,745 (70.9%) |
| High School Diploma | 5,925 (41.7%) | 8,283 (58.3%) |
| College or Associate's Degree | 11,894 (56.0%) | 9,346 (44.0%) |
| Bachelor's Degree | 10,891 (81.3%) | 2,505 (18.7%) |
| Graduate Degree | 6,396 (87.7%) | 897 (12.3%) |
| Total | 37,070 (59.0%) | 25,760 (41.0%) |
Employment Characteristics in South Carolina
Employment by Class of Employer in South Carolina
Among the 2,344,150 employed individuals in South Carolina, private company employees (1,580,394 | 67.4%), not-for-profit organizations (151,540 | 6.5%), and local government employees (148,978 | 6.4%) make up the most common classes of employment.
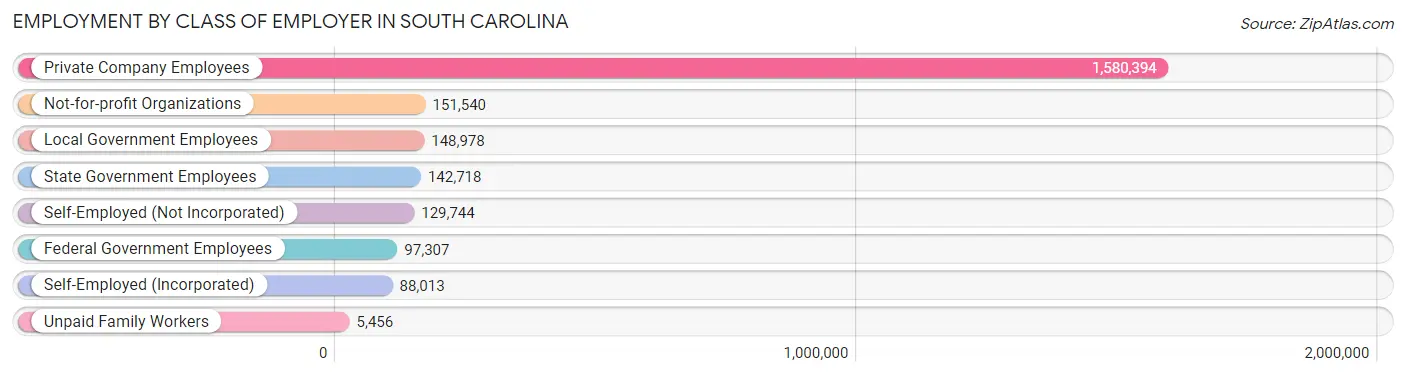
| Employer Class | # Employees | % Employees |
| Private Company Employees | 1,580,394 | 67.4% |
| Self-Employed (Incorporated) | 88,013 | 3.7% |
| Self-Employed (Not Incorporated) | 129,744 | 5.5% |
| Not-for-profit Organizations | 151,540 | 6.5% |
| Local Government Employees | 148,978 | 6.4% |
| State Government Employees | 142,718 | 6.1% |
| Federal Government Employees | 97,307 | 4.2% |
| Unpaid Family Workers | 5,456 | 0.2% |
| Total | 2,344,150 | 100.0% |
Employment Status by Age in South Carolina
According to the labor force statistics for South Carolina, out of the total population over 16 years of age (4,166,614), 60.4% or 2,516,635 individuals are in the labor force, with 5.2% or 130,865 of them unemployed. The age group with the highest labor force participation rate is 25 to 29 years, with 83.4% or 276,901 individuals in the labor force. Within the labor force, the 16 to 19 years age range has the highest percentage of unemployed individuals, with 14.6% or 16,428 of them being unemployed.
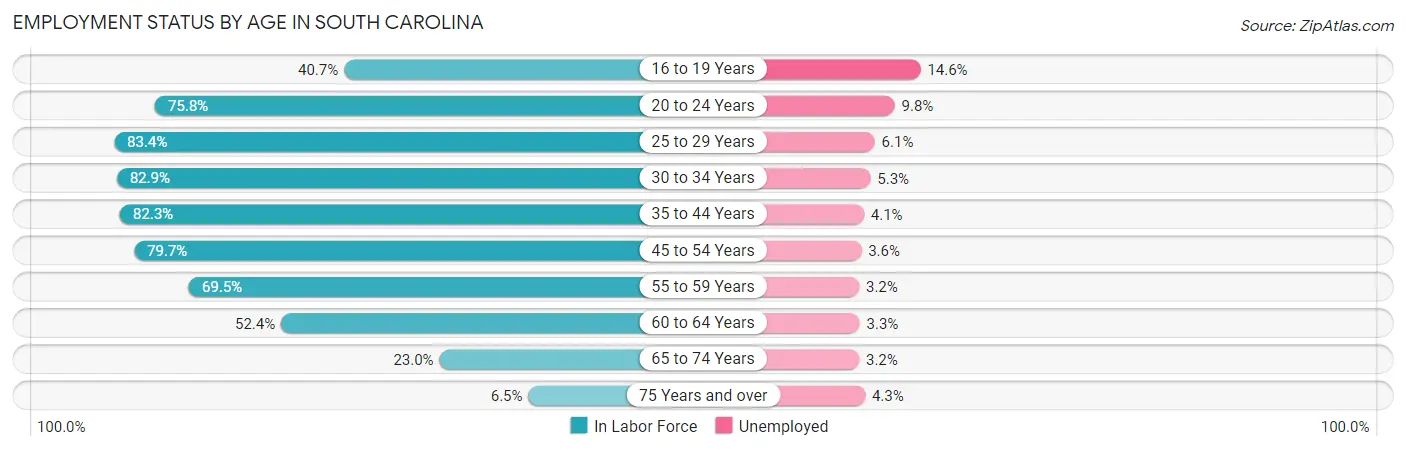
| Age Bracket | In Labor Force | Unemployed |
| 16 to 19 Years | 112,518 (40.7%) | 16,428 (14.6%) |
| 20 to 24 Years | 255,322 (75.8%) | 25,022 (9.8%) |
| 25 to 29 Years | 276,901 (83.4%) | 16,891 (6.1%) |
| 30 to 34 Years | 275,265 (82.9%) | 14,589 (5.3%) |
| 35 to 44 Years | 520,096 (82.3%) | 21,324 (4.1%) |
| 45 to 54 Years | 504,517 (79.7%) | 18,163 (3.6%) |
| 55 to 59 Years | 234,936 (69.5%) | 7,518 (3.2%) |
| 60 to 64 Years | 182,213 (52.4%) | 6,013 (3.3%) |
| 65 to 74 Years | 131,996 (23.0%) | 4,224 (3.2%) |
| 75 Years and over | 23,700 (6.5%) | 1,019 (4.3%) |
| Total | 2,516,635 (60.4%) | 130,865 (5.2%) |
Employment Status by Educational Attainment in South Carolina
According to labor force statistics for South Carolina, 76.3% of individuals (1,995,095) out of the total population between 25 and 64 years of age (2,614,804) are in the labor force, with 4.2% or 83,794 of them being unemployed. The group with the highest labor force participation rate are those with the educational attainment of bachelor's degree or higher, with 85.5% or 702,447 individuals in the labor force. Within the labor force, individuals with less than high school education have the highest percentage of unemployment, with 8.6% or 12,095 of them being unemployed.
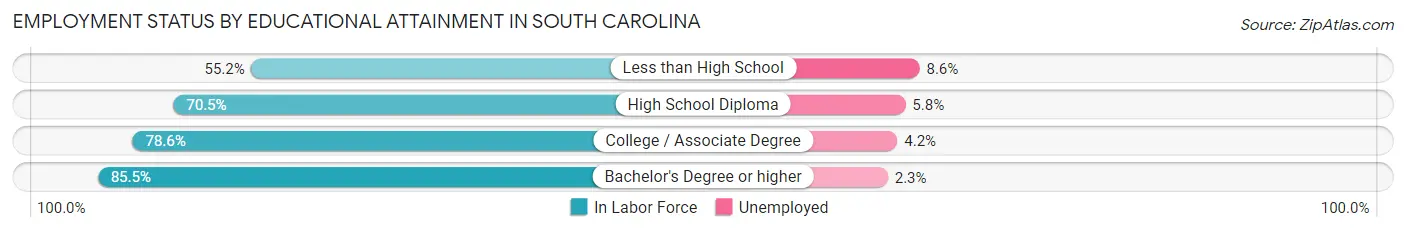
| Educational Attainment | In Labor Force | Unemployed |
| Less than High School | 140,641 (55.2%) | 21,912 (8.6%) |
| High School Diploma | 510,421 (70.5%) | 41,992 (5.8%) |
| College / Associate Degree | 640,152 (78.6%) | 34,207 (4.2%) |
| Bachelor's Degree or higher | 702,447 (85.5%) | 18,896 (2.3%) |
| Total | 1,995,095 (76.3%) | 109,822 (4.2%) |
Employment Occupations by Sex in South Carolina
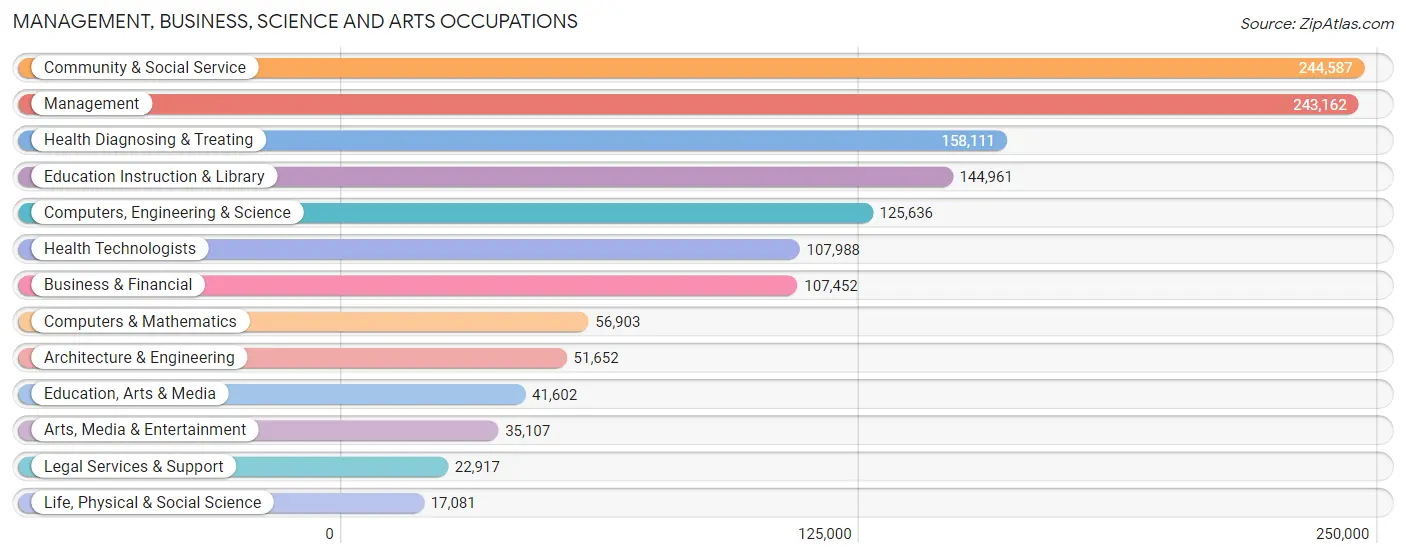
Management, Business, Science and Arts Occupations
The most common Management, Business, Science and Arts occupations in South Carolina are Community & Social Service (244,587 | 10.4%), Management (243,162 | 10.3%), Health Diagnosing & Treating (158,111 | 6.7%), Education Instruction & Library (144,961 | 6.2%), and Computers, Engineering & Science (125,636 | 5.3%).
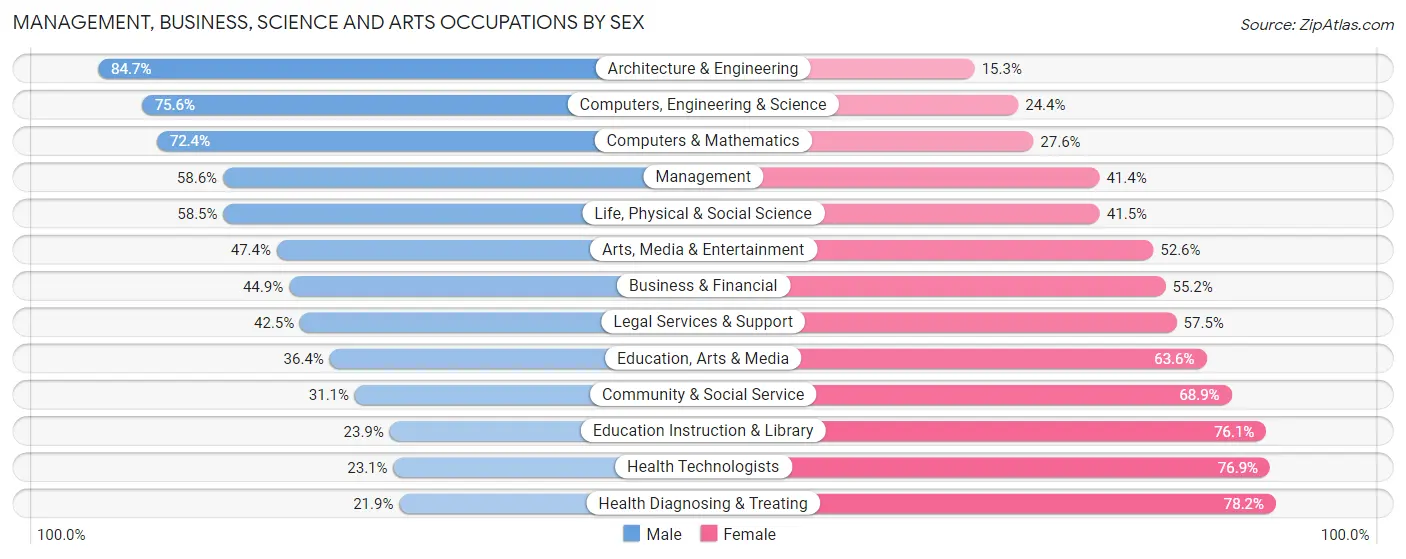
Management, Business, Science and Arts Occupations by Sex
Within the Management, Business, Science and Arts occupations in South Carolina, the most male-oriented occupations are Architecture & Engineering (84.7%), Computers, Engineering & Science (75.6%), and Computers & Mathematics (72.4%), while the most female-oriented occupations are Health Diagnosing & Treating (78.1%), Health Technologists (76.9%), and Education Instruction & Library (76.1%).
| Occupation | Male | Female |
| Management | 142,559 (58.6%) | 100,603 (41.4%) |
| Business & Financial | 48,187 (44.9%) | 59,265 (55.1%) |
| Computers, Engineering & Science | 94,939 (75.6%) | 30,697 (24.4%) |
| Computers & Mathematics | 41,209 (72.4%) | 15,694 (27.6%) |
| Architecture & Engineering | 43,731 (84.7%) | 7,921 (15.3%) |
| Life, Physical & Social Science | 9,999 (58.5%) | 7,082 (41.5%) |
| Community & Social Service | 76,099 (31.1%) | 168,488 (68.9%) |
| Education, Arts & Media | 15,128 (36.4%) | 26,474 (63.6%) |
| Legal Services & Support | 9,746 (42.5%) | 13,171 (57.5%) |
| Education Instruction & Library | 34,588 (23.9%) | 110,373 (76.1%) |
| Arts, Media & Entertainment | 16,637 (47.4%) | 18,470 (52.6%) |
| Health Diagnosing & Treating | 34,555 (21.8%) | 123,556 (78.1%) |
| Health Technologists | 24,922 (23.1%) | 83,066 (76.9%) |
| Total (Category) | 396,339 (45.1%) | 482,609 (54.9%) |
| Total (Overall) | 1,217,160 (51.8%) | 1,134,589 (48.2%) |
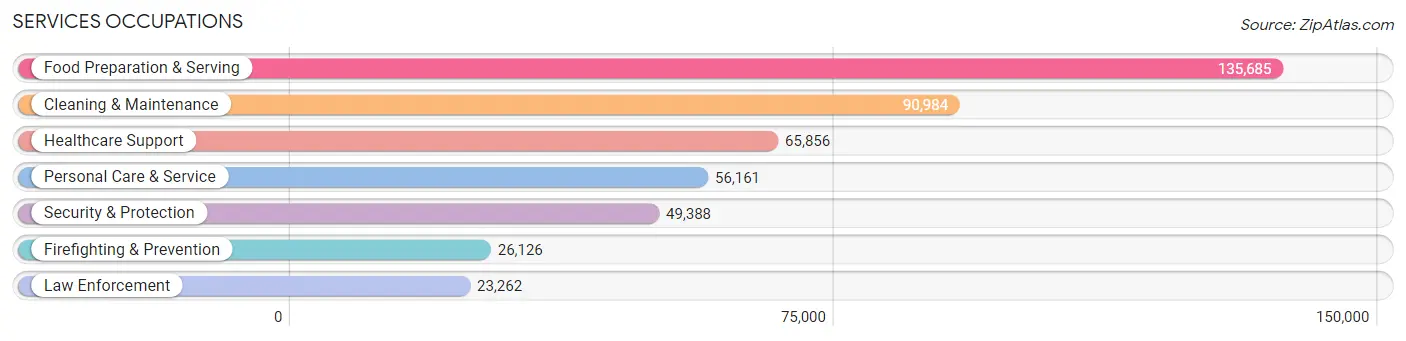
Services Occupations
The most common Services occupations in South Carolina are Food Preparation & Serving (135,685 | 5.8%), Cleaning & Maintenance (90,984 | 3.9%), Healthcare Support (65,856 | 2.8%), Personal Care & Service (56,161 | 2.4%), and Security & Protection (49,388 | 2.1%).
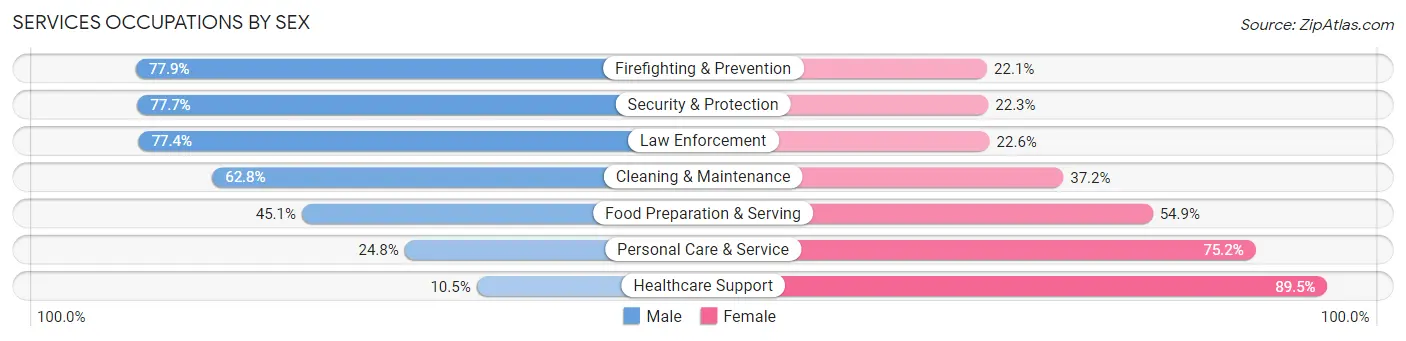
Services Occupations by Sex
Within the Services occupations in South Carolina, the most male-oriented occupations are Firefighting & Prevention (77.9%), Security & Protection (77.7%), and Law Enforcement (77.4%), while the most female-oriented occupations are Healthcare Support (89.5%), Personal Care & Service (75.2%), and Food Preparation & Serving (54.9%).
| Occupation | Male | Female |
| Healthcare Support | 6,931 (10.5%) | 58,925 (89.5%) |
| Security & Protection | 38,356 (77.7%) | 11,032 (22.3%) |
| Firefighting & Prevention | 20,351 (77.9%) | 5,775 (22.1%) |
| Law Enforcement | 18,005 (77.4%) | 5,257 (22.6%) |
| Food Preparation & Serving | 61,207 (45.1%) | 74,478 (54.9%) |
| Cleaning & Maintenance | 57,160 (62.8%) | 33,824 (37.2%) |
| Personal Care & Service | 13,904 (24.8%) | 42,257 (75.2%) |
| Total (Category) | 177,558 (44.6%) | 220,516 (55.4%) |
| Total (Overall) | 1,217,160 (51.8%) | 1,134,589 (48.2%) |
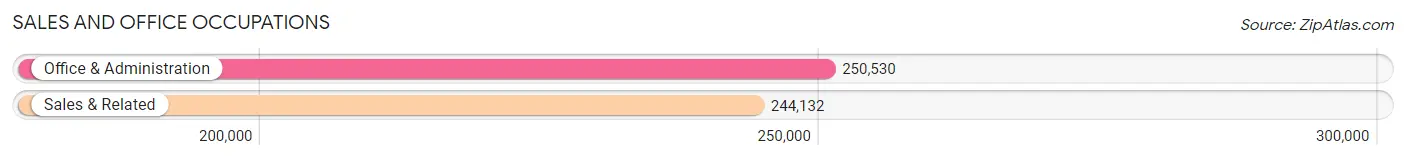
Sales and Office Occupations
The most common Sales and Office occupations in South Carolina are Office & Administration (250,530 | 10.6%), and Sales & Related (244,132 | 10.4%).
Sales and Office Occupations by Sex
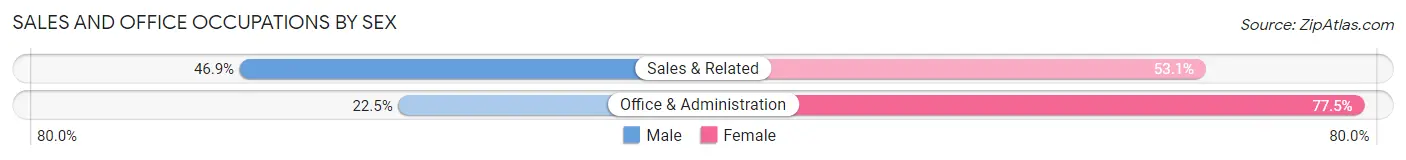
| Occupation | Male | Female |
| Sales & Related | 114,435 (46.9%) | 129,697 (53.1%) |
| Office & Administration | 56,324 (22.5%) | 194,206 (77.5%) |
| Total (Category) | 170,759 (34.5%) | 323,903 (65.5%) |
| Total (Overall) | 1,217,160 (51.8%) | 1,134,589 (48.2%) |
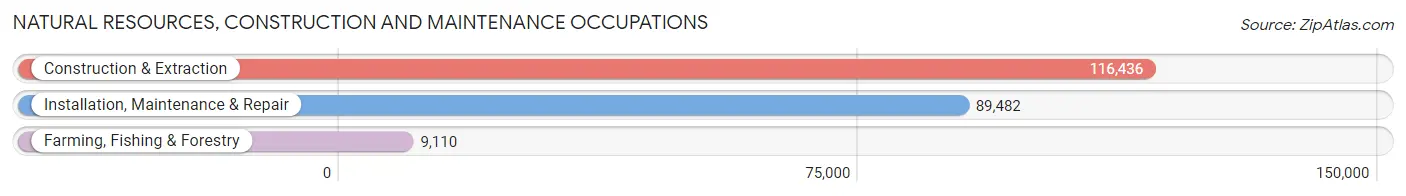
Natural Resources, Construction and Maintenance Occupations
The most common Natural Resources, Construction and Maintenance occupations in South Carolina are Construction & Extraction (116,436 | 5.0%), Installation, Maintenance & Repair (89,482 | 3.8%), and Farming, Fishing & Forestry (9,110 | 0.4%).
Natural Resources, Construction and Maintenance Occupations by Sex
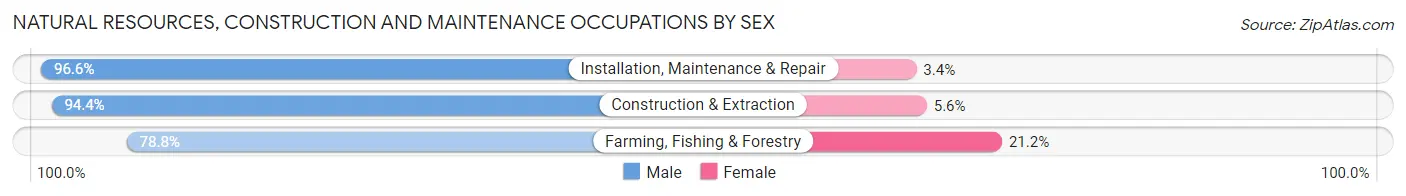
| Occupation | Male | Female |
| Farming, Fishing & Forestry | 7,175 (78.8%) | 1,935 (21.2%) |
| Construction & Extraction | 109,928 (94.4%) | 6,508 (5.6%) |
| Installation, Maintenance & Repair | 86,415 (96.6%) | 3,067 (3.4%) |
| Total (Category) | 203,518 (94.7%) | 11,510 (5.3%) |
| Total (Overall) | 1,217,160 (51.8%) | 1,134,589 (48.2%) |
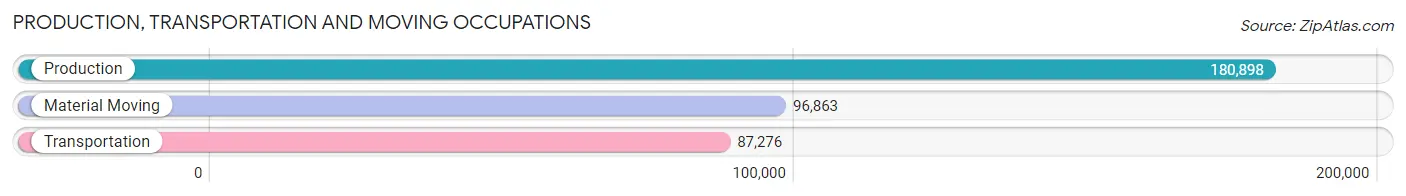
Production, Transportation and Moving Occupations
The most common Production, Transportation and Moving occupations in South Carolina are Production (180,898 | 7.7%), Material Moving (96,863 | 4.1%), and Transportation (87,276 | 3.7%).
Production, Transportation and Moving Occupations by Sex
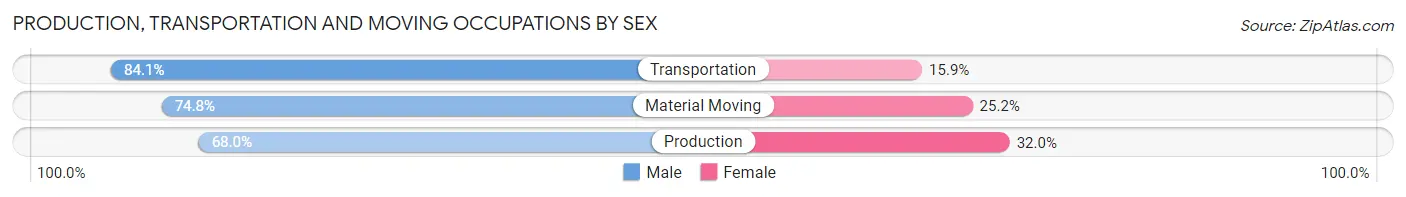
| Occupation | Male | Female |
| Production | 123,080 (68.0%) | 57,818 (32.0%) |
| Transportation | 73,410 (84.1%) | 13,866 (15.9%) |
| Material Moving | 72,496 (74.8%) | 24,367 (25.2%) |
| Total (Category) | 268,986 (73.7%) | 96,051 (26.3%) |
| Total (Overall) | 1,217,160 (51.8%) | 1,134,589 (48.2%) |
Employment Industries by Sex in South Carolina
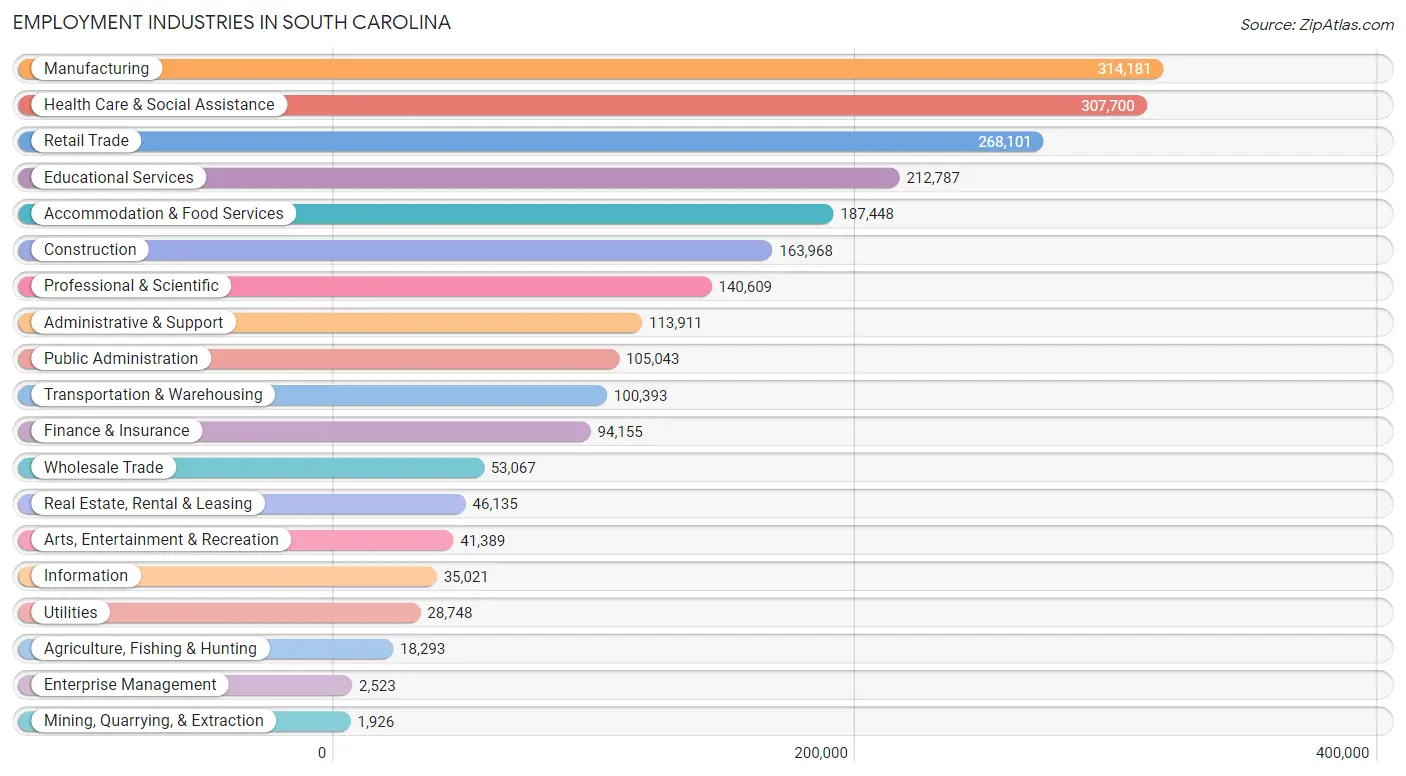
Employment Industries in South Carolina
The major employment industries in South Carolina include Manufacturing (314,181 | 13.4%), Health Care & Social Assistance (307,700 | 13.1%), Retail Trade (268,101 | 11.4%), Educational Services (212,787 | 9.0%), and Accommodation & Food Services (187,448 | 8.0%).
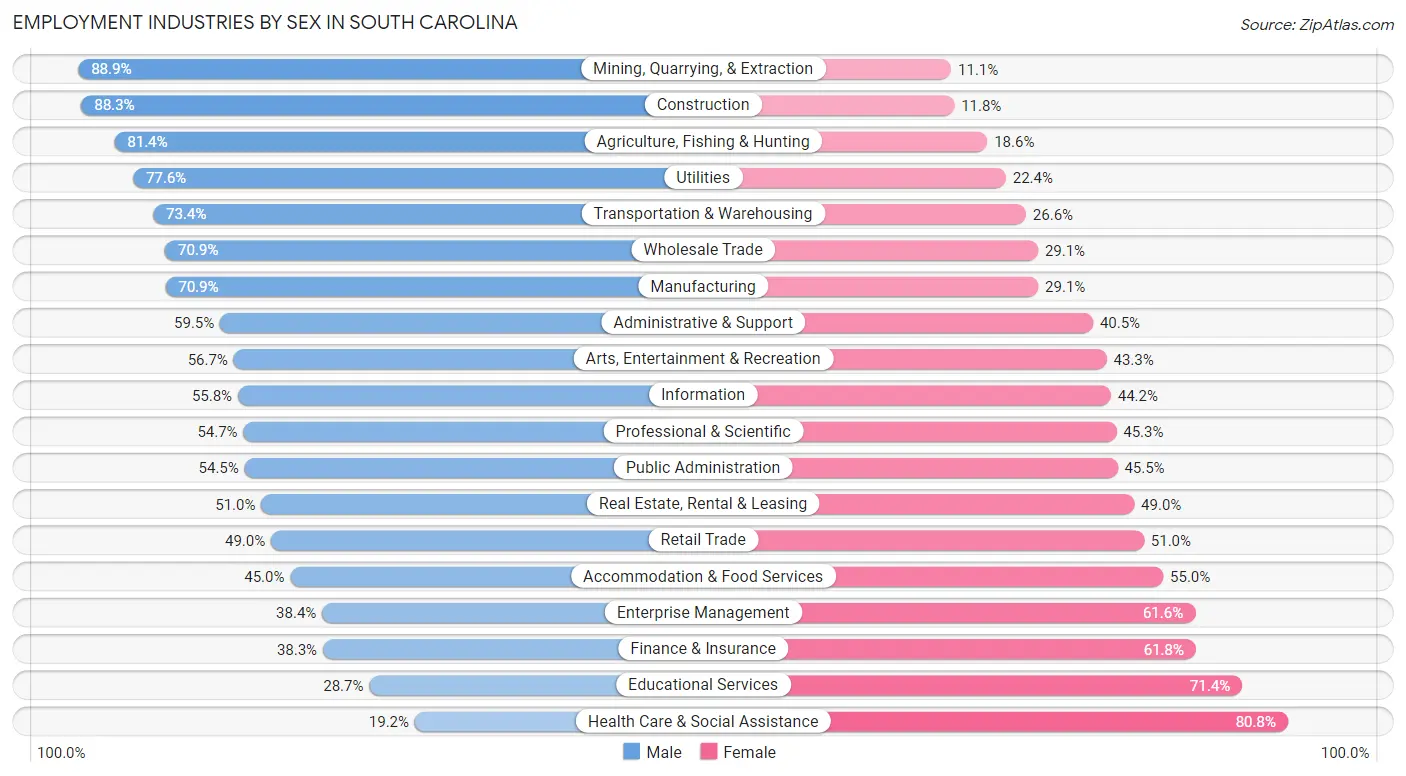
Employment Industries by Sex in South Carolina
The South Carolina industries that see more men than women are Mining, Quarrying, & Extraction (88.9%), Construction (88.2%), and Agriculture, Fishing & Hunting (81.4%), whereas the industries that tend to have a higher number of women are Health Care & Social Assistance (80.8%), Educational Services (71.4%), and Finance & Insurance (61.8%).
| Industry | Male | Female |
| Agriculture, Fishing & Hunting | 14,893 (81.4%) | 3,400 (18.6%) |
| Mining, Quarrying, & Extraction | 1,712 (88.9%) | 214 (11.1%) |
| Construction | 144,696 (88.2%) | 19,272 (11.7%) |
| Manufacturing | 222,667 (70.9%) | 91,514 (29.1%) |
| Wholesale Trade | 37,631 (70.9%) | 15,436 (29.1%) |
| Retail Trade | 131,330 (49.0%) | 136,771 (51.0%) |
| Transportation & Warehousing | 73,687 (73.4%) | 26,706 (26.6%) |
| Utilities | 22,299 (77.6%) | 6,449 (22.4%) |
| Information | 19,557 (55.8%) | 15,464 (44.2%) |
| Finance & Insurance | 36,017 (38.3%) | 58,138 (61.8%) |
| Real Estate, Rental & Leasing | 23,529 (51.0%) | 22,606 (49.0%) |
| Professional & Scientific | 76,907 (54.7%) | 63,702 (45.3%) |
| Enterprise Management | 969 (38.4%) | 1,554 (61.6%) |
| Administrative & Support | 67,813 (59.5%) | 46,098 (40.5%) |
| Educational Services | 60,962 (28.6%) | 151,825 (71.4%) |
| Health Care & Social Assistance | 59,134 (19.2%) | 248,566 (80.8%) |
| Arts, Entertainment & Recreation | 23,475 (56.7%) | 17,914 (43.3%) |
| Accommodation & Food Services | 84,378 (45.0%) | 103,070 (55.0%) |
| Public Administration | 57,204 (54.5%) | 47,839 (45.5%) |
| Total | 1,217,160 (51.8%) | 1,134,589 (48.2%) |
Education in South Carolina
School Enrollment in South Carolina
The most common levels of schooling among the 1,183,574 students in South Carolina are high school (258,017 | 21.8%), middle school (252,784 | 21.4%), and elementary school (244,538 | 20.7%).
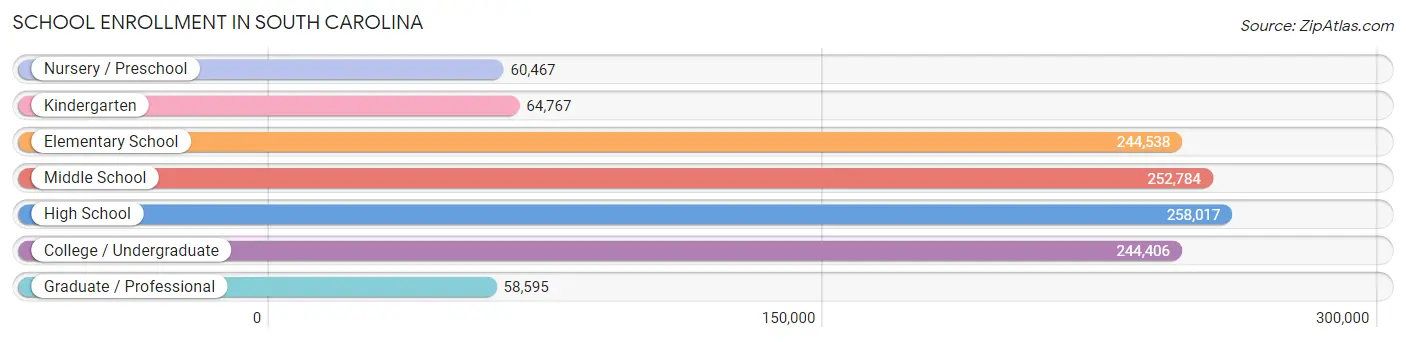
| School Level | # Students | % Students |
| Nursery / Preschool | 60,467 | 5.1% |
| Kindergarten | 64,767 | 5.5% |
| Elementary School | 244,538 | 20.7% |
| Middle School | 252,784 | 21.4% |
| High School | 258,017 | 21.8% |
| College / Undergraduate | 244,406 | 20.6% |
| Graduate / Professional | 58,595 | 5.0% |
| Total | 1,183,574 | 100.0% |
School Enrollment by Age by Funding Source in South Carolina
Out of a total of 1,183,574 students who are enrolled in schools in South Carolina, 189,372 (16.0%) attend a private institution, while the remaining 994,202 (84.0%) are enrolled in public schools. The age group of 3 to 4 year olds has the highest likelihood of being enrolled in private schools, with 22,044 (43.1% in the age bracket) enrolled. Conversely, the age group of 15 to 17 year olds has the lowest likelihood of being enrolled in a private school, with 165,151 (89.2% in the age bracket) attending a public institution.
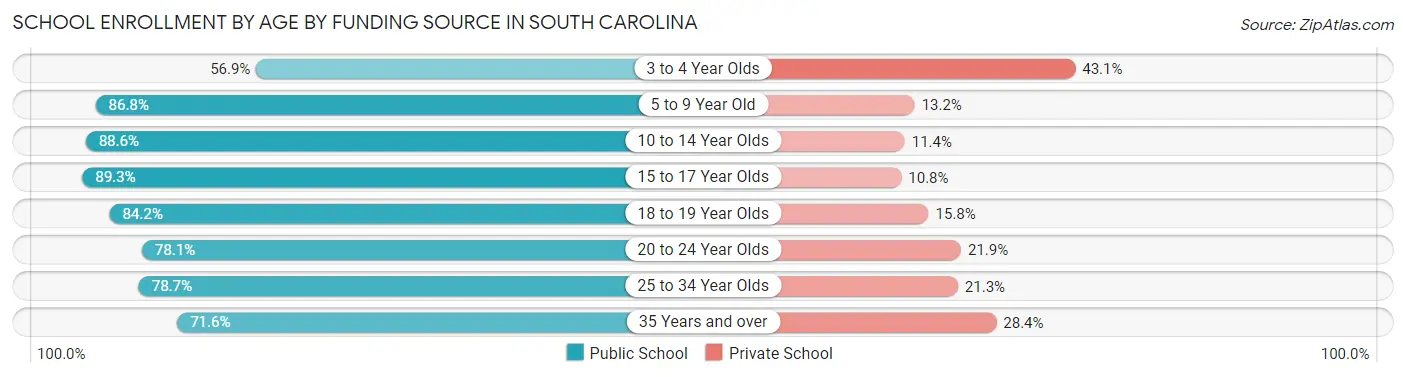
| Age Bracket | Public School | Private School |
| 3 to 4 Year Olds | 29,054 (56.9%) | 22,044 (43.1%) |
| 5 to 9 Year Old | 248,203 (86.8%) | 37,833 (13.2%) |
| 10 to 14 Year Olds | 278,830 (88.6%) | 35,843 (11.4%) |
| 15 to 17 Year Olds | 165,151 (89.2%) | 19,898 (10.7%) |
| 18 to 19 Year Olds | 86,924 (84.2%) | 16,334 (15.8%) |
| 20 to 24 Year Olds | 94,386 (78.1%) | 26,404 (21.9%) |
| 25 to 34 Year Olds | 48,708 (78.7%) | 13,164 (21.3%) |
| 35 Years and over | 43,508 (71.6%) | 17,290 (28.4%) |
| Total | 994,202 (84.0%) | 189,372 (16.0%) |
Educational Attainment by Field of Study in South Carolina
Business (256,245 | 22.0%), education (159,326 | 13.7%), science & technology (118,963 | 10.2%), engineering (81,649 | 7.0%), and social sciences (78,619 | 6.8%) are the most common fields of study among 1,164,521 individuals in South Carolina who have obtained a bachelor's degree or higher.
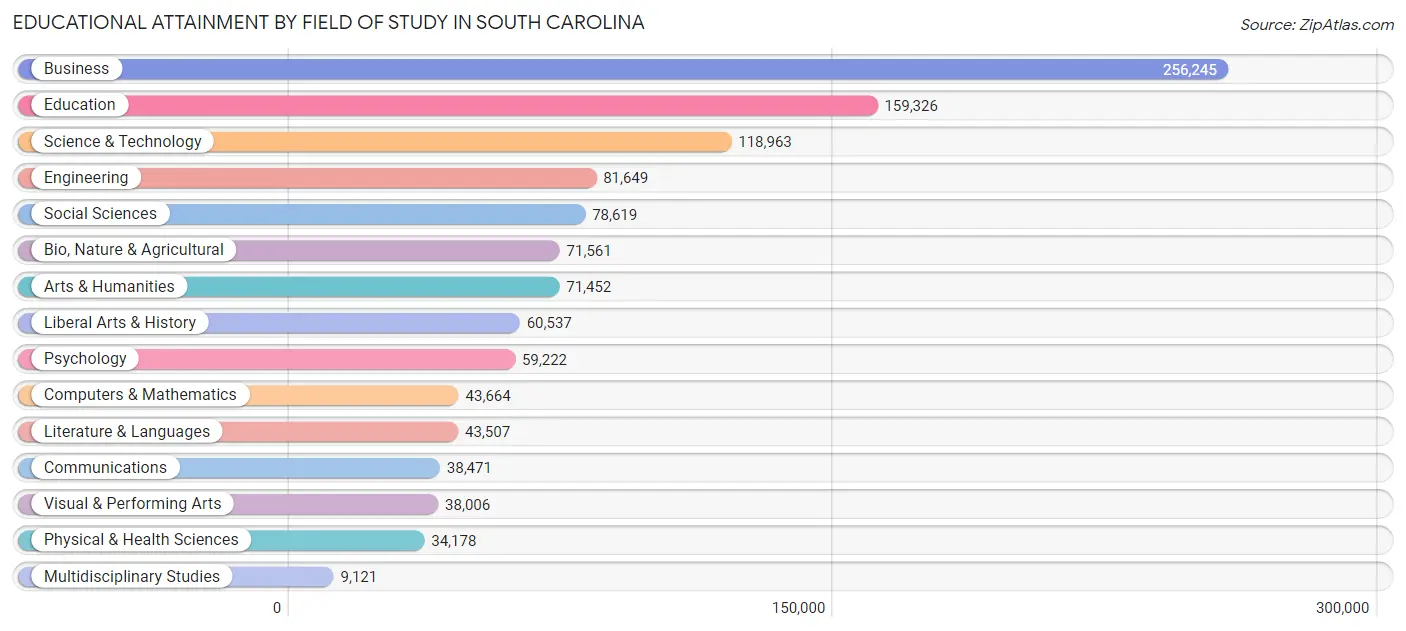
| Field of Study | # Graduates | % Graduates |
| Computers & Mathematics | 43,664 | 3.7% |
| Bio, Nature & Agricultural | 71,561 | 6.1% |
| Physical & Health Sciences | 34,178 | 2.9% |
| Psychology | 59,222 | 5.1% |
| Social Sciences | 78,619 | 6.8% |
| Engineering | 81,649 | 7.0% |
| Multidisciplinary Studies | 9,121 | 0.8% |
| Science & Technology | 118,963 | 10.2% |
| Business | 256,245 | 22.0% |
| Education | 159,326 | 13.7% |
| Literature & Languages | 43,507 | 3.7% |
| Liberal Arts & History | 60,537 | 5.2% |
| Visual & Performing Arts | 38,006 | 3.3% |
| Communications | 38,471 | 3.3% |
| Arts & Humanities | 71,452 | 6.1% |
| Total | 1,164,521 | 100.0% |
Transportation & Commute in South Carolina
Vehicle Availability by Sex in South Carolina
The most prevalent vehicle ownership categories in South Carolina are males with 2 vehicles (518,566, accounting for 43.0%) and females with 2 vehicles (444,070, making up 47.1%).
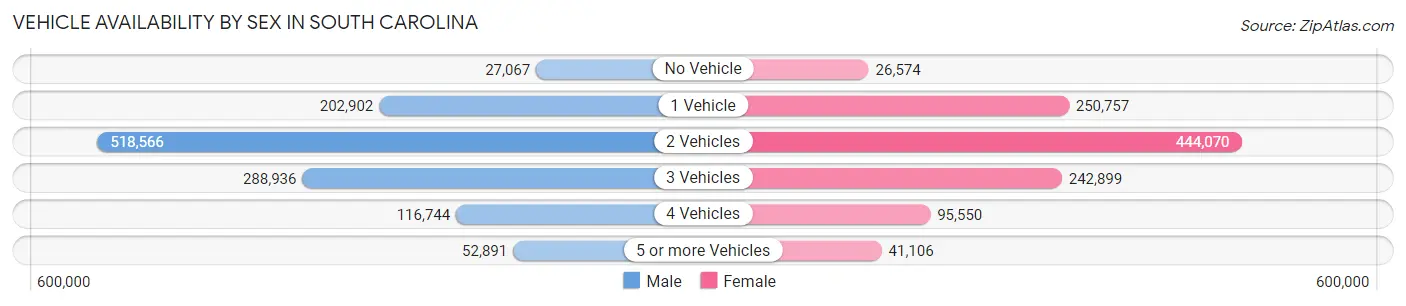
| Vehicles Available | Male | Female |
| No Vehicle | 27,067 (2.2%) | 26,574 (2.4%) |
| 1 Vehicle | 202,902 (16.8%) | 250,757 (22.8%) |
| 2 Vehicles | 518,566 (43.0%) | 444,070 (40.3%) |
| 3 Vehicles | 288,936 (23.9%) | 242,899 (22.1%) |
| 4 Vehicles | 116,744 (9.7%) | 95,550 (8.7%) |
| 5 or more Vehicles | 52,891 (4.4%) | 41,106 (3.7%) |
| Total | 1,207,106 (100.0%) | 1,100,956 (100.0%) |
Commute Time in South Carolina
The most frequently occuring commute durations in South Carolina are 15 to 19 minutes (354,698 commuters, 16.5%), 20 to 24 minutes (335,788 commuters, 15.7%), and 30 to 34 minutes (313,117 commuters, 14.6%).
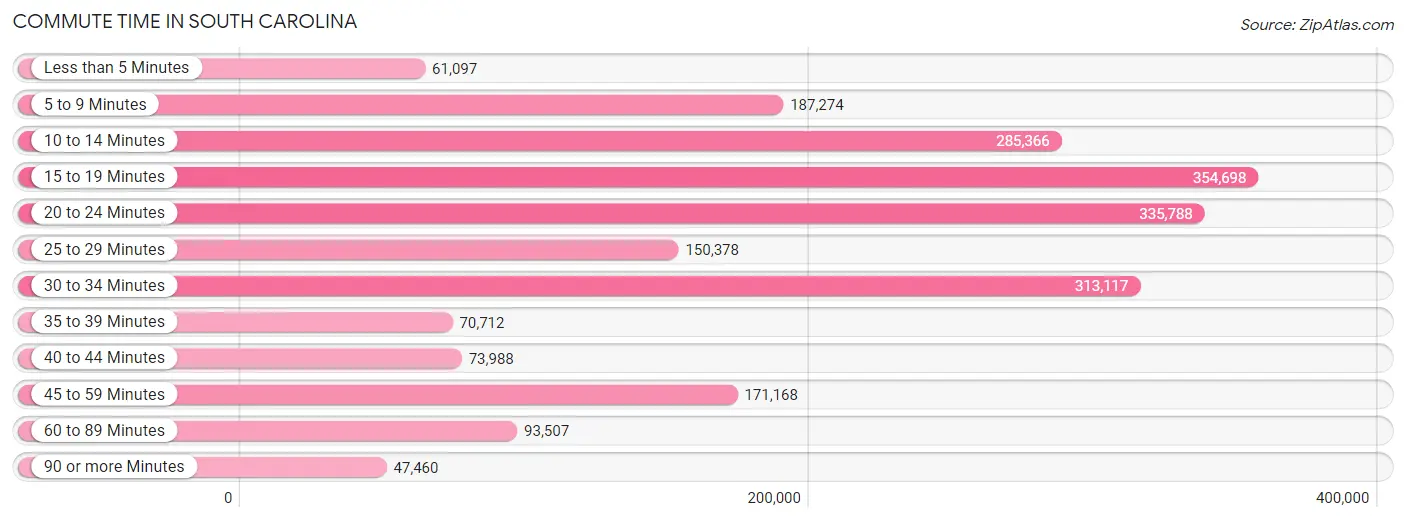
| Commute Time | # Commuters | % Commuters |
| Less than 5 Minutes | 61,097 | 2.9% |
| 5 to 9 Minutes | 187,274 | 8.7% |
| 10 to 14 Minutes | 285,366 | 13.3% |
| 15 to 19 Minutes | 354,698 | 16.5% |
| 20 to 24 Minutes | 335,788 | 15.7% |
| 25 to 29 Minutes | 150,378 | 7.0% |
| 30 to 34 Minutes | 313,117 | 14.6% |
| 35 to 39 Minutes | 70,712 | 3.3% |
| 40 to 44 Minutes | 73,988 | 3.5% |
| 45 to 59 Minutes | 171,168 | 8.0% |
| 60 to 89 Minutes | 93,507 | 4.4% |
| 90 or more Minutes | 47,460 | 2.2% |
Commute Time by Sex in South Carolina
The most common commute times in South Carolina are 15 to 19 minutes (180,393 commuters, 15.9%) for males and 15 to 19 minutes (174,305 commuters, 17.2%) for females.
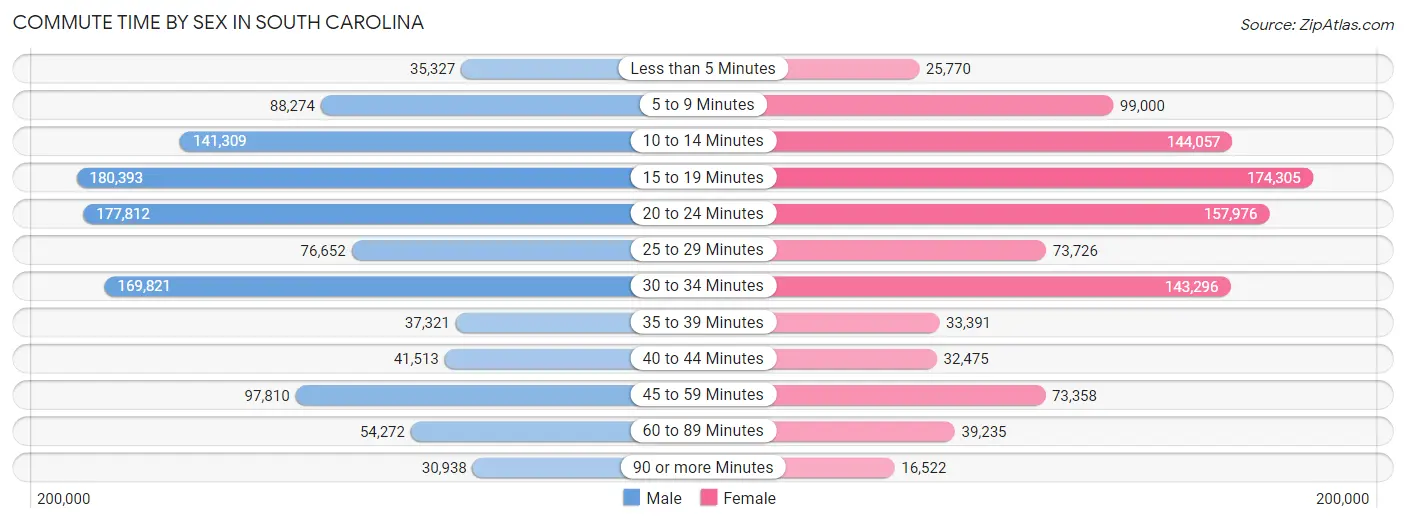
| Commute Time | Male | Female |
| Less than 5 Minutes | 35,327 (3.1%) | 25,770 (2.5%) |
| 5 to 9 Minutes | 88,274 (7.8%) | 99,000 (9.8%) |
| 10 to 14 Minutes | 141,309 (12.5%) | 144,057 (14.2%) |
| 15 to 19 Minutes | 180,393 (15.9%) | 174,305 (17.2%) |
| 20 to 24 Minutes | 177,812 (15.7%) | 157,976 (15.6%) |
| 25 to 29 Minutes | 76,652 (6.8%) | 73,726 (7.3%) |
| 30 to 34 Minutes | 169,821 (15.0%) | 143,296 (14.1%) |
| 35 to 39 Minutes | 37,321 (3.3%) | 33,391 (3.3%) |
| 40 to 44 Minutes | 41,513 (3.7%) | 32,475 (3.2%) |
| 45 to 59 Minutes | 97,810 (8.6%) | 73,358 (7.2%) |
| 60 to 89 Minutes | 54,272 (4.8%) | 39,235 (3.9%) |
| 90 or more Minutes | 30,938 (2.7%) | 16,522 (1.6%) |
Time of Departure to Work by Sex in South Carolina
The most frequent times of departure to work in South Carolina are 7:00 AM to 7:29 AM (168,744, 14.9%) for males and 7:00 AM to 7:29 AM (165,771, 16.4%) for females.
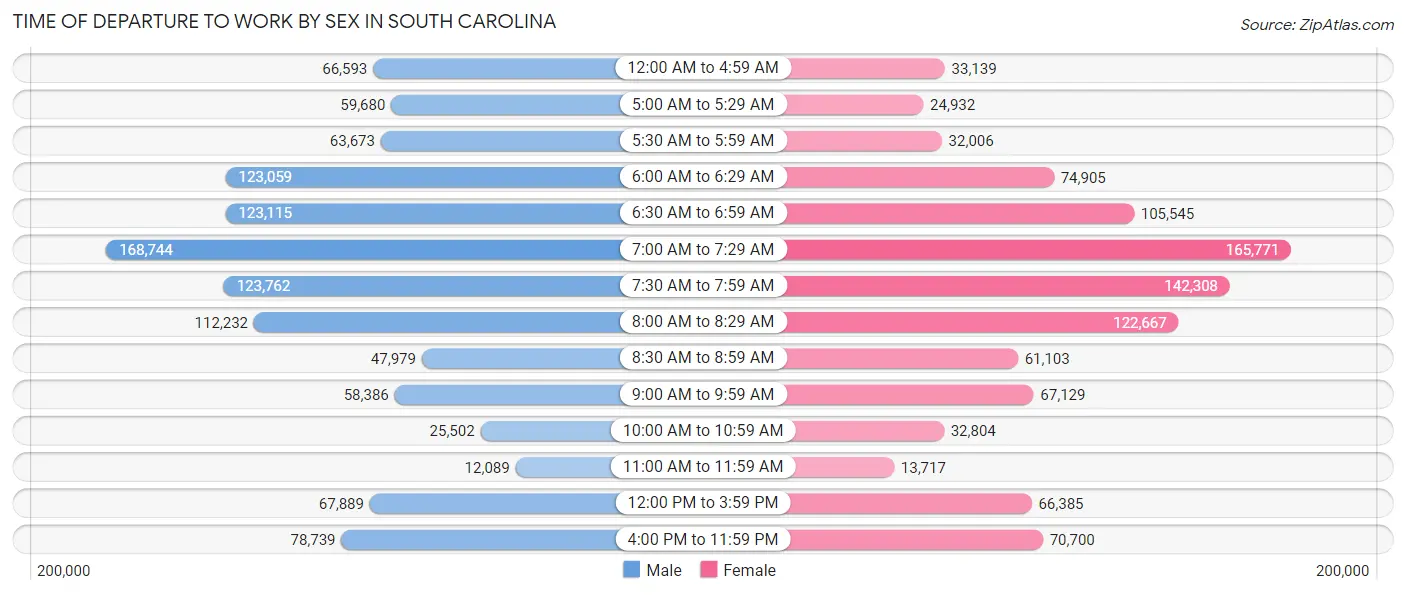
| Time of Departure | Male | Female |
| 12:00 AM to 4:59 AM | 66,593 (5.9%) | 33,139 (3.3%) |
| 5:00 AM to 5:29 AM | 59,680 (5.3%) | 24,932 (2.5%) |
| 5:30 AM to 5:59 AM | 63,673 (5.6%) | 32,006 (3.2%) |
| 6:00 AM to 6:29 AM | 123,059 (10.9%) | 74,905 (7.4%) |
| 6:30 AM to 6:59 AM | 123,115 (10.9%) | 105,545 (10.4%) |
| 7:00 AM to 7:29 AM | 168,744 (14.9%) | 165,771 (16.4%) |
| 7:30 AM to 7:59 AM | 123,762 (10.9%) | 142,308 (14.1%) |
| 8:00 AM to 8:29 AM | 112,232 (9.9%) | 122,667 (12.1%) |
| 8:30 AM to 8:59 AM | 47,979 (4.2%) | 61,103 (6.0%) |
| 9:00 AM to 9:59 AM | 58,386 (5.2%) | 67,129 (6.6%) |
| 10:00 AM to 10:59 AM | 25,502 (2.2%) | 32,804 (3.2%) |
| 11:00 AM to 11:59 AM | 12,089 (1.1%) | 13,717 (1.3%) |
| 12:00 PM to 3:59 PM | 67,889 (6.0%) | 66,385 (6.6%) |
| 4:00 PM to 11:59 PM | 78,739 (7.0%) | 70,700 (7.0%) |
| Total | 1,131,442 (100.0%) | 1,013,111 (100.0%) |
Housing Occupancy in South Carolina
Occupancy by Ownership in South Carolina
Of the total 2,023,085 dwellings in South Carolina, owner-occupied units account for 1,434,662 (70.9%), while renter-occupied units make up 588,423 (29.1%).
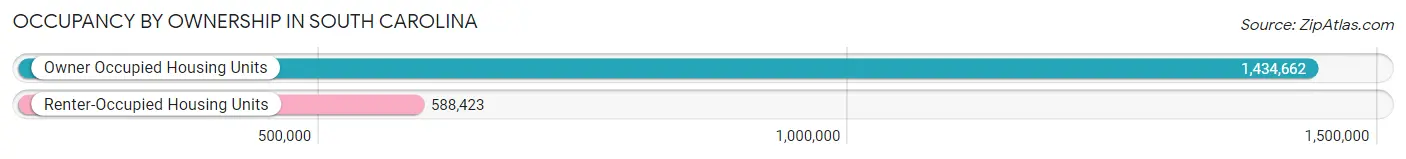
| Occupancy | # Housing Units | % Housing Units |
| Owner Occupied Housing Units | 1,434,662 | 70.9% |
| Renter-Occupied Housing Units | 588,423 | 29.1% |
| Total Occupied Housing Units | 2,023,085 | 100.0% |
Occupancy by Household Size in South Carolina
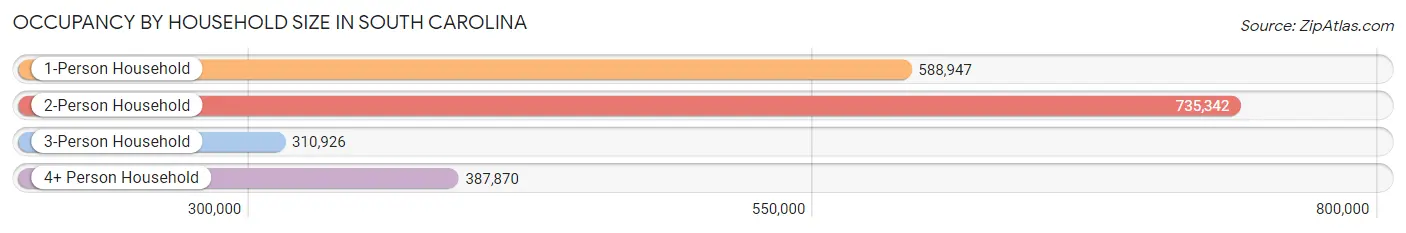
| Household Size | # Housing Units | % Housing Units |
| 1-Person Household | 588,947 | 29.1% |
| 2-Person Household | 735,342 | 36.3% |
| 3-Person Household | 310,926 | 15.4% |
| 4+ Person Household | 387,870 | 19.2% |
| Total Housing Units | 2,023,085 | 100.0% |
Occupancy by Ownership by Household Size in South Carolina
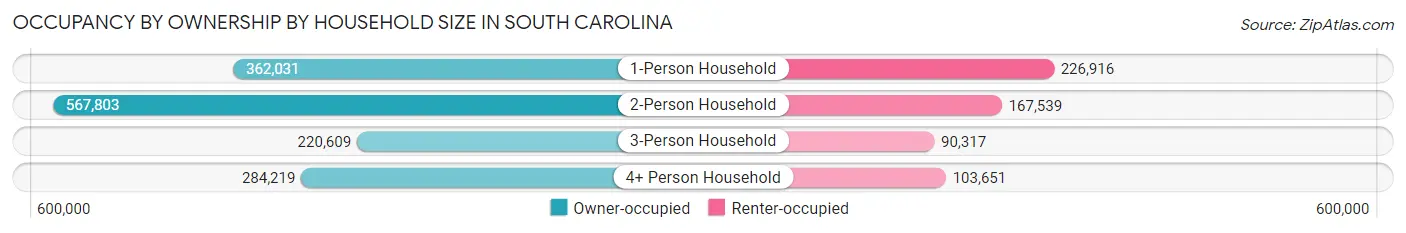
| Household Size | Owner-occupied | Renter-occupied |
| 1-Person Household | 362,031 (61.5%) | 226,916 (38.5%) |
| 2-Person Household | 567,803 (77.2%) | 167,539 (22.8%) |
| 3-Person Household | 220,609 (71.0%) | 90,317 (29.0%) |
| 4+ Person Household | 284,219 (73.3%) | 103,651 (26.7%) |
| Total Housing Units | 1,434,662 (70.9%) | 588,423 (29.1%) |
Occupancy by Educational Attainment in South Carolina
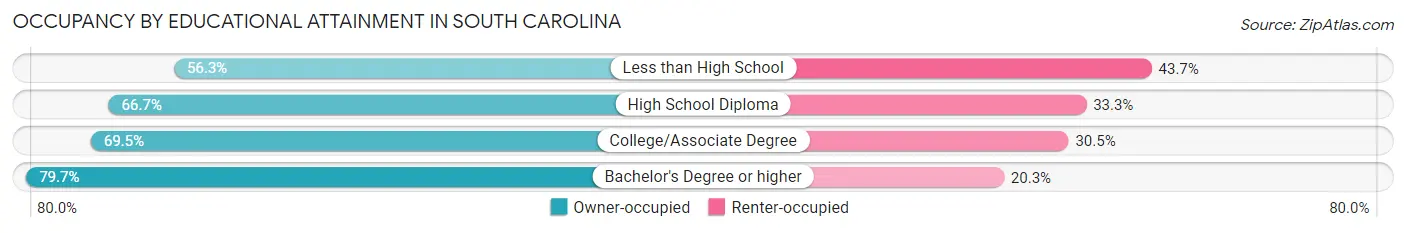
| Household Size | Owner-occupied | Renter-occupied |
| Less than High School | 105,770 (56.3%) | 82,066 (43.7%) |
| High School Diploma | 348,688 (66.7%) | 174,182 (33.3%) |
| College/Associate Degree | 450,071 (69.5%) | 197,474 (30.5%) |
| Bachelor's Degree or higher | 530,133 (79.7%) | 134,701 (20.3%) |
Occupancy by Age of Householder in South Carolina
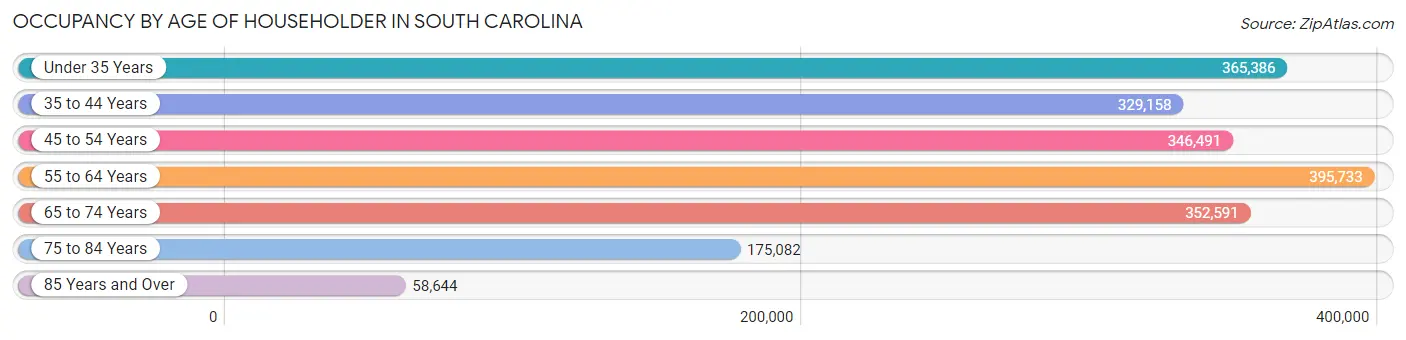
| Age Bracket | # Households | % Households |
| Under 35 Years | 365,386 | 18.1% |
| 35 to 44 Years | 329,158 | 16.3% |
| 45 to 54 Years | 346,491 | 17.1% |
| 55 to 64 Years | 395,733 | 19.6% |
| 65 to 74 Years | 352,591 | 17.4% |
| 75 to 84 Years | 175,082 | 8.6% |
| 85 Years and Over | 58,644 | 2.9% |
| Total | 2,023,085 | 100.0% |
Housing Finances in South Carolina
Median Income by Occupancy in South Carolina
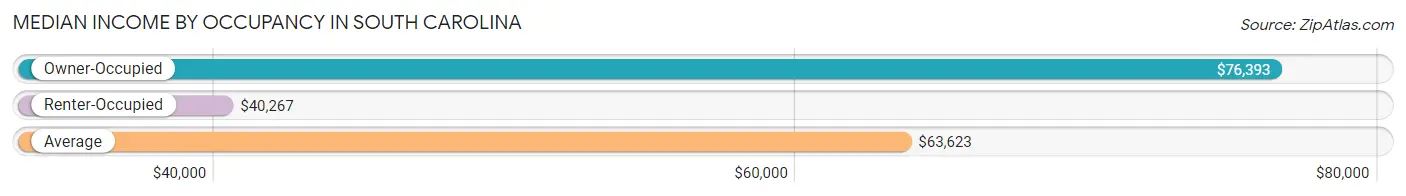
| Occupancy Type | # Households | Median Income |
| Owner-Occupied | 1,434,662 (70.9%) | $76,393 |
| Renter-Occupied | 588,423 (29.1%) | $40,267 |
| Average | 2,023,085 (100.0%) | $63,623 |
Occupancy by Householder Income Bracket in South Carolina
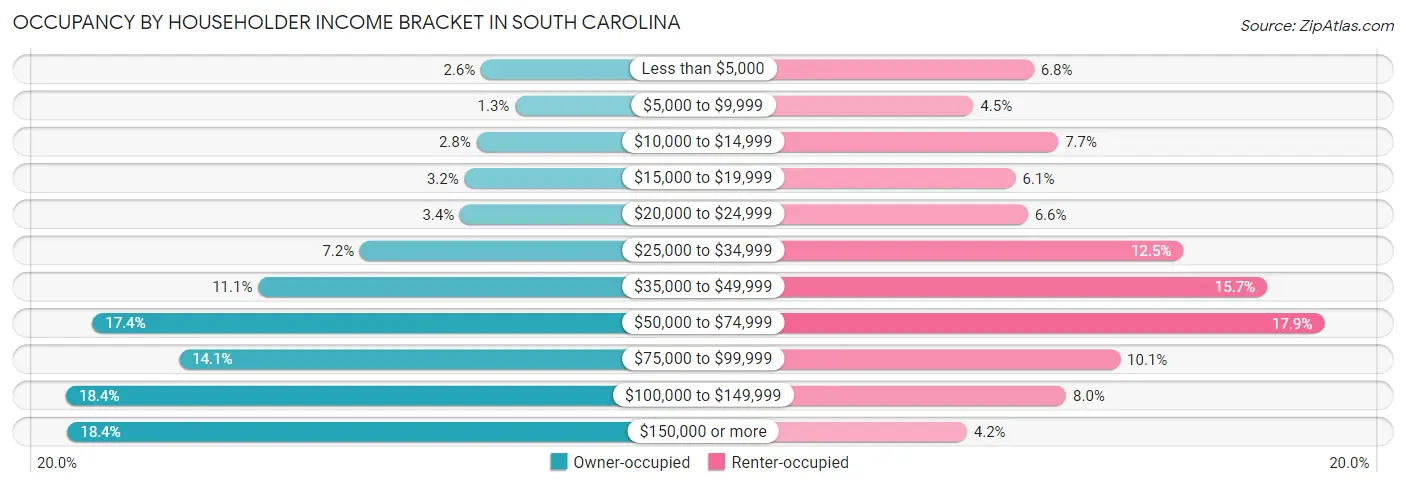
| Income Bracket | Owner-occupied | Renter-occupied |
| Less than $5,000 | 37,451 (2.6%) | 39,949 (6.8%) |
| $5,000 to $9,999 | 18,842 (1.3%) | 26,441 (4.5%) |
| $10,000 to $14,999 | 39,914 (2.8%) | 45,449 (7.7%) |
| $15,000 to $19,999 | 46,476 (3.2%) | 35,899 (6.1%) |
| $20,000 to $24,999 | 48,943 (3.4%) | 38,594 (6.6%) |
| $25,000 to $34,999 | 103,555 (7.2%) | 73,439 (12.5%) |
| $35,000 to $49,999 | 159,200 (11.1%) | 92,191 (15.7%) |
| $50,000 to $74,999 | 249,976 (17.4%) | 105,021 (17.8%) |
| $75,000 to $99,999 | 202,477 (14.1%) | 59,306 (10.1%) |
| $100,000 to $149,999 | 264,264 (18.4%) | 47,171 (8.0%) |
| $150,000 or more | 263,564 (18.4%) | 24,963 (4.2%) |
| Total | 1,434,662 (100.0%) | 588,423 (100.0%) |
Monthly Housing Cost Tiers in South Carolina
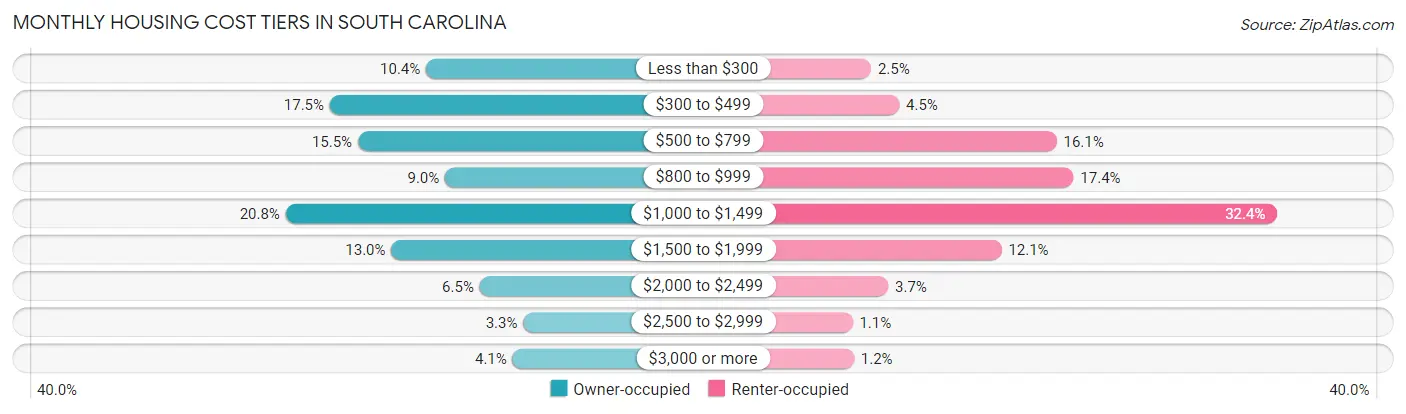
| Monthly Cost | Owner-occupied | Renter-occupied |
| Less than $300 | 149,613 (10.4%) | 14,522 (2.5%) |
| $300 to $499 | 251,363 (17.5%) | 26,719 (4.5%) |
| $500 to $799 | 221,648 (15.4%) | 94,968 (16.1%) |
| $800 to $999 | 129,596 (9.0%) | 102,258 (17.4%) |
| $1,000 to $1,499 | 298,004 (20.8%) | 190,605 (32.4%) |
| $1,500 to $1,999 | 186,392 (13.0%) | 71,079 (12.1%) |
| $2,000 to $2,499 | 92,965 (6.5%) | 21,930 (3.7%) |
| $2,500 to $2,999 | 46,885 (3.3%) | 6,504 (1.1%) |
| $3,000 or more | 58,196 (4.1%) | 7,112 (1.2%) |
| Total | 1,434,662 (100.0%) | 588,423 (100.0%) |
Physical Housing Characteristics in South Carolina
Housing Structures in South Carolina
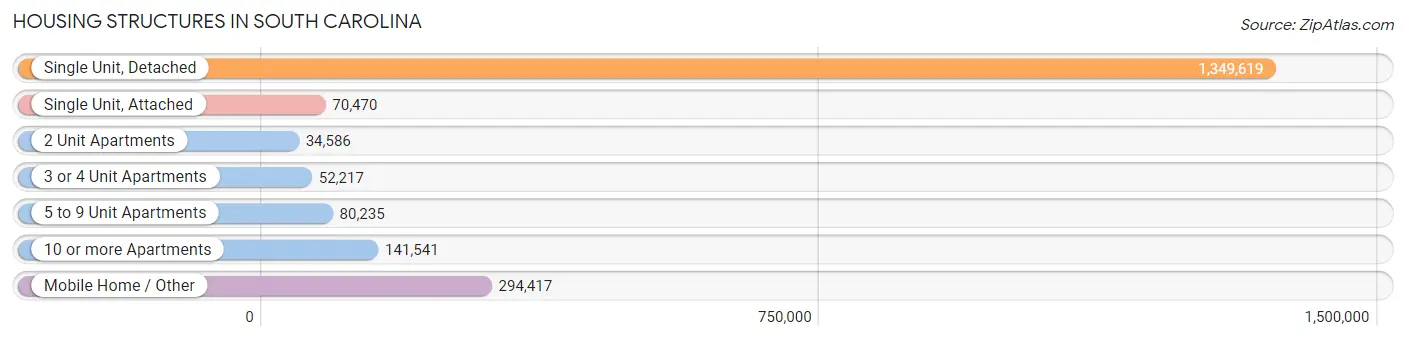
| Structure Type | # Housing Units | % Housing Units |
| Single Unit, Detached | 1,349,619 | 66.7% |
| Single Unit, Attached | 70,470 | 3.5% |
| 2 Unit Apartments | 34,586 | 1.7% |
| 3 or 4 Unit Apartments | 52,217 | 2.6% |
| 5 to 9 Unit Apartments | 80,235 | 4.0% |
| 10 or more Apartments | 141,541 | 7.0% |
| Mobile Home / Other | 294,417 | 14.5% |
| Total | 2,023,085 | 100.0% |
Housing Structures by Occupancy in South Carolina
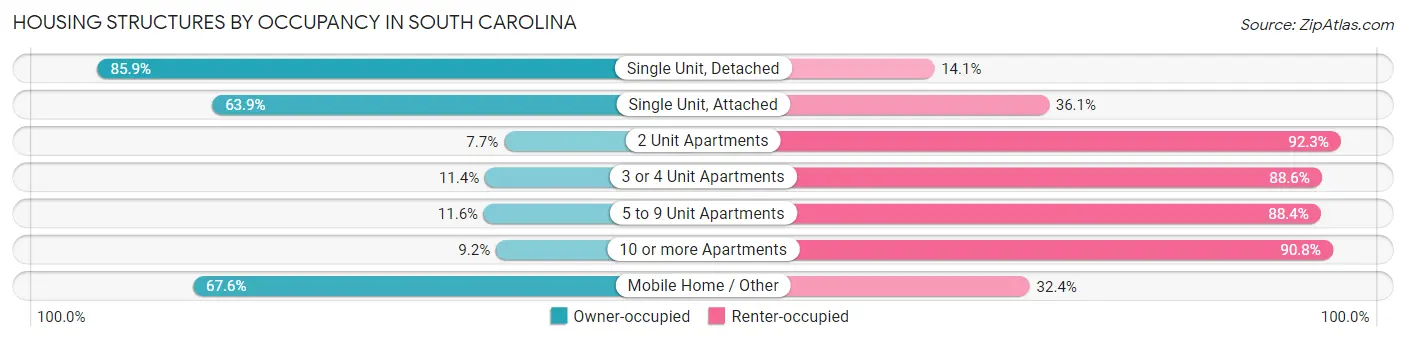
| Structure Type | Owner-occupied | Renter-occupied |
| Single Unit, Detached | 1,159,790 (85.9%) | 189,829 (14.1%) |
| Single Unit, Attached | 45,009 (63.9%) | 25,461 (36.1%) |
| 2 Unit Apartments | 2,663 (7.7%) | 31,923 (92.3%) |
| 3 or 4 Unit Apartments | 5,932 (11.4%) | 46,285 (88.6%) |
| 5 to 9 Unit Apartments | 9,279 (11.6%) | 70,956 (88.4%) |
| 10 or more Apartments | 13,080 (9.2%) | 128,461 (90.8%) |
| Mobile Home / Other | 198,909 (67.6%) | 95,508 (32.4%) |
| Total | 1,434,662 (70.9%) | 588,423 (29.1%) |
Housing Structures by Number of Rooms in South Carolina
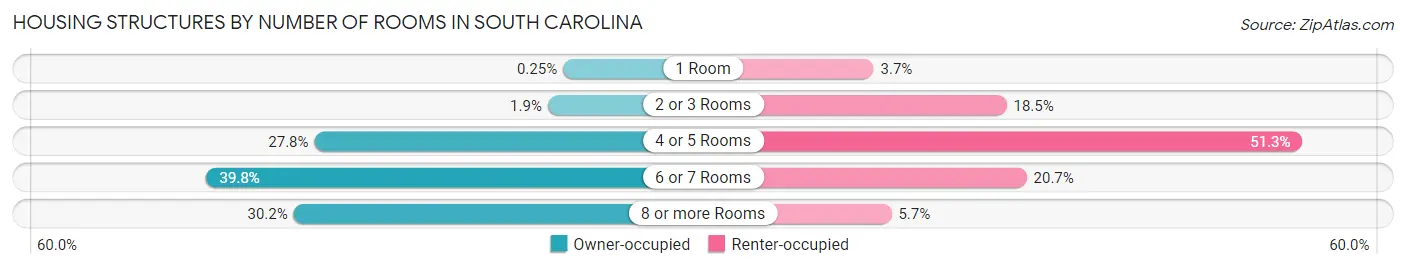
| Number of Rooms | Owner-occupied | Renter-occupied |
| 1 Room | 3,600 (0.3%) | 22,023 (3.7%) |
| 2 or 3 Rooms | 27,834 (1.9%) | 108,777 (18.5%) |
| 4 or 5 Rooms | 399,366 (27.8%) | 302,002 (51.3%) |
| 6 or 7 Rooms | 571,271 (39.8%) | 121,934 (20.7%) |
| 8 or more Rooms | 432,591 (30.1%) | 33,687 (5.7%) |
| Total | 1,434,662 (100.0%) | 588,423 (100.0%) |
Housing Structure by Heating Type in South Carolina
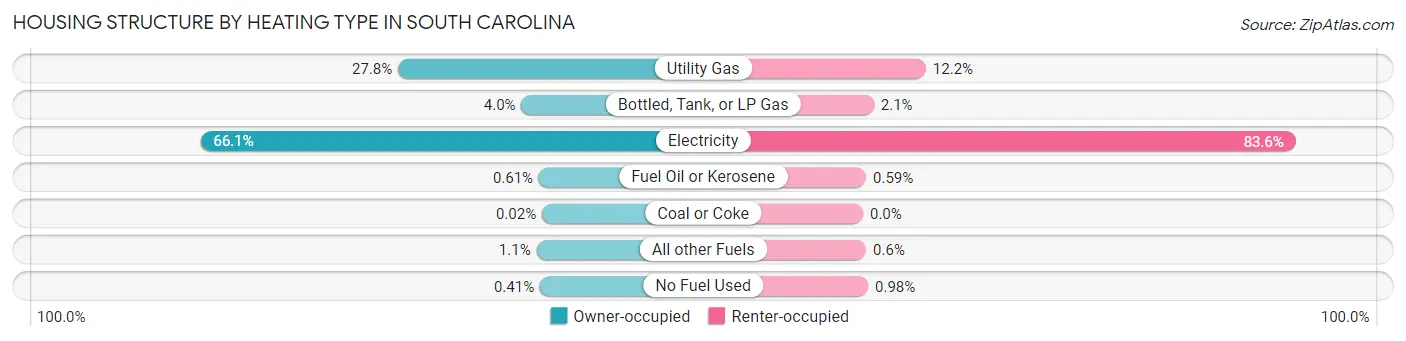
| Heating Type | Owner-occupied | Renter-occupied |
| Utility Gas | 399,463 (27.8%) | 71,493 (12.1%) |
| Bottled, Tank, or LP Gas | 57,202 (4.0%) | 12,260 (2.1%) |
| Electricity | 947,624 (66.0%) | 491,936 (83.6%) |
| Fuel Oil or Kerosene | 8,720 (0.6%) | 3,443 (0.6%) |
| Coal or Coke | 332 (0.0%) | 17 (0.0%) |
| All other Fuels | 15,427 (1.1%) | 3,518 (0.6%) |
| No Fuel Used | 5,894 (0.4%) | 5,756 (1.0%) |
| Total | 1,434,662 (100.0%) | 588,423 (100.0%) |
Household Vehicle Usage in South Carolina
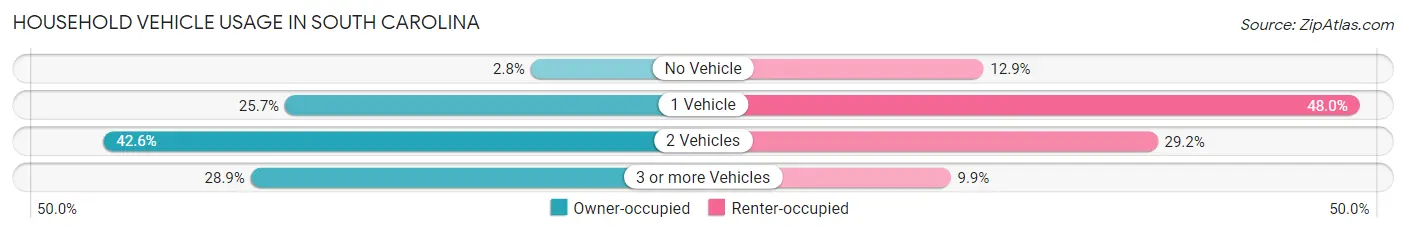
| Vehicles per Household | Owner-occupied | Renter-occupied |
| No Vehicle | 39,583 (2.8%) | 76,099 (12.9%) |
| 1 Vehicle | 368,746 (25.7%) | 282,615 (48.0%) |
| 2 Vehicles | 611,759 (42.6%) | 171,705 (29.2%) |
| 3 or more Vehicles | 414,574 (28.9%) | 58,004 (9.9%) |
| Total | 1,434,662 (100.0%) | 588,423 (100.0%) |
Real Estate & Mortgages in South Carolina
Real Estate and Mortgage Overview in South Carolina
| Characteristic | Without Mortgage | With Mortgage |
| Housing Units | 604,445 | 830,217 |
| Median Property Value | $167,400 | $243,700 |
| Median Household Income | $55,236 | $193,983 |
| Monthly Housing Costs | $421 | $56,370 |
| Real Estate Taxes | $829 | $25,262 |
Property Value by Mortgage Status in South Carolina
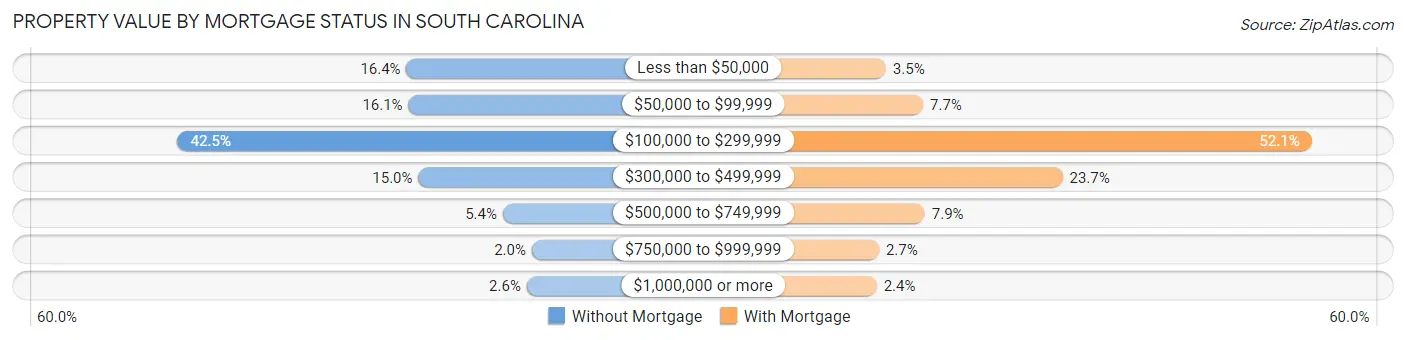
| Property Value | Without Mortgage | With Mortgage |
| Less than $50,000 | 98,874 (16.4%) | 28,812 (3.5%) |
| $50,000 to $99,999 | 97,481 (16.1%) | 64,111 (7.7%) |
| $100,000 to $299,999 | 256,939 (42.5%) | 432,707 (52.1%) |
| $300,000 to $499,999 | 90,692 (15.0%) | 196,453 (23.7%) |
| $500,000 to $749,999 | 32,367 (5.3%) | 65,757 (7.9%) |
| $750,000 to $999,999 | 12,288 (2.0%) | 22,270 (2.7%) |
| $1,000,000 or more | 15,804 (2.6%) | 20,107 (2.4%) |
| Total | 604,445 (100.0%) | 830,217 (100.0%) |
Household Income by Mortgage Status in South Carolina
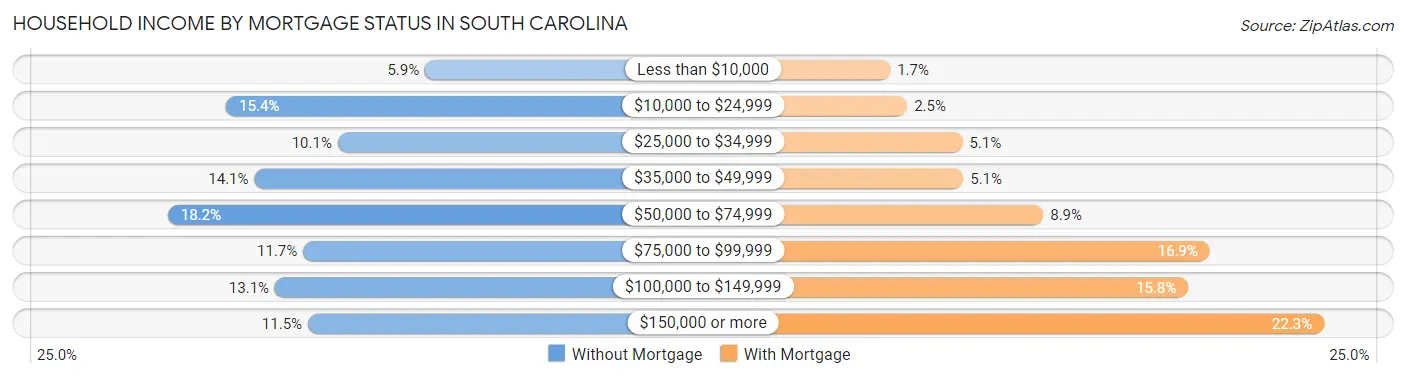
| Household Income | Without Mortgage | With Mortgage |
| Less than $10,000 | 35,843 (5.9%) | 13,671 (1.7%) |
| $10,000 to $24,999 | 93,099 (15.4%) | 20,450 (2.5%) |
| $25,000 to $34,999 | 61,004 (10.1%) | 42,234 (5.1%) |
| $35,000 to $49,999 | 84,984 (14.1%) | 42,551 (5.1%) |
| $50,000 to $74,999 | 109,909 (18.2%) | 74,216 (8.9%) |
| $75,000 to $99,999 | 70,942 (11.7%) | 140,067 (16.9%) |
| $100,000 to $149,999 | 79,083 (13.1%) | 131,535 (15.8%) |
| $150,000 or more | 69,581 (11.5%) | 185,181 (22.3%) |
| Total | 604,445 (100.0%) | 830,217 (100.0%) |
Property Value to Household Income Ratio in South Carolina
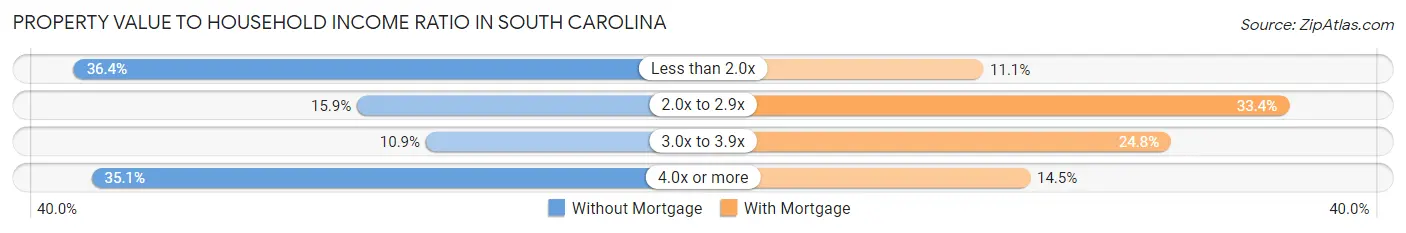
| Value-to-Income Ratio | Without Mortgage | With Mortgage |
| Less than 2.0x | 220,196 (36.4%) | 92,428 (11.1%) |
| 2.0x to 2.9x | 95,787 (15.9%) | 276,857 (33.4%) |
| 3.0x to 3.9x | 65,600 (10.8%) | 205,722 (24.8%) |
| 4.0x or more | 212,334 (35.1%) | 120,704 (14.5%) |
| Total | 604,445 (100.0%) | 830,217 (100.0%) |
Real Estate Taxes by Mortgage Status in South Carolina
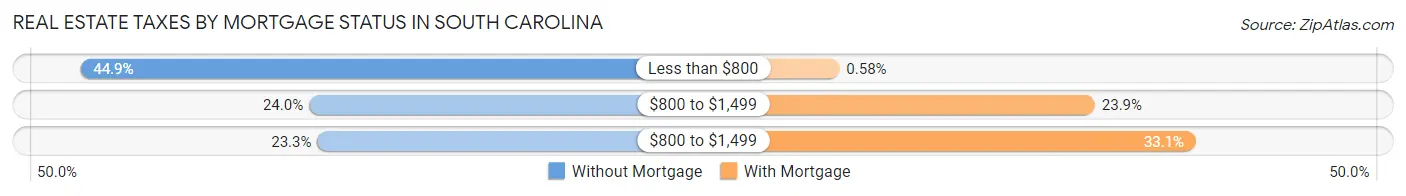
| Property Taxes | Without Mortgage | With Mortgage |
| Less than $800 | 271,464 (44.9%) | 4,826 (0.6%) |
| $800 to $1,499 | 145,245 (24.0%) | 198,538 (23.9%) |
| $800 to $1,499 | 140,644 (23.3%) | 275,161 (33.1%) |
| Total | 604,445 (100.0%) | 830,217 (100.0%) |
Health & Disability in South Carolina
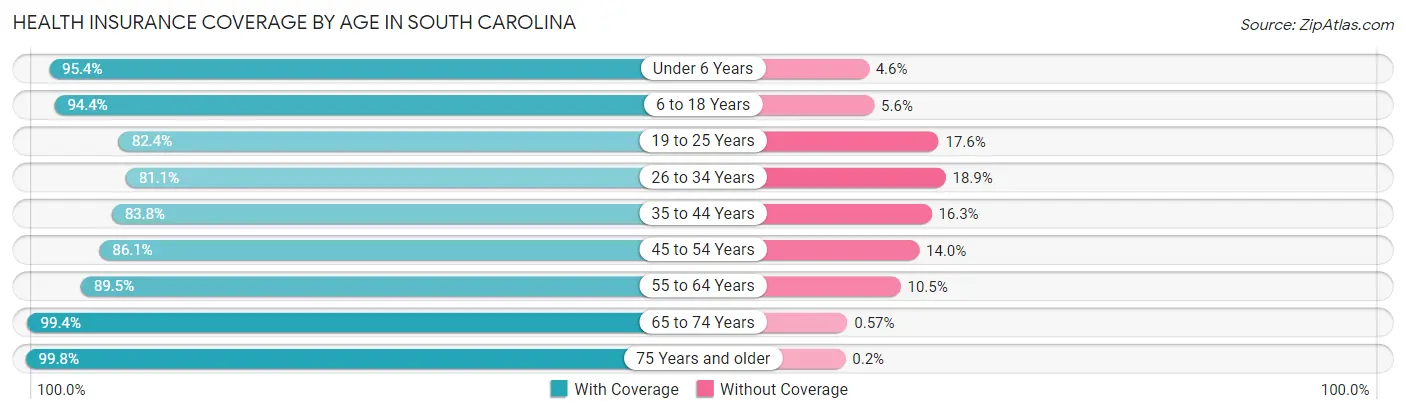
Health Insurance Coverage by Age in South Carolina
| Age Bracket | With Coverage | Without Coverage |
| Under 6 Years | 324,993 (95.4%) | 15,518 (4.6%) |
| 6 to 18 Years | 788,517 (94.4%) | 46,507 (5.6%) |
| 19 to 25 Years | 372,839 (82.4%) | 79,457 (17.6%) |
| 26 to 34 Years | 467,595 (81.1%) | 108,812 (18.9%) |
| 35 to 44 Years | 516,433 (83.8%) | 100,168 (16.3%) |
| 45 to 54 Years | 537,194 (86.1%) | 87,091 (14.0%) |
| 55 to 64 Years | 608,906 (89.5%) | 71,392 (10.5%) |
| 65 to 74 Years | 564,955 (99.4%) | 3,253 (0.6%) |
| 75 Years and older | 349,674 (99.8%) | 688 (0.2%) |
| Total | 4,531,106 (89.8%) | 512,886 (10.2%) |
Health Insurance Coverage by Citizenship Status in South Carolina
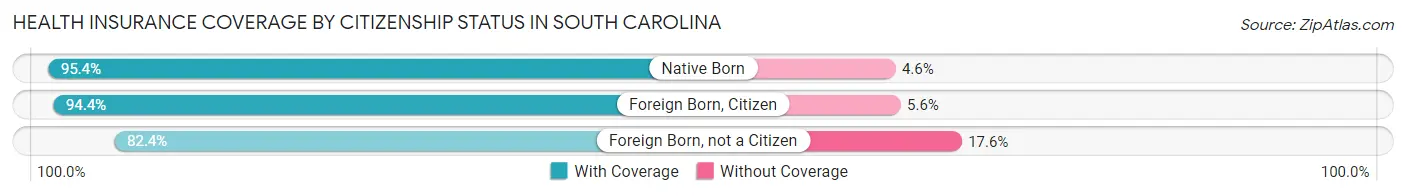
| Citizenship Status | With Coverage | Without Coverage |
| Native Born | 324,993 (95.4%) | 15,518 (4.6%) |
| Foreign Born, Citizen | 788,517 (94.4%) | 46,507 (5.6%) |
| Foreign Born, not a Citizen | 372,839 (82.4%) | 79,457 (17.6%) |
Health Insurance Coverage by Household Income in South Carolina
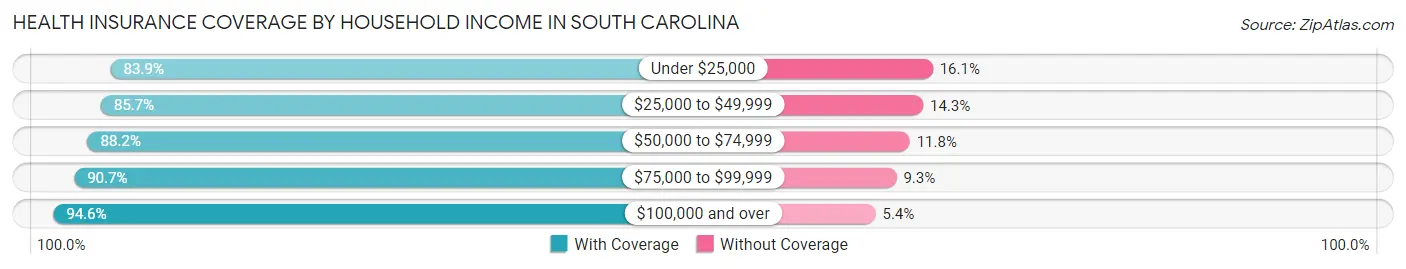
| Household Income | With Coverage | Without Coverage |
| Under $25,000 | 565,743 (83.9%) | 108,536 (16.1%) |
| $25,000 to $49,999 | 786,252 (85.7%) | 130,967 (14.3%) |
| $50,000 to $74,999 | 768,842 (88.2%) | 102,788 (11.8%) |
| $75,000 to $99,999 | 647,076 (90.7%) | 66,377 (9.3%) |
| $100,000 and over | 1,706,125 (94.6%) | 96,921 (5.4%) |
Public vs Private Health Insurance Coverage by Age in South Carolina
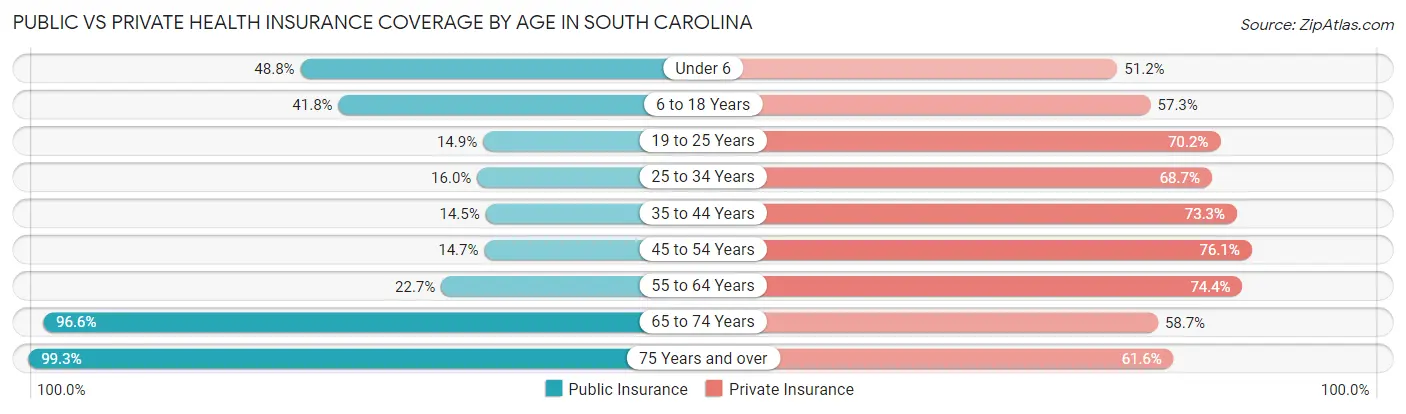
| Age Bracket | Public Insurance | Private Insurance |
| Under 6 | 166,213 (48.8%) | 174,201 (51.2%) |
| 6 to 18 Years | 348,662 (41.7%) | 478,636 (57.3%) |
| 19 to 25 Years | 67,491 (14.9%) | 317,644 (70.2%) |
| 25 to 34 Years | 92,226 (16.0%) | 395,739 (68.7%) |
| 35 to 44 Years | 89,108 (14.4%) | 452,098 (73.3%) |
| 45 to 54 Years | 91,602 (14.7%) | 474,886 (76.1%) |
| 55 to 64 Years | 154,330 (22.7%) | 505,841 (74.4%) |
| 65 to 74 Years | 548,647 (96.6%) | 333,405 (58.7%) |
| 75 Years and over | 347,986 (99.3%) | 215,831 (61.6%) |
| Total | 1,906,265 (37.8%) | 3,348,281 (66.4%) |
Disability Status by Sex by Age in South Carolina
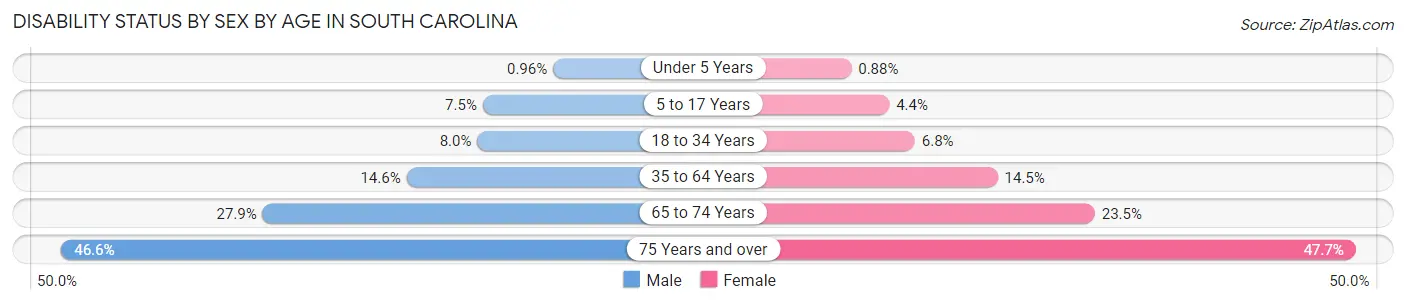
| Age Bracket | Male | Female |
| Under 5 Years | 1,403 (1.0%) | 1,215 (0.9%) |
| 5 to 17 Years | 31,211 (7.5%) | 17,662 (4.4%) |
| 18 to 34 Years | 43,143 (8.0%) | 38,135 (6.8%) |
| 35 to 64 Years | 134,301 (14.6%) | 144,393 (14.5%) |
| 65 to 74 Years | 73,328 (27.9%) | 71,750 (23.5%) |
| 75 Years and over | 69,008 (46.6%) | 96,451 (47.7%) |
Disability Class by Sex by Age in South Carolina
Disability Class: Hearing Difficulty
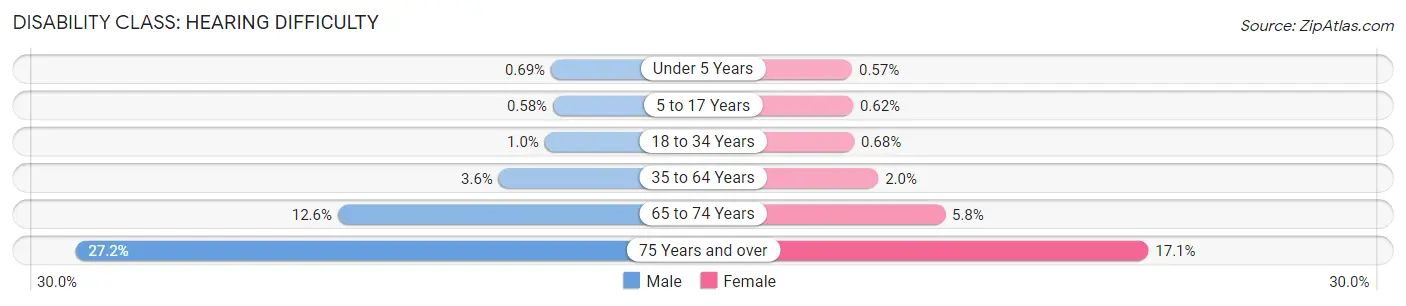
| Age Bracket | Male | Female |
| Under 5 Years | 1,004 (0.7%) | 781 (0.6%) |
| 5 to 17 Years | 2,433 (0.6%) | 2,471 (0.6%) |
| 18 to 34 Years | 5,590 (1.0%) | 3,806 (0.7%) |
| 35 to 64 Years | 33,229 (3.6%) | 20,296 (2.0%) |
| 65 to 74 Years | 32,980 (12.6%) | 17,587 (5.8%) |
| 75 Years and over | 40,248 (27.2%) | 34,529 (17.1%) |
Disability Class: Vision Difficulty
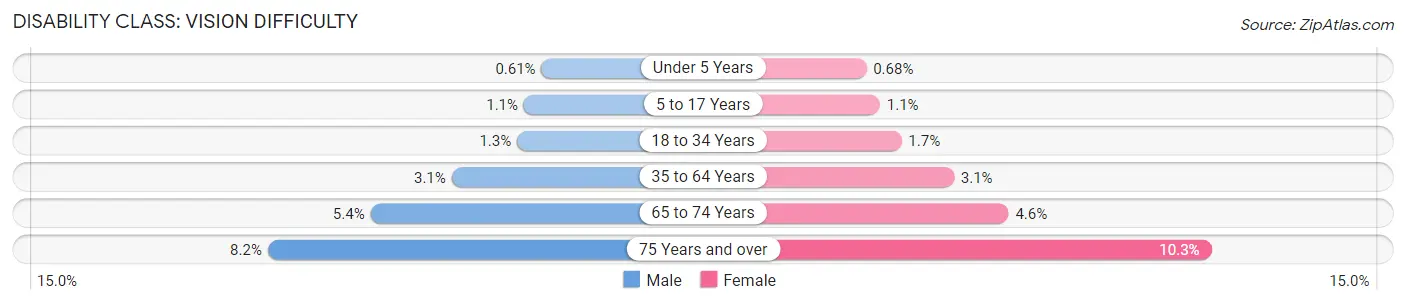
| Age Bracket | Male | Female |
| Under 5 Years | 883 (0.6%) | 934 (0.7%) |
| 5 to 17 Years | 4,595 (1.1%) | 4,241 (1.1%) |
| 18 to 34 Years | 6,941 (1.3%) | 9,344 (1.7%) |
| 35 to 64 Years | 28,672 (3.1%) | 31,106 (3.1%) |
| 65 to 74 Years | 14,113 (5.4%) | 14,165 (4.6%) |
| 75 Years and over | 12,188 (8.2%) | 20,802 (10.3%) |
Disability Class: Cognitive Difficulty
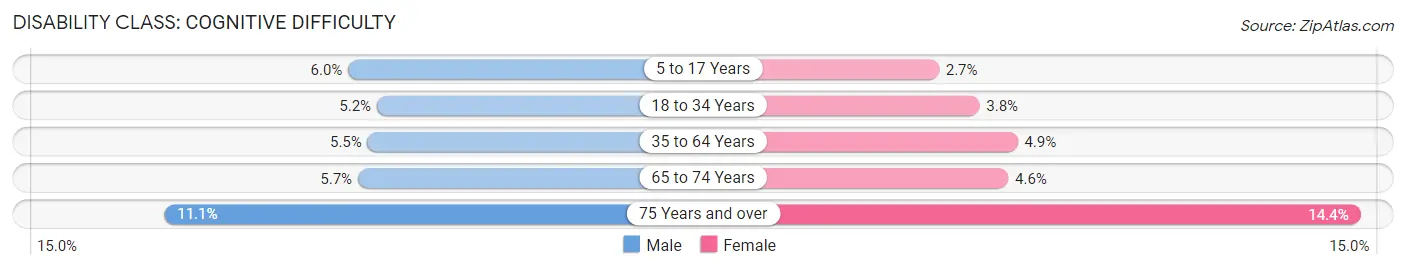
| Age Bracket | Male | Female |
| 5 to 17 Years | 24,989 (6.0%) | 10,849 (2.7%) |
| 18 to 34 Years | 28,034 (5.2%) | 21,516 (3.8%) |
| 35 to 64 Years | 50,300 (5.4%) | 48,803 (4.9%) |
| 65 to 74 Years | 15,027 (5.7%) | 14,154 (4.6%) |
| 75 Years and over | 16,453 (11.1%) | 29,211 (14.4%) |
Disability Class: Ambulatory Difficulty
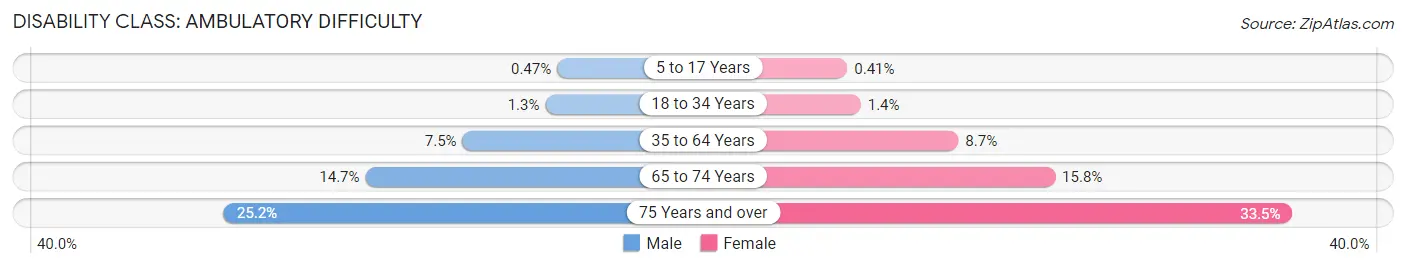
| Age Bracket | Male | Female |
| 5 to 17 Years | 1,977 (0.5%) | 1,640 (0.4%) |
| 18 to 34 Years | 7,218 (1.3%) | 7,955 (1.4%) |
| 35 to 64 Years | 69,088 (7.5%) | 86,517 (8.7%) |
| 65 to 74 Years | 38,610 (14.7%) | 48,415 (15.8%) |
| 75 Years and over | 37,323 (25.2%) | 67,643 (33.5%) |
Disability Class: Self-Care Difficulty
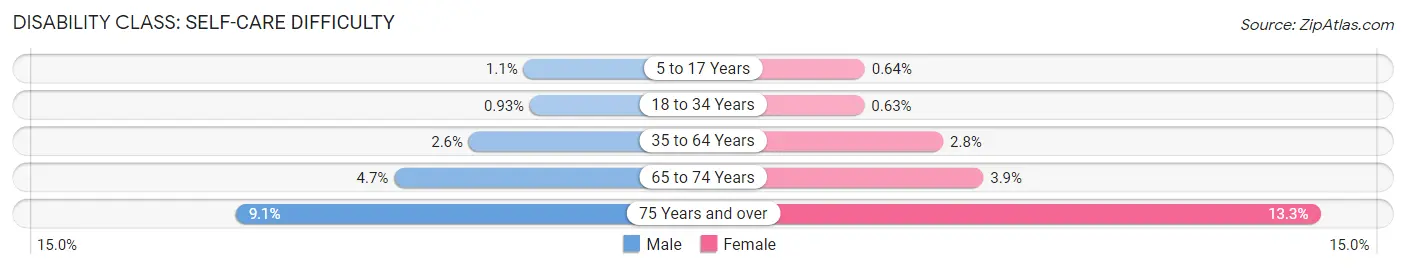
| Age Bracket | Male | Female |
| 5 to 17 Years | 4,625 (1.1%) | 2,571 (0.6%) |
| 18 to 34 Years | 5,031 (0.9%) | 3,537 (0.6%) |
| 35 to 64 Years | 24,227 (2.6%) | 28,123 (2.8%) |
| 65 to 74 Years | 12,368 (4.7%) | 12,031 (3.9%) |
| 75 Years and over | 13,511 (9.1%) | 26,934 (13.3%) |
Technology Access in South Carolina
Computing Device Access in South Carolina
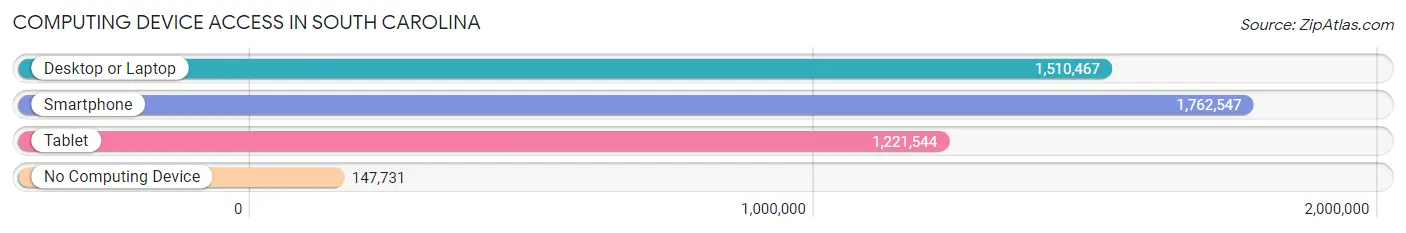
| Device Type | # Households | % Households |
| Desktop or Laptop | 1,510,467 | 74.7% |
| Smartphone | 1,762,547 | 87.1% |
| Tablet | 1,221,544 | 60.4% |
| No Computing Device | 147,731 | 7.3% |
| Total | 2,023,085 | 100.0% |
Internet Access in South Carolina
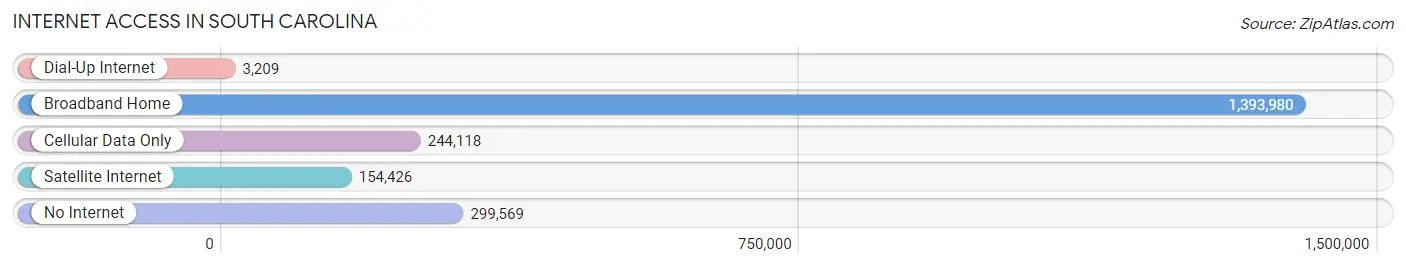
| Internet Type | # Households | % Households |
| Dial-Up Internet | 3,209 | 0.2% |
| Broadband Home | 1,393,980 | 68.9% |
| Cellular Data Only | 244,118 | 12.1% |
| Satellite Internet | 154,426 | 7.6% |
| No Internet | 299,569 | 14.8% |
| Total | 2,023,085 | 100.0% |
South Carolina Summary
South Carolina is a state located in the southeastern United States. It is bordered by North Carolina to the north, Georgia to the south and west, and the Atlantic Ocean to the east. South Carolina is the 40th most populous state in the United States, with a population of 5,148,714 as of 2020.
History
South Carolina was one of the original 13 colonies that formed the United States. It was the first state to ratify the Articles of Confederation in 1778, and the eighth state to ratify the U.S. Constitution in 1788. South Carolina was the first state to secede from the Union in 1861, and was the first state to be readmitted to the Union in 1868.
The first Europeans to explore the area were Spanish explorers in the late 1500s. The first permanent settlement was established in 1670 by English settlers. The colony was named Carolina in honor of King Charles II of England. The colony was divided into North and South Carolina in 1712.
Geography
South Carolina is located in the southeastern United States, bordered by North Carolina to the north, Georgia to the south and west, and the Atlantic Ocean to the east. The state has a total area of 32,020 square miles, making it the 40th largest state in the country.
The state is divided into three distinct geographic regions: the Coastal Plain, the Piedmont, and the Blue Ridge Mountains. The Coastal Plain is a flat, low-lying area that stretches along the Atlantic coast. The Piedmont is a hilly region located in the center of the state. The Blue Ridge Mountains are located in the western part of the state and are the highest mountains in the state.
Economy
South Carolina has a diverse economy that is driven by agriculture, manufacturing, and tourism. The state is the largest producer of tobacco in the United States and is also a major producer of cotton, soybeans, and peanuts.
Manufacturing is a major part of the state’s economy, with major industries including automotive, aerospace, and textiles. Tourism is also a major industry, with the state’s beaches, mountains, and historic sites attracting millions of visitors each year.
Demographics
As of 2020, South Carolina had a population of 5,148,714, making it the 40th most populous state in the United States. The state is racially diverse, with the largest racial groups being White (63.2%), Black or African American (27.3%), and Hispanic or Latino (7.2%).
The median household income in South Carolina is $50,570, and the median age is 38.7 years. The state’s largest cities are Columbia (population 131,686), Charleston (population 134,385), and North Charleston (population 108,304).
Common Questions
When was South Carolina Incorporated?
South Carolina was Incorporated into the Union on May 23, 1788.
What is the Total Area of South Carolina?
Total Area of South Carolina is 32,021 Square Miles.
What is the Total Land Area of South Carolina?
Total Land Area of South Carolina is 30,070 Square Miles.
What is the Total Water Area of South Carolina?
Total Water Area of South Carolina is 1,951 Square Miles.
What is the Average Elevation in South Carolina?
Average Elevation in South Carolina is 350 Feet.
What is the Highest Elevation in South Carolina?
Highest Elevation in South Carolina is 3,560 Feet.
What is the Lowest Elevation in South Carolina?
Lowest Elevation in South Carolina is 0 Feet.
What is the Population Density in South Carolina?
Population Density in South Carolina is 171.0 People per Square Mile.
What is Per Capita Income in South Carolina?
Per Capita income in South Carolina is $36,072.
What is the Median Family Income in South Carolina?
Median Family Income in South Carolina is $79,830.
What is the Median Household income in South Carolina?
Median Household Income in South Carolina is $63,623.
What is Income or Wage Gap in South Carolina?
Income or Wage Gap in South Carolina is 28.0%.
Women in South Carolina earn 72.0 cents for every dollar earned by a man.
What is Family Income Deficit in South Carolina?
Family Income Deficit in South Carolina is $10,884.
Families that are below poverty line in South Carolina earn $10,884 less on average than the poverty threshold level.
What is Inequality or Gini Index in South Carolina?
Inequality or Gini Index in South Carolina is 0.48.
What is the Total Population of South Carolina?
Total Population of South Carolina is 5,142,750.
What is the Total Male Population of South Carolina?
Total Male Population of South Carolina is 2,510,019.
What is the Total Female Population of South Carolina?
Total Female Population of South Carolina is 2,632,731.
What is the Ratio of Males per 100 Females in South Carolina?
There are 95.34 Males per 100 Females in South Carolina.
What is the Ratio of Females per 100 Males in South Carolina?
There are 104.89 Females per 100 Males in South Carolina.
What is the Median Population Age in South Carolina?
Median Population Age in South Carolina is 40.0 Years.
What is the Average Family Size in South Carolina
Average Family Size in South Carolina is 3.1 People.
What is the Average Household Size in South Carolina
Average Household Size in South Carolina is 2.5 People.
How Large is the Labor Force in South Carolina?
There are 2,516,635 People in the Labor Forcein in South Carolina.
What is the Percentage of People in the Labor Force in South Carolina?
60.4% of People are in the Labor Force in South Carolina.
What is the Unemployment Rate in South Carolina?
Unemployment Rate in South Carolina is 5.2%.