Mauldin, SC Map & Demographics
Mauldin Map
Mauldin Overview
$40,582
PER CAPITA INCOME
$86,028
AVG FAMILY INCOME
$75,565
AVG HOUSEHOLD INCOME
19.8%
WAGE / INCOME GAP [ % ]
80.2¢/ $1
WAGE / INCOME GAP [ $ ]
0.38
INEQUALITY / GINI INDEX
25,267
TOTAL POPULATION
12,273
MALE POPULATION
12,994
FEMALE POPULATION
94.45
MALES / 100 FEMALES
105.87
FEMALES / 100 MALES
42.3
MEDIAN AGE
2.8
AVG FAMILY SIZE
2.4
AVG HOUSEHOLD SIZE
14,444
LABOR FORCE [ PEOPLE ]
69.1%
PERCENT IN LABOR FORCE
5.0%
UNEMPLOYMENT RATE
Mauldin Zip Codes
Mauldin Area Codes
Income in Mauldin
Income Overview in Mauldin
Per Capita Income in Mauldin is $40,582, while median incomes of families and households are $86,028 and $75,565 respectively.
| Characteristic | Number | Measure |
| Per Capita Income | 25,267 | $40,582 |
| Median Family Income | 7,019 | $86,028 |
| Mean Family Income | 7,019 | $110,189 |
| Median Household Income | 10,676 | $75,565 |
| Mean Household Income | 10,676 | $94,994 |
| Income Deficit | 7,019 | $0 |
| Wage / Income Gap (%) | 25,267 | 19.80% |
| Wage / Income Gap ($) | 25,267 | 80.20¢ per $1 |
| Gini / Inequality Index | 25,267 | 0.38 |
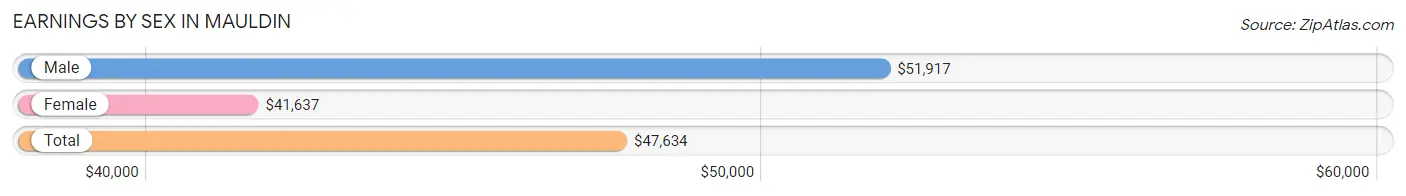
Earnings by Sex in Mauldin
Average Earnings in Mauldin are $47,634, $51,917 for men and $41,637 for women, a difference of 19.8%.
| Sex | Number | Average Earnings |
| Male | 7,288 (50.0%) | $51,917 |
| Female | 7,275 (50.0%) | $41,637 |
| Total | 14,563 (100.0%) | $47,634 |
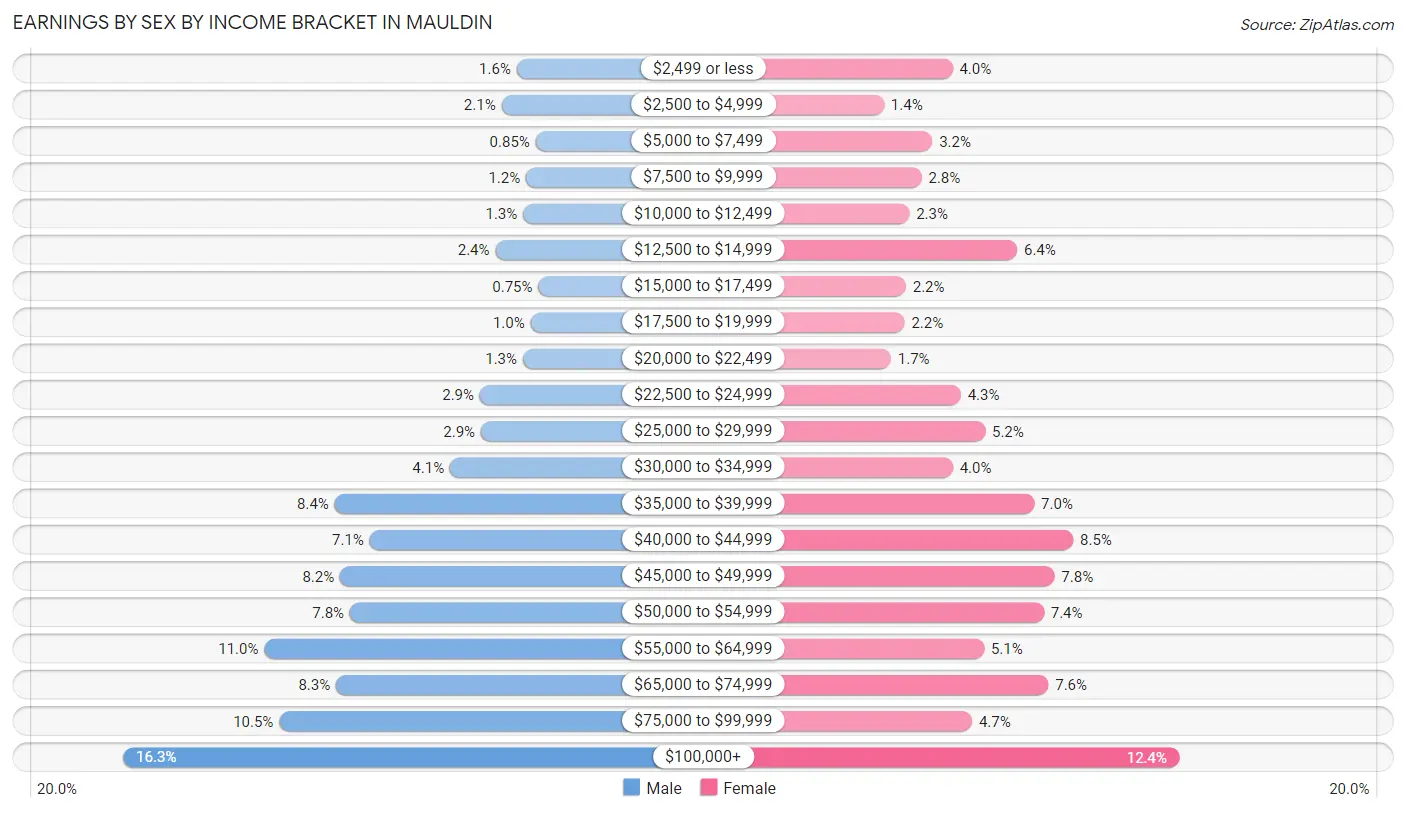
Earnings by Sex by Income Bracket in Mauldin
The most common earnings brackets in Mauldin are $100,000+ for men (1,189 | 16.3%) and $100,000+ for women (905 | 12.4%).
| Income | Male | Female |
| $2,499 or less | 114 (1.6%) | 288 (4.0%) |
| $2,500 to $4,999 | 155 (2.1%) | 101 (1.4%) |
| $5,000 to $7,499 | 62 (0.9%) | 233 (3.2%) |
| $7,500 to $9,999 | 88 (1.2%) | 204 (2.8%) |
| $10,000 to $12,499 | 96 (1.3%) | 170 (2.3%) |
| $12,500 to $14,999 | 172 (2.4%) | 464 (6.4%) |
| $15,000 to $17,499 | 55 (0.7%) | 161 (2.2%) |
| $17,500 to $19,999 | 76 (1.0%) | 157 (2.2%) |
| $20,000 to $22,499 | 97 (1.3%) | 120 (1.7%) |
| $22,500 to $24,999 | 214 (2.9%) | 311 (4.3%) |
| $25,000 to $29,999 | 211 (2.9%) | 377 (5.2%) |
| $30,000 to $34,999 | 296 (4.1%) | 289 (4.0%) |
| $35,000 to $39,999 | 611 (8.4%) | 511 (7.0%) |
| $40,000 to $44,999 | 515 (7.1%) | 617 (8.5%) |
| $45,000 to $49,999 | 596 (8.2%) | 566 (7.8%) |
| $50,000 to $54,999 | 569 (7.8%) | 537 (7.4%) |
| $55,000 to $64,999 | 803 (11.0%) | 374 (5.1%) |
| $65,000 to $74,999 | 607 (8.3%) | 549 (7.5%) |
| $75,000 to $99,999 | 762 (10.5%) | 341 (4.7%) |
| $100,000+ | 1,189 (16.3%) | 905 (12.4%) |
| Total | 7,288 (100.0%) | 7,275 (100.0%) |
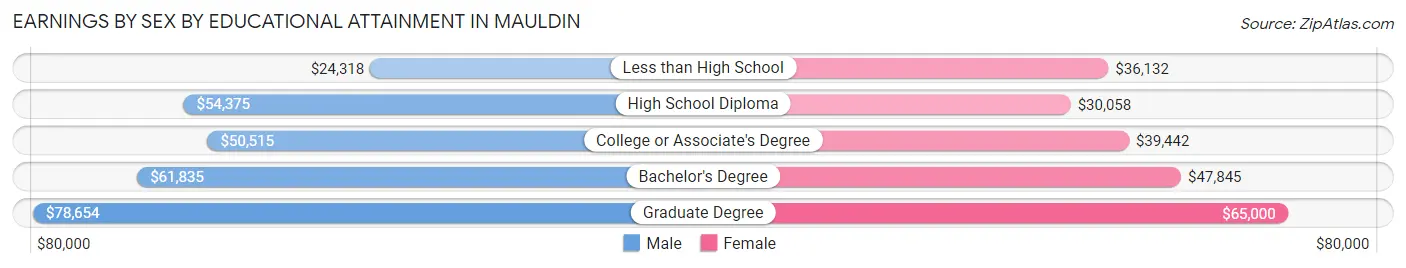
Earnings by Sex by Educational Attainment in Mauldin
Average earnings in Mauldin are $55,205 for men and $43,723 for women, a difference of 20.8%. Men with an educational attainment of graduate degree enjoy the highest average annual earnings of $78,654, while those with less than high school education earn the least with $24,318. Women with an educational attainment of graduate degree earn the most with the average annual earnings of $65,000, while those with high school diploma education have the smallest earnings of $30,058.
| Educational Attainment | Male Income | Female Income |
| Less than High School | $24,318 | $36,132 |
| High School Diploma | $54,375 | $30,058 |
| College or Associate's Degree | $50,515 | $39,442 |
| Bachelor's Degree | $61,835 | $47,845 |
| Graduate Degree | $78,654 | $65,000 |
| Total | $55,205 | $43,723 |
Family Income in Mauldin
Family Income Brackets in Mauldin
According to the Mauldin family income data, there are 1,642 families falling into the $100,000 to $149,999 income range, which is the most common income bracket and makes up 23.4% of all families. Conversely, the $10,000 to $14,999 income bracket is the least frequent group with only 126 families (1.8%) belonging to this category.
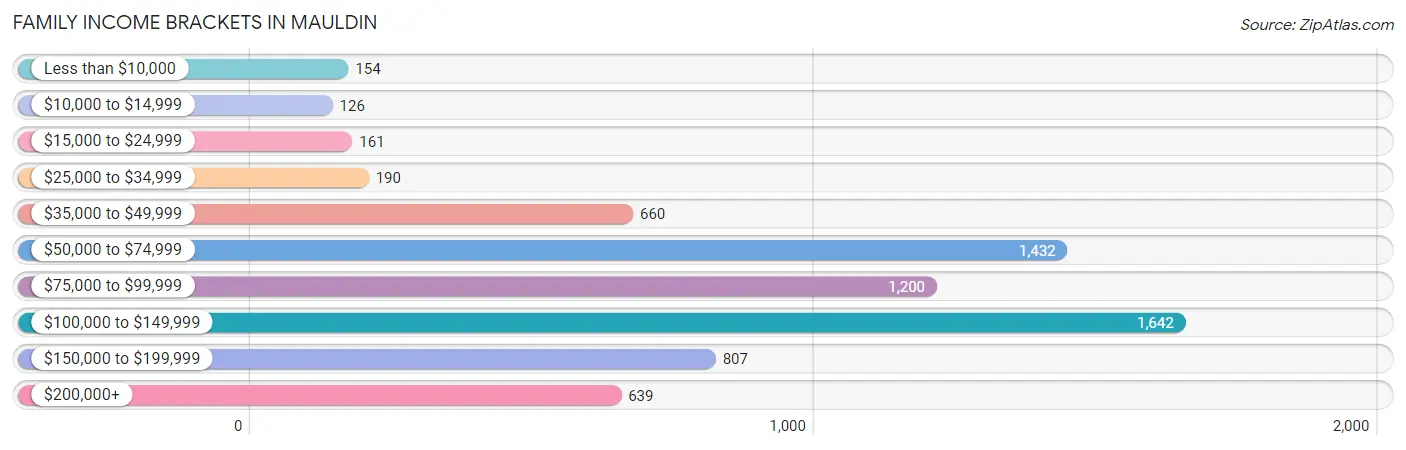
| Income Bracket | # Families | % Families |
| Less than $10,000 | 154 | 2.2% |
| $10,000 to $14,999 | 126 | 1.8% |
| $15,000 to $24,999 | 161 | 2.3% |
| $25,000 to $34,999 | 190 | 2.7% |
| $35,000 to $49,999 | 660 | 9.4% |
| $50,000 to $74,999 | 1,432 | 20.4% |
| $75,000 to $99,999 | 1,200 | 17.1% |
| $100,000 to $149,999 | 1,642 | 23.4% |
| $150,000 to $199,999 | 807 | 11.5% |
| $200,000+ | 639 | 9.1% |
Family Income by Famaliy Size in Mauldin
4-person families (1,121 | 16.0%) account for the highest median family income in Mauldin with $144,094 per family, while 2-person families (3,725 | 53.1%) have the highest median income of $38,331 per family member.
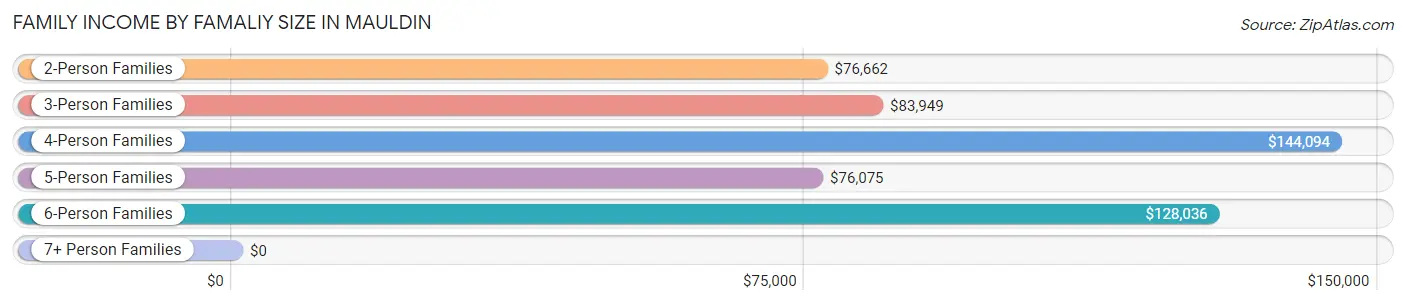
| Income Bracket | # Families | Median Income |
| 2-Person Families | 3,725 (53.1%) | $76,662 |
| 3-Person Families | 1,614 (23.0%) | $83,949 |
| 4-Person Families | 1,121 (16.0%) | $144,094 |
| 5-Person Families | 367 (5.2%) | $76,075 |
| 6-Person Families | 137 (1.9%) | $128,036 |
| 7+ Person Families | 55 (0.8%) | $0 |
| Total | 7,019 (100.0%) | $86,028 |
Family Income by Number of Earners in Mauldin
The median family income in Mauldin is $86,028, with families comprising 3+ earners (616) having the highest median family income of $167,794, while families with no earners (678) have the lowest median family income of $56,580, accounting for 8.8% and 9.7% of families, respectively.
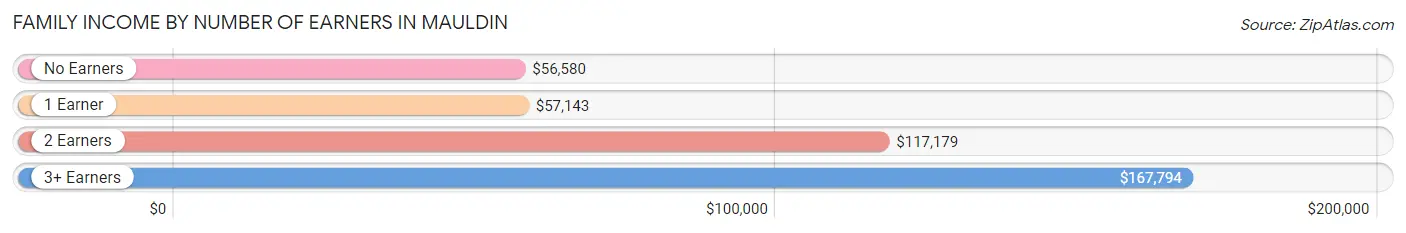
| Number of Earners | # Families | Median Income |
| No Earners | 678 (9.7%) | $56,580 |
| 1 Earner | 2,814 (40.1%) | $57,143 |
| 2 Earners | 2,911 (41.5%) | $117,179 |
| 3+ Earners | 616 (8.8%) | $167,794 |
| Total | 7,019 (100.0%) | $86,028 |
Household Income in Mauldin
Household Income Brackets in Mauldin
With 2,562 households falling in the category, the $50,000 to $74,999 income range is the most frequent in Mauldin, accounting for 24.0% of all households. In contrast, only 246 households (2.3%) fall into the less than $10,000 income bracket, making it the least populous group.
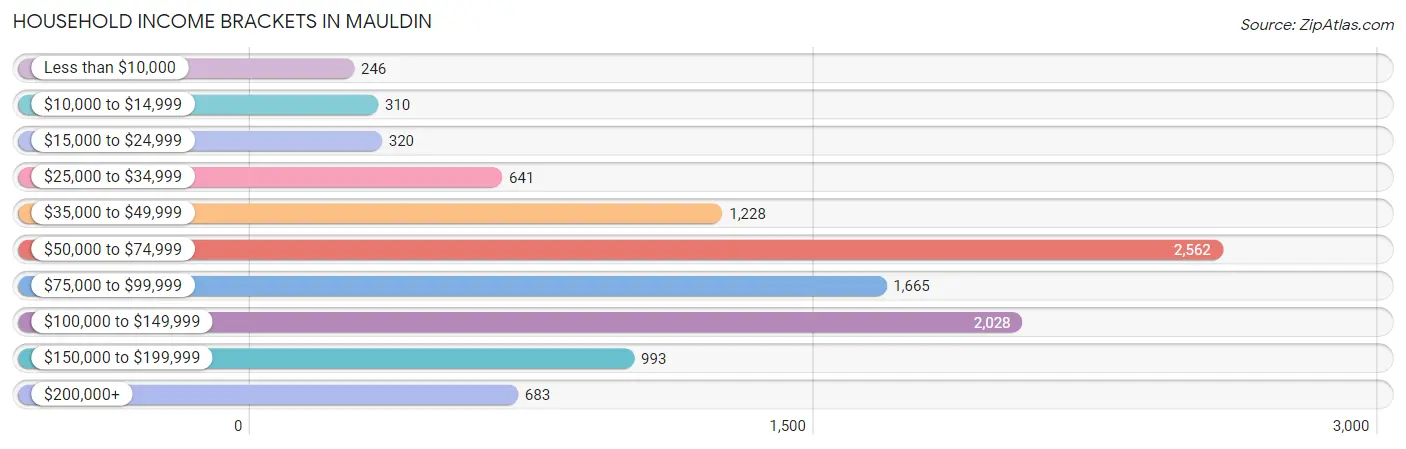
| Income Bracket | # Households | % Households |
| Less than $10,000 | 246 | 2.3% |
| $10,000 to $14,999 | 310 | 2.9% |
| $15,000 to $24,999 | 320 | 3.0% |
| $25,000 to $34,999 | 641 | 6.0% |
| $35,000 to $49,999 | 1,228 | 11.5% |
| $50,000 to $74,999 | 2,562 | 24.0% |
| $75,000 to $99,999 | 1,665 | 15.6% |
| $100,000 to $149,999 | 2,028 | 19.0% |
| $150,000 to $199,999 | 993 | 9.3% |
| $200,000+ | 683 | 6.4% |
Household Income by Householder Age in Mauldin
The median household income in Mauldin is $75,565, with the highest median household income of $82,712 found in the 25 to 44 years age bracket for the primary householder. A total of 3,788 households (35.5%) fall into this category. Meanwhile, the 15 to 24 years age bracket for the primary householder has the lowest median household income of $59,844, with 229 households (2.1%) in this group.
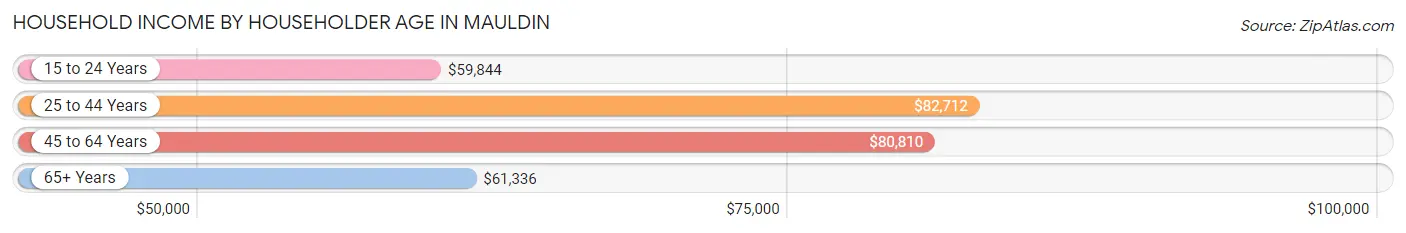
| Income Bracket | # Households | Median Income |
| 15 to 24 Years | 229 (2.1%) | $59,844 |
| 25 to 44 Years | 3,788 (35.5%) | $82,712 |
| 45 to 64 Years | 4,270 (40.0%) | $80,810 |
| 65+ Years | 2,389 (22.4%) | $61,336 |
| Total | 10,676 (100.0%) | $75,565 |
Poverty in Mauldin
Income Below Poverty by Sex and Age in Mauldin
With 7.3% poverty level for males and 8.1% for females among the residents of Mauldin, 18 to 24 year old males and 18 to 24 year old females are the most vulnerable to poverty, with 206 males (21.2%) and 111 females (26.1%) in their respective age groups living below the poverty level.
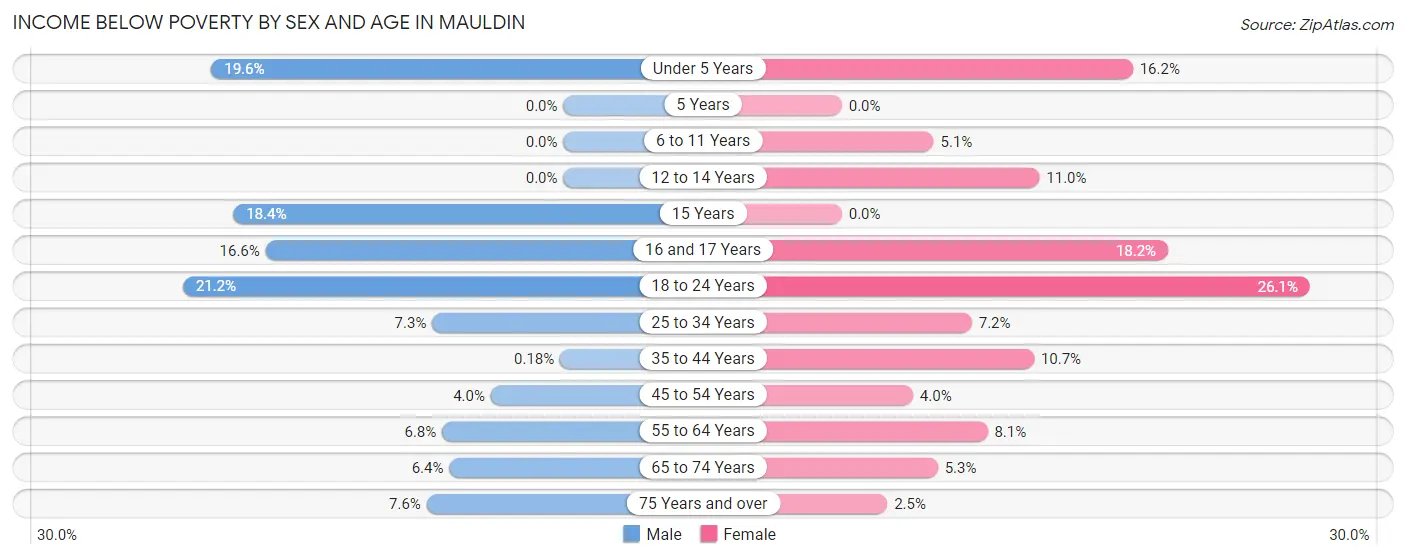
| Age Bracket | Male | Female |
| Under 5 Years | 118 (19.6%) | 70 (16.2%) |
| 5 Years | 0 (0.0%) | 0 (0.0%) |
| 6 to 11 Years | 0 (0.0%) | 44 (5.1%) |
| 12 to 14 Years | 0 (0.0%) | 46 (11.0%) |
| 15 Years | 59 (18.4%) | 0 (0.0%) |
| 16 and 17 Years | 66 (16.6%) | 67 (18.2%) |
| 18 to 24 Years | 206 (21.2%) | 111 (26.1%) |
| 25 to 34 Years | 104 (7.3%) | 134 (7.2%) |
| 35 to 44 Years | 3 (0.2%) | 264 (10.7%) |
| 45 to 54 Years | 74 (4.0%) | 67 (4.0%) |
| 55 to 64 Years | 123 (6.8%) | 152 (8.1%) |
| 65 to 74 Years | 74 (6.4%) | 71 (5.3%) |
| 75 Years and over | 48 (7.6%) | 22 (2.5%) |
| Total | 875 (7.3%) | 1,048 (8.1%) |
Income Above Poverty by Sex and Age in Mauldin
According to the poverty statistics in Mauldin, males aged 5 years and females aged 5 years are the age groups that are most secure financially, with 100.0% of males and 100.0% of females in these age groups living above the poverty line.
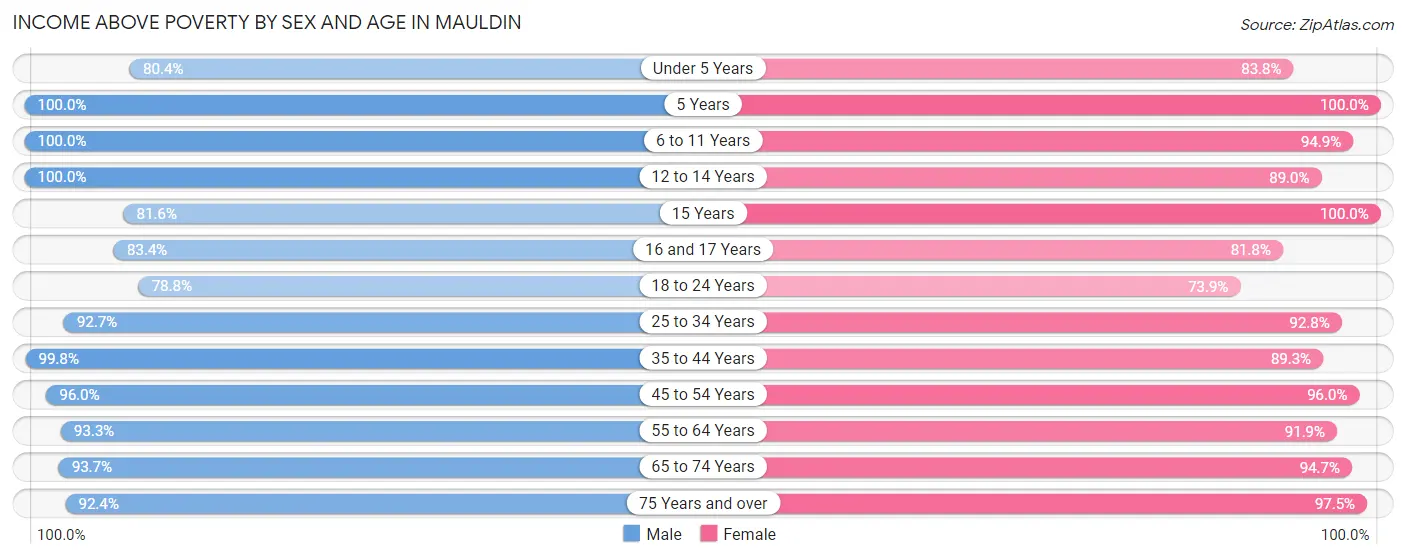
| Age Bracket | Male | Female |
| Under 5 Years | 484 (80.4%) | 362 (83.8%) |
| 5 Years | 140 (100.0%) | 206 (100.0%) |
| 6 to 11 Years | 472 (100.0%) | 817 (94.9%) |
| 12 to 14 Years | 546 (100.0%) | 372 (89.0%) |
| 15 Years | 262 (81.6%) | 99 (100.0%) |
| 16 and 17 Years | 332 (83.4%) | 302 (81.8%) |
| 18 to 24 Years | 766 (78.8%) | 315 (73.9%) |
| 25 to 34 Years | 1,321 (92.7%) | 1,716 (92.8%) |
| 35 to 44 Years | 1,634 (99.8%) | 2,203 (89.3%) |
| 45 to 54 Years | 1,757 (96.0%) | 1,627 (96.0%) |
| 55 to 64 Years | 1,700 (93.2%) | 1,723 (91.9%) |
| 65 to 74 Years | 1,092 (93.6%) | 1,259 (94.7%) |
| 75 Years and over | 583 (92.4%) | 848 (97.5%) |
| Total | 11,089 (92.7%) | 11,849 (91.9%) |
Income Below Poverty Among Married-Couple Families in Mauldin
The poverty statistics for married-couple families in Mauldin show that 2.6% or 135 of the total 5,214 families live below the poverty line. Families with no children have the highest poverty rate of 3.3%, comprising of 109 families. On the other hand, families with 3 or 4 children have the lowest poverty rate of 0.0%, which includes 0 families.
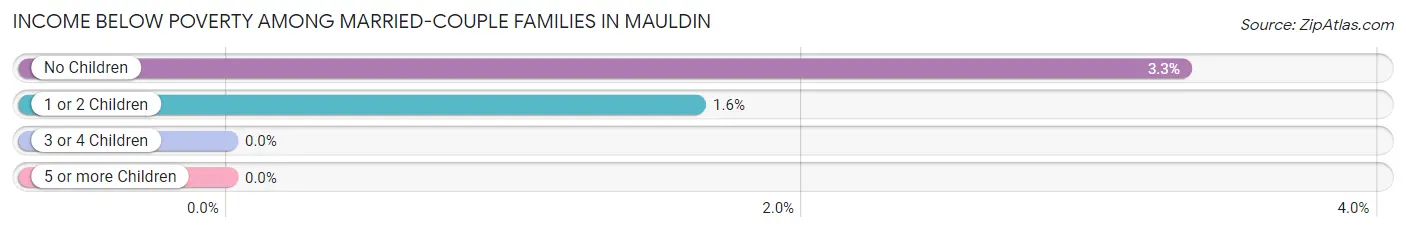
| Children | Above Poverty | Below Poverty |
| No Children | 3,179 (96.7%) | 109 (3.3%) |
| 1 or 2 Children | 1,569 (98.4%) | 26 (1.6%) |
| 3 or 4 Children | 318 (100.0%) | 0 (0.0%) |
| 5 or more Children | 13 (100.0%) | 0 (0.0%) |
| Total | 5,079 (97.4%) | 135 (2.6%) |
Income Below Poverty Among Single-Parent Households in Mauldin
According to the poverty data in Mauldin, 24.6% or 112 single-father households and 11.1% or 150 single-mother households are living below the poverty line. Among single-father households, those with 1 or 2 children have the highest poverty rate, with 112 households (32.8%) experiencing poverty. Likewise, among single-mother households, those with 1 or 2 children have the highest poverty rate, with 129 households (17.3%) falling below the poverty line.
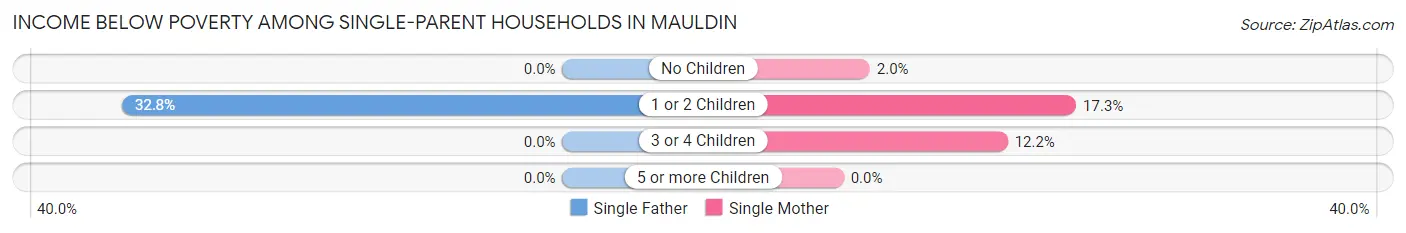
| Children | Single Father | Single Mother |
| No Children | 0 (0.0%) | 10 (1.9%) |
| 1 or 2 Children | 112 (32.8%) | 129 (17.3%) |
| 3 or 4 Children | 0 (0.0%) | 11 (12.2%) |
| 5 or more Children | 0 (0.0%) | 0 (0.0%) |
| Total | 112 (24.6%) | 150 (11.1%) |
Income Below Poverty Among Married-Couple vs Single-Parent Households in Mauldin
The poverty data for Mauldin shows that 135 of the married-couple family households (2.6%) and 262 of the single-parent households (14.5%) are living below the poverty level. Within the married-couple family households, those with no children have the highest poverty rate, with 109 households (3.3%) falling below the poverty line. Among the single-parent households, those with 1 or 2 children have the highest poverty rate, with 241 household (22.2%) living below poverty.
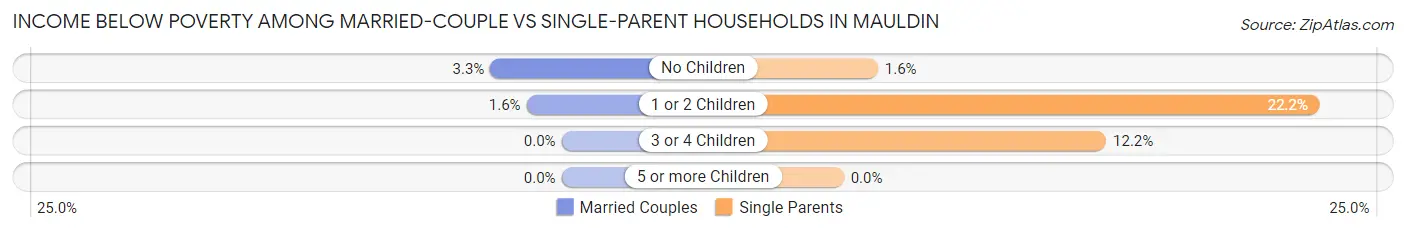
| Children | Married-Couple Families | Single-Parent Households |
| No Children | 109 (3.3%) | 10 (1.6%) |
| 1 or 2 Children | 26 (1.6%) | 241 (22.2%) |
| 3 or 4 Children | 0 (0.0%) | 11 (12.2%) |
| 5 or more Children | 0 (0.0%) | 0 (0.0%) |
| Total | 135 (2.6%) | 262 (14.5%) |
Race in Mauldin
The most populous races in Mauldin are White / Caucasian (15,839 | 62.7%), Black / African American (6,170 | 24.4%), and Hispanic or Latino (2,750 | 10.9%).
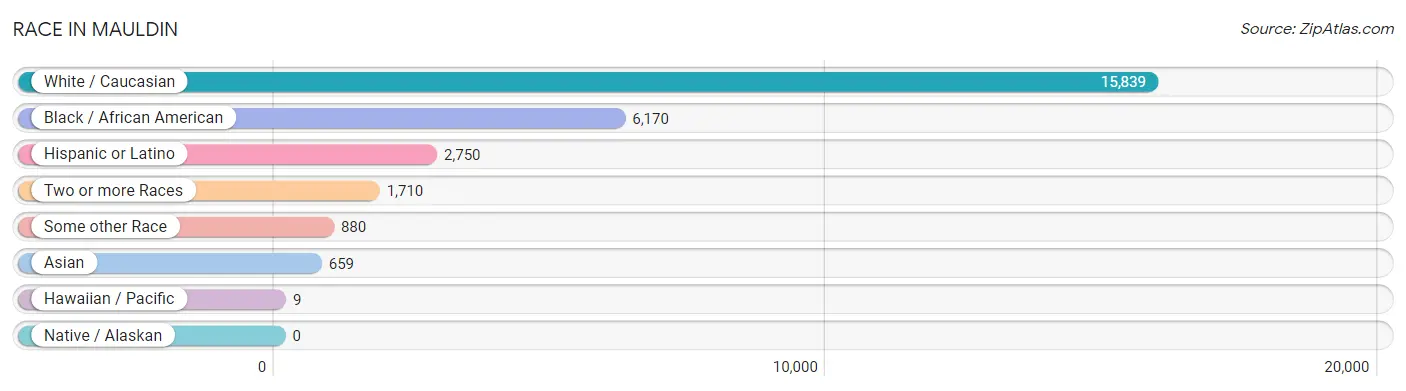
| Race | # Population | % Population |
| Asian | 659 | 2.6% |
| Black / African American | 6,170 | 24.4% |
| Hawaiian / Pacific | 9 | 0.0% |
| Hispanic or Latino | 2,750 | 10.9% |
| Native / Alaskan | 0 | 0.0% |
| White / Caucasian | 15,839 | 62.7% |
| Two or more Races | 1,710 | 6.8% |
| Some other Race | 880 | 3.5% |
| Total | 25,267 | 100.0% |
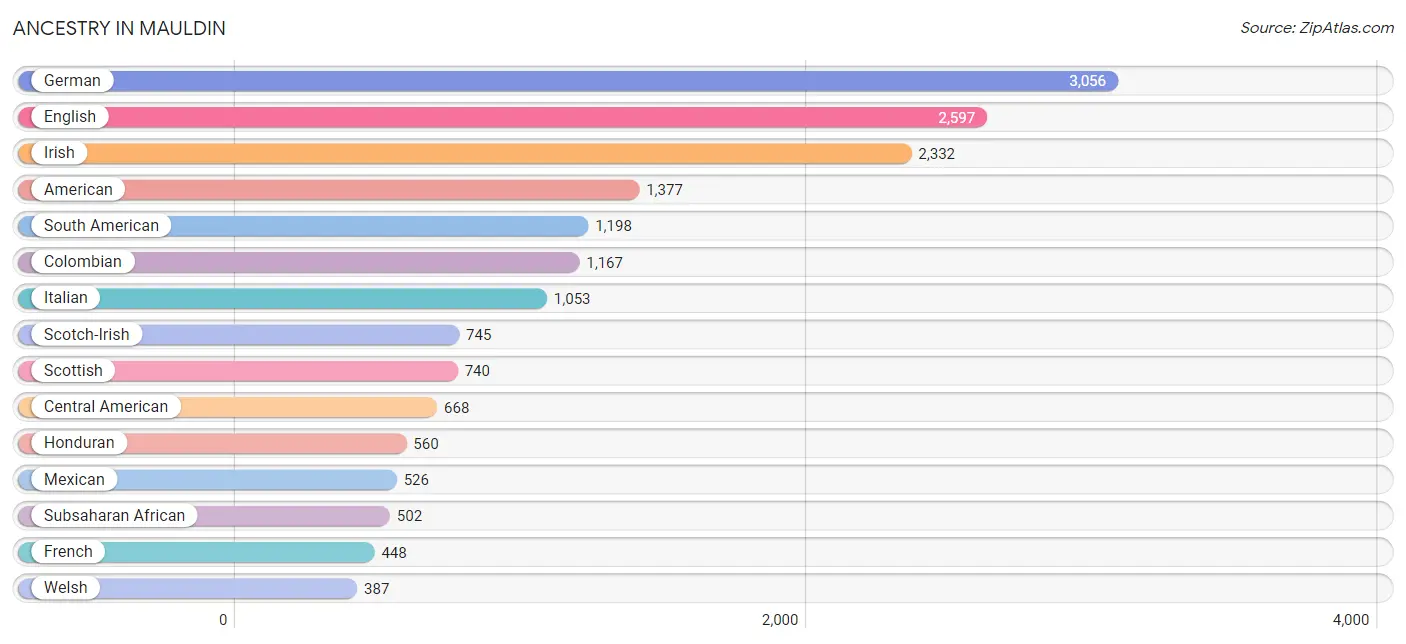
Ancestry in Mauldin
The most populous ancestries reported in Mauldin are German (3,056 | 12.1%), English (2,597 | 10.3%), Irish (2,332 | 9.2%), American (1,377 | 5.4%), and South American (1,198 | 4.7%), together accounting for 41.8% of all Mauldin residents.
| Ancestry | # Population | % Population |
| African | 297 | 1.2% |
| Albanian | 12 | 0.1% |
| American | 1,377 | 5.4% |
| Arab | 62 | 0.3% |
| Australian | 7 | 0.0% |
| Austrian | 58 | 0.2% |
| Bhutanese | 135 | 0.5% |
| Brazilian | 32 | 0.1% |
| British | 261 | 1.0% |
| Canadian | 45 | 0.2% |
| Central American | 668 | 2.6% |
| Central American Indian | 17 | 0.1% |
| Colombian | 1,167 | 4.6% |
| Cuban | 44 | 0.2% |
| Cypriot | 9 | 0.0% |
| Czech | 40 | 0.2% |
| Danish | 16 | 0.1% |
| Delaware | 13 | 0.1% |
| Dominican | 79 | 0.3% |
| Dutch | 205 | 0.8% |
| Eastern European | 24 | 0.1% |
| Egyptian | 31 | 0.1% |
| English | 2,597 | 10.3% |
| European | 285 | 1.1% |
| French | 448 | 1.8% |
| French Canadian | 171 | 0.7% |
| German | 3,056 | 12.1% |
| Greek | 31 | 0.1% |
| Guamanian / Chamorro | 9 | 0.0% |
| Guatemalan | 12 | 0.1% |
| Honduran | 560 | 2.2% |
| Hungarian | 153 | 0.6% |
| Indian (Asian) | 56 | 0.2% |
| Iranian | 46 | 0.2% |
| Irish | 2,332 | 9.2% |
| Israeli | 20 | 0.1% |
| Italian | 1,053 | 4.2% |
| Jamaican | 70 | 0.3% |
| Korean | 171 | 0.7% |
| Latvian | 182 | 0.7% |
| Lebanese | 16 | 0.1% |
| Lithuanian | 22 | 0.1% |
| Mexican | 526 | 2.1% |
| Navajo | 9 | 0.0% |
| Nigerian | 182 | 0.7% |
| Norwegian | 101 | 0.4% |
| Peruvian | 31 | 0.1% |
| Polish | 369 | 1.5% |
| Portuguese | 16 | 0.1% |
| Pueblo | 5 | 0.0% |
| Puerto Rican | 199 | 0.8% |
| Romanian | 50 | 0.2% |
| Russian | 38 | 0.2% |
| Salvadoran | 96 | 0.4% |
| Scandinavian | 125 | 0.5% |
| Scotch-Irish | 745 | 2.9% |
| Scottish | 740 | 2.9% |
| Serbian | 21 | 0.1% |
| Slavic | 16 | 0.1% |
| Slovene | 11 | 0.0% |
| South American | 1,198 | 4.7% |
| Sri Lankan | 63 | 0.3% |
| Subsaharan African | 502 | 2.0% |
| Swedish | 224 | 0.9% |
| Swiss | 68 | 0.3% |
| Thai | 370 | 1.5% |
| Trinidadian and Tobagonian | 30 | 0.1% |
| Ukrainian | 17 | 0.1% |
| Ute | 5 | 0.0% |
| Welsh | 387 | 1.5% |
| West Indian | 30 | 0.1% | View All 71 Rows |
Immigrants in Mauldin
The most numerous immigrant groups reported in Mauldin came from Latin America (1,173 | 4.6%), Central America (742 | 2.9%), Asia (671 | 2.7%), Honduras (465 | 1.8%), and South America (399 | 1.6%), together accounting for 13.7% of all Mauldin residents.
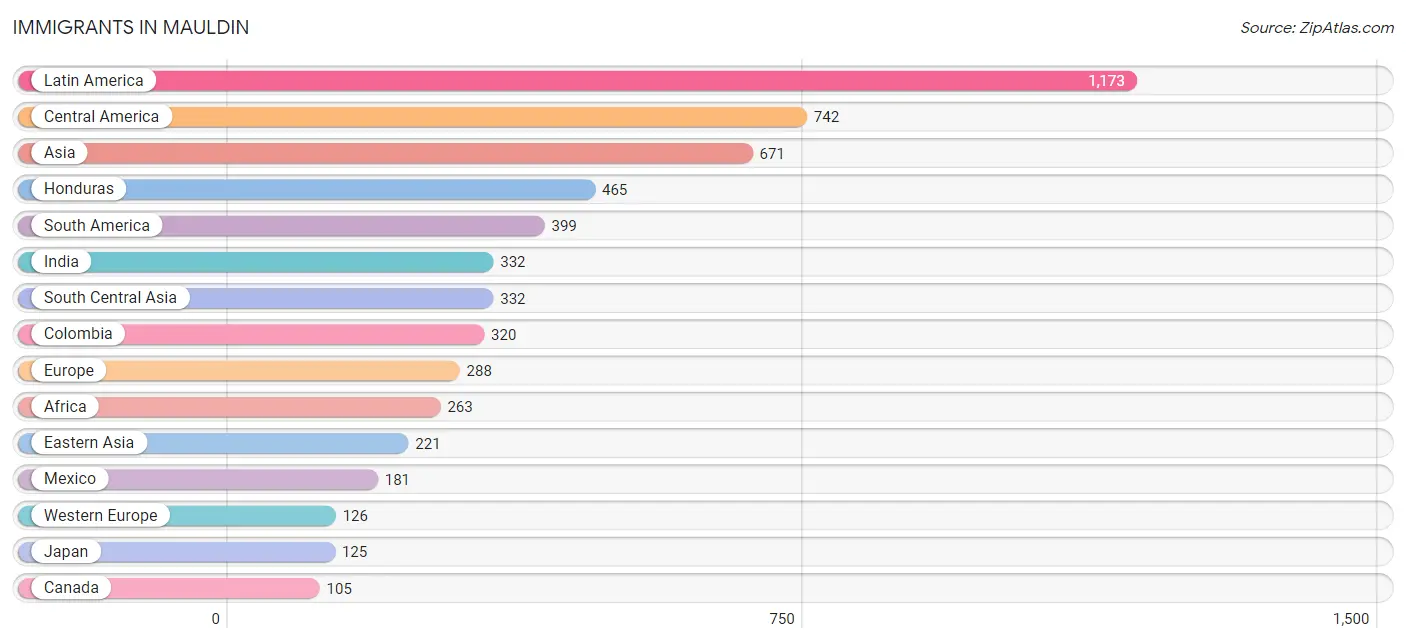
| Immigration Origin | # Population | % Population |
| Africa | 263 | 1.0% |
| Asia | 671 | 2.7% |
| Brazil | 46 | 0.2% |
| Canada | 105 | 0.4% |
| Caribbean | 32 | 0.1% |
| Central America | 742 | 2.9% |
| China | 50 | 0.2% |
| Colombia | 320 | 1.3% |
| Congo | 55 | 0.2% |
| Cuba | 32 | 0.1% |
| Czechoslovakia | 18 | 0.1% |
| Eastern Africa | 38 | 0.2% |
| Eastern Asia | 221 | 0.9% |
| Eastern Europe | 57 | 0.2% |
| Egypt | 38 | 0.2% |
| El Salvador | 96 | 0.4% |
| England | 45 | 0.2% |
| Europe | 288 | 1.1% |
| France | 35 | 0.1% |
| Germany | 91 | 0.4% |
| Honduras | 465 | 1.8% |
| Hong Kong | 12 | 0.1% |
| India | 332 | 1.3% |
| Israel | 20 | 0.1% |
| Italy | 7 | 0.0% |
| Japan | 125 | 0.5% |
| Korea | 46 | 0.2% |
| Latin America | 1,173 | 4.6% |
| Mexico | 181 | 0.7% |
| Middle Africa | 91 | 0.4% |
| Nigeria | 96 | 0.4% |
| Northern Africa | 38 | 0.2% |
| Northern Europe | 98 | 0.4% |
| Peru | 31 | 0.1% |
| Philippines | 57 | 0.2% |
| Romania | 26 | 0.1% |
| South America | 399 | 1.6% |
| South Central Asia | 332 | 1.3% |
| South Eastern Asia | 89 | 0.4% |
| Southern Europe | 7 | 0.0% |
| Ukraine | 13 | 0.1% |
| Venezuela | 2 | 0.0% |
| Vietnam | 32 | 0.1% |
| Western Africa | 96 | 0.4% |
| Western Asia | 29 | 0.1% |
| Western Europe | 126 | 0.5% | View All 46 Rows |
Sex and Age in Mauldin
Sex and Age in Mauldin
The most populous age groups in Mauldin are 40 to 44 Years (1,118 | 9.1%) for men and 40 to 44 Years (1,409 | 10.8%) for women.
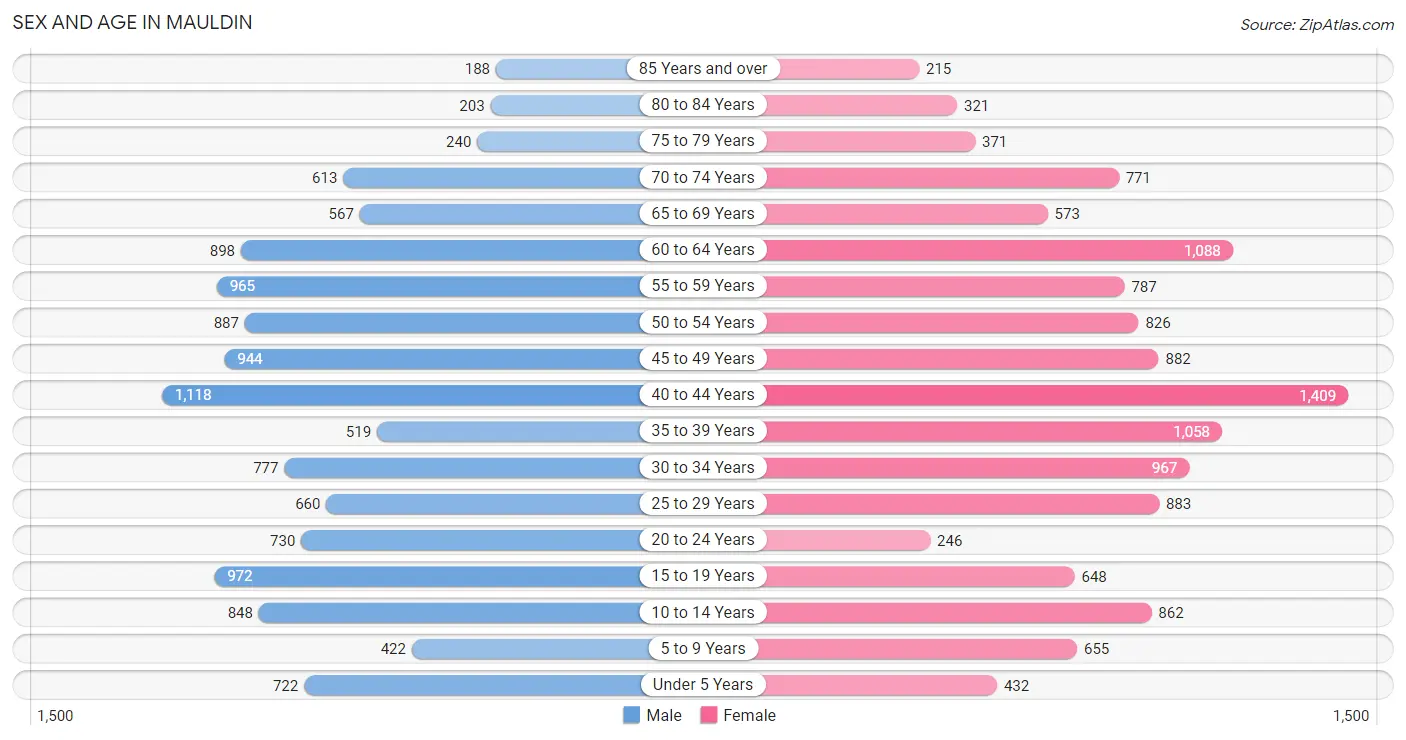
| Age Bracket | Male | Female |
| Under 5 Years | 722 (5.9%) | 432 (3.3%) |
| 5 to 9 Years | 422 (3.4%) | 655 (5.0%) |
| 10 to 14 Years | 848 (6.9%) | 862 (6.6%) |
| 15 to 19 Years | 972 (7.9%) | 648 (5.0%) |
| 20 to 24 Years | 730 (5.9%) | 246 (1.9%) |
| 25 to 29 Years | 660 (5.4%) | 883 (6.8%) |
| 30 to 34 Years | 777 (6.3%) | 967 (7.4%) |
| 35 to 39 Years | 519 (4.2%) | 1,058 (8.1%) |
| 40 to 44 Years | 1,118 (9.1%) | 1,409 (10.8%) |
| 45 to 49 Years | 944 (7.7%) | 882 (6.8%) |
| 50 to 54 Years | 887 (7.2%) | 826 (6.4%) |
| 55 to 59 Years | 965 (7.9%) | 787 (6.1%) |
| 60 to 64 Years | 898 (7.3%) | 1,088 (8.4%) |
| 65 to 69 Years | 567 (4.6%) | 573 (4.4%) |
| 70 to 74 Years | 613 (5.0%) | 771 (5.9%) |
| 75 to 79 Years | 240 (2.0%) | 371 (2.9%) |
| 80 to 84 Years | 203 (1.7%) | 321 (2.5%) |
| 85 Years and over | 188 (1.5%) | 215 (1.7%) |
| Total | 12,273 (100.0%) | 12,994 (100.0%) |
Families and Households in Mauldin
Median Family Size in Mauldin
The median family size in Mauldin is 2.81 persons per family, with married-couple families (5,214 | 74.3%) accounting for the largest median family size of 2.89 persons per family. On the other hand, single male/father families (456 | 6.5%) represent the smallest median family size with 2.56 persons per family.
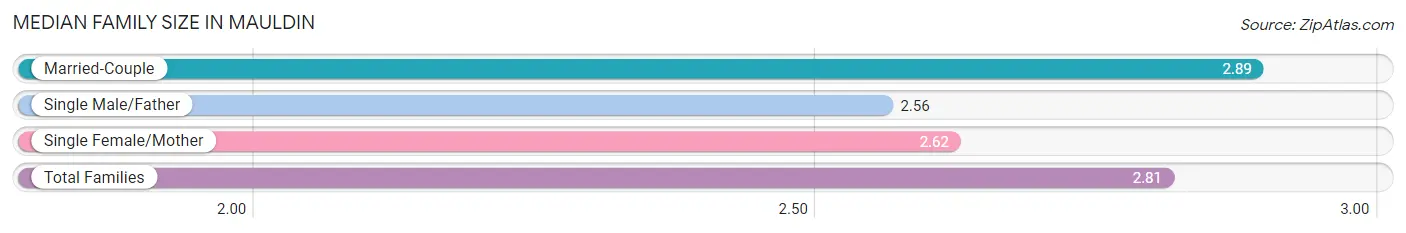
| Family Type | # Families | Family Size |
| Married-Couple | 5,214 (74.3%) | 2.89 |
| Single Male/Father | 456 (6.5%) | 2.56 |
| Single Female/Mother | 1,349 (19.2%) | 2.62 |
| Total Families | 7,019 (100.0%) | 2.81 |
Median Household Size in Mauldin
The median household size in Mauldin is 2.35 persons per household, with single male/father households (456 | 4.3%) accounting for the largest median household size of 3.4 persons per household. non-family households (3,657 | 34.3%) represent the smallest median household size with 1.27 persons per household.
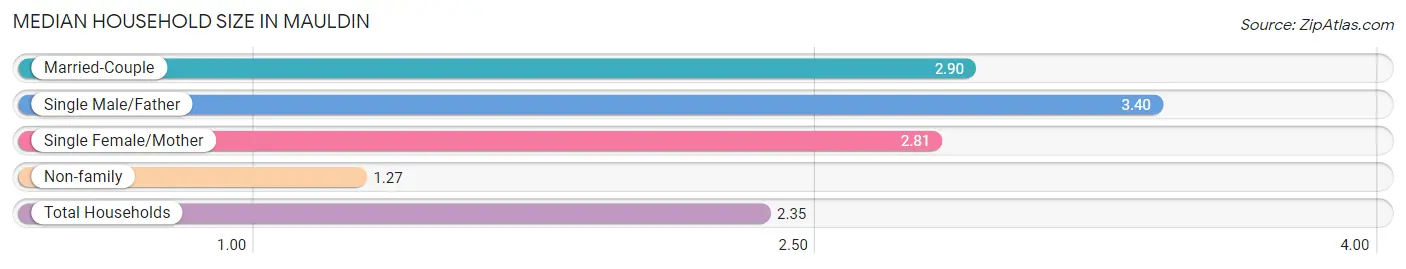
| Household Type | # Households | Household Size |
| Married-Couple | 5,214 (48.8%) | 2.90 |
| Single Male/Father | 456 (4.3%) | 3.40 |
| Single Female/Mother | 1,349 (12.6%) | 2.81 |
| Non-family | 3,657 (34.3%) | 1.27 |
| Total Households | 10,676 (100.0%) | 2.35 |
Household Size by Marriage Status in Mauldin
Out of a total of 10,676 households in Mauldin, 7,019 (65.7%) are family households, while 3,657 (34.3%) are nonfamily households. The most numerous type of family households are 2-person households, comprising 3,604, and the most common type of nonfamily households are 1-person households, comprising 3,003.
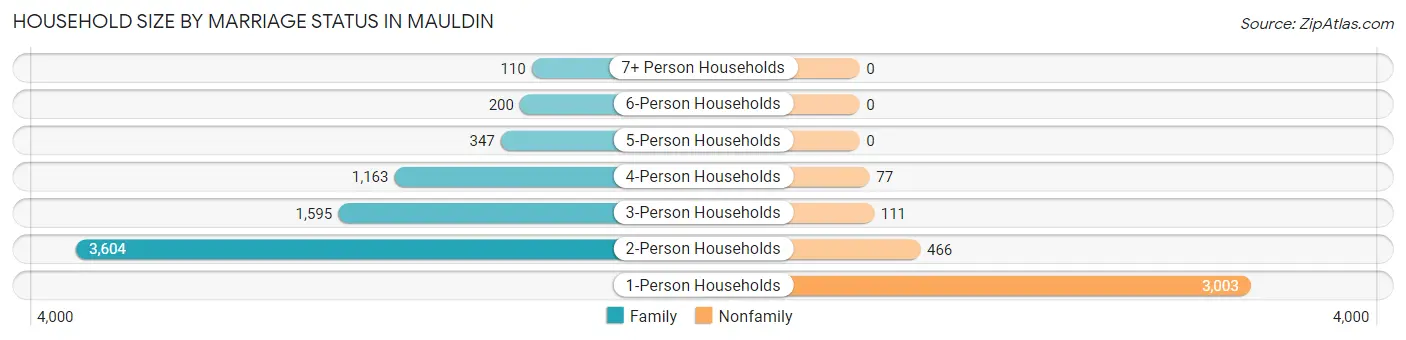
| Household Size | Family Households | Nonfamily Households |
| 1-Person Households | - | 3,003 (28.1%) |
| 2-Person Households | 3,604 (33.8%) | 466 (4.4%) |
| 3-Person Households | 1,595 (14.9%) | 111 (1.0%) |
| 4-Person Households | 1,163 (10.9%) | 77 (0.7%) |
| 5-Person Households | 347 (3.3%) | 0 (0.0%) |
| 6-Person Households | 200 (1.9%) | 0 (0.0%) |
| 7+ Person Households | 110 (1.0%) | 0 (0.0%) |
| Total | 7,019 (65.7%) | 3,657 (34.3%) |
Female Fertility in Mauldin
Fertility by Age in Mauldin
Average fertility rate in Mauldin is 23.0 births per 1,000 women. Women in the age bracket of 35 to 50 years have the highest fertility rate with 37.0 births per 1,000 women. Women in the age bracket of 35 to 50 years acount for 91.1% of all women with births.
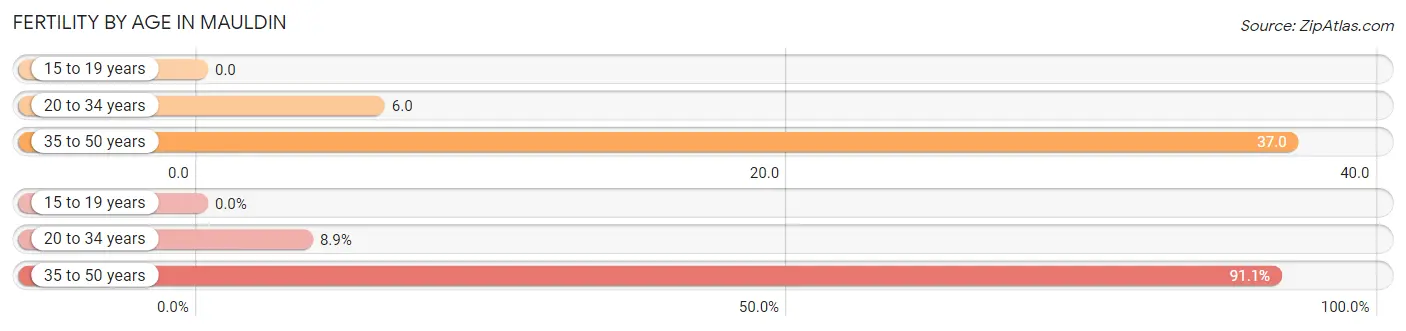
| Age Bracket | Women with Births | Births / 1,000 Women |
| 15 to 19 years | 0 (0.0%) | 0.0 |
| 20 to 34 years | 13 (8.9%) | 6.0 |
| 35 to 50 years | 133 (91.1%) | 37.0 |
| Total | 146 (100.0%) | 23.0 |
Fertility by Age by Marriage Status in Mauldin
88.4% of women with births (146) in Mauldin are married. The highest percentage of unmarried women with births falls into 35 to 50 years age bracket with 12.8% of them unmarried at the time of birth, while the lowest percentage of unmarried women with births belong to 20 to 34 years age bracket with 0.0% of them unmarried.
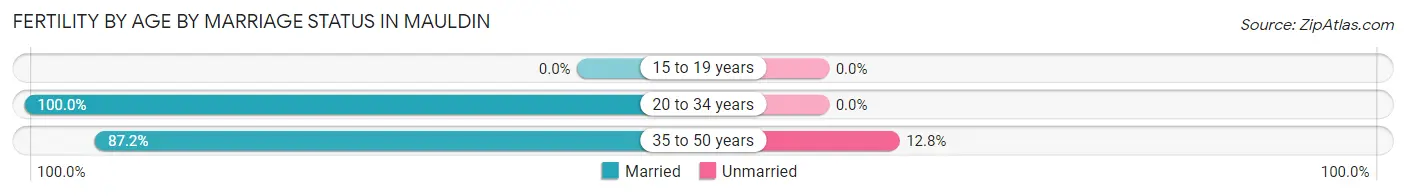
| Age Bracket | Married | Unmarried |
| 15 to 19 years | 0 (0.0%) | 0 (0.0%) |
| 20 to 34 years | 13 (100.0%) | 0 (0.0%) |
| 35 to 50 years | 116 (87.2%) | 17 (12.8%) |
| Total | 129 (88.4%) | 17 (11.6%) |
Fertility by Education in Mauldin
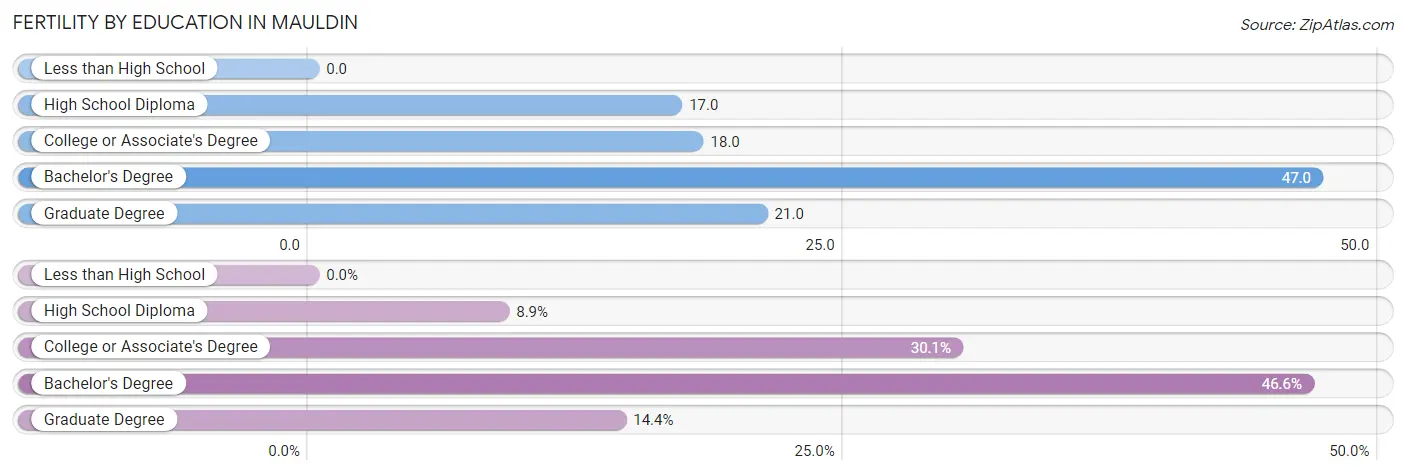
| Educational Attainment | Women with Births | Births / 1,000 Women |
| Less than High School | 0 (0.0%) | 0.0 |
| High School Diploma | 13 (8.9%) | 17.0 |
| College or Associate's Degree | 44 (30.1%) | 18.0 |
| Bachelor's Degree | 68 (46.6%) | 47.0 |
| Graduate Degree | 21 (14.4%) | 21.0 |
| Total | 146 (100.0%) | 23.0 |
Fertility by Education by Marriage Status in Mauldin
11.6% of women with births in Mauldin are unmarried. Women with the educational attainment of high school diploma are most likely to be married with 100.0% of them married at childbirth, while women with the educational attainment of college or associate's degree are least likely to be married with 38.6% of them unmarried at childbirth.
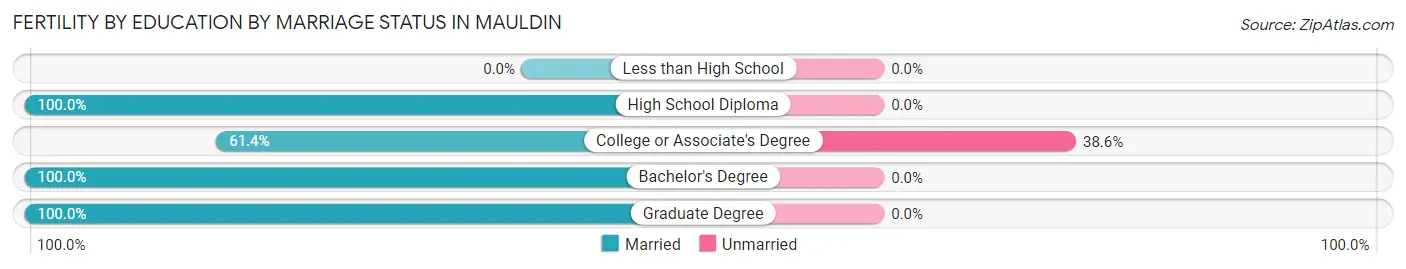
| Educational Attainment | Married | Unmarried |
| Less than High School | 0 (0.0%) | 0 (0.0%) |
| High School Diploma | 13 (100.0%) | 0 (0.0%) |
| College or Associate's Degree | 27 (61.4%) | 17 (38.6%) |
| Bachelor's Degree | 68 (100.0%) | 0 (0.0%) |
| Graduate Degree | 21 (100.0%) | 0 (0.0%) |
| Total | 129 (88.4%) | 17 (11.6%) |
Employment Characteristics in Mauldin
Employment by Class of Employer in Mauldin
Among the 13,465 employed individuals in Mauldin, private company employees (9,302 | 69.1%), not-for-profit organizations (1,680 | 12.5%), and state government employees (676 | 5.0%) make up the most common classes of employment.
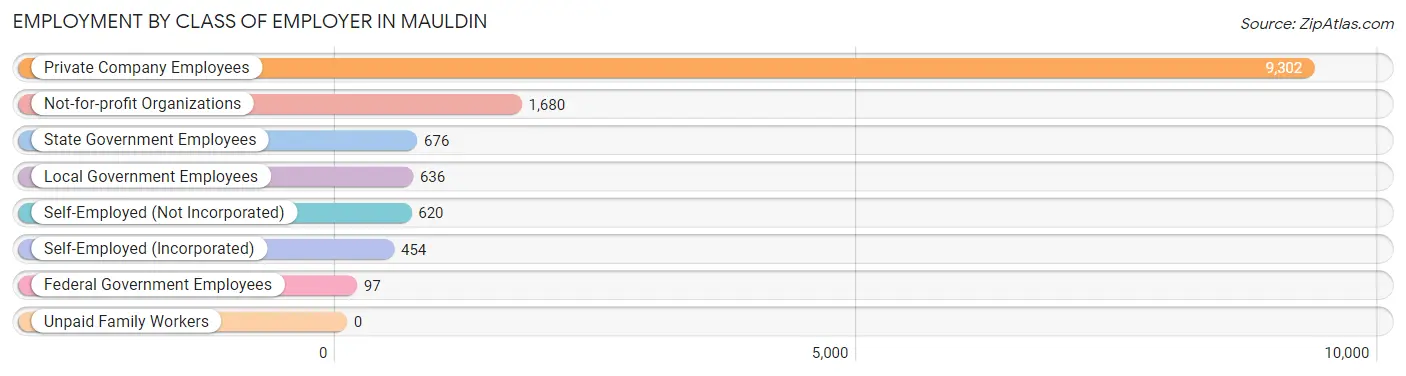
| Employer Class | # Employees | % Employees |
| Private Company Employees | 9,302 | 69.1% |
| Self-Employed (Incorporated) | 454 | 3.4% |
| Self-Employed (Not Incorporated) | 620 | 4.6% |
| Not-for-profit Organizations | 1,680 | 12.5% |
| Local Government Employees | 636 | 4.7% |
| State Government Employees | 676 | 5.0% |
| Federal Government Employees | 97 | 0.7% |
| Unpaid Family Workers | 0 | 0.0% |
| Total | 13,465 | 100.0% |
Employment Status by Age in Mauldin
According to the labor force statistics for Mauldin, out of the total population over 16 years of age (20,903), 69.1% or 14,444 individuals are in the labor force, with 5.0% or 722 of them unemployed. The age group with the highest labor force participation rate is 30 to 34 years, with 89.0% or 1,552 individuals in the labor force. Within the labor force, the 16 to 19 years age range has the highest percentage of unemployed individuals, with 34.0% or 166 of them being unemployed.
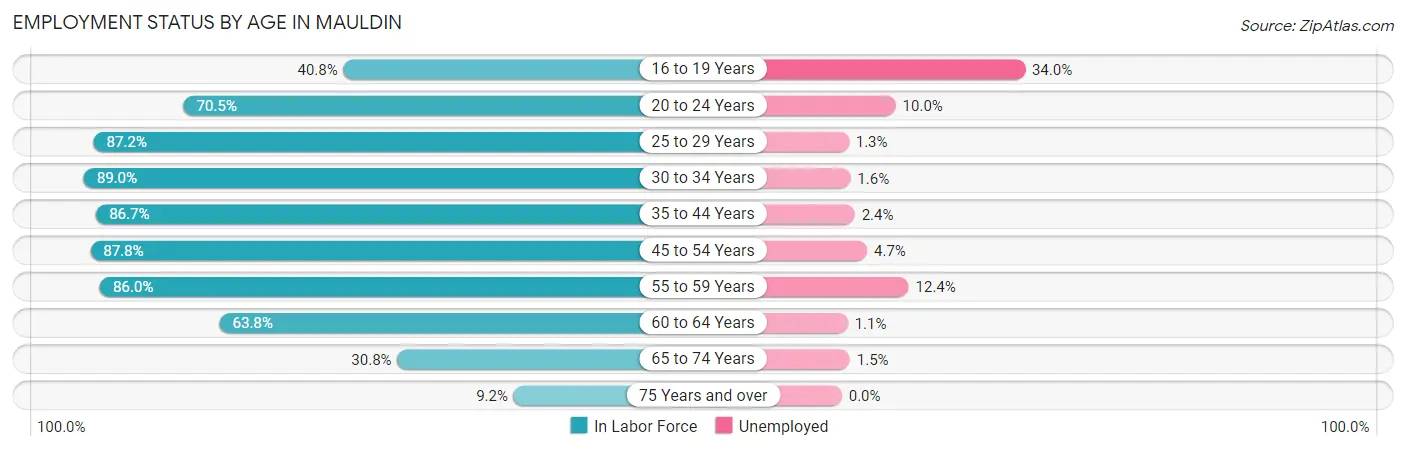
| Age Bracket | In Labor Force | Unemployed |
| 16 to 19 Years | 488 (40.8%) | 166 (34.0%) |
| 20 to 24 Years | 688 (70.5%) | 69 (10.0%) |
| 25 to 29 Years | 1,345 (87.2%) | 17 (1.3%) |
| 30 to 34 Years | 1,552 (89.0%) | 25 (1.6%) |
| 35 to 44 Years | 3,558 (86.7%) | 85 (2.4%) |
| 45 to 54 Years | 3,107 (87.8%) | 146 (4.7%) |
| 55 to 59 Years | 1,507 (86.0%) | 187 (12.4%) |
| 60 to 64 Years | 1,267 (63.8%) | 14 (1.1%) |
| 65 to 74 Years | 777 (30.8%) | 12 (1.5%) |
| 75 Years and over | 141 (9.2%) | 0 (0.0%) |
| Total | 14,444 (69.1%) | 722 (5.0%) |
Employment Status by Educational Attainment in Mauldin
According to labor force statistics for Mauldin, 84.1% of individuals (12,336) out of the total population between 25 and 64 years of age (14,668) are in the labor force, with 3.8% or 469 of them being unemployed. The group with the highest labor force participation rate are those with the educational attainment of bachelor's degree or higher, with 91.5% or 5,260 individuals in the labor force. Within the labor force, individuals with less than high school education have the highest percentage of unemployment, with 15.5% or 75 of them being unemployed.
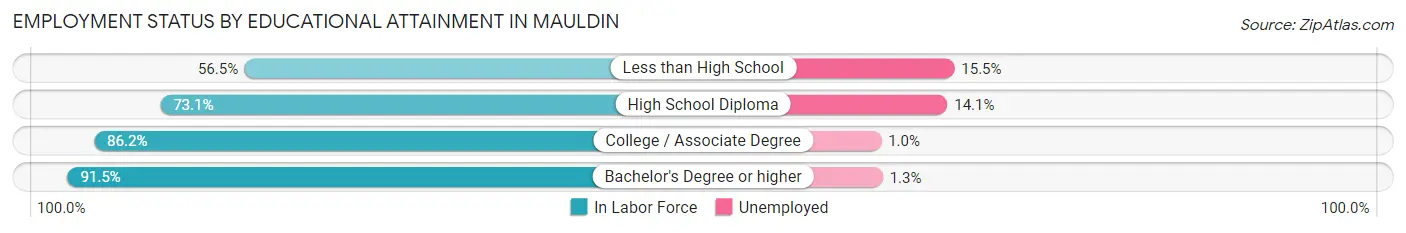
| Educational Attainment | In Labor Force | Unemployed |
| Less than High School | 484 (56.5%) | 133 (15.5%) |
| High School Diploma | 1,980 (73.1%) | 382 (14.1%) |
| College / Associate Degree | 4,614 (86.2%) | 54 (1.0%) |
| Bachelor's Degree or higher | 5,260 (91.5%) | 75 (1.3%) |
| Total | 12,336 (84.1%) | 557 (3.8%) |
Employment Occupations by Sex in Mauldin
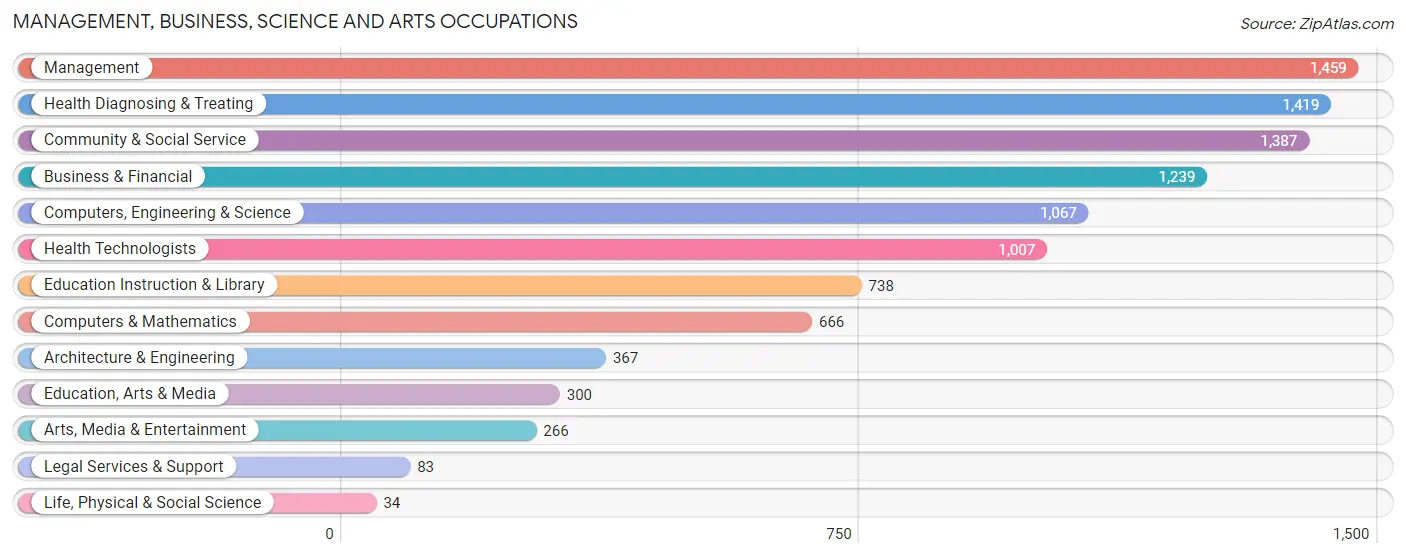
Management, Business, Science and Arts Occupations
The most common Management, Business, Science and Arts occupations in Mauldin are Management (1,459 | 10.6%), Health Diagnosing & Treating (1,419 | 10.3%), Community & Social Service (1,387 | 10.1%), Business & Financial (1,239 | 9.0%), and Computers, Engineering & Science (1,067 | 7.8%).
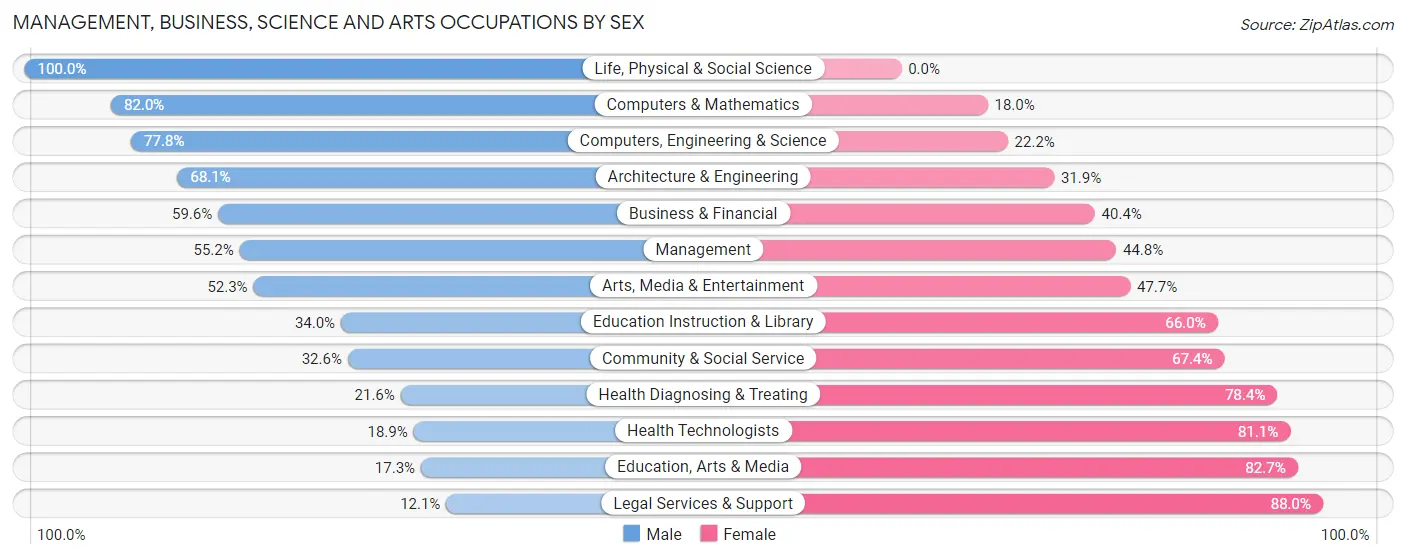
Management, Business, Science and Arts Occupations by Sex
Within the Management, Business, Science and Arts occupations in Mauldin, the most male-oriented occupations are Life, Physical & Social Science (100.0%), Computers & Mathematics (82.0%), and Computers, Engineering & Science (77.8%), while the most female-oriented occupations are Legal Services & Support (87.9%), Education, Arts & Media (82.7%), and Health Technologists (81.1%).
| Occupation | Male | Female |
| Management | 805 (55.2%) | 654 (44.8%) |
| Business & Financial | 739 (59.6%) | 500 (40.4%) |
| Computers, Engineering & Science | 830 (77.8%) | 237 (22.2%) |
| Computers & Mathematics | 546 (82.0%) | 120 (18.0%) |
| Architecture & Engineering | 250 (68.1%) | 117 (31.9%) |
| Life, Physical & Social Science | 34 (100.0%) | 0 (0.0%) |
| Community & Social Service | 452 (32.6%) | 935 (67.4%) |
| Education, Arts & Media | 52 (17.3%) | 248 (82.7%) |
| Legal Services & Support | 10 (12.0%) | 73 (87.9%) |
| Education Instruction & Library | 251 (34.0%) | 487 (66.0%) |
| Arts, Media & Entertainment | 139 (52.3%) | 127 (47.7%) |
| Health Diagnosing & Treating | 306 (21.6%) | 1,113 (78.4%) |
| Health Technologists | 190 (18.9%) | 817 (81.1%) |
| Total (Category) | 3,132 (47.7%) | 3,439 (52.3%) |
| Total (Overall) | 6,886 (50.2%) | 6,822 (49.8%) |
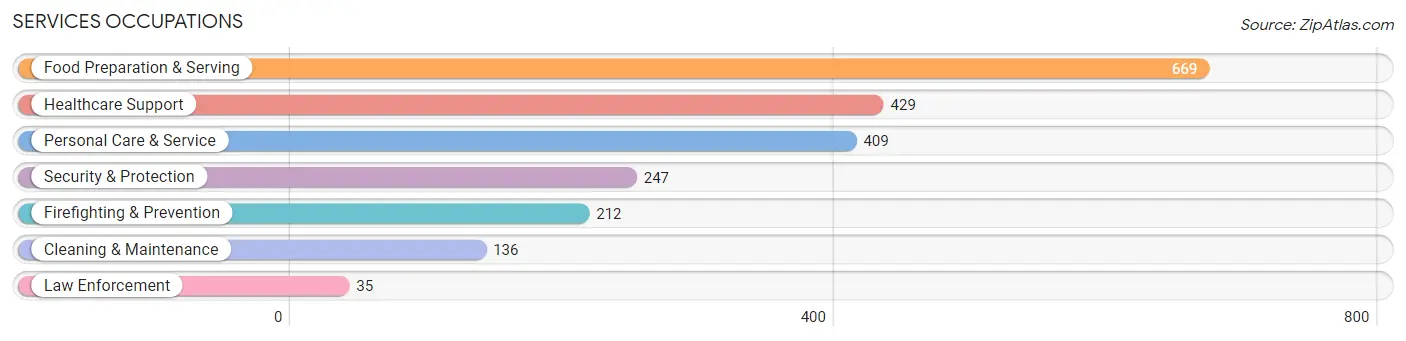
Services Occupations
The most common Services occupations in Mauldin are Food Preparation & Serving (669 | 4.9%), Healthcare Support (429 | 3.1%), Personal Care & Service (409 | 3.0%), Security & Protection (247 | 1.8%), and Firefighting & Prevention (212 | 1.5%).
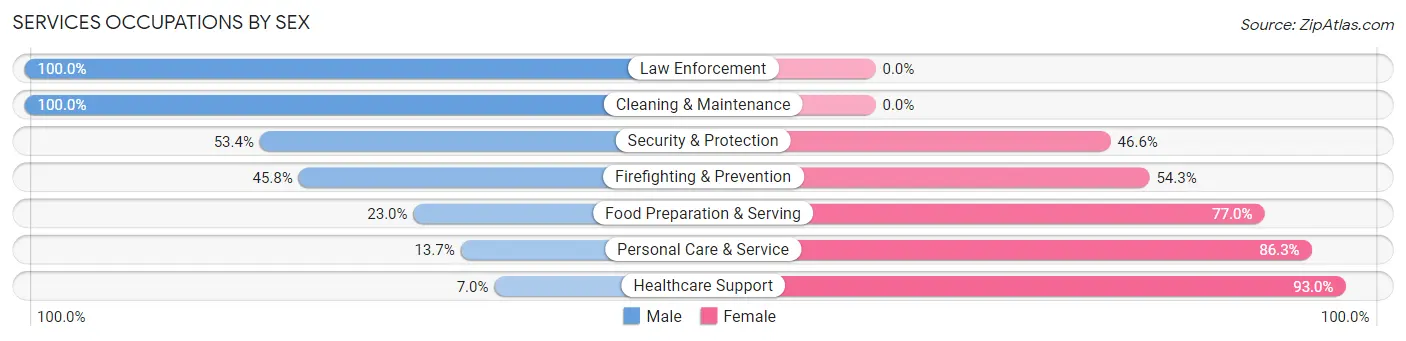
Services Occupations by Sex
Within the Services occupations in Mauldin, the most male-oriented occupations are Law Enforcement (100.0%), Cleaning & Maintenance (100.0%), and Security & Protection (53.4%), while the most female-oriented occupations are Healthcare Support (93.0%), Personal Care & Service (86.3%), and Food Preparation & Serving (77.0%).
| Occupation | Male | Female |
| Healthcare Support | 30 (7.0%) | 399 (93.0%) |
| Security & Protection | 132 (53.4%) | 115 (46.6%) |
| Firefighting & Prevention | 97 (45.8%) | 115 (54.2%) |
| Law Enforcement | 35 (100.0%) | 0 (0.0%) |
| Food Preparation & Serving | 154 (23.0%) | 515 (77.0%) |
| Cleaning & Maintenance | 136 (100.0%) | 0 (0.0%) |
| Personal Care & Service | 56 (13.7%) | 353 (86.3%) |
| Total (Category) | 508 (26.9%) | 1,382 (73.1%) |
| Total (Overall) | 6,886 (50.2%) | 6,822 (49.8%) |
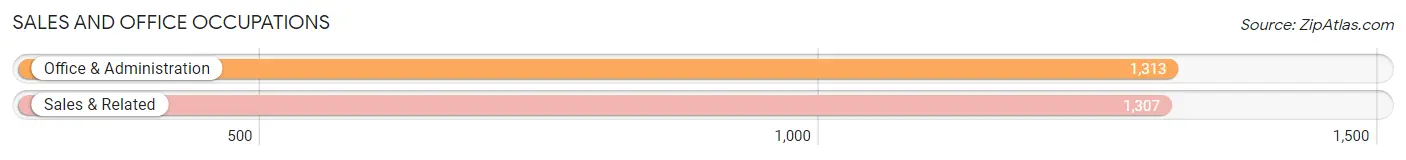
Sales and Office Occupations
The most common Sales and Office occupations in Mauldin are Office & Administration (1,313 | 9.6%), and Sales & Related (1,307 | 9.5%).
Sales and Office Occupations by Sex
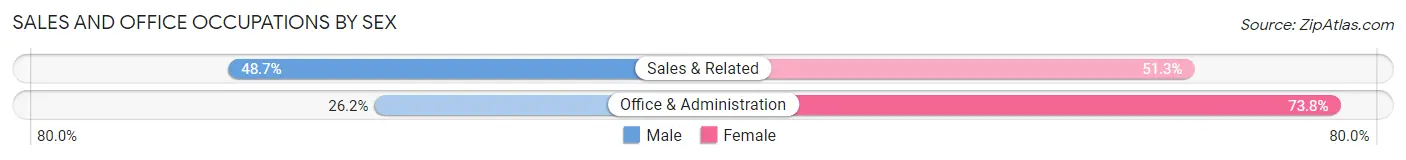
| Occupation | Male | Female |
| Sales & Related | 636 (48.7%) | 671 (51.3%) |
| Office & Administration | 344 (26.2%) | 969 (73.8%) |
| Total (Category) | 980 (37.4%) | 1,640 (62.6%) |
| Total (Overall) | 6,886 (50.2%) | 6,822 (49.8%) |
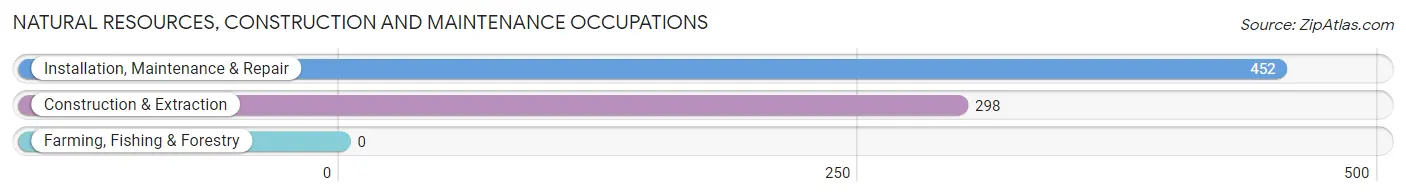
Natural Resources, Construction and Maintenance Occupations
The most common Natural Resources, Construction and Maintenance occupations in Mauldin are Installation, Maintenance & Repair (452 | 3.3%), and Construction & Extraction (298 | 2.2%).
Natural Resources, Construction and Maintenance Occupations by Sex
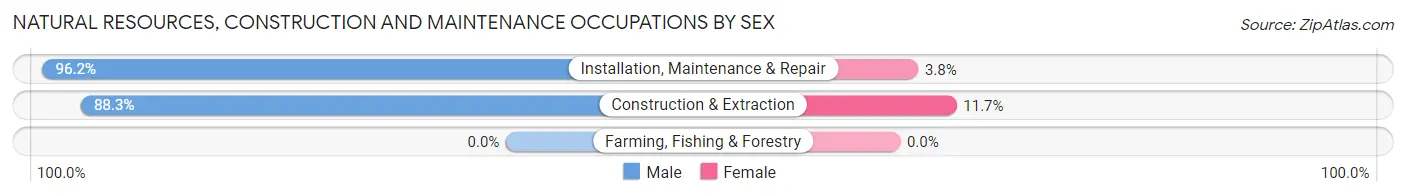
| Occupation | Male | Female |
| Farming, Fishing & Forestry | 0 (0.0%) | 0 (0.0%) |
| Construction & Extraction | 263 (88.3%) | 35 (11.7%) |
| Installation, Maintenance & Repair | 435 (96.2%) | 17 (3.8%) |
| Total (Category) | 698 (93.1%) | 52 (6.9%) |
| Total (Overall) | 6,886 (50.2%) | 6,822 (49.8%) |
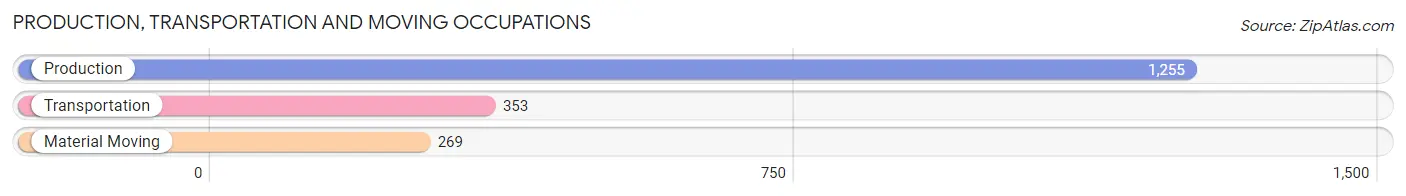
Production, Transportation and Moving Occupations
The most common Production, Transportation and Moving occupations in Mauldin are Production (1,255 | 9.2%), Transportation (353 | 2.6%), and Material Moving (269 | 2.0%).
Production, Transportation and Moving Occupations by Sex
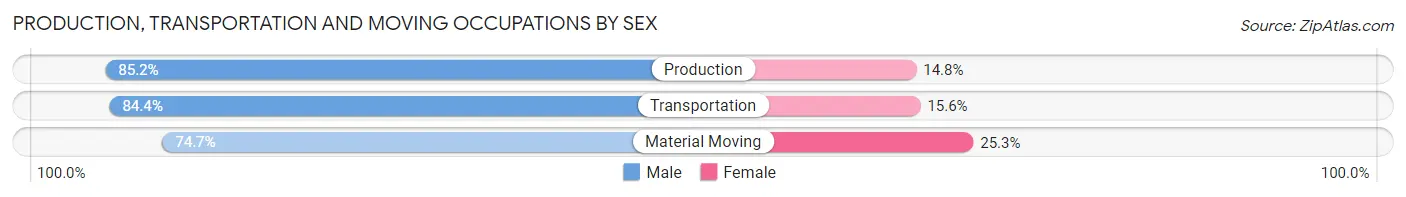
| Occupation | Male | Female |
| Production | 1,069 (85.2%) | 186 (14.8%) |
| Transportation | 298 (84.4%) | 55 (15.6%) |
| Material Moving | 201 (74.7%) | 68 (25.3%) |
| Total (Category) | 1,568 (83.5%) | 309 (16.5%) |
| Total (Overall) | 6,886 (50.2%) | 6,822 (49.8%) |
Employment Industries by Sex in Mauldin
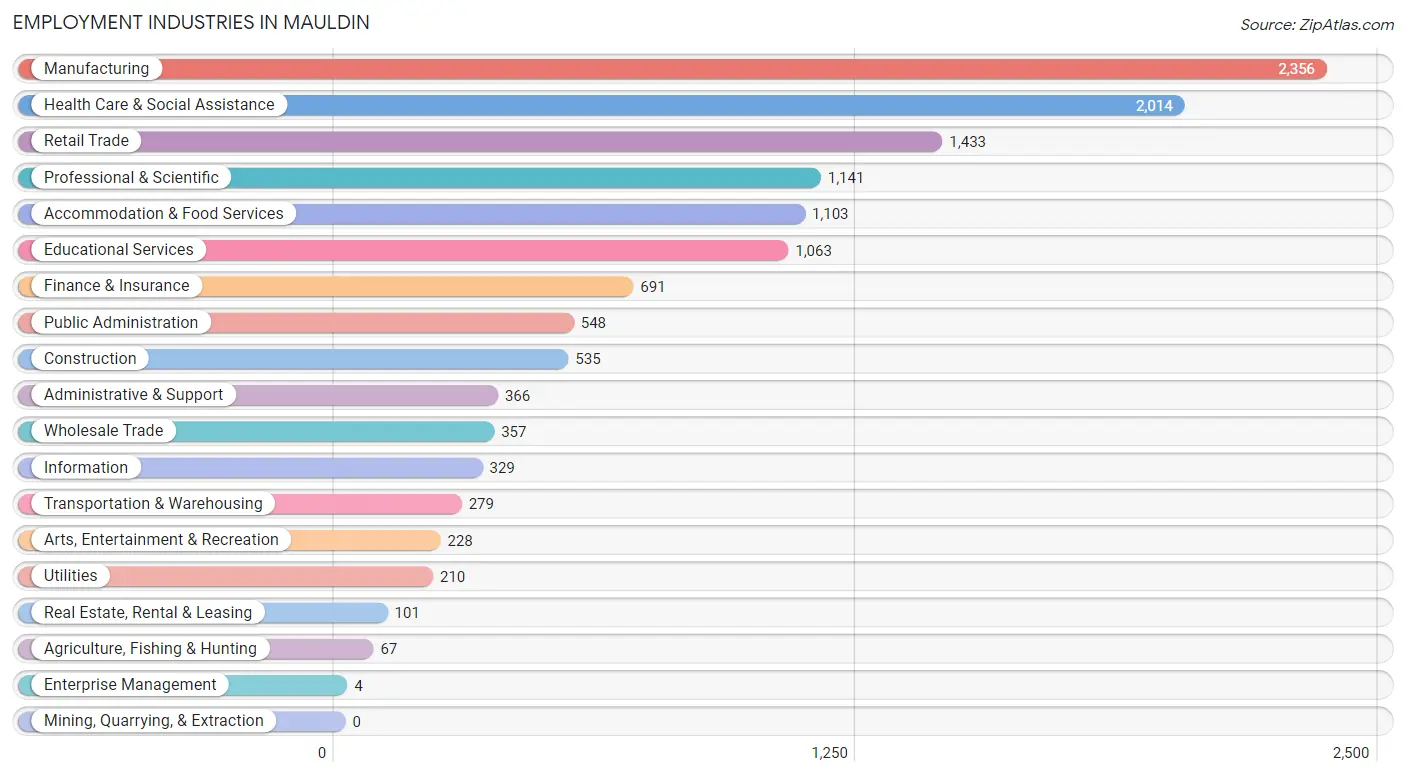
Employment Industries in Mauldin
The major employment industries in Mauldin include Manufacturing (2,356 | 17.2%), Health Care & Social Assistance (2,014 | 14.7%), Retail Trade (1,433 | 10.4%), Professional & Scientific (1,141 | 8.3%), and Accommodation & Food Services (1,103 | 8.1%).
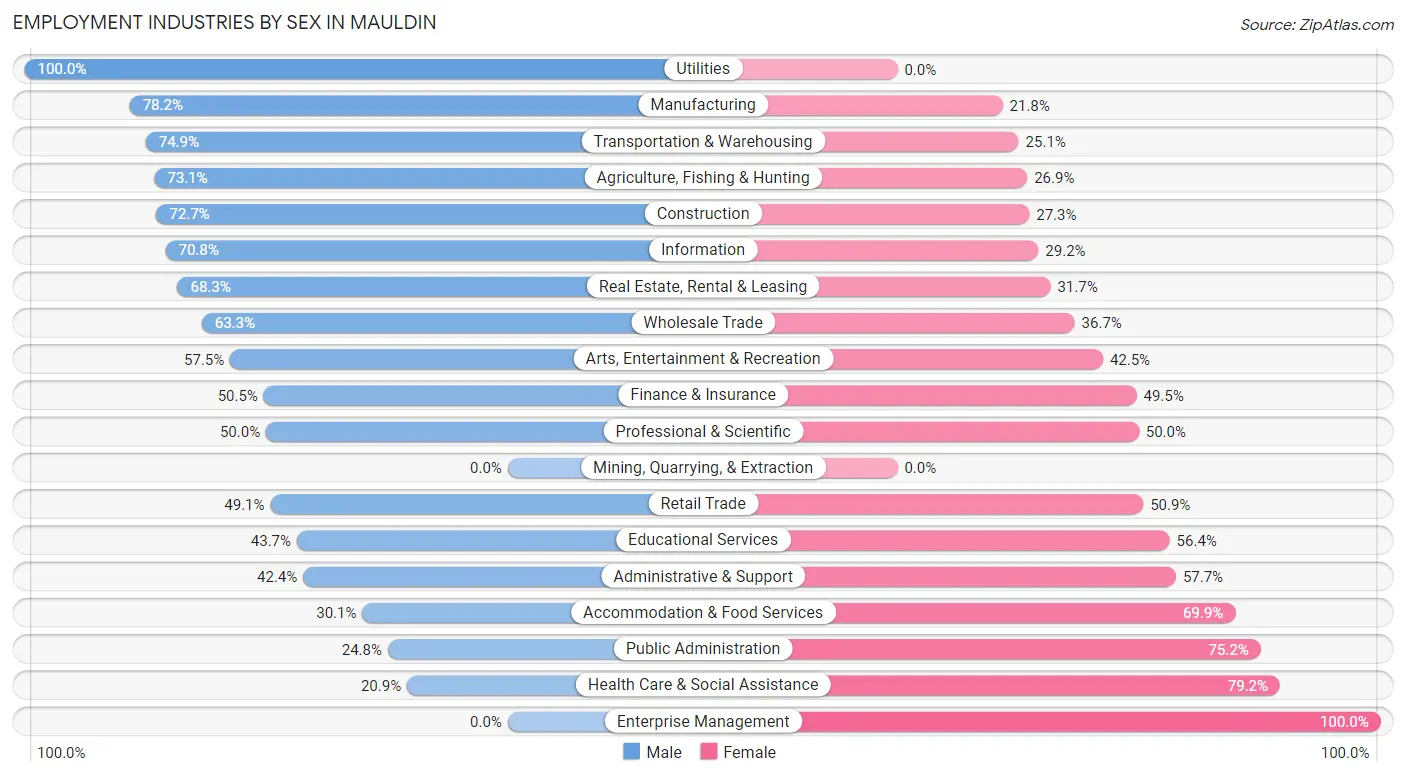
Employment Industries by Sex in Mauldin
The Mauldin industries that see more men than women are Utilities (100.0%), Manufacturing (78.2%), and Transportation & Warehousing (74.9%), whereas the industries that tend to have a higher number of women are Enterprise Management (100.0%), Health Care & Social Assistance (79.1%), and Public Administration (75.2%).
| Industry | Male | Female |
| Agriculture, Fishing & Hunting | 49 (73.1%) | 18 (26.9%) |
| Mining, Quarrying, & Extraction | 0 (0.0%) | 0 (0.0%) |
| Construction | 389 (72.7%) | 146 (27.3%) |
| Manufacturing | 1,843 (78.2%) | 513 (21.8%) |
| Wholesale Trade | 226 (63.3%) | 131 (36.7%) |
| Retail Trade | 704 (49.1%) | 729 (50.9%) |
| Transportation & Warehousing | 209 (74.9%) | 70 (25.1%) |
| Utilities | 210 (100.0%) | 0 (0.0%) |
| Information | 233 (70.8%) | 96 (29.2%) |
| Finance & Insurance | 349 (50.5%) | 342 (49.5%) |
| Real Estate, Rental & Leasing | 69 (68.3%) | 32 (31.7%) |
| Professional & Scientific | 571 (50.0%) | 570 (50.0%) |
| Enterprise Management | 0 (0.0%) | 4 (100.0%) |
| Administrative & Support | 155 (42.3%) | 211 (57.7%) |
| Educational Services | 464 (43.6%) | 599 (56.4%) |
| Health Care & Social Assistance | 420 (20.8%) | 1,594 (79.1%) |
| Arts, Entertainment & Recreation | 131 (57.5%) | 97 (42.5%) |
| Accommodation & Food Services | 332 (30.1%) | 771 (69.9%) |
| Public Administration | 136 (24.8%) | 412 (75.2%) |
| Total | 6,886 (50.2%) | 6,822 (49.8%) |
Education in Mauldin
School Enrollment in Mauldin
The most common levels of schooling among the 5,020 students in Mauldin are high school (1,434 | 28.6%), middle school (1,363 | 27.2%), and college / undergraduate (854 | 17.0%).
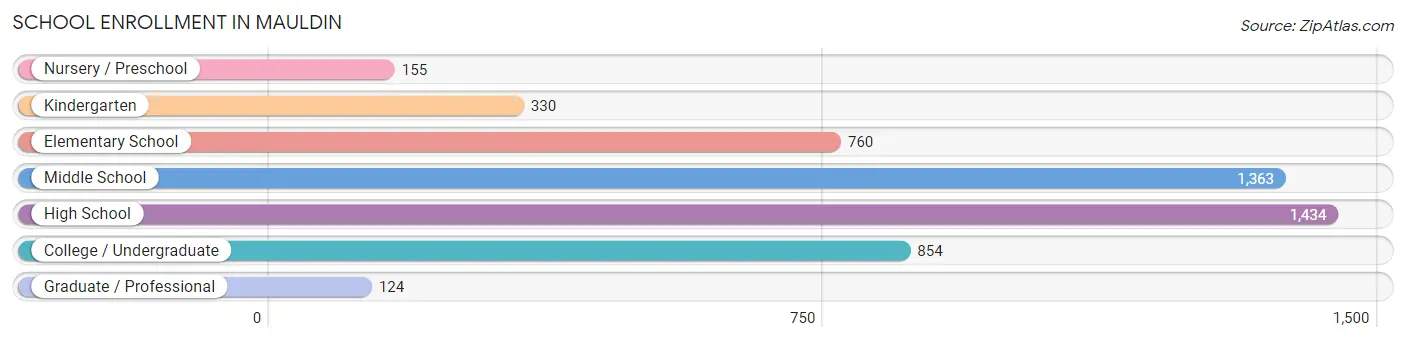
| School Level | # Students | % Students |
| Nursery / Preschool | 155 | 3.1% |
| Kindergarten | 330 | 6.6% |
| Elementary School | 760 | 15.1% |
| Middle School | 1,363 | 27.2% |
| High School | 1,434 | 28.6% |
| College / Undergraduate | 854 | 17.0% |
| Graduate / Professional | 124 | 2.5% |
| Total | 5,020 | 100.0% |
School Enrollment by Age by Funding Source in Mauldin
Out of a total of 5,020 students who are enrolled in schools in Mauldin, 833 (16.6%) attend a private institution, while the remaining 4,187 (83.4%) are enrolled in public schools. The age group of 3 to 4 year olds has the highest likelihood of being enrolled in private schools, with 88 (100.0% in the age bracket) enrolled. Conversely, the age group of 15 to 17 year olds has the lowest likelihood of being enrolled in a private school, with 1,127 (99.0% in the age bracket) attending a public institution.
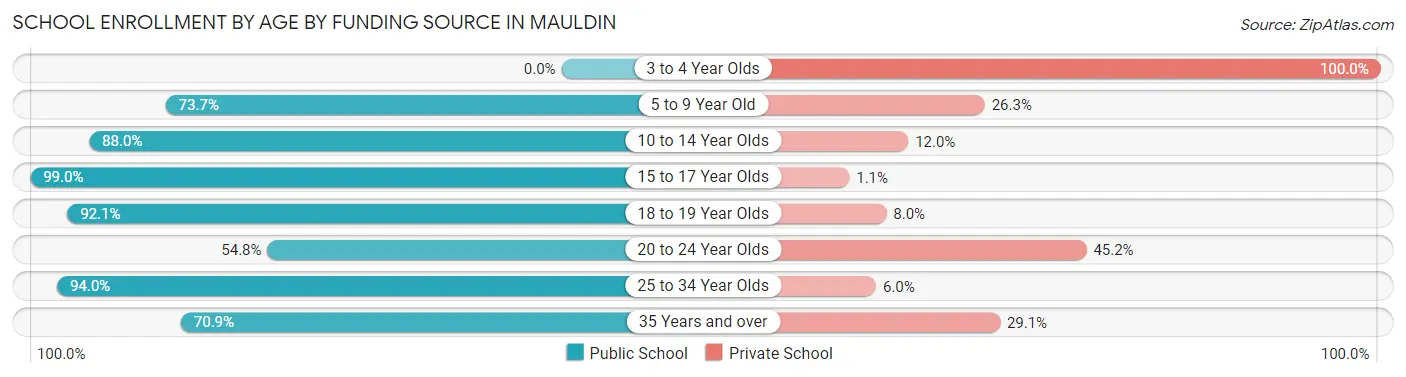
| Age Bracket | Public School | Private School |
| 3 to 4 Year Olds | 0 (0.0%) | 88 (100.0%) |
| 5 to 9 Year Old | 755 (73.7%) | 269 (26.3%) |
| 10 to 14 Year Olds | 1,456 (88.0%) | 199 (12.0%) |
| 15 to 17 Year Olds | 1,127 (99.0%) | 12 (1.1%) |
| 18 to 19 Year Olds | 220 (92.0%) | 19 (8.0%) |
| 20 to 24 Year Olds | 149 (54.8%) | 123 (45.2%) |
| 25 to 34 Year Olds | 218 (94.0%) | 14 (6.0%) |
| 35 Years and over | 263 (70.9%) | 108 (29.1%) |
| Total | 4,187 (83.4%) | 833 (16.6%) |
Educational Attainment by Field of Study in Mauldin
Business (1,510 | 20.3%), science & technology (905 | 12.2%), education (721 | 9.7%), engineering (628 | 8.5%), and social sciences (488 | 6.6%) are the most common fields of study among 7,429 individuals in Mauldin who have obtained a bachelor's degree or higher.
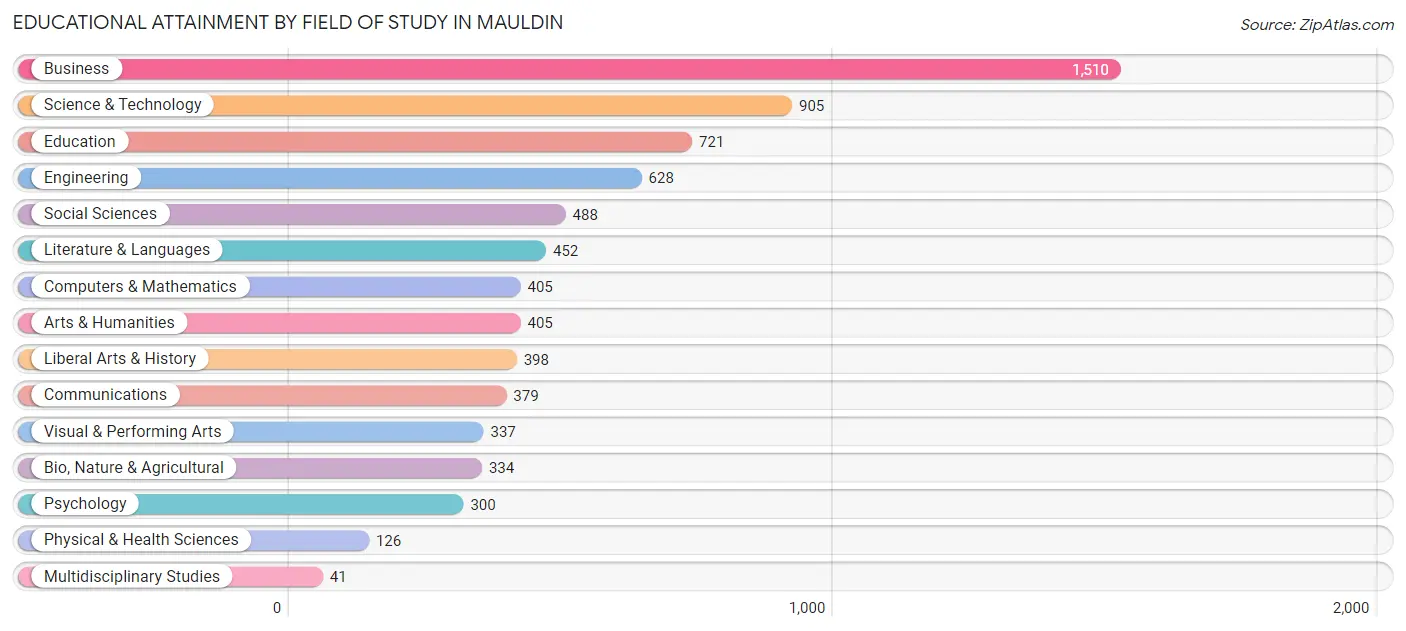
| Field of Study | # Graduates | % Graduates |
| Computers & Mathematics | 405 | 5.4% |
| Bio, Nature & Agricultural | 334 | 4.5% |
| Physical & Health Sciences | 126 | 1.7% |
| Psychology | 300 | 4.0% |
| Social Sciences | 488 | 6.6% |
| Engineering | 628 | 8.5% |
| Multidisciplinary Studies | 41 | 0.5% |
| Science & Technology | 905 | 12.2% |
| Business | 1,510 | 20.3% |
| Education | 721 | 9.7% |
| Literature & Languages | 452 | 6.1% |
| Liberal Arts & History | 398 | 5.4% |
| Visual & Performing Arts | 337 | 4.5% |
| Communications | 379 | 5.1% |
| Arts & Humanities | 405 | 5.4% |
| Total | 7,429 | 100.0% |
Transportation & Commute in Mauldin
Vehicle Availability by Sex in Mauldin
The most prevalent vehicle ownership categories in Mauldin are males with 2 vehicles (2,938, accounting for 43.4%) and females with 2 vehicles (2,786, making up 43.9%).
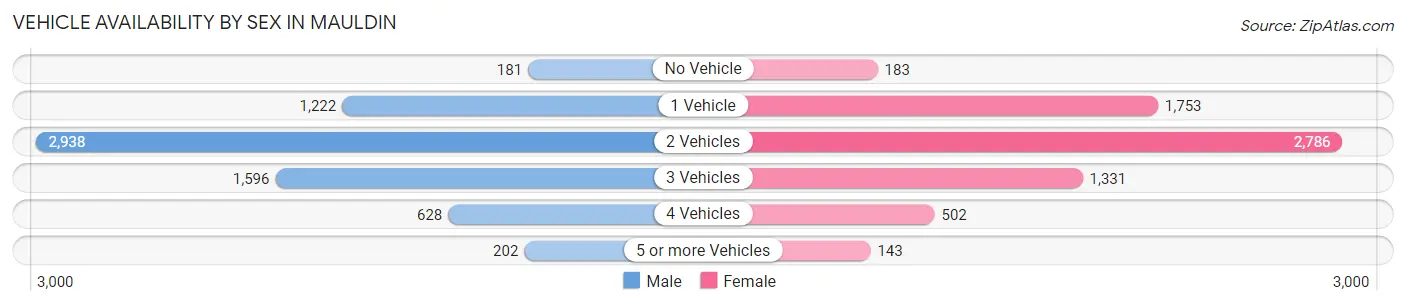
| Vehicles Available | Male | Female |
| No Vehicle | 181 (2.7%) | 183 (2.7%) |
| 1 Vehicle | 1,222 (18.1%) | 1,753 (26.2%) |
| 2 Vehicles | 2,938 (43.4%) | 2,786 (41.6%) |
| 3 Vehicles | 1,596 (23.6%) | 1,331 (19.9%) |
| 4 Vehicles | 628 (9.3%) | 502 (7.5%) |
| 5 or more Vehicles | 202 (3.0%) | 143 (2.1%) |
| Total | 6,767 (100.0%) | 6,698 (100.0%) |
Commute Time in Mauldin
The most frequently occuring commute durations in Mauldin are 15 to 19 minutes (3,141 commuters, 26.7%), 20 to 24 minutes (2,416 commuters, 20.5%), and 10 to 14 minutes (2,172 commuters, 18.4%).
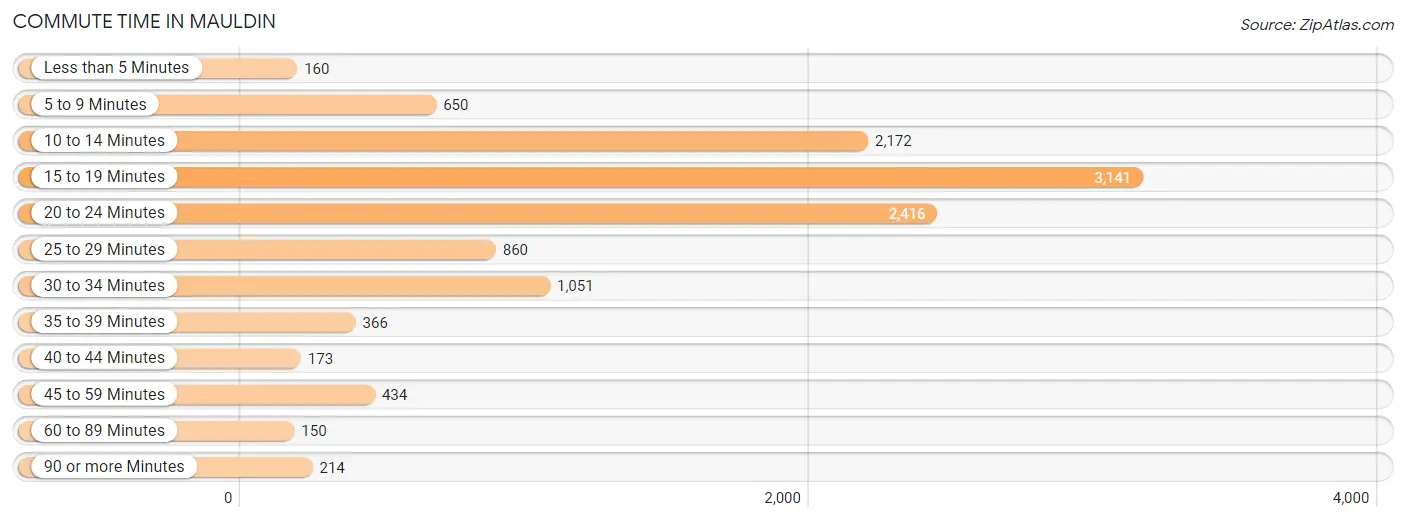
| Commute Time | # Commuters | % Commuters |
| Less than 5 Minutes | 160 | 1.4% |
| 5 to 9 Minutes | 650 | 5.5% |
| 10 to 14 Minutes | 2,172 | 18.4% |
| 15 to 19 Minutes | 3,141 | 26.7% |
| 20 to 24 Minutes | 2,416 | 20.5% |
| 25 to 29 Minutes | 860 | 7.3% |
| 30 to 34 Minutes | 1,051 | 8.9% |
| 35 to 39 Minutes | 366 | 3.1% |
| 40 to 44 Minutes | 173 | 1.5% |
| 45 to 59 Minutes | 434 | 3.7% |
| 60 to 89 Minutes | 150 | 1.3% |
| 90 or more Minutes | 214 | 1.8% |
Commute Time by Sex in Mauldin
The most common commute times in Mauldin are 15 to 19 minutes (1,637 commuters, 27.7%) for males and 15 to 19 minutes (1,504 commuters, 25.6%) for females.
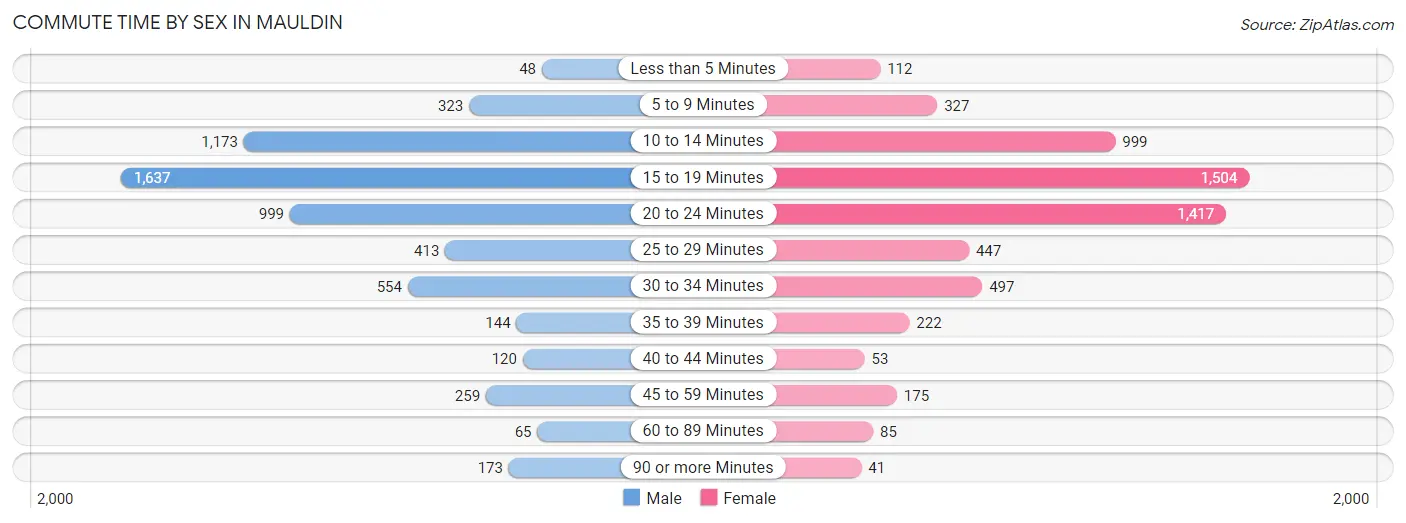
| Commute Time | Male | Female |
| Less than 5 Minutes | 48 (0.8%) | 112 (1.9%) |
| 5 to 9 Minutes | 323 (5.5%) | 327 (5.6%) |
| 10 to 14 Minutes | 1,173 (19.9%) | 999 (17.0%) |
| 15 to 19 Minutes | 1,637 (27.7%) | 1,504 (25.6%) |
| 20 to 24 Minutes | 999 (16.9%) | 1,417 (24.1%) |
| 25 to 29 Minutes | 413 (7.0%) | 447 (7.6%) |
| 30 to 34 Minutes | 554 (9.4%) | 497 (8.5%) |
| 35 to 39 Minutes | 144 (2.4%) | 222 (3.8%) |
| 40 to 44 Minutes | 120 (2.0%) | 53 (0.9%) |
| 45 to 59 Minutes | 259 (4.4%) | 175 (3.0%) |
| 60 to 89 Minutes | 65 (1.1%) | 85 (1.5%) |
| 90 or more Minutes | 173 (2.9%) | 41 (0.7%) |
Time of Departure to Work by Sex in Mauldin
The most frequent times of departure to work in Mauldin are 7:00 AM to 7:29 AM (761, 12.9%) for males and 7:00 AM to 7:29 AM (1,051, 17.9%) for females.
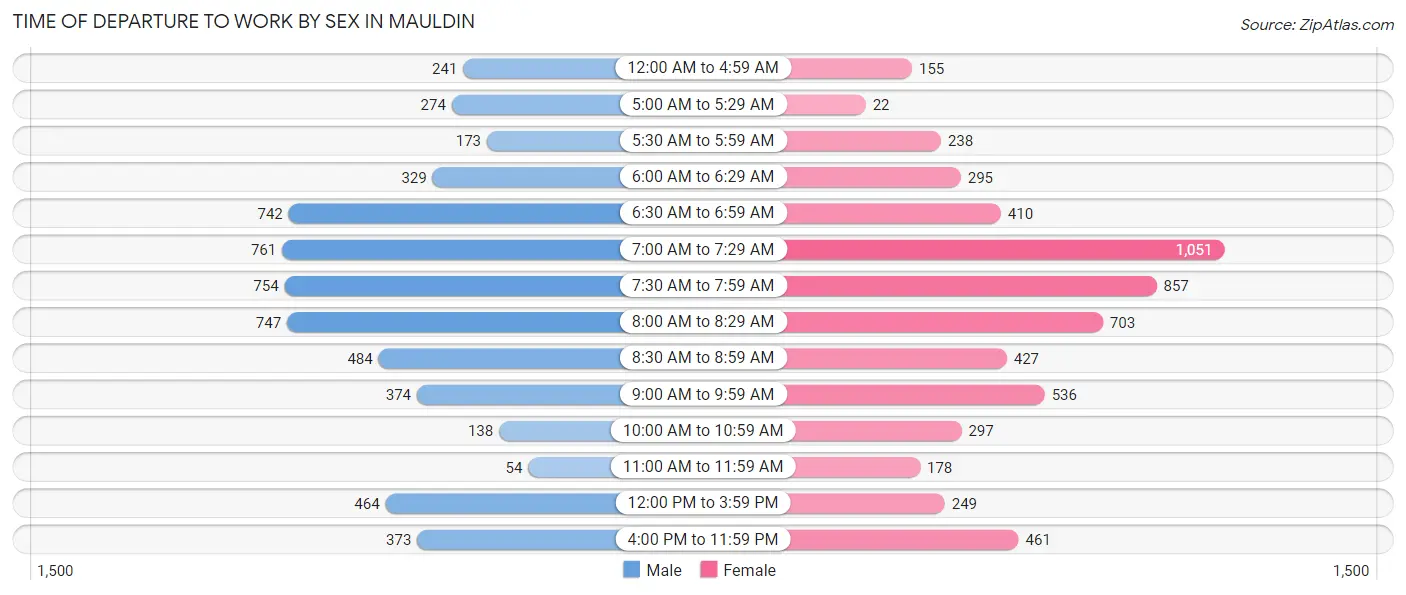
| Time of Departure | Male | Female |
| 12:00 AM to 4:59 AM | 241 (4.1%) | 155 (2.6%) |
| 5:00 AM to 5:29 AM | 274 (4.6%) | 22 (0.4%) |
| 5:30 AM to 5:59 AM | 173 (2.9%) | 238 (4.1%) |
| 6:00 AM to 6:29 AM | 329 (5.6%) | 295 (5.0%) |
| 6:30 AM to 6:59 AM | 742 (12.6%) | 410 (7.0%) |
| 7:00 AM to 7:29 AM | 761 (12.9%) | 1,051 (17.9%) |
| 7:30 AM to 7:59 AM | 754 (12.8%) | 857 (14.6%) |
| 8:00 AM to 8:29 AM | 747 (12.6%) | 703 (12.0%) |
| 8:30 AM to 8:59 AM | 484 (8.2%) | 427 (7.3%) |
| 9:00 AM to 9:59 AM | 374 (6.3%) | 536 (9.1%) |
| 10:00 AM to 10:59 AM | 138 (2.3%) | 297 (5.1%) |
| 11:00 AM to 11:59 AM | 54 (0.9%) | 178 (3.0%) |
| 12:00 PM to 3:59 PM | 464 (7.9%) | 249 (4.2%) |
| 4:00 PM to 11:59 PM | 373 (6.3%) | 461 (7.8%) |
| Total | 5,908 (100.0%) | 5,879 (100.0%) |
Housing Occupancy in Mauldin
Occupancy by Ownership in Mauldin
Of the total 10,676 dwellings in Mauldin, owner-occupied units account for 7,152 (67.0%), while renter-occupied units make up 3,524 (33.0%).
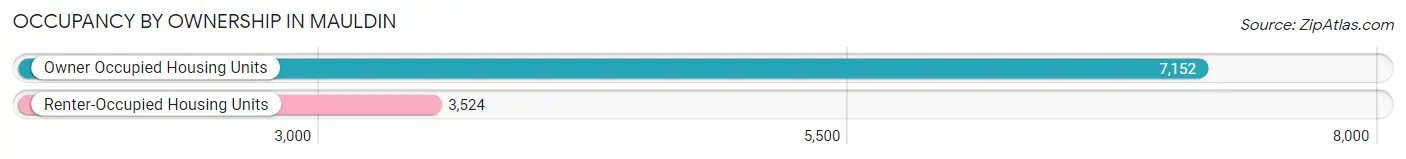
| Occupancy | # Housing Units | % Housing Units |
| Owner Occupied Housing Units | 7,152 | 67.0% |
| Renter-Occupied Housing Units | 3,524 | 33.0% |
| Total Occupied Housing Units | 10,676 | 100.0% |
Occupancy by Household Size in Mauldin
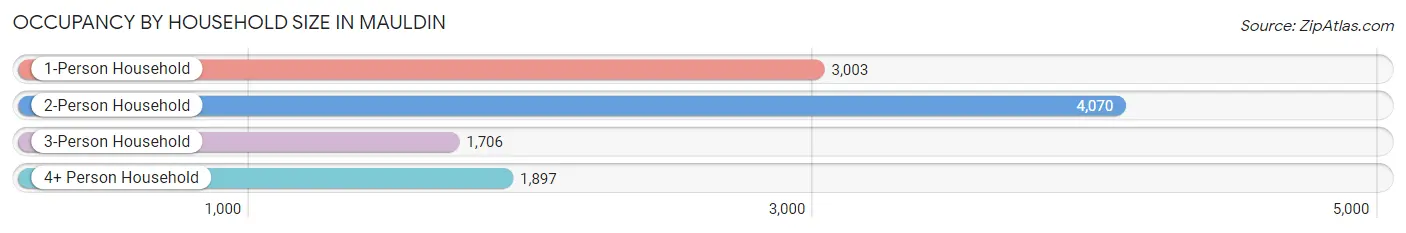
| Household Size | # Housing Units | % Housing Units |
| 1-Person Household | 3,003 | 28.1% |
| 2-Person Household | 4,070 | 38.1% |
| 3-Person Household | 1,706 | 16.0% |
| 4+ Person Household | 1,897 | 17.8% |
| Total Housing Units | 10,676 | 100.0% |
Occupancy by Ownership by Household Size in Mauldin
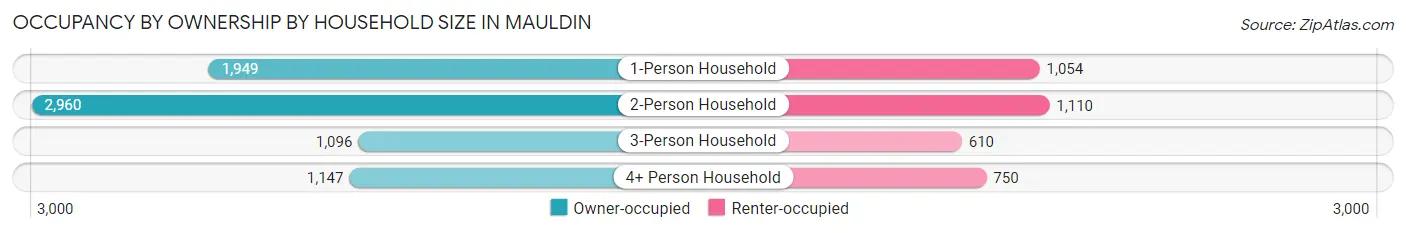
| Household Size | Owner-occupied | Renter-occupied |
| 1-Person Household | 1,949 (64.9%) | 1,054 (35.1%) |
| 2-Person Household | 2,960 (72.7%) | 1,110 (27.3%) |
| 3-Person Household | 1,096 (64.2%) | 610 (35.8%) |
| 4+ Person Household | 1,147 (60.5%) | 750 (39.5%) |
| Total Housing Units | 7,152 (67.0%) | 3,524 (33.0%) |
Occupancy by Educational Attainment in Mauldin
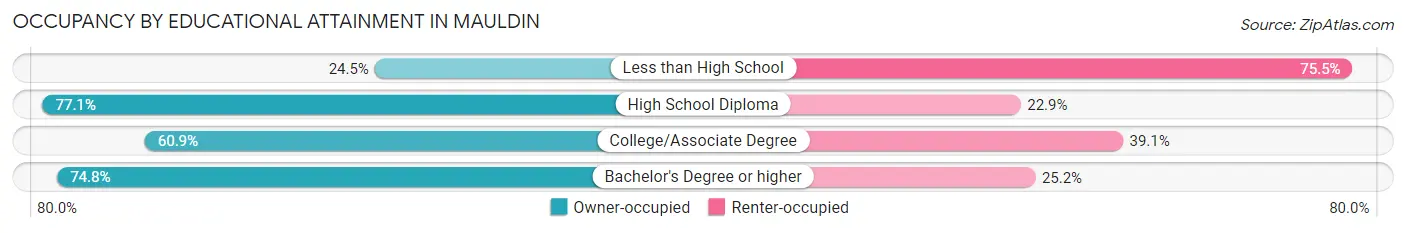
| Household Size | Owner-occupied | Renter-occupied |
| Less than High School | 127 (24.5%) | 392 (75.5%) |
| High School Diploma | 1,252 (77.1%) | 371 (22.9%) |
| College/Associate Degree | 2,683 (60.9%) | 1,721 (39.1%) |
| Bachelor's Degree or higher | 3,090 (74.8%) | 1,040 (25.2%) |
Occupancy by Age of Householder in Mauldin
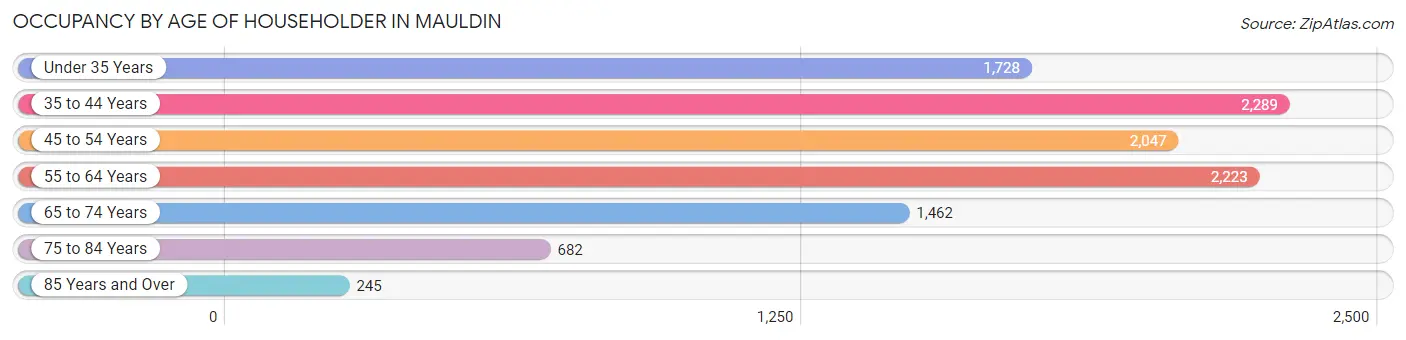
| Age Bracket | # Households | % Households |
| Under 35 Years | 1,728 | 16.2% |
| 35 to 44 Years | 2,289 | 21.4% |
| 45 to 54 Years | 2,047 | 19.2% |
| 55 to 64 Years | 2,223 | 20.8% |
| 65 to 74 Years | 1,462 | 13.7% |
| 75 to 84 Years | 682 | 6.4% |
| 85 Years and Over | 245 | 2.3% |
| Total | 10,676 | 100.0% |
Housing Finances in Mauldin
Median Income by Occupancy in Mauldin
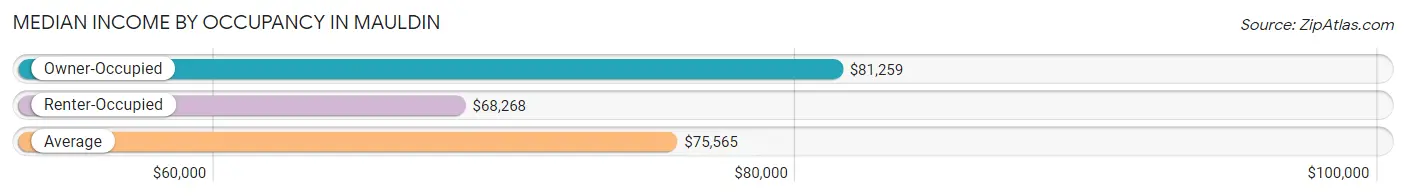
| Occupancy Type | # Households | Median Income |
| Owner-Occupied | 7,152 (67.0%) | $81,259 |
| Renter-Occupied | 3,524 (33.0%) | $68,268 |
| Average | 10,676 (100.0%) | $75,565 |
Occupancy by Householder Income Bracket in Mauldin
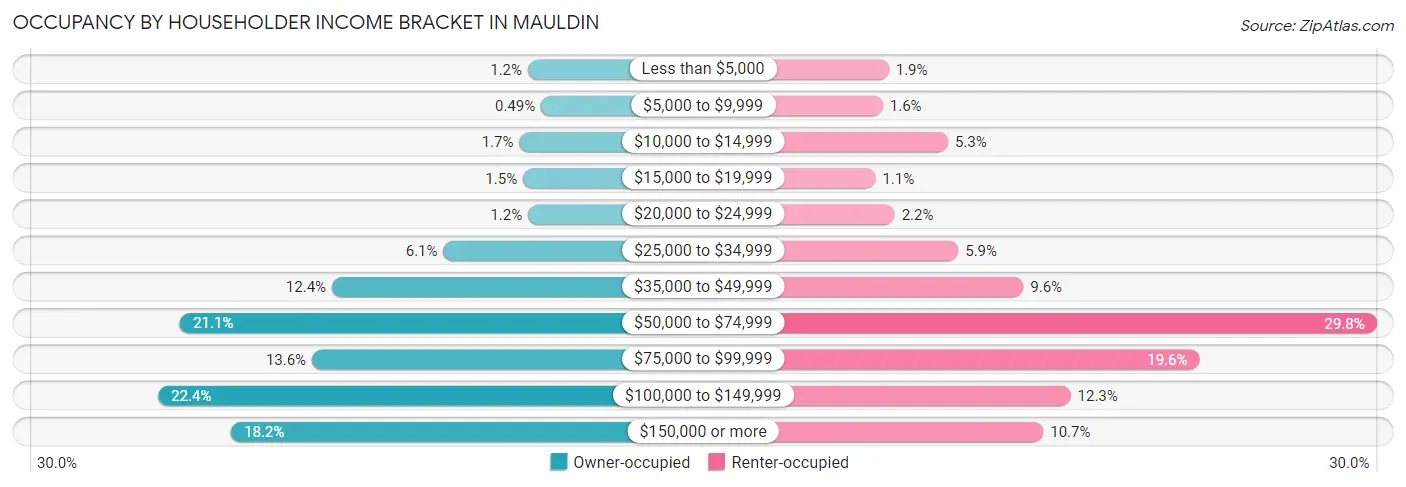
| Income Bracket | Owner-occupied | Renter-occupied |
| Less than $5,000 | 89 (1.2%) | 67 (1.9%) |
| $5,000 to $9,999 | 35 (0.5%) | 55 (1.6%) |
| $10,000 to $14,999 | 124 (1.7%) | 186 (5.3%) |
| $15,000 to $19,999 | 109 (1.5%) | 40 (1.1%) |
| $20,000 to $24,999 | 88 (1.2%) | 79 (2.2%) |
| $25,000 to $34,999 | 434 (6.1%) | 207 (5.9%) |
| $35,000 to $49,999 | 890 (12.4%) | 338 (9.6%) |
| $50,000 to $74,999 | 1,510 (21.1%) | 1,049 (29.8%) |
| $75,000 to $99,999 | 971 (13.6%) | 692 (19.6%) |
| $100,000 to $149,999 | 1,600 (22.4%) | 433 (12.3%) |
| $150,000 or more | 1,302 (18.2%) | 378 (10.7%) |
| Total | 7,152 (100.0%) | 3,524 (100.0%) |
Monthly Housing Cost Tiers in Mauldin
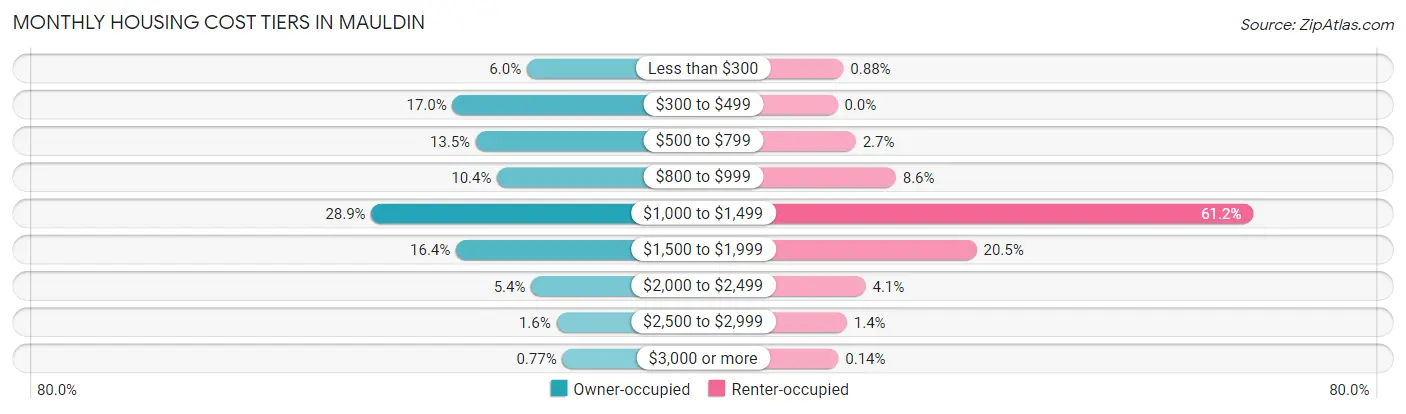
| Monthly Cost | Owner-occupied | Renter-occupied |
| Less than $300 | 429 (6.0%) | 31 (0.9%) |
| $300 to $499 | 1,214 (17.0%) | 0 (0.0%) |
| $500 to $799 | 967 (13.5%) | 95 (2.7%) |
| $800 to $999 | 742 (10.4%) | 303 (8.6%) |
| $1,000 to $1,499 | 2,068 (28.9%) | 2,158 (61.2%) |
| $1,500 to $1,999 | 1,176 (16.4%) | 722 (20.5%) |
| $2,000 to $2,499 | 384 (5.4%) | 146 (4.1%) |
| $2,500 to $2,999 | 117 (1.6%) | 49 (1.4%) |
| $3,000 or more | 55 (0.8%) | 5 (0.1%) |
| Total | 7,152 (100.0%) | 3,524 (100.0%) |
Physical Housing Characteristics in Mauldin
Housing Structures in Mauldin
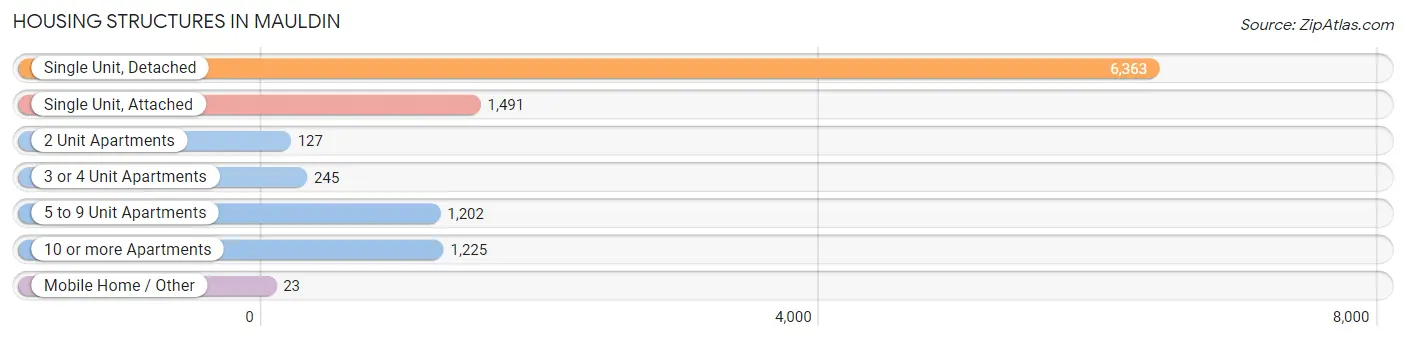
| Structure Type | # Housing Units | % Housing Units |
| Single Unit, Detached | 6,363 | 59.6% |
| Single Unit, Attached | 1,491 | 14.0% |
| 2 Unit Apartments | 127 | 1.2% |
| 3 or 4 Unit Apartments | 245 | 2.3% |
| 5 to 9 Unit Apartments | 1,202 | 11.3% |
| 10 or more Apartments | 1,225 | 11.5% |
| Mobile Home / Other | 23 | 0.2% |
| Total | 10,676 | 100.0% |
Housing Structures by Occupancy in Mauldin
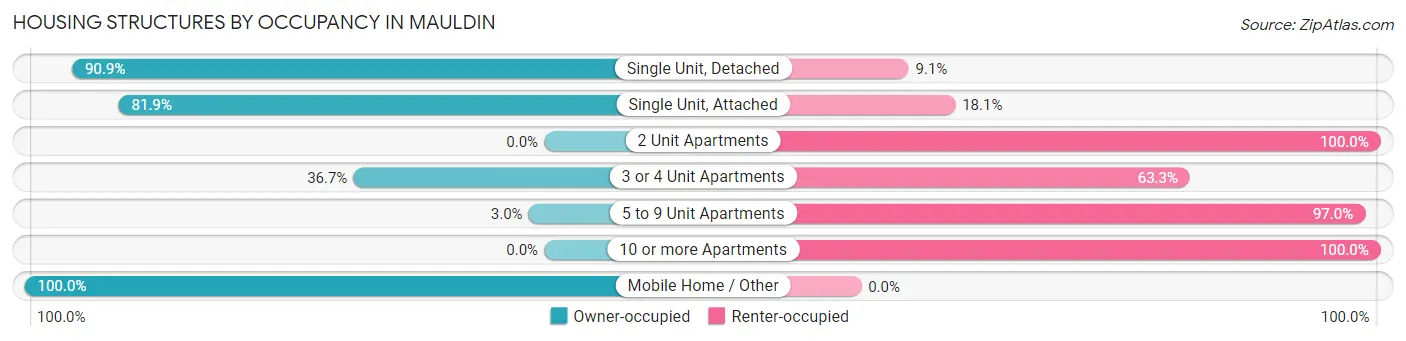
| Structure Type | Owner-occupied | Renter-occupied |
| Single Unit, Detached | 5,782 (90.9%) | 581 (9.1%) |
| Single Unit, Attached | 1,221 (81.9%) | 270 (18.1%) |
| 2 Unit Apartments | 0 (0.0%) | 127 (100.0%) |
| 3 or 4 Unit Apartments | 90 (36.7%) | 155 (63.3%) |
| 5 to 9 Unit Apartments | 36 (3.0%) | 1,166 (97.0%) |
| 10 or more Apartments | 0 (0.0%) | 1,225 (100.0%) |
| Mobile Home / Other | 23 (100.0%) | 0 (0.0%) |
| Total | 7,152 (67.0%) | 3,524 (33.0%) |
Housing Structures by Number of Rooms in Mauldin
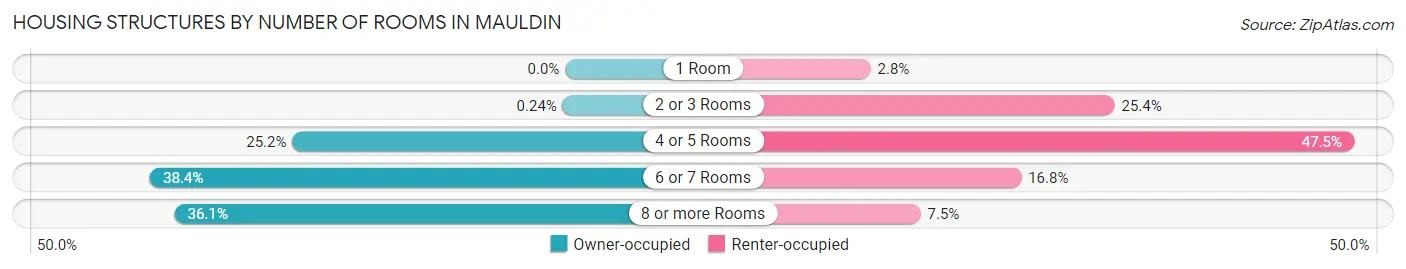
| Number of Rooms | Owner-occupied | Renter-occupied |
| 1 Room | 0 (0.0%) | 100 (2.8%) |
| 2 or 3 Rooms | 17 (0.2%) | 895 (25.4%) |
| 4 or 5 Rooms | 1,805 (25.2%) | 1,675 (47.5%) |
| 6 or 7 Rooms | 2,746 (38.4%) | 591 (16.8%) |
| 8 or more Rooms | 2,584 (36.1%) | 263 (7.5%) |
| Total | 7,152 (100.0%) | 3,524 (100.0%) |
Housing Structure by Heating Type in Mauldin
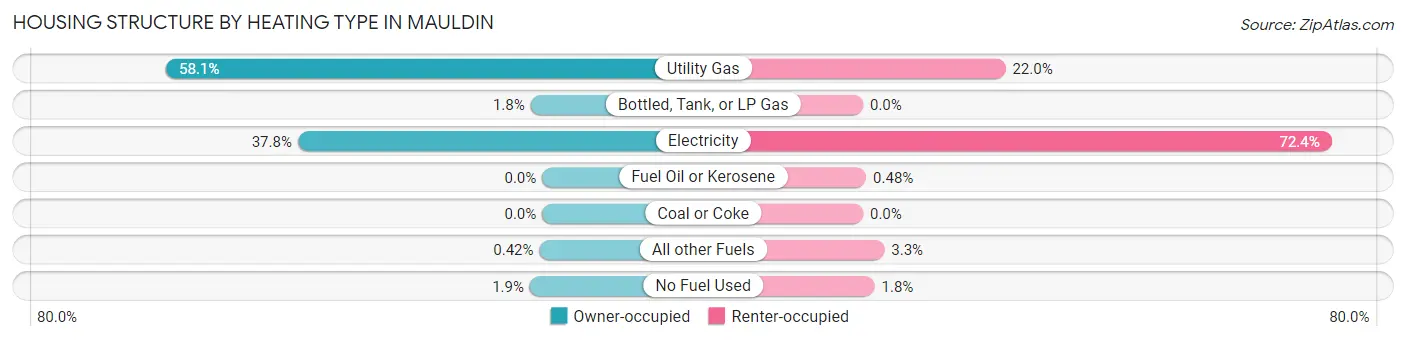
| Heating Type | Owner-occupied | Renter-occupied |
| Utility Gas | 4,157 (58.1%) | 776 (22.0%) |
| Bottled, Tank, or LP Gas | 127 (1.8%) | 0 (0.0%) |
| Electricity | 2,702 (37.8%) | 2,552 (72.4%) |
| Fuel Oil or Kerosene | 0 (0.0%) | 17 (0.5%) |
| Coal or Coke | 0 (0.0%) | 0 (0.0%) |
| All other Fuels | 30 (0.4%) | 116 (3.3%) |
| No Fuel Used | 136 (1.9%) | 63 (1.8%) |
| Total | 7,152 (100.0%) | 3,524 (100.0%) |
Household Vehicle Usage in Mauldin
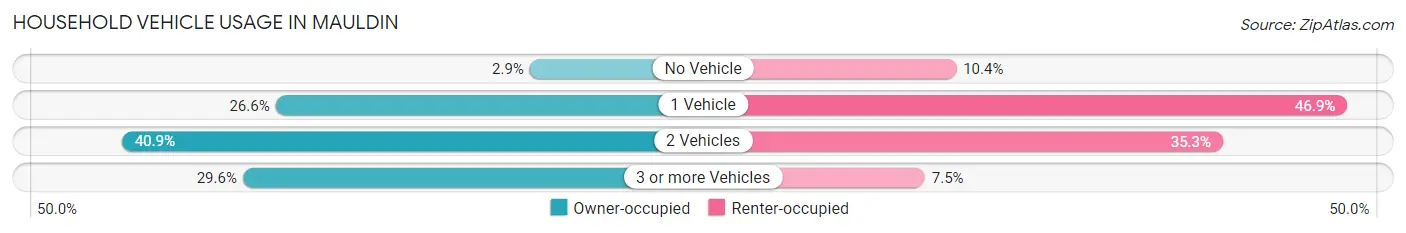
| Vehicles per Household | Owner-occupied | Renter-occupied |
| No Vehicle | 204 (2.9%) | 366 (10.4%) |
| 1 Vehicle | 1,901 (26.6%) | 1,652 (46.9%) |
| 2 Vehicles | 2,927 (40.9%) | 1,243 (35.3%) |
| 3 or more Vehicles | 2,120 (29.6%) | 263 (7.5%) |
| Total | 7,152 (100.0%) | 3,524 (100.0%) |
Real Estate & Mortgages in Mauldin
Real Estate and Mortgage Overview in Mauldin
| Characteristic | Without Mortgage | With Mortgage |
| Housing Units | 2,295 | 4,857 |
| Median Property Value | $212,200 | $224,000 |
| Median Household Income | $69,606 | $925 |
| Monthly Housing Costs | $430 | $55 |
| Real Estate Taxes | $1,051 | $58 |
Property Value by Mortgage Status in Mauldin
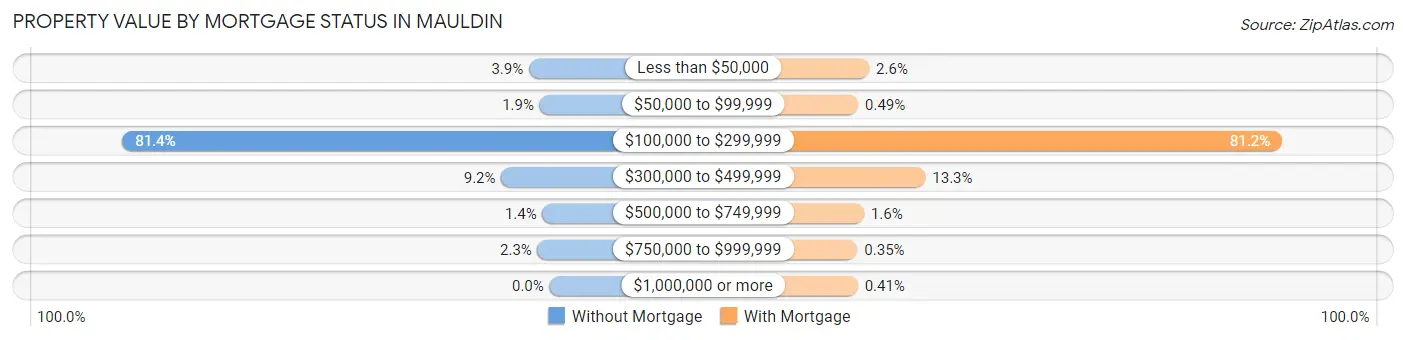
| Property Value | Without Mortgage | With Mortgage |
| Less than $50,000 | 90 (3.9%) | 126 (2.6%) |
| $50,000 to $99,999 | 43 (1.9%) | 24 (0.5%) |
| $100,000 to $299,999 | 1,868 (81.4%) | 3,946 (81.2%) |
| $300,000 to $499,999 | 211 (9.2%) | 646 (13.3%) |
| $500,000 to $749,999 | 31 (1.3%) | 78 (1.6%) |
| $750,000 to $999,999 | 52 (2.3%) | 17 (0.4%) |
| $1,000,000 or more | 0 (0.0%) | 20 (0.4%) |
| Total | 2,295 (100.0%) | 4,857 (100.0%) |
Household Income by Mortgage Status in Mauldin
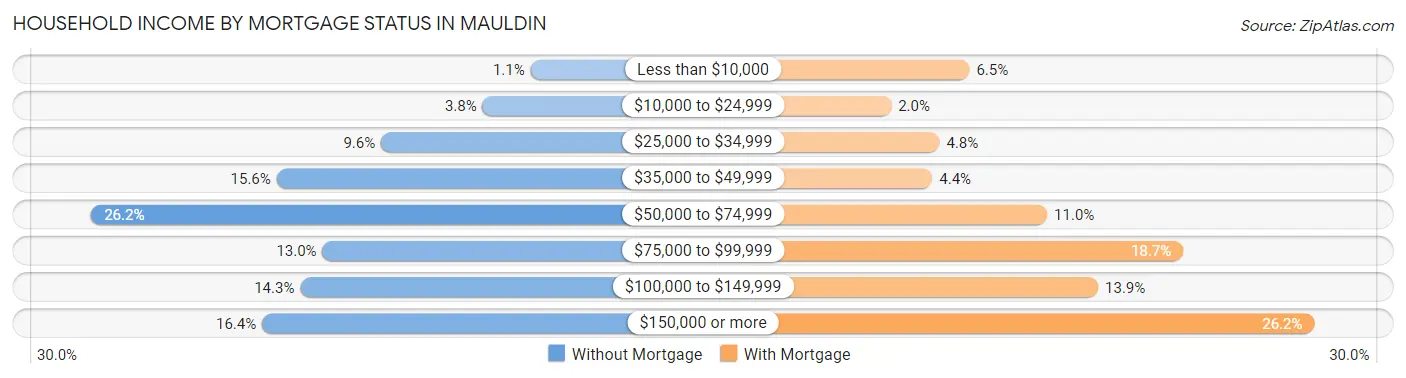
| Household Income | Without Mortgage | With Mortgage |
| Less than $10,000 | 25 (1.1%) | 316 (6.5%) |
| $10,000 to $24,999 | 88 (3.8%) | 99 (2.0%) |
| $25,000 to $34,999 | 221 (9.6%) | 233 (4.8%) |
| $35,000 to $49,999 | 358 (15.6%) | 213 (4.4%) |
| $50,000 to $74,999 | 601 (26.2%) | 532 (11.0%) |
| $75,000 to $99,999 | 298 (13.0%) | 909 (18.7%) |
| $100,000 to $149,999 | 327 (14.2%) | 673 (13.9%) |
| $150,000 or more | 377 (16.4%) | 1,273 (26.2%) |
| Total | 2,295 (100.0%) | 4,857 (100.0%) |
Property Value to Household Income Ratio in Mauldin
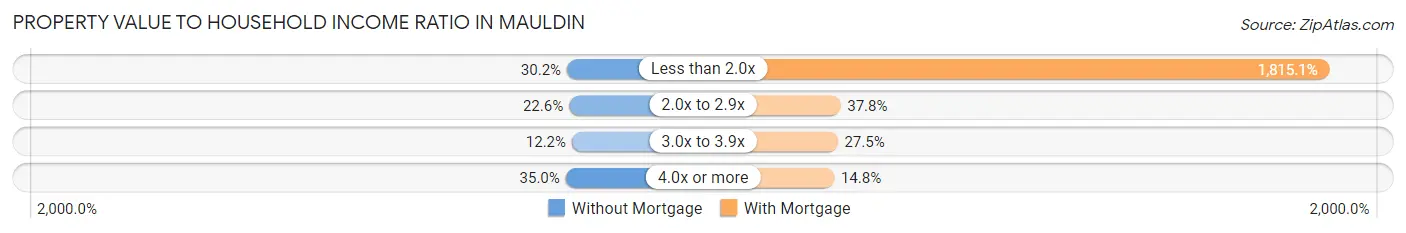
| Value-to-Income Ratio | Without Mortgage | With Mortgage |
| Less than 2.0x | 693 (30.2%) | 88,158 (1,815.1%) |
| 2.0x to 2.9x | 519 (22.6%) | 1,834 (37.8%) |
| 3.0x to 3.9x | 279 (12.2%) | 1,335 (27.5%) |
| 4.0x or more | 804 (35.0%) | 717 (14.8%) |
| Total | 2,295 (100.0%) | 4,857 (100.0%) |
Real Estate Taxes by Mortgage Status in Mauldin
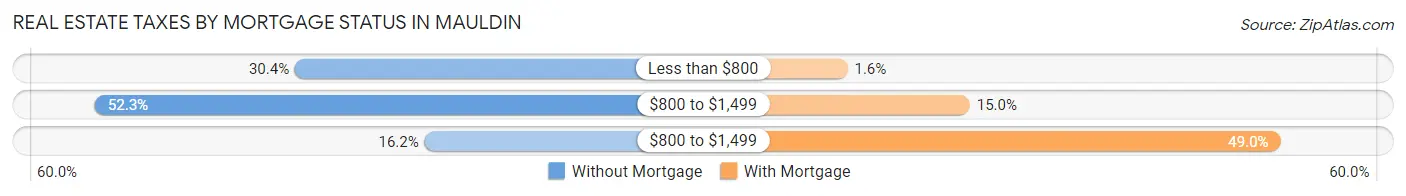
| Property Taxes | Without Mortgage | With Mortgage |
| Less than $800 | 697 (30.4%) | 77 (1.6%) |
| $800 to $1,499 | 1,200 (52.3%) | 728 (15.0%) |
| $800 to $1,499 | 371 (16.2%) | 2,381 (49.0%) |
| Total | 2,295 (100.0%) | 4,857 (100.0%) |
Health & Disability in Mauldin
Health Insurance Coverage by Age in Mauldin
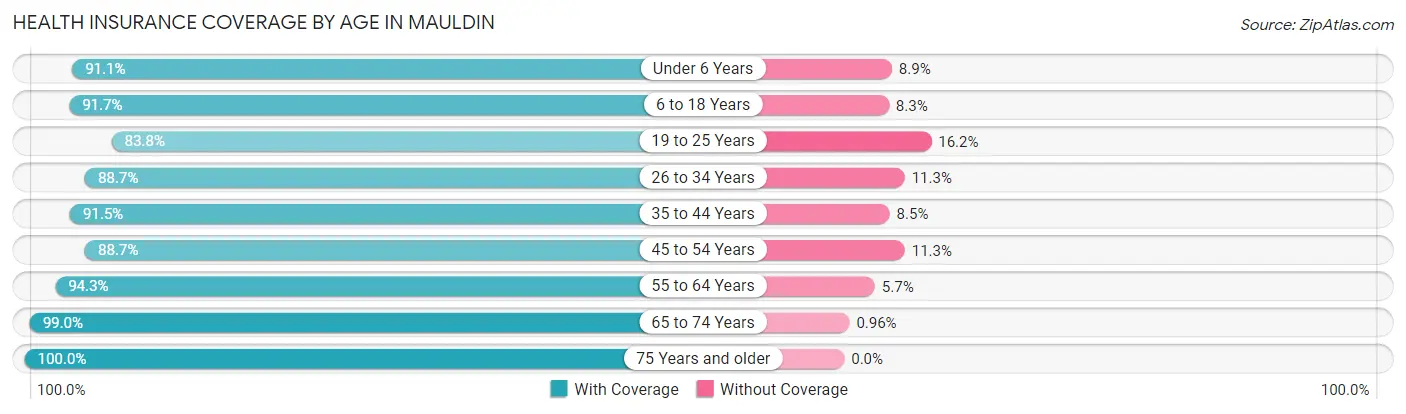
| Age Bracket | With Coverage | Without Coverage |
| Under 6 Years | 1,416 (91.1%) | 138 (8.9%) |
| 6 to 18 Years | 3,451 (91.7%) | 313 (8.3%) |
| 19 to 25 Years | 1,240 (83.8%) | 240 (16.2%) |
| 26 to 34 Years | 2,653 (88.7%) | 337 (11.3%) |
| 35 to 44 Years | 3,757 (91.5%) | 347 (8.5%) |
| 45 to 54 Years | 3,127 (88.7%) | 398 (11.3%) |
| 55 to 64 Years | 3,487 (94.3%) | 211 (5.7%) |
| 65 to 74 Years | 2,472 (99.0%) | 24 (1.0%) |
| 75 Years and older | 1,501 (100.0%) | 0 (0.0%) |
| Total | 23,104 (92.0%) | 2,008 (8.0%) |
Health Insurance Coverage by Citizenship Status in Mauldin
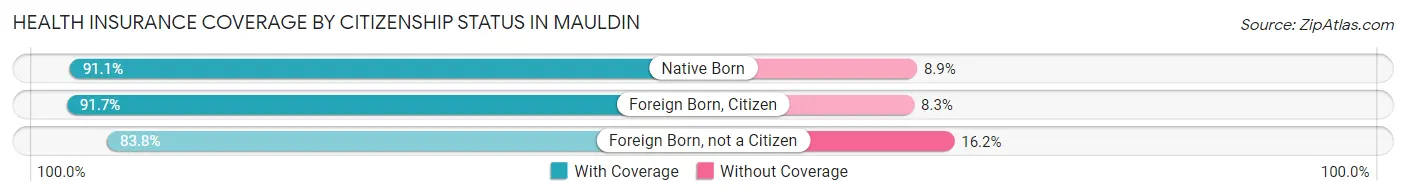
| Citizenship Status | With Coverage | Without Coverage |
| Native Born | 1,416 (91.1%) | 138 (8.9%) |
| Foreign Born, Citizen | 3,451 (91.7%) | 313 (8.3%) |
| Foreign Born, not a Citizen | 1,240 (83.8%) | 240 (16.2%) |
Health Insurance Coverage by Household Income in Mauldin
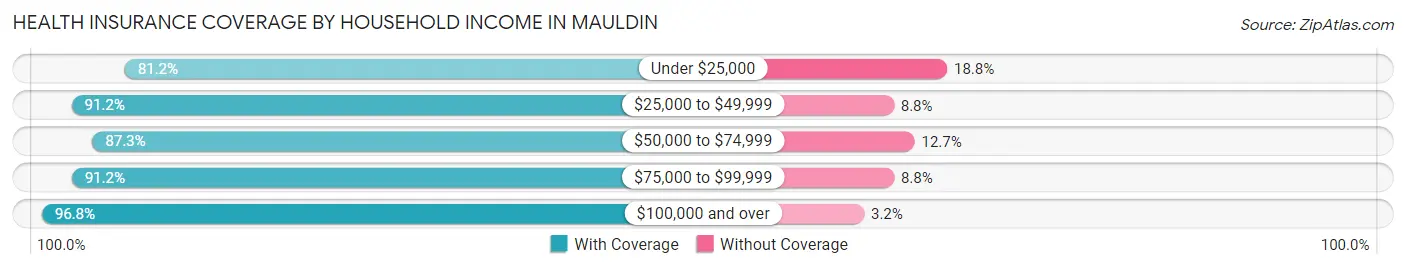
| Household Income | With Coverage | Without Coverage |
| Under $25,000 | 1,176 (81.2%) | 272 (18.8%) |
| $25,000 to $49,999 | 3,110 (91.2%) | 300 (8.8%) |
| $50,000 to $74,999 | 4,757 (87.3%) | 692 (12.7%) |
| $75,000 to $99,999 | 4,072 (91.2%) | 395 (8.8%) |
| $100,000 and over | 9,965 (96.8%) | 333 (3.2%) |
Public vs Private Health Insurance Coverage by Age in Mauldin
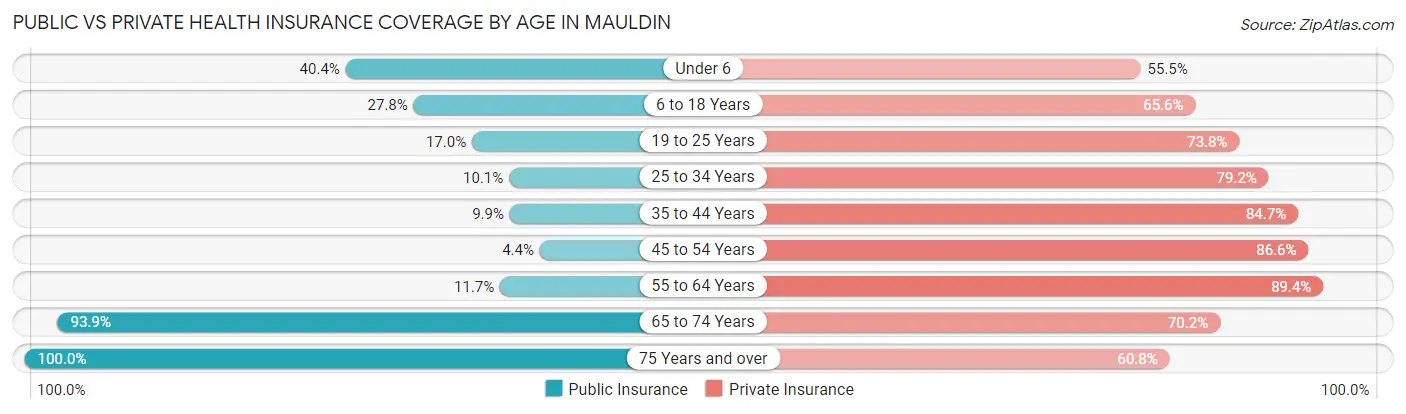
| Age Bracket | Public Insurance | Private Insurance |
| Under 6 | 628 (40.4%) | 862 (55.5%) |
| 6 to 18 Years | 1,046 (27.8%) | 2,469 (65.6%) |
| 19 to 25 Years | 251 (17.0%) | 1,092 (73.8%) |
| 25 to 34 Years | 301 (10.1%) | 2,369 (79.2%) |
| 35 to 44 Years | 408 (9.9%) | 3,475 (84.7%) |
| 45 to 54 Years | 154 (4.4%) | 3,052 (86.6%) |
| 55 to 64 Years | 434 (11.7%) | 3,304 (89.3%) |
| 65 to 74 Years | 2,343 (93.9%) | 1,752 (70.2%) |
| 75 Years and over | 1,501 (100.0%) | 913 (60.8%) |
| Total | 7,066 (28.1%) | 19,288 (76.8%) |
Disability Status by Sex by Age in Mauldin
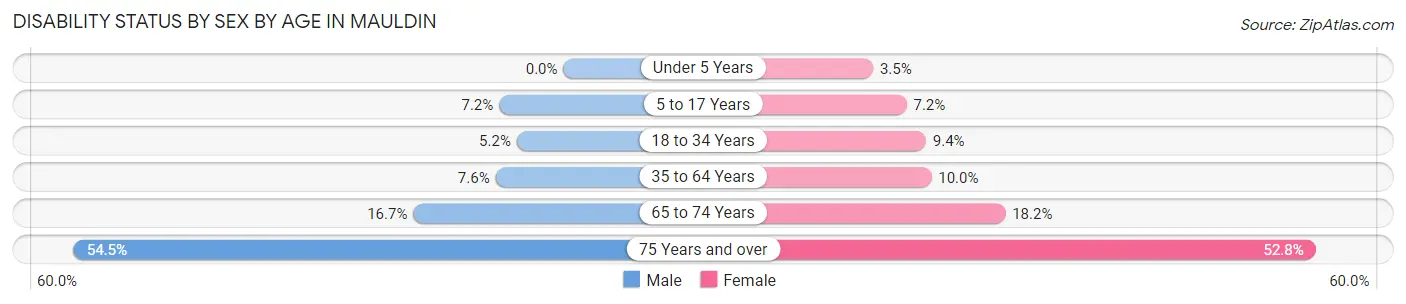
| Age Bracket | Male | Female |
| Under 5 Years | 0 (0.0%) | 15 (3.5%) |
| 5 to 17 Years | 142 (7.1%) | 143 (7.2%) |
| 18 to 34 Years | 124 (5.2%) | 213 (9.4%) |
| 35 to 64 Years | 400 (7.6%) | 602 (10.0%) |
| 65 to 74 Years | 195 (16.7%) | 242 (18.2%) |
| 75 Years and over | 344 (54.5%) | 459 (52.8%) |
Disability Class by Sex by Age in Mauldin
Disability Class: Hearing Difficulty
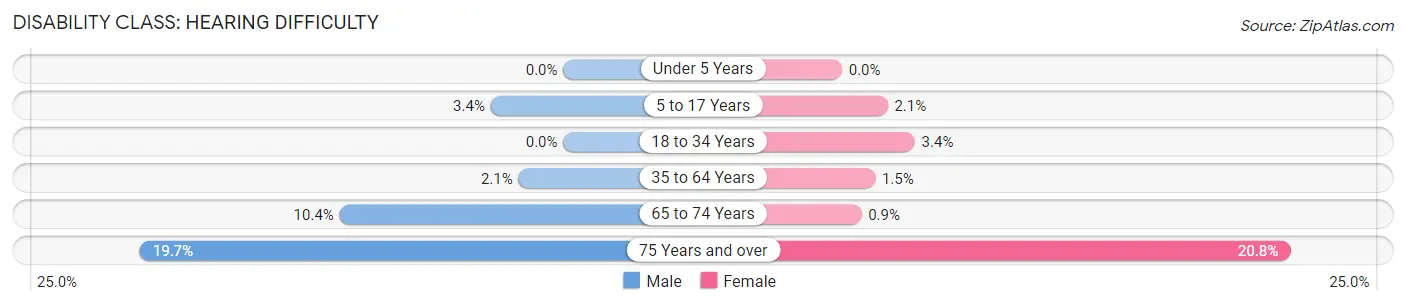
| Age Bracket | Male | Female |
| Under 5 Years | 0 (0.0%) | 0 (0.0%) |
| 5 to 17 Years | 67 (3.4%) | 42 (2.1%) |
| 18 to 34 Years | 0 (0.0%) | 77 (3.4%) |
| 35 to 64 Years | 110 (2.1%) | 93 (1.5%) |
| 65 to 74 Years | 121 (10.4%) | 12 (0.9%) |
| 75 Years and over | 124 (19.7%) | 181 (20.8%) |
Disability Class: Vision Difficulty
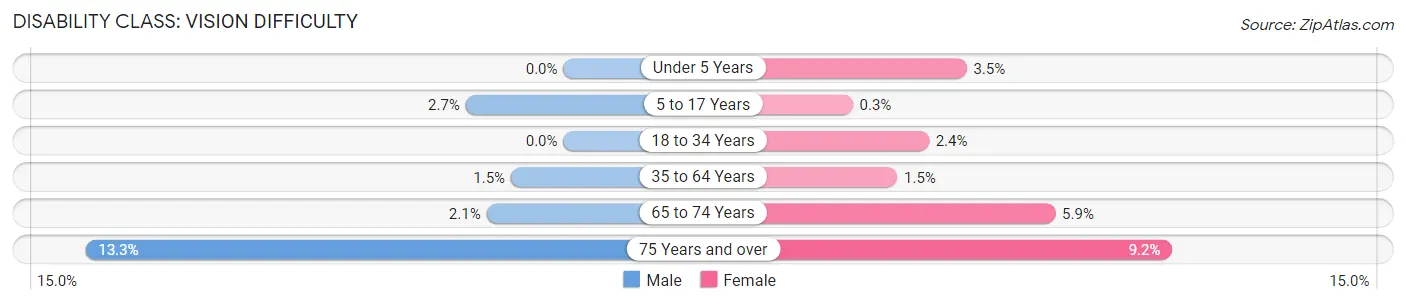
| Age Bracket | Male | Female |
| Under 5 Years | 0 (0.0%) | 15 (3.5%) |
| 5 to 17 Years | 54 (2.7%) | 6 (0.3%) |
| 18 to 34 Years | 0 (0.0%) | 55 (2.4%) |
| 35 to 64 Years | 77 (1.5%) | 93 (1.5%) |
| 65 to 74 Years | 25 (2.1%) | 79 (5.9%) |
| 75 Years and over | 84 (13.3%) | 80 (9.2%) |
Disability Class: Cognitive Difficulty
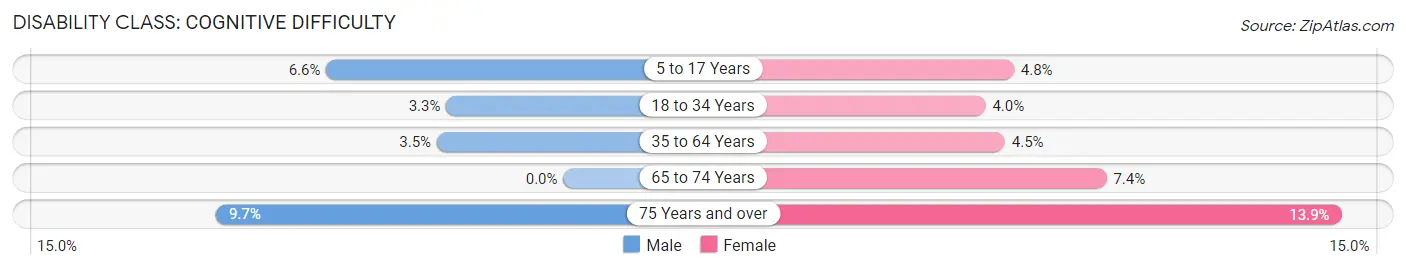
| Age Bracket | Male | Female |
| 5 to 17 Years | 131 (6.6%) | 95 (4.8%) |
| 18 to 34 Years | 78 (3.3%) | 91 (4.0%) |
| 35 to 64 Years | 186 (3.5%) | 274 (4.5%) |
| 65 to 74 Years | 0 (0.0%) | 98 (7.4%) |
| 75 Years and over | 61 (9.7%) | 121 (13.9%) |
Disability Class: Ambulatory Difficulty
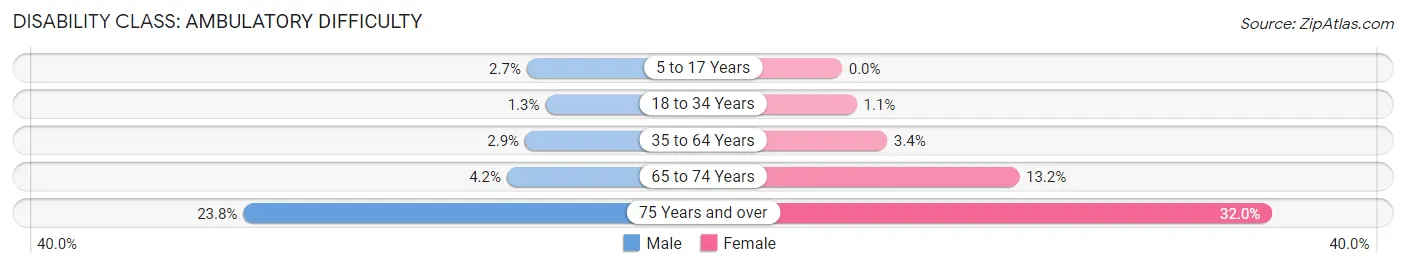
| Age Bracket | Male | Female |
| 5 to 17 Years | 54 (2.7%) | 0 (0.0%) |
| 18 to 34 Years | 32 (1.3%) | 25 (1.1%) |
| 35 to 64 Years | 151 (2.9%) | 202 (3.4%) |
| 65 to 74 Years | 49 (4.2%) | 175 (13.2%) |
| 75 Years and over | 150 (23.8%) | 278 (32.0%) |
Disability Class: Self-Care Difficulty
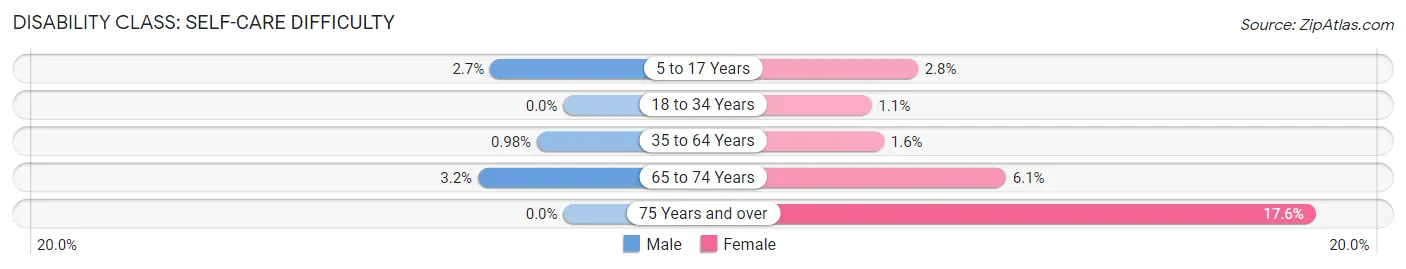
| Age Bracket | Male | Female |
| 5 to 17 Years | 54 (2.7%) | 56 (2.8%) |
| 18 to 34 Years | 0 (0.0%) | 25 (1.1%) |
| 35 to 64 Years | 52 (1.0%) | 94 (1.6%) |
| 65 to 74 Years | 37 (3.2%) | 81 (6.1%) |
| 75 Years and over | 0 (0.0%) | 153 (17.6%) |
Technology Access in Mauldin
Computing Device Access in Mauldin
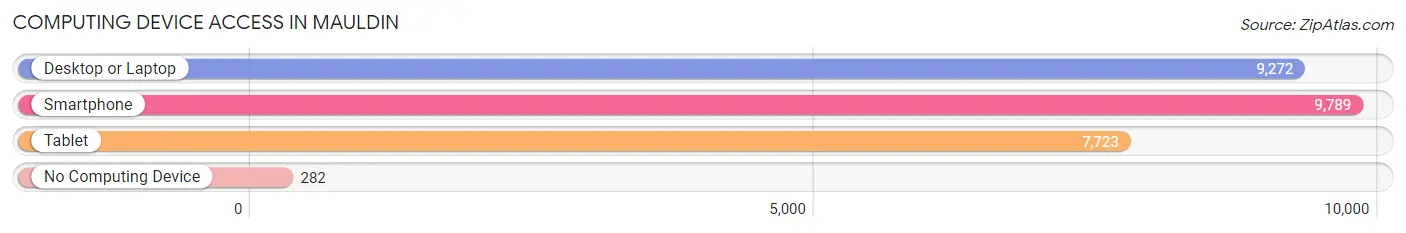
| Device Type | # Households | % Households |
| Desktop or Laptop | 9,272 | 86.9% |
| Smartphone | 9,789 | 91.7% |
| Tablet | 7,723 | 72.3% |
| No Computing Device | 282 | 2.6% |
| Total | 10,676 | 100.0% |
Internet Access in Mauldin
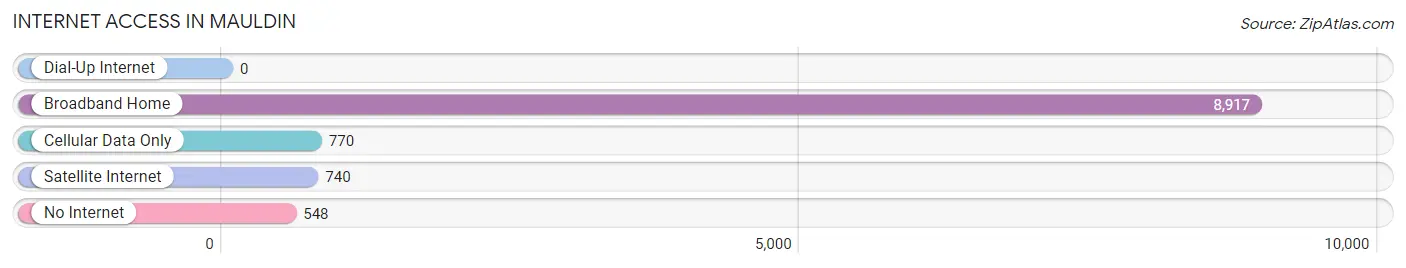
| Internet Type | # Households | % Households |
| Dial-Up Internet | 0 | 0.0% |
| Broadband Home | 8,917 | 83.5% |
| Cellular Data Only | 770 | 7.2% |
| Satellite Internet | 740 | 6.9% |
| No Internet | 548 | 5.1% |
| Total | 10,676 | 100.0% |
Mauldin Summary
Mauldin, South Carolina is a small city located in Greenville County, South Carolina. It is situated in the foothills of the Blue Ridge Mountains and is part of the Greenville-Spartanburg-Anderson Combined Statistical Area. The city has a population of approximately 25,000 people and is located just south of the city of Greenville.
Geography
Mauldin is located in the foothills of the Blue Ridge Mountains in the Upstate region of South Carolina. The city is situated in the Piedmont region of the state, which is characterized by rolling hills and valleys. The city is located at an elevation of 890 feet above sea level. The city is bordered by the cities of Simpsonville to the north, Fountain Inn to the east, and Greenville to the south. The city is located approximately 20 miles from the North Carolina border.
The city is located in the Reedy River watershed, which is part of the larger Savannah River watershed. The Reedy River flows through the city and is a major source of drinking water for the city. The city is also home to several small lakes and ponds, including Lake Robinson, Lake Conestee, and Lake Cunningham.
Climate
Mauldin has a humid subtropical climate, with hot, humid summers and mild winters. The average annual temperature is 61°F, with an average high of 79°F in July and an average low of 43°F in January. The average annual precipitation is 46 inches, with the wettest month being July, when an average of 6.2 inches of rain falls.
Demographics
As of the 2010 census, the population of Mauldin was 25,135. The racial makeup of the city was 79.3% White, 14.2% African American, 0.3% Native American, 2.2% Asian, 0.1% Pacific Islander, 1.7% from other races, and 2.4% from two or more races. Hispanic or Latino of any race were 5.2% of the population.
The median household income in Mauldin was $50,945 in 2019, and the median family income was $60,945. The per capita income was $25,945. The poverty rate was 11.3%.
Economy
Mauldin is home to several major employers, including BMW Manufacturing, Michelin North America, and Fluor Corporation. The city is also home to several small businesses, including restaurants, retail stores, and professional services.
The city is served by the Greenville-Spartanburg International Airport, which is located just south of the city. The airport is a major hub for air travel in the region and serves as a major economic driver for the city.
Mauldin is also home to several educational institutions, including the University of South Carolina Upstate, Greenville Technical College, and Bob Jones University. The city is also home to several public and private schools, including Mauldin High School, Mauldin Middle School, and Mauldin Elementary School.
Conclusion
Mauldin, South Carolina is a small city located in Greenville County, South Carolina. It is situated in the foothills of the Blue Ridge Mountains and is part of the Greenville-Spartanburg-Anderson Combined Statistical Area. The city has a population of approximately 25,000 people and is located just south of the city of Greenville. The city has a humid subtropical climate, with hot, humid summers and mild winters. The city is home to several major employers, including BMW Manufacturing, Michelin North America, and Fluor Corporation. The city is also home to several educational institutions, including the University of South Carolina Upstate, Greenville Technical College, and Bob Jones University. Mauldin is a vibrant city with a diverse economy and a strong sense of community.
Common Questions
What is Per Capita Income in Mauldin?
Per Capita income in Mauldin is $40,582.
What is the Median Family Income in Mauldin?
Median Family Income in Mauldin is $86,028.
What is the Median Household income in Mauldin?
Median Household Income in Mauldin is $75,565.
What is Income or Wage Gap in Mauldin?
Income or Wage Gap in Mauldin is 19.8%.
Women in Mauldin earn 80.2 cents for every dollar earned by a man.
What is Inequality or Gini Index in Mauldin?
Inequality or Gini Index in Mauldin is 0.38.
What is the Total Population of Mauldin?
Total Population of Mauldin is 25,267.
What is the Total Male Population of Mauldin?
Total Male Population of Mauldin is 12,273.
What is the Total Female Population of Mauldin?
Total Female Population of Mauldin is 12,994.
What is the Ratio of Males per 100 Females in Mauldin?
There are 94.45 Males per 100 Females in Mauldin.
What is the Ratio of Females per 100 Males in Mauldin?
There are 105.87 Females per 100 Males in Mauldin.
What is the Median Population Age in Mauldin?
Median Population Age in Mauldin is 42.3 Years.
What is the Average Family Size in Mauldin
Average Family Size in Mauldin is 2.8 People.
What is the Average Household Size in Mauldin
Average Household Size in Mauldin is 2.4 People.
How Large is the Labor Force in Mauldin?
There are 14,444 People in the Labor Forcein in Mauldin.
What is the Percentage of People in the Labor Force in Mauldin?
69.1% of People are in the Labor Force in Mauldin.
What is the Unemployment Rate in Mauldin?
Unemployment Rate in Mauldin is 5.0%.