Berkeley County, SC Map & Demographics
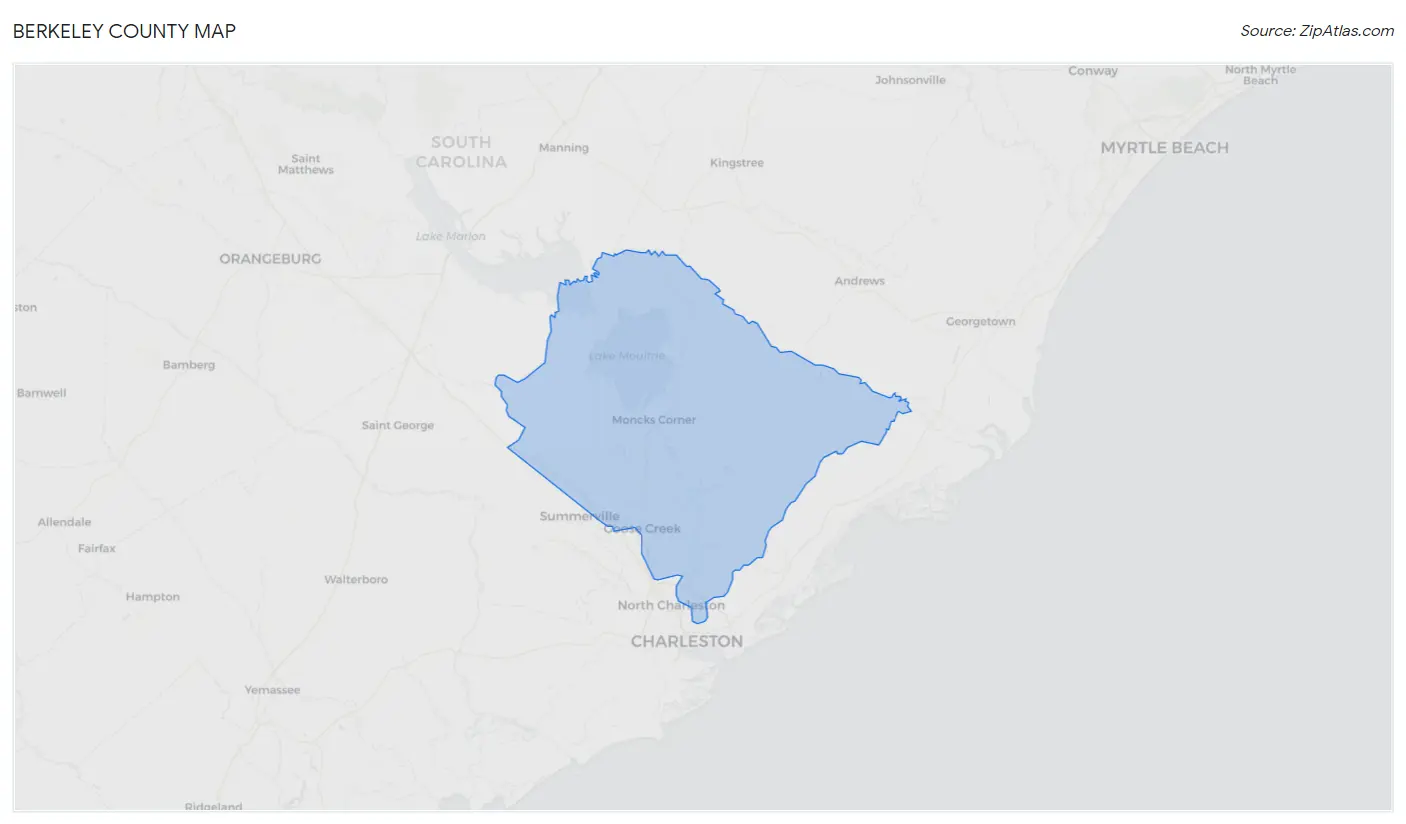
Berkeley County Map
Berkeley County Overview
$37,563
PER CAPITA INCOME
$88,689
AVG FAMILY INCOME
$77,874
AVG HOUSEHOLD INCOME
33.1%
WAGE / INCOME GAP [ % ]
66.9¢/ $1
WAGE / INCOME GAP [ $ ]
$9,715
FAMILY INCOME DEFICIT
0.43
INEQUALITY / GINI INDEX
231,419
TOTAL POPULATION
115,726
MALE POPULATION
115,693
FEMALE POPULATION
100.03
MALES / 100 FEMALES
99.97
FEMALES / 100 MALES
36.7
MEDIAN AGE
3.1
AVG FAMILY SIZE
2.6
AVG HOUSEHOLD SIZE
119,843
LABOR FORCE [ PEOPLE ]
65.6%
PERCENT IN LABOR FORCE
3.8%
UNEMPLOYMENT RATE
Berkeley County Area Codes
Income in Berkeley County
Income Overview in Berkeley County
Per Capita Income in Berkeley County is $37,563, while median incomes of families and households are $88,689 and $77,874 respectively.
| Characteristic | Number | Measure |
| Per Capita Income | 231,419 | $37,563 |
| Median Family Income | 60,372 | $88,689 |
| Mean Family Income | 60,372 | $109,498 |
| Median Household Income | 86,958 | $77,874 |
| Mean Household Income | 86,958 | $97,057 |
| Income Deficit | 60,372 | $9,715 |
| Wage / Income Gap (%) | 231,419 | 33.05% |
| Wage / Income Gap ($) | 231,419 | 66.95¢ per $1 |
| Gini / Inequality Index | 231,419 | 0.43 |
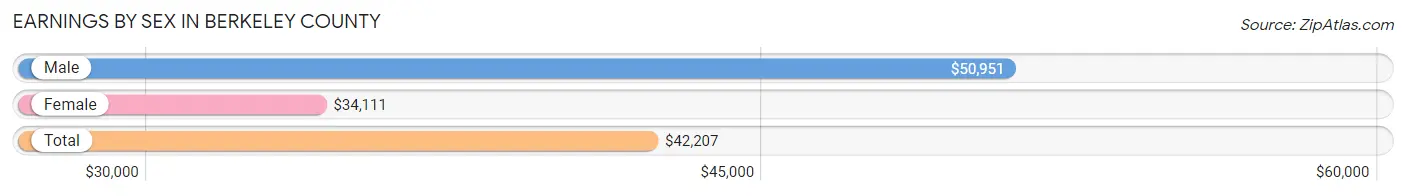
Earnings by Sex in Berkeley County
Average Earnings in Berkeley County are $42,207, $50,951 for men and $34,111 for women, a difference of 33.1%.
| Sex | Number | Average Earnings |
| Male | 67,121 (53.7%) | $50,951 |
| Female | 57,772 (46.3%) | $34,111 |
| Total | 124,893 (100.0%) | $42,207 |
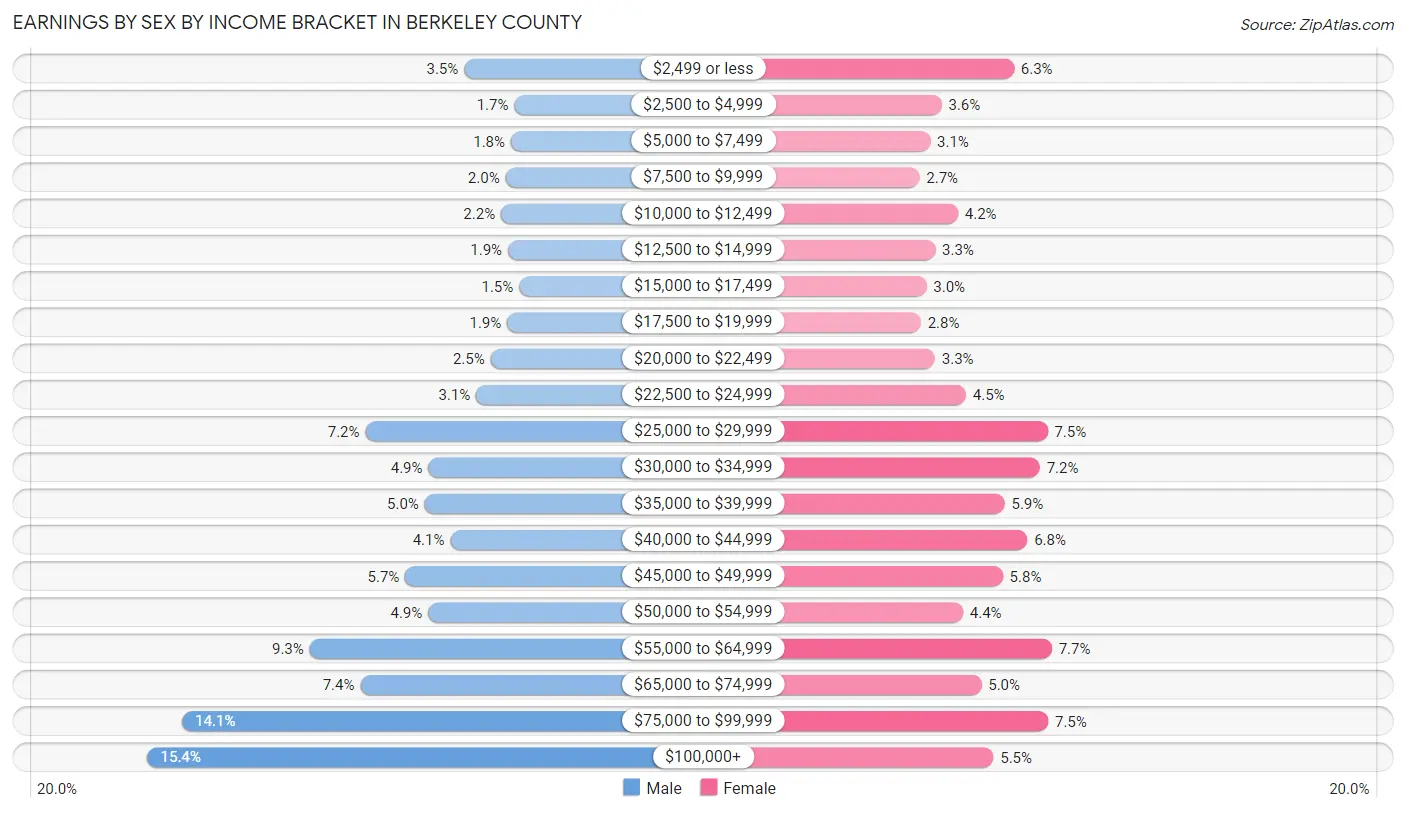
Earnings by Sex by Income Bracket in Berkeley County
The most common earnings brackets in Berkeley County are $100,000+ for men (10,327 | 15.4%) and $55,000 to $64,999 for women (4,439 | 7.7%).
| Income | Male | Female |
| $2,499 or less | 2,372 (3.5%) | 3,618 (6.3%) |
| $2,500 to $4,999 | 1,110 (1.7%) | 2,049 (3.5%) |
| $5,000 to $7,499 | 1,192 (1.8%) | 1,801 (3.1%) |
| $7,500 to $9,999 | 1,328 (2.0%) | 1,572 (2.7%) |
| $10,000 to $12,499 | 1,442 (2.1%) | 2,405 (4.2%) |
| $12,500 to $14,999 | 1,269 (1.9%) | 1,912 (3.3%) |
| $15,000 to $17,499 | 989 (1.5%) | 1,722 (3.0%) |
| $17,500 to $19,999 | 1,291 (1.9%) | 1,602 (2.8%) |
| $20,000 to $22,499 | 1,706 (2.5%) | 1,909 (3.3%) |
| $22,500 to $24,999 | 2,070 (3.1%) | 2,576 (4.5%) |
| $25,000 to $29,999 | 4,850 (7.2%) | 4,344 (7.5%) |
| $30,000 to $34,999 | 3,272 (4.9%) | 4,175 (7.2%) |
| $35,000 to $39,999 | 3,361 (5.0%) | 3,414 (5.9%) |
| $40,000 to $44,999 | 2,720 (4.1%) | 3,905 (6.8%) |
| $45,000 to $49,999 | 3,852 (5.7%) | 3,373 (5.8%) |
| $50,000 to $54,999 | 3,273 (4.9%) | 2,515 (4.3%) |
| $55,000 to $64,999 | 6,255 (9.3%) | 4,439 (7.7%) |
| $65,000 to $74,999 | 4,980 (7.4%) | 2,911 (5.0%) |
| $75,000 to $99,999 | 9,462 (14.1%) | 4,358 (7.5%) |
| $100,000+ | 10,327 (15.4%) | 3,172 (5.5%) |
| Total | 67,121 (100.0%) | 57,772 (100.0%) |
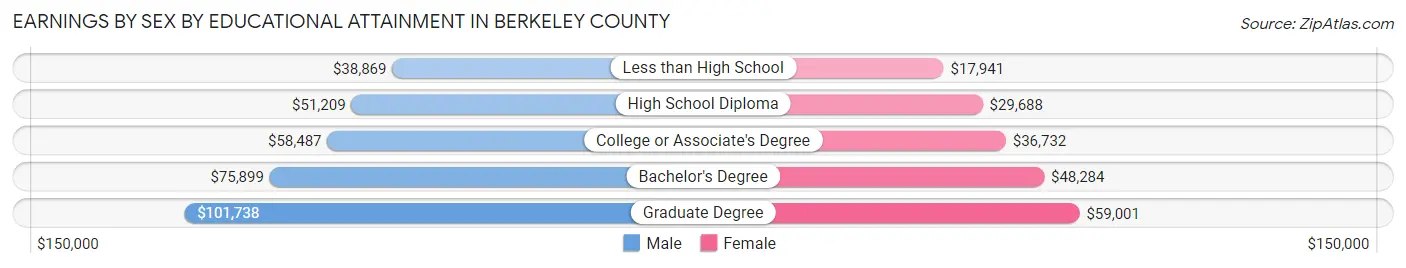
Earnings by Sex by Educational Attainment in Berkeley County
Average earnings in Berkeley County are $59,129 for men and $39,079 for women, a difference of 33.9%. Men with an educational attainment of graduate degree enjoy the highest average annual earnings of $101,738, while those with less than high school education earn the least with $38,869. Women with an educational attainment of graduate degree earn the most with the average annual earnings of $59,001, while those with less than high school education have the smallest earnings of $17,941.
| Educational Attainment | Male Income | Female Income |
| Less than High School | $38,869 | $17,941 |
| High School Diploma | $51,209 | $29,688 |
| College or Associate's Degree | $58,487 | $36,732 |
| Bachelor's Degree | $75,899 | $48,284 |
| Graduate Degree | $101,738 | $59,001 |
| Total | $59,129 | $39,079 |
Family Income in Berkeley County
Family Income Brackets in Berkeley County
According to the Berkeley County family income data, there are 14,731 families falling into the $100,000 to $149,999 income range, which is the most common income bracket and makes up 24.4% of all families. Conversely, the $10,000 to $14,999 income bracket is the least frequent group with only 966 families (1.6%) belonging to this category.
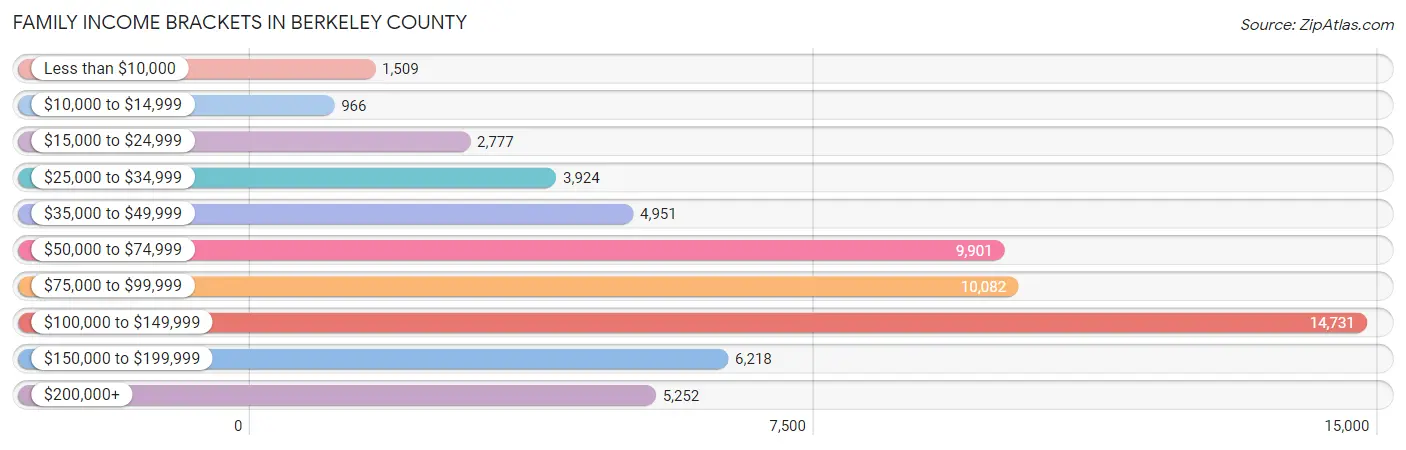
| Income Bracket | # Families | % Families |
| Less than $10,000 | 1,509 | 2.5% |
| $10,000 to $14,999 | 966 | 1.6% |
| $15,000 to $24,999 | 2,777 | 4.6% |
| $25,000 to $34,999 | 3,924 | 6.5% |
| $35,000 to $49,999 | 4,951 | 8.2% |
| $50,000 to $74,999 | 9,901 | 16.4% |
| $75,000 to $99,999 | 10,082 | 16.7% |
| $100,000 to $149,999 | 14,731 | 24.4% |
| $150,000 to $199,999 | 6,218 | 10.3% |
| $200,000+ | 5,252 | 8.7% |
Family Income by Famaliy Size in Berkeley County
7+ person families (620 | 1.0%) account for the highest median family income in Berkeley County with $107,260 per family, while 2-person families (28,843 | 47.8%) have the highest median income of $40,664 per family member.
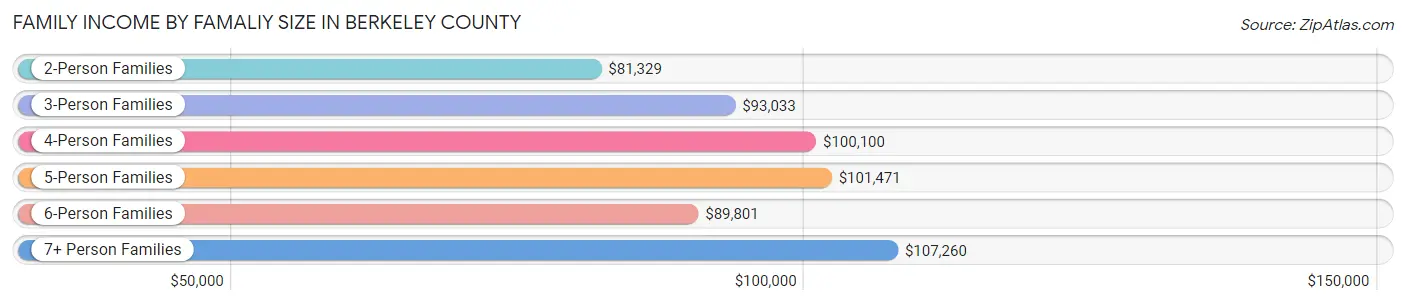
| Income Bracket | # Families | Median Income |
| 2-Person Families | 28,843 (47.8%) | $81,329 |
| 3-Person Families | 13,422 (22.2%) | $93,033 |
| 4-Person Families | 11,193 (18.5%) | $100,100 |
| 5-Person Families | 4,922 (8.2%) | $101,471 |
| 6-Person Families | 1,372 (2.3%) | $89,801 |
| 7+ Person Families | 620 (1.0%) | $107,260 |
| Total | 60,372 (100.0%) | $88,689 |
Family Income by Number of Earners in Berkeley County
The median family income in Berkeley County is $88,689, with families comprising 3+ earners (6,472) having the highest median family income of $135,902, while families with no earners (8,254) have the lowest median family income of $55,766, accounting for 10.7% and 13.7% of families, respectively.
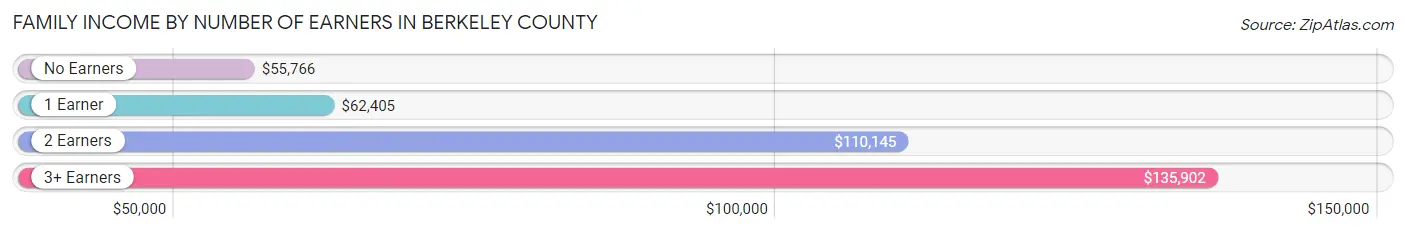
| Number of Earners | # Families | Median Income |
| No Earners | 8,254 (13.7%) | $55,766 |
| 1 Earner | 20,295 (33.6%) | $62,405 |
| 2 Earners | 25,351 (42.0%) | $110,145 |
| 3+ Earners | 6,472 (10.7%) | $135,902 |
| Total | 60,372 (100.0%) | $88,689 |
Household Income in Berkeley County
Household Income Brackets in Berkeley County
With 18,087 households falling in the category, the $100,000 to $149,999 income range is the most frequent in Berkeley County, accounting for 20.8% of all households. In contrast, only 2,435 households (2.8%) fall into the $10,000 to $14,999 income bracket, making it the least populous group.
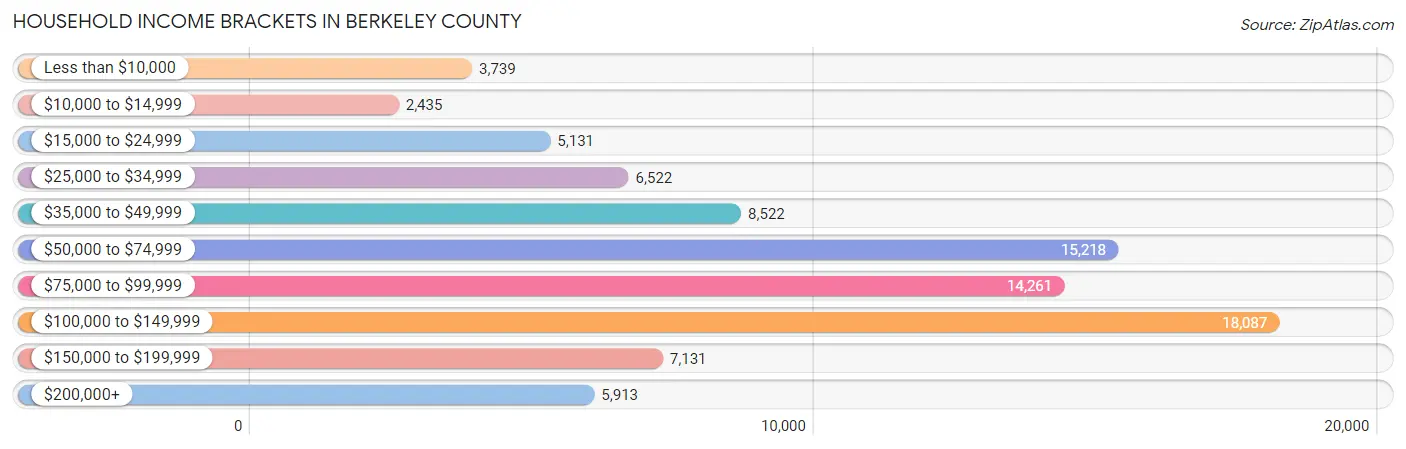
| Income Bracket | # Households | % Households |
| Less than $10,000 | 3,739 | 4.3% |
| $10,000 to $14,999 | 2,435 | 2.8% |
| $15,000 to $24,999 | 5,131 | 5.9% |
| $25,000 to $34,999 | 6,522 | 7.5% |
| $35,000 to $49,999 | 8,522 | 9.8% |
| $50,000 to $74,999 | 15,218 | 17.5% |
| $75,000 to $99,999 | 14,261 | 16.4% |
| $100,000 to $149,999 | 18,087 | 20.8% |
| $150,000 to $199,999 | 7,131 | 8.2% |
| $200,000+ | 5,913 | 6.8% |
Household Income by Householder Age in Berkeley County
The median household income in Berkeley County is $77,874, with the highest median household income of $87,610 found in the 45 to 64 years age bracket for the primary householder. A total of 31,540 households (36.3%) fall into this category. Meanwhile, the 65+ years age bracket for the primary householder has the lowest median household income of $58,571, with 20,776 households (23.9%) in this group.
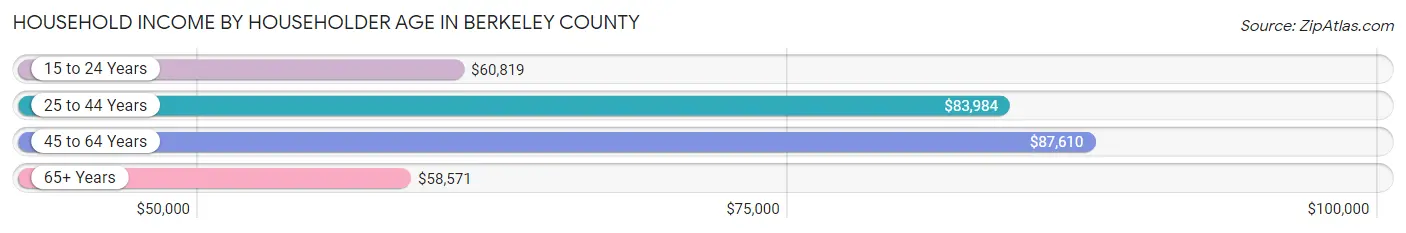
| Income Bracket | # Households | Median Income |
| 15 to 24 Years | 3,323 (3.8%) | $60,819 |
| 25 to 44 Years | 31,319 (36.0%) | $83,984 |
| 45 to 64 Years | 31,540 (36.3%) | $87,610 |
| 65+ Years | 20,776 (23.9%) | $58,571 |
| Total | 86,958 (100.0%) | $77,874 |
Poverty in Berkeley County
Income Below Poverty by Sex and Age in Berkeley County
With 9.5% poverty level for males and 12.3% for females among the residents of Berkeley County, under 5 year old males and 5 year old females are the most vulnerable to poverty, with 1,455 males (20.3%) and 368 females (25.6%) in their respective age groups living below the poverty level.
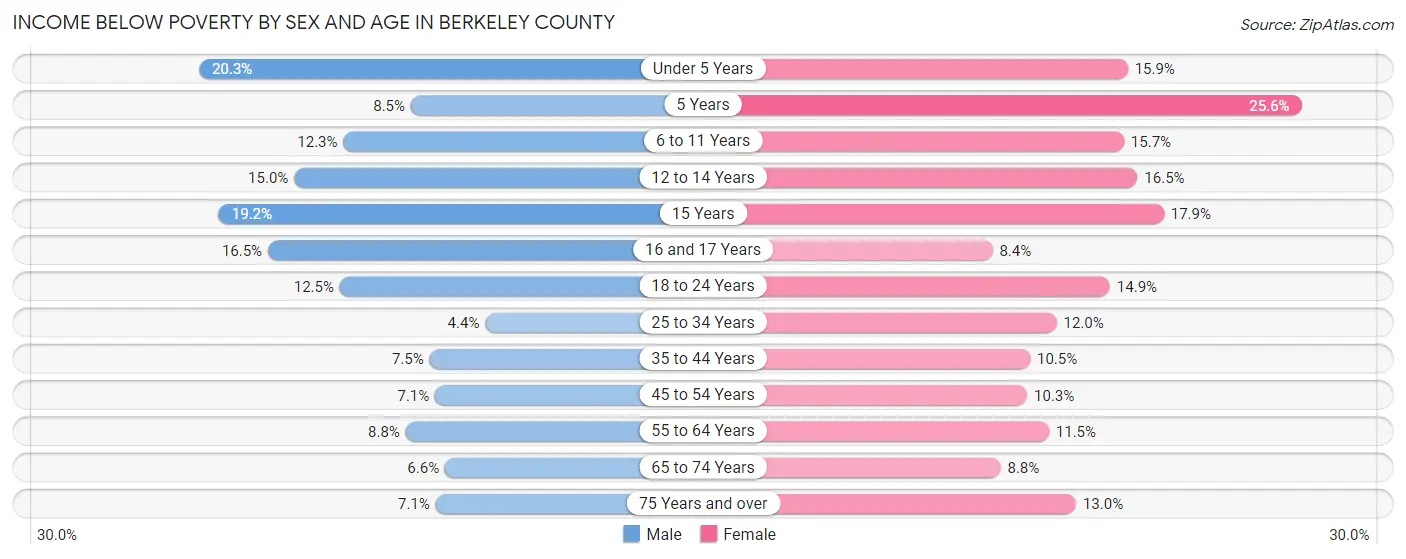
| Age Bracket | Male | Female |
| Under 5 Years | 1,455 (20.3%) | 1,107 (15.9%) |
| 5 Years | 151 (8.5%) | 368 (25.6%) |
| 6 to 11 Years | 1,183 (12.2%) | 1,387 (15.7%) |
| 12 to 14 Years | 612 (15.0%) | 757 (16.5%) |
| 15 Years | 346 (19.2%) | 290 (17.9%) |
| 16 and 17 Years | 470 (16.5%) | 246 (8.4%) |
| 18 to 24 Years | 1,338 (12.4%) | 1,349 (14.9%) |
| 25 to 34 Years | 697 (4.3%) | 1,978 (12.0%) |
| 35 to 44 Years | 1,142 (7.4%) | 1,668 (10.5%) |
| 45 to 54 Years | 992 (7.1%) | 1,495 (10.3%) |
| 55 to 64 Years | 1,202 (8.8%) | 1,698 (11.5%) |
| 65 to 74 Years | 638 (6.6%) | 999 (8.8%) |
| 75 Years and over | 383 (7.1%) | 867 (13.0%) |
| Total | 10,609 (9.5%) | 14,209 (12.3%) |
Income Above Poverty by Sex and Age in Berkeley County
According to the poverty statistics in Berkeley County, males aged 25 to 34 years and females aged 16 and 17 years are the age groups that are most secure financially, with 95.7% of males and 91.6% of females in these age groups living above the poverty line.
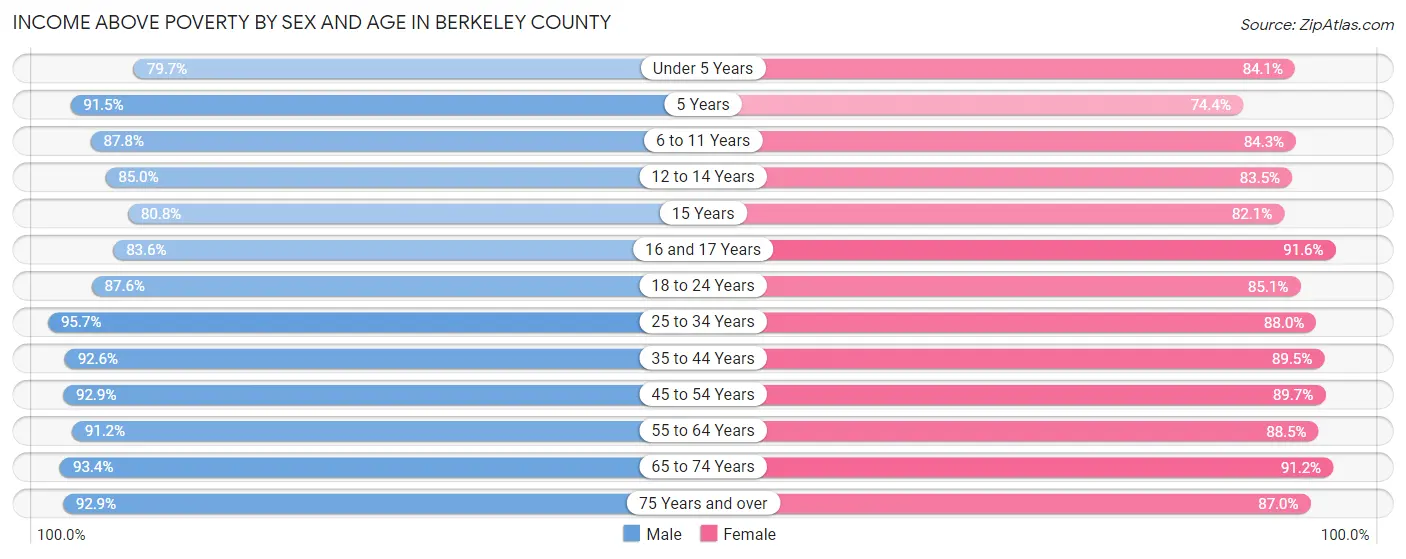
| Age Bracket | Male | Female |
| Under 5 Years | 5,715 (79.7%) | 5,845 (84.1%) |
| 5 Years | 1,628 (91.5%) | 1,070 (74.4%) |
| 6 to 11 Years | 8,478 (87.7%) | 7,442 (84.3%) |
| 12 to 14 Years | 3,472 (85.0%) | 3,843 (83.5%) |
| 15 Years | 1,458 (80.8%) | 1,327 (82.1%) |
| 16 and 17 Years | 2,388 (83.6%) | 2,686 (91.6%) |
| 18 to 24 Years | 9,410 (87.5%) | 7,687 (85.1%) |
| 25 to 34 Years | 15,335 (95.7%) | 14,560 (88.0%) |
| 35 to 44 Years | 14,182 (92.5%) | 14,255 (89.5%) |
| 45 to 54 Years | 12,909 (92.9%) | 12,987 (89.7%) |
| 55 to 64 Years | 12,495 (91.2%) | 13,030 (88.5%) |
| 65 to 74 Years | 9,047 (93.4%) | 10,307 (91.2%) |
| 75 Years and over | 5,001 (92.9%) | 5,783 (87.0%) |
| Total | 101,518 (90.5%) | 100,822 (87.6%) |
Income Below Poverty Among Married-Couple Families in Berkeley County
The poverty statistics for married-couple families in Berkeley County show that 4.1% or 1,817 of the total 43,963 families live below the poverty line. Families with 3 or 4 children have the highest poverty rate of 8.9%, comprising of 302 families. On the other hand, families with 5 or more children have the lowest poverty rate of 0.0%, which includes 0 families.
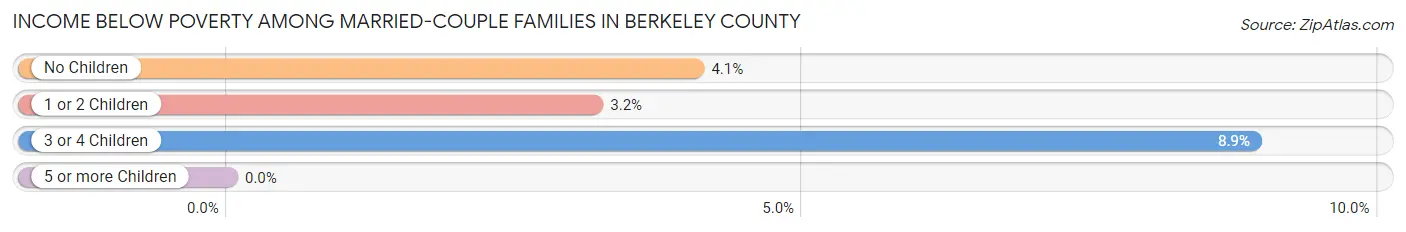
| Children | Above Poverty | Below Poverty |
| No Children | 24,988 (95.9%) | 1,058 (4.1%) |
| 1 or 2 Children | 13,930 (96.8%) | 457 (3.2%) |
| 3 or 4 Children | 3,087 (91.1%) | 302 (8.9%) |
| 5 or more Children | 141 (100.0%) | 0 (0.0%) |
| Total | 42,146 (95.9%) | 1,817 (4.1%) |
Income Below Poverty Among Single-Parent Households in Berkeley County
According to the poverty data in Berkeley County, 11.7% or 533 single-father households and 21.4% or 2,535 single-mother households are living below the poverty line. Among single-father households, those with 1 or 2 children have the highest poverty rate, with 452 households (25.4%) experiencing poverty. Likewise, among single-mother households, those with 5 or more children have the highest poverty rate, with 73 households (79.3%) falling below the poverty line.
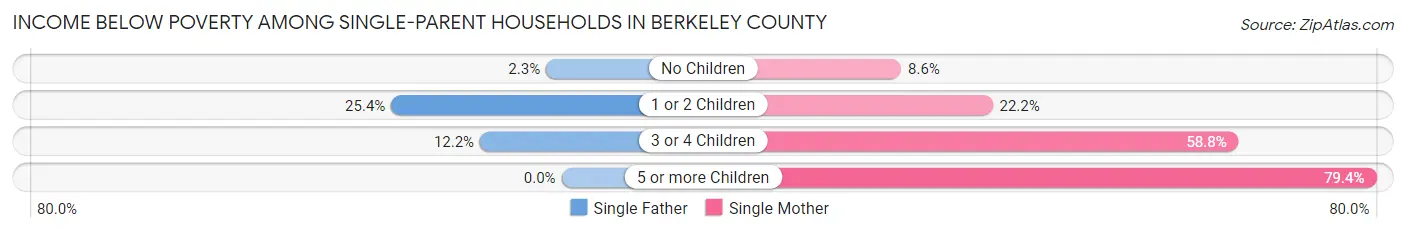
| Children | Single Father | Single Mother |
| No Children | 59 (2.3%) | 355 (8.6%) |
| 1 or 2 Children | 452 (25.4%) | 1,441 (22.2%) |
| 3 or 4 Children | 22 (12.1%) | 666 (58.8%) |
| 5 or more Children | 0 (0.0%) | 73 (79.3%) |
| Total | 533 (11.7%) | 2,535 (21.4%) |
Income Below Poverty Among Married-Couple vs Single-Parent Households in Berkeley County
The poverty data for Berkeley County shows that 1,817 of the married-couple family households (4.1%) and 3,068 of the single-parent households (18.7%) are living below the poverty level. Within the married-couple family households, those with 3 or 4 children have the highest poverty rate, with 302 households (8.9%) falling below the poverty line. Among the single-parent households, those with 5 or more children have the highest poverty rate, with 73 household (62.9%) living below poverty.
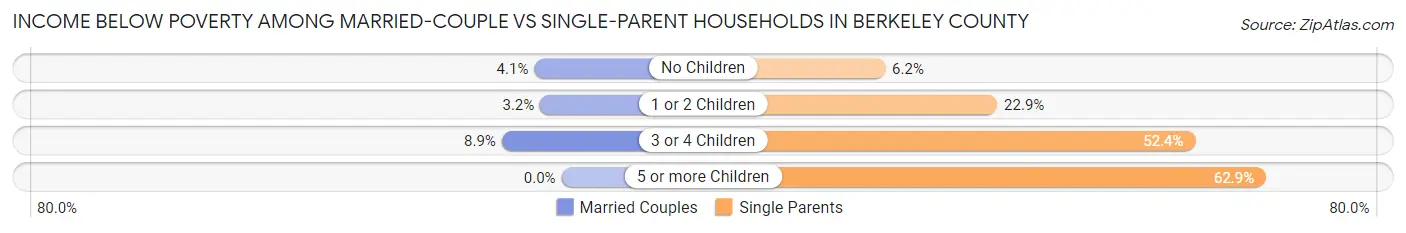
| Children | Married-Couple Families | Single-Parent Households |
| No Children | 1,058 (4.1%) | 414 (6.2%) |
| 1 or 2 Children | 457 (3.2%) | 1,893 (22.9%) |
| 3 or 4 Children | 302 (8.9%) | 688 (52.4%) |
| 5 or more Children | 0 (0.0%) | 73 (62.9%) |
| Total | 1,817 (4.1%) | 3,068 (18.7%) |
Race in Berkeley County
The most populous races in Berkeley County are White / Caucasian (148,806 | 64.3%), Black / African American (54,006 | 23.3%), and Hispanic or Latino (16,866 | 7.3%).
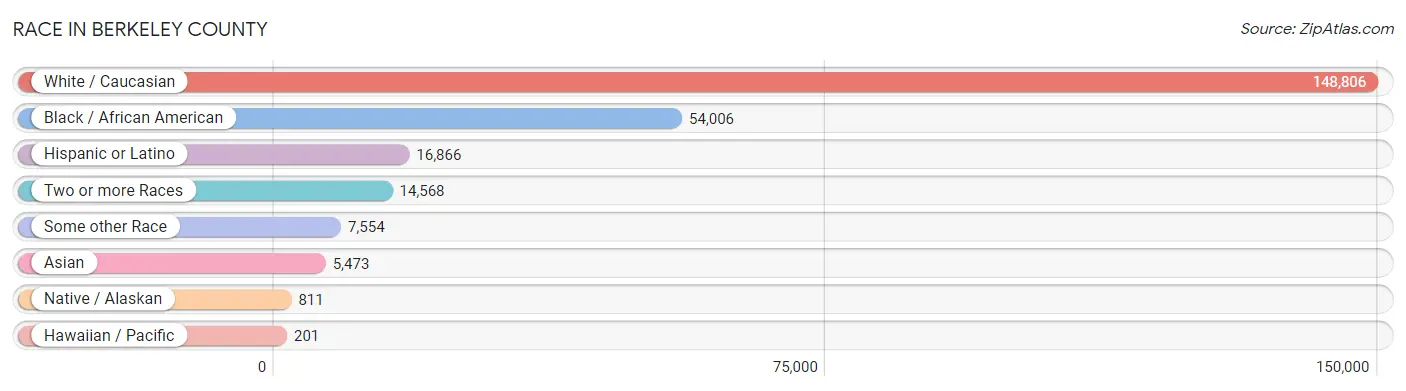
| Race | # Population | % Population |
| Asian | 5,473 | 2.4% |
| Black / African American | 54,006 | 23.3% |
| Hawaiian / Pacific | 201 | 0.1% |
| Hispanic or Latino | 16,866 | 7.3% |
| Native / Alaskan | 811 | 0.4% |
| White / Caucasian | 148,806 | 64.3% |
| Two or more Races | 14,568 | 6.3% |
| Some other Race | 7,554 | 3.3% |
| Total | 231,419 | 100.0% |
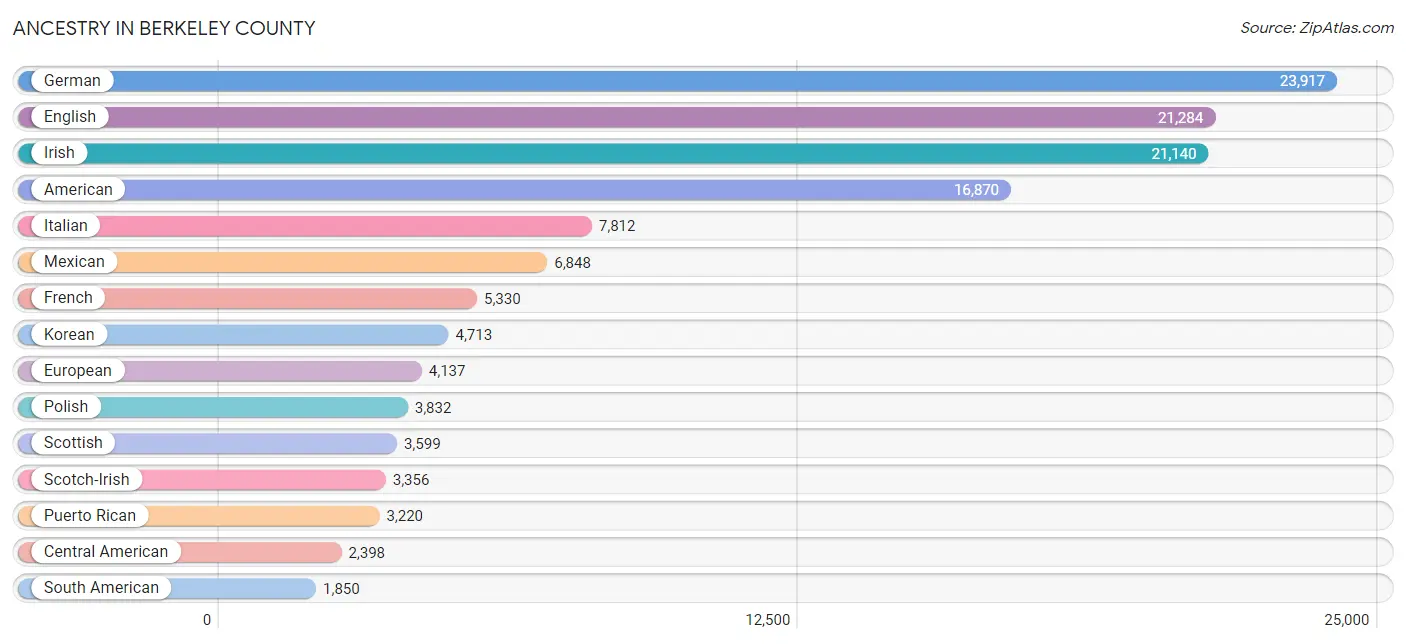
Ancestry in Berkeley County
The most populous ancestries reported in Berkeley County are German (23,917 | 10.3%), English (21,284 | 9.2%), Irish (21,140 | 9.1%), American (16,870 | 7.3%), and Italian (7,812 | 3.4%), together accounting for 39.3% of all Berkeley County residents.
| Ancestry | # Population | % Population |
| Afghan | 45 | 0.0% |
| African | 1,073 | 0.5% |
| Alaska Native | 2 | 0.0% |
| Albanian | 13 | 0.0% |
| Alsatian | 26 | 0.0% |
| American | 16,870 | 7.3% |
| Apache | 38 | 0.0% |
| Arab | 430 | 0.2% |
| Argentinean | 74 | 0.0% |
| Armenian | 161 | 0.1% |
| Assyrian / Chaldean / Syriac | 56 | 0.0% |
| Australian | 86 | 0.0% |
| Austrian | 237 | 0.1% |
| Bahamian | 85 | 0.0% |
| Bangladeshi | 6 | 0.0% |
| Barbadian | 13 | 0.0% |
| Belgian | 125 | 0.1% |
| Bermudan | 43 | 0.0% |
| Bhutanese | 402 | 0.2% |
| Blackfeet | 158 | 0.1% |
| Bolivian | 81 | 0.0% |
| Brazilian | 891 | 0.4% |
| British | 1,308 | 0.6% |
| British West Indian | 35 | 0.0% |
| Bulgarian | 39 | 0.0% |
| Burmese | 690 | 0.3% |
| Cajun | 54 | 0.0% |
| Canadian | 267 | 0.1% |
| Cape Verdean | 11 | 0.0% |
| Celtic | 212 | 0.1% |
| Central American | 2,398 | 1.0% |
| Central American Indian | 213 | 0.1% |
| Cherokee | 1,169 | 0.5% |
| Cheyenne | 8 | 0.0% |
| Chickasaw | 49 | 0.0% |
| Chilean | 134 | 0.1% |
| Chippewa | 7 | 0.0% |
| Choctaw | 63 | 0.0% |
| Colombian | 566 | 0.2% |
| Costa Rican | 17 | 0.0% |
| Cree | 14 | 0.0% |
| Creek | 50 | 0.0% |
| Croatian | 53 | 0.0% |
| Cuban | 466 | 0.2% |
| Czech | 601 | 0.3% |
| Czechoslovakian | 83 | 0.0% |
| Danish | 441 | 0.2% |
| Dominican | 291 | 0.1% |
| Dutch | 1,381 | 0.6% |
| Eastern European | 269 | 0.1% |
| Ecuadorian | 197 | 0.1% |
| Egyptian | 96 | 0.0% |
| English | 21,284 | 9.2% |
| Estonian | 44 | 0.0% |
| Ethiopian | 14 | 0.0% |
| European | 4,137 | 1.8% |
| Filipino | 36 | 0.0% |
| Finnish | 254 | 0.1% |
| French | 5,330 | 2.3% |
| French Canadian | 1,059 | 0.5% |
| German | 23,917 | 10.3% |
| Greek | 675 | 0.3% |
| Guamanian / Chamorro | 79 | 0.0% |
| Guatemalan | 199 | 0.1% |
| Guyanese | 16 | 0.0% |
| Haitian | 268 | 0.1% |
| Honduran | 1,584 | 0.7% |
| Hopi | 14 | 0.0% |
| Houma | 2 | 0.0% |
| Hungarian | 409 | 0.2% |
| Icelander | 9 | 0.0% |
| Indian (Asian) | 848 | 0.4% |
| Iranian | 67 | 0.0% |
| Iraqi | 13 | 0.0% |
| Irish | 21,140 | 9.1% |
| Iroquois | 84 | 0.0% |
| Israeli | 24 | 0.0% |
| Italian | 7,812 | 3.4% |
| Jamaican | 120 | 0.1% |
| Japanese | 65 | 0.0% |
| Kenyan | 58 | 0.0% |
| Korean | 4,713 | 2.0% |
| Lebanese | 186 | 0.1% |
| Lithuanian | 316 | 0.1% |
| Lumbee | 158 | 0.1% |
| Luxembourger | 14 | 0.0% |
| Malaysian | 266 | 0.1% |
| Maltese | 18 | 0.0% |
| Marshallese | 11 | 0.0% |
| Mexican | 6,848 | 3.0% |
| Mexican American Indian | 185 | 0.1% |
| Moroccan | 70 | 0.0% |
| Native Hawaiian | 141 | 0.1% |
| Navajo | 12 | 0.0% |
| Nicaraguan | 32 | 0.0% |
| Nigerian | 189 | 0.1% |
| Northern European | 262 | 0.1% |
| Norwegian | 1,632 | 0.7% |
| Pakistani | 222 | 0.1% |
| Panamanian | 66 | 0.0% |
| Paraguayan | 13 | 0.0% |
| Pennsylvania German | 31 | 0.0% |
| Peruvian | 304 | 0.1% |
| Polish | 3,832 | 1.7% |
| Portuguese | 620 | 0.3% |
| Potawatomi | 17 | 0.0% |
| Pueblo | 14 | 0.0% |
| Puerto Rican | 3,220 | 1.4% |
| Romanian | 100 | 0.0% |
| Russian | 501 | 0.2% |
| Salvadoran | 500 | 0.2% |
| Samoan | 40 | 0.0% |
| Scandinavian | 486 | 0.2% |
| Scotch-Irish | 3,356 | 1.5% |
| Scottish | 3,599 | 1.6% |
| Seminole | 41 | 0.0% |
| Serbian | 12 | 0.0% |
| Sioux | 59 | 0.0% |
| Slavic | 50 | 0.0% |
| Slovak | 146 | 0.1% |
| Slovene | 38 | 0.0% |
| South American | 1,850 | 0.8% |
| Spaniard | 206 | 0.1% |
| Spanish | 216 | 0.1% |
| Sri Lankan | 677 | 0.3% |
| Subsaharan African | 1,591 | 0.7% |
| Sudanese | 34 | 0.0% |
| Swedish | 872 | 0.4% |
| Swiss | 327 | 0.1% |
| Thai | 386 | 0.2% |
| Tlingit-Haida | 16 | 0.0% |
| Trinidadian and Tobagonian | 230 | 0.1% |
| Turkish | 39 | 0.0% |
| Ukrainian | 391 | 0.2% |
| Uruguayan | 82 | 0.0% |
| Venezuelan | 399 | 0.2% |
| Vietnamese | 69 | 0.0% |
| Welsh | 1,037 | 0.4% |
| Yaqui | 14 | 0.0% |
| Yugoslavian | 35 | 0.0% |
| Zimbabwean | 30 | 0.0% | View All 141 Rows |
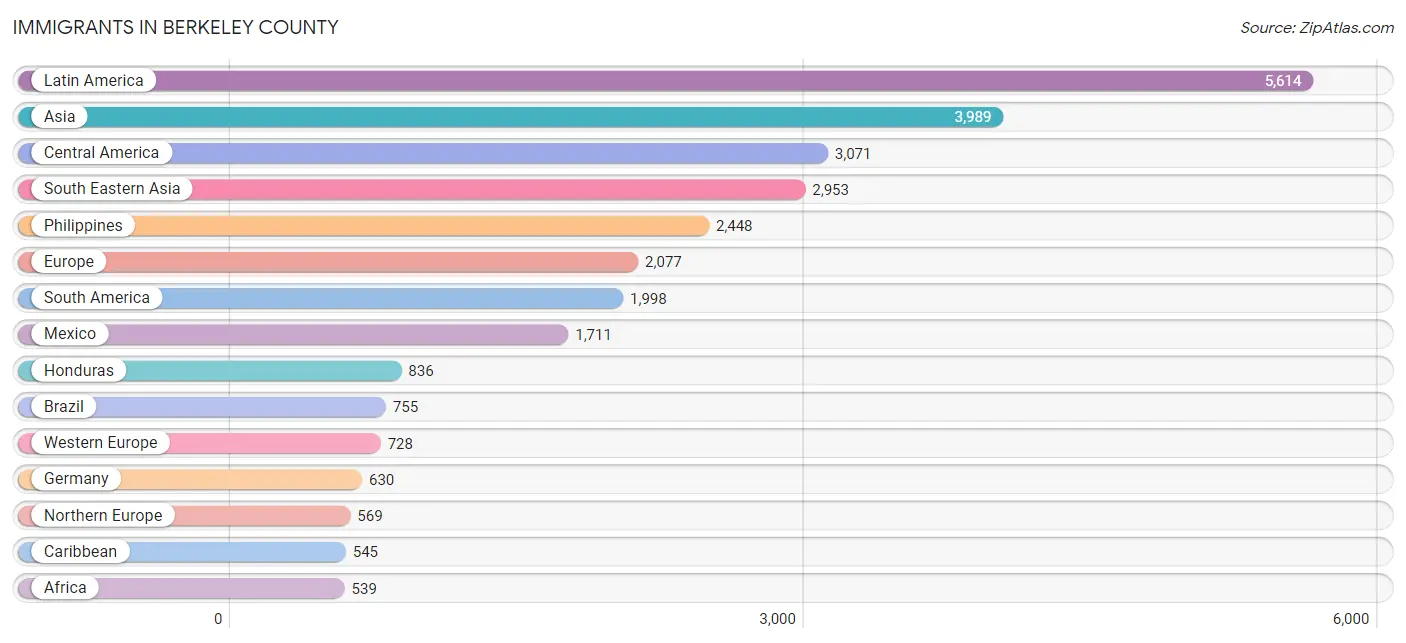
Immigrants in Berkeley County
The most numerous immigrant groups reported in Berkeley County came from Latin America (5,614 | 2.4%), Asia (3,989 | 1.7%), Central America (3,071 | 1.3%), South Eastern Asia (2,953 | 1.3%), and Philippines (2,448 | 1.1%), together accounting for 7.8% of all Berkeley County residents.
| Immigration Origin | # Population | % Population |
| Afghanistan | 71 | 0.0% |
| Africa | 539 | 0.2% |
| Argentina | 53 | 0.0% |
| Asia | 3,989 | 1.7% |
| Australia | 63 | 0.0% |
| Bangladesh | 58 | 0.0% |
| Barbados | 17 | 0.0% |
| Bolivia | 3 | 0.0% |
| Bosnia and Herzegovina | 14 | 0.0% |
| Brazil | 755 | 0.3% |
| Bulgaria | 63 | 0.0% |
| Cambodia | 16 | 0.0% |
| Canada | 292 | 0.1% |
| Caribbean | 545 | 0.2% |
| Central America | 3,071 | 1.3% |
| Chile | 78 | 0.0% |
| China | 314 | 0.1% |
| Colombia | 394 | 0.2% |
| Costa Rica | 5 | 0.0% |
| Cuba | 94 | 0.0% |
| Denmark | 78 | 0.0% |
| Dominica | 17 | 0.0% |
| Dominican Republic | 76 | 0.0% |
| Eastern Africa | 55 | 0.0% |
| Eastern Asia | 503 | 0.2% |
| Eastern Europe | 363 | 0.2% |
| Ecuador | 95 | 0.0% |
| Egypt | 159 | 0.1% |
| El Salvador | 293 | 0.1% |
| England | 189 | 0.1% |
| Europe | 2,077 | 0.9% |
| France | 40 | 0.0% |
| Germany | 630 | 0.3% |
| Ghana | 11 | 0.0% |
| Greece | 63 | 0.0% |
| Guatemala | 204 | 0.1% |
| Haiti | 115 | 0.1% |
| Honduras | 836 | 0.4% |
| Hong Kong | 14 | 0.0% |
| Hungary | 34 | 0.0% |
| India | 198 | 0.1% |
| Indonesia | 14 | 0.0% |
| Iran | 28 | 0.0% |
| Iraq | 25 | 0.0% |
| Ireland | 65 | 0.0% |
| Italy | 235 | 0.1% |
| Jamaica | 75 | 0.0% |
| Japan | 82 | 0.0% |
| Jordan | 87 | 0.0% |
| Kazakhstan | 8 | 0.0% |
| Korea | 107 | 0.1% |
| Laos | 50 | 0.0% |
| Latin America | 5,614 | 2.4% |
| Malaysia | 9 | 0.0% |
| Mexico | 1,711 | 0.7% |
| Micronesia | 11 | 0.0% |
| Middle Africa | 27 | 0.0% |
| Morocco | 5 | 0.0% |
| Netherlands | 58 | 0.0% |
| Nigeria | 164 | 0.1% |
| Northern Africa | 164 | 0.1% |
| Northern Europe | 569 | 0.3% |
| Norway | 3 | 0.0% |
| Oceania | 101 | 0.0% |
| Pakistan | 26 | 0.0% |
| Panama | 22 | 0.0% |
| Peru | 144 | 0.1% |
| Philippines | 2,448 | 1.1% |
| Poland | 143 | 0.1% |
| Portugal | 101 | 0.0% |
| Romania | 26 | 0.0% |
| Russia | 5 | 0.0% |
| Scotland | 179 | 0.1% |
| Somalia | 6 | 0.0% |
| South Africa | 17 | 0.0% |
| South America | 1,998 | 0.9% |
| South Central Asia | 389 | 0.2% |
| South Eastern Asia | 2,953 | 1.3% |
| Southern Europe | 417 | 0.2% |
| Spain | 18 | 0.0% |
| Sweden | 11 | 0.0% |
| Taiwan | 53 | 0.0% |
| Thailand | 152 | 0.1% |
| Trinidad and Tobago | 77 | 0.0% |
| Turkey | 29 | 0.0% |
| Ukraine | 78 | 0.0% |
| Uruguay | 19 | 0.0% |
| Venezuela | 457 | 0.2% |
| Vietnam | 264 | 0.1% |
| Western Africa | 276 | 0.1% |
| Western Asia | 144 | 0.1% |
| Western Europe | 728 | 0.3% |
| Zimbabwe | 16 | 0.0% | View All 93 Rows |
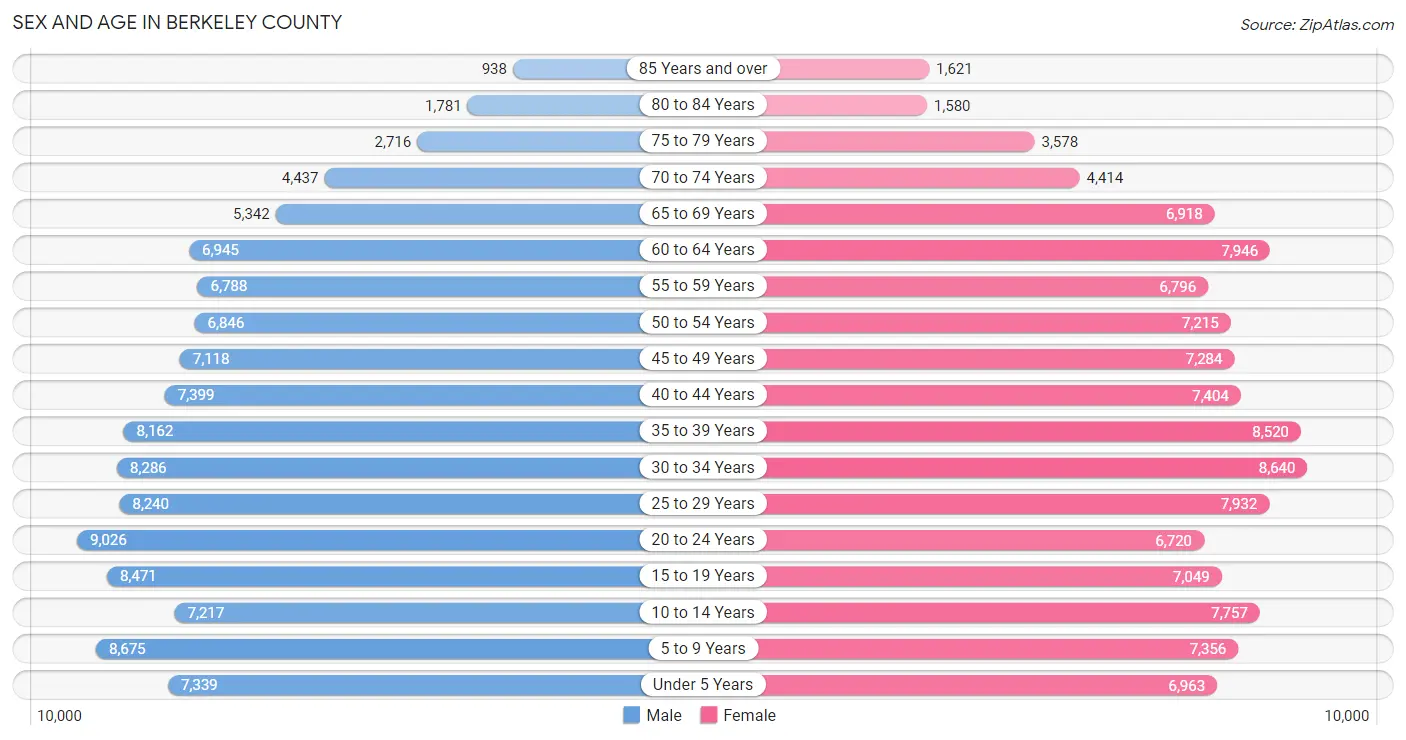
Sex and Age in Berkeley County
Sex and Age in Berkeley County
The most populous age groups in Berkeley County are 20 to 24 Years (9,026 | 7.8%) for men and 30 to 34 Years (8,640 | 7.5%) for women.
| Age Bracket | Male | Female |
| Under 5 Years | 7,339 (6.3%) | 6,963 (6.0%) |
| 5 to 9 Years | 8,675 (7.5%) | 7,356 (6.4%) |
| 10 to 14 Years | 7,217 (6.2%) | 7,757 (6.7%) |
| 15 to 19 Years | 8,471 (7.3%) | 7,049 (6.1%) |
| 20 to 24 Years | 9,026 (7.8%) | 6,720 (5.8%) |
| 25 to 29 Years | 8,240 (7.1%) | 7,932 (6.9%) |
| 30 to 34 Years | 8,286 (7.2%) | 8,640 (7.5%) |
| 35 to 39 Years | 8,162 (7.0%) | 8,520 (7.4%) |
| 40 to 44 Years | 7,399 (6.4%) | 7,404 (6.4%) |
| 45 to 49 Years | 7,118 (6.1%) | 7,284 (6.3%) |
| 50 to 54 Years | 6,846 (5.9%) | 7,215 (6.2%) |
| 55 to 59 Years | 6,788 (5.9%) | 6,796 (5.9%) |
| 60 to 64 Years | 6,945 (6.0%) | 7,946 (6.9%) |
| 65 to 69 Years | 5,342 (4.6%) | 6,918 (6.0%) |
| 70 to 74 Years | 4,437 (3.8%) | 4,414 (3.8%) |
| 75 to 79 Years | 2,716 (2.4%) | 3,578 (3.1%) |
| 80 to 84 Years | 1,781 (1.5%) | 1,580 (1.4%) |
| 85 Years and over | 938 (0.8%) | 1,621 (1.4%) |
| Total | 115,726 (100.0%) | 115,693 (100.0%) |
Families and Households in Berkeley County
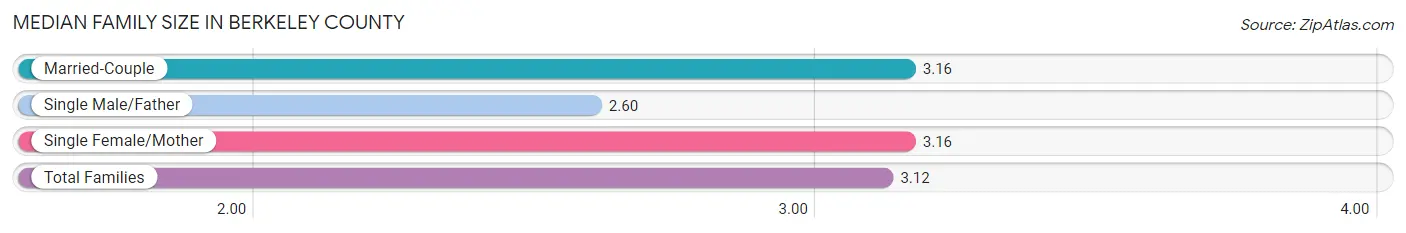
Median Family Size in Berkeley County
The median family size in Berkeley County is 3.12 persons per family, with married-couple families (43,963 | 72.8%) accounting for the largest median family size of 3.16 persons per family. On the other hand, single male/father families (4,540 | 7.5%) represent the smallest median family size with 2.60 persons per family.
| Family Type | # Families | Family Size |
| Married-Couple | 43,963 (72.8%) | 3.16 |
| Single Male/Father | 4,540 (7.5%) | 2.60 |
| Single Female/Mother | 11,869 (19.7%) | 3.16 |
| Total Families | 60,372 (100.0%) | 3.12 |
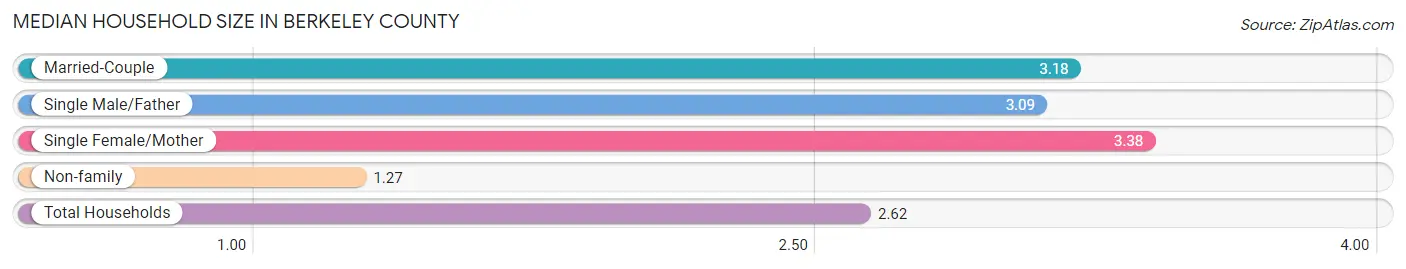
Median Household Size in Berkeley County
The median household size in Berkeley County is 2.62 persons per household, with single female/mother households (11,869 | 13.7%) accounting for the largest median household size of 3.38 persons per household. non-family households (26,586 | 30.6%) represent the smallest median household size with 1.27 persons per household.
| Household Type | # Households | Household Size |
| Married-Couple | 43,963 (50.6%) | 3.18 |
| Single Male/Father | 4,540 (5.2%) | 3.09 |
| Single Female/Mother | 11,869 (13.7%) | 3.38 |
| Non-family | 26,586 (30.6%) | 1.27 |
| Total Households | 86,958 (100.0%) | 2.62 |
Household Size by Marriage Status in Berkeley County
Out of a total of 86,958 households in Berkeley County, 60,372 (69.4%) are family households, while 26,586 (30.6%) are nonfamily households. The most numerous type of family households are 2-person households, comprising 26,885, and the most common type of nonfamily households are 1-person households, comprising 21,106.
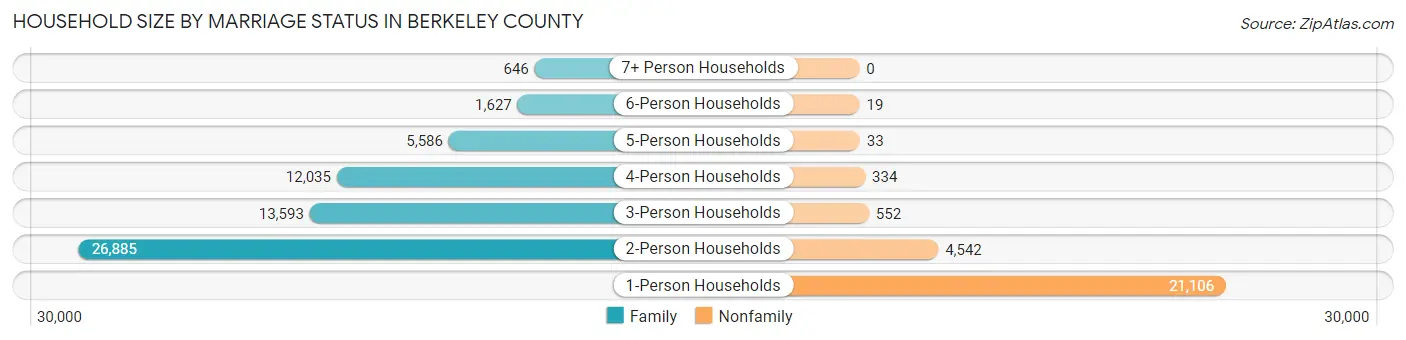
| Household Size | Family Households | Nonfamily Households |
| 1-Person Households | - | 21,106 (24.3%) |
| 2-Person Households | 26,885 (30.9%) | 4,542 (5.2%) |
| 3-Person Households | 13,593 (15.6%) | 552 (0.6%) |
| 4-Person Households | 12,035 (13.8%) | 334 (0.4%) |
| 5-Person Households | 5,586 (6.4%) | 33 (0.0%) |
| 6-Person Households | 1,627 (1.9%) | 19 (0.0%) |
| 7+ Person Households | 646 (0.7%) | 0 (0.0%) |
| Total | 60,372 (69.4%) | 26,586 (30.6%) |
Female Fertility in Berkeley County
Fertility by Age in Berkeley County
Average fertility rate in Berkeley County is 60.0 births per 1,000 women. Women in the age bracket of 20 to 34 years have the highest fertility rate with 116.0 births per 1,000 women. Women in the age bracket of 20 to 34 years acount for 81.6% of all women with births.
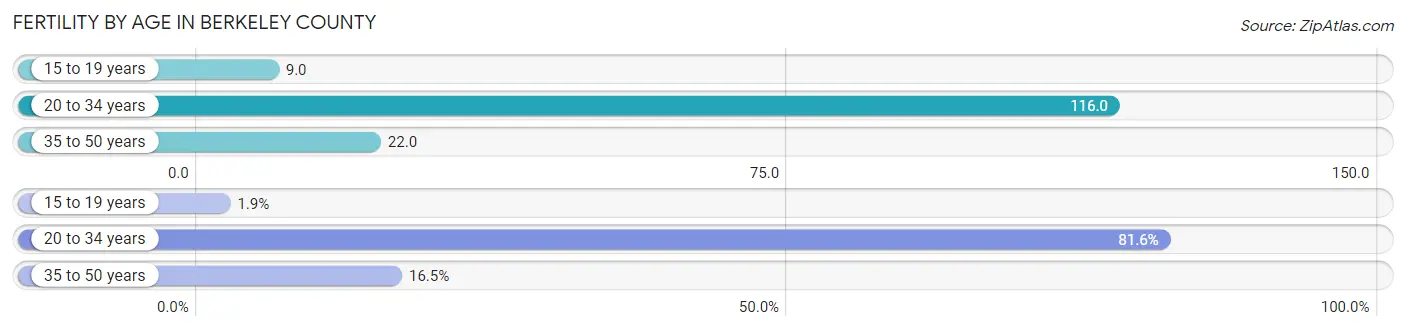
| Age Bracket | Women with Births | Births / 1,000 Women |
| 15 to 19 years | 63 (1.9%) | 9.0 |
| 20 to 34 years | 2,704 (81.6%) | 116.0 |
| 35 to 50 years | 545 (16.5%) | 22.0 |
| Total | 3,312 (100.0%) | 60.0 |
Fertility by Age by Marriage Status in Berkeley County
62.7% of women with births (3,312) in Berkeley County are married. The highest percentage of unmarried women with births falls into 15 to 19 years age bracket with 100.0% of them unmarried at the time of birth, while the lowest percentage of unmarried women with births belong to 35 to 50 years age bracket with 21.7% of them unmarried.
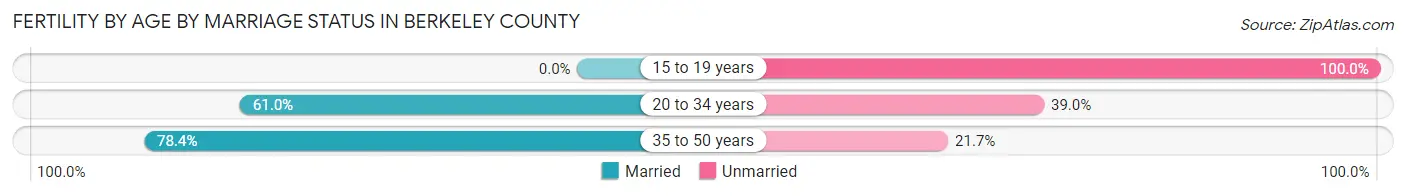
| Age Bracket | Married | Unmarried |
| 15 to 19 years | 0 (0.0%) | 63 (100.0%) |
| 20 to 34 years | 1,649 (61.0%) | 1,055 (39.0%) |
| 35 to 50 years | 427 (78.3%) | 118 (21.6%) |
| Total | 2,077 (62.7%) | 1,235 (37.3%) |
Fertility by Education in Berkeley County
Average fertility rate in Berkeley County is 60.0 births per 1,000 women. Women with the education attainment of graduate degree have the highest fertility rate of 85.0 births per 1,000 women, while women with the education attainment of less than high school have the lowest fertility at 41.0 births per 1,000 women. Women with the education attainment of college or associate's degree represent 37.9% of all women with births.
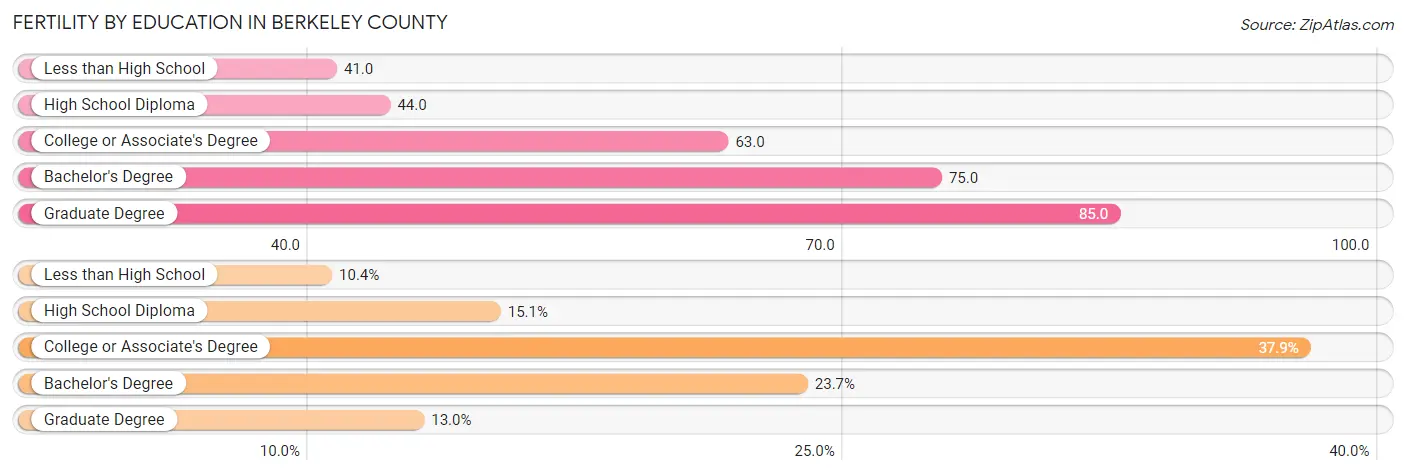
| Educational Attainment | Women with Births | Births / 1,000 Women |
| Less than High School | 343 (10.4%) | 41.0 |
| High School Diploma | 500 (15.1%) | 44.0 |
| College or Associate's Degree | 1,254 (37.9%) | 63.0 |
| Bachelor's Degree | 786 (23.7%) | 75.0 |
| Graduate Degree | 429 (13.0%) | 85.0 |
| Total | 3,312 (100.0%) | 60.0 |
Fertility by Education by Marriage Status in Berkeley County
37.3% of women with births in Berkeley County are unmarried. Women with the educational attainment of graduate degree are most likely to be married with 95.6% of them married at childbirth, while women with the educational attainment of less than high school are least likely to be married with 88.0% of them unmarried at childbirth.
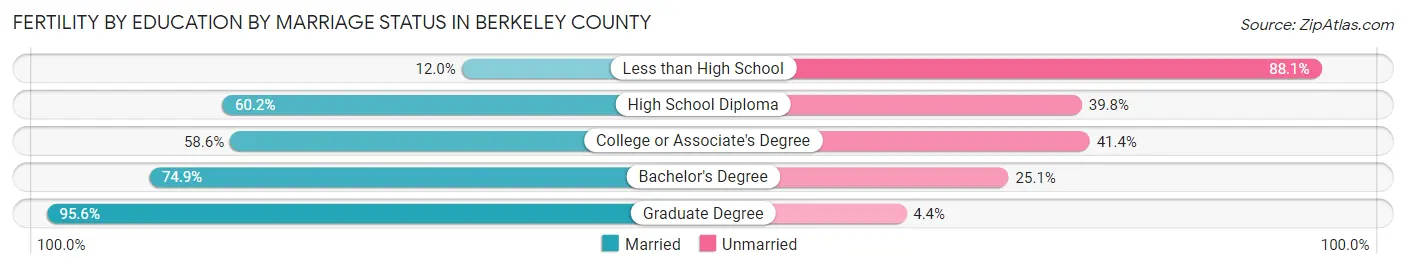
| Educational Attainment | Married | Unmarried |
| Less than High School | 41 (11.9%) | 302 (88.0%) |
| High School Diploma | 301 (60.2%) | 199 (39.8%) |
| College or Associate's Degree | 735 (58.6%) | 519 (41.4%) |
| Bachelor's Degree | 589 (74.9%) | 197 (25.1%) |
| Graduate Degree | 410 (95.6%) | 19 (4.4%) |
| Total | 2,077 (62.7%) | 1,235 (37.3%) |
Employment Characteristics in Berkeley County
Employment by Class of Employer in Berkeley County
Among the 113,737 employed individuals in Berkeley County, private company employees (71,780 | 63.1%), federal government employees (13,034 | 11.5%), and local government employees (7,786 | 6.9%) make up the most common classes of employment.
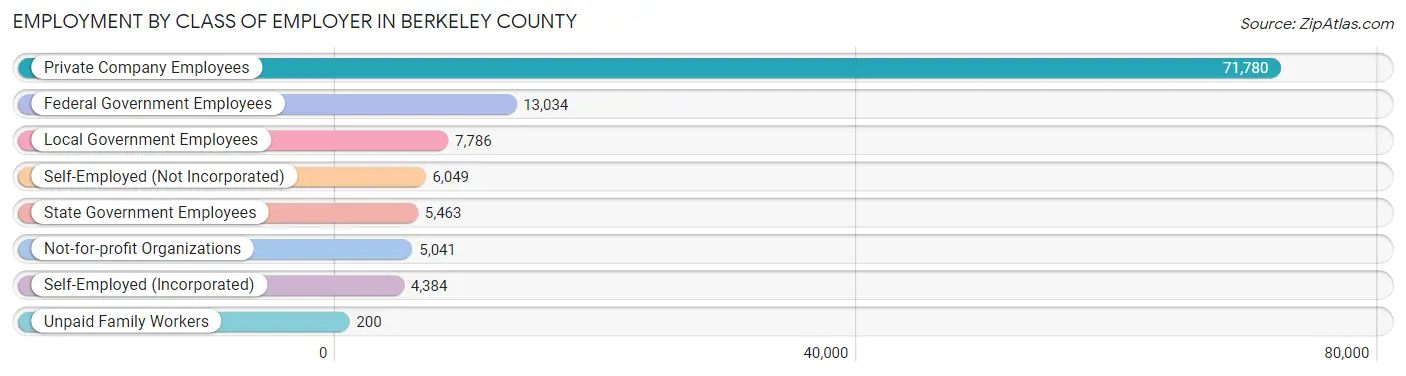
| Employer Class | # Employees | % Employees |
| Private Company Employees | 71,780 | 63.1% |
| Self-Employed (Incorporated) | 4,384 | 3.8% |
| Self-Employed (Not Incorporated) | 6,049 | 5.3% |
| Not-for-profit Organizations | 5,041 | 4.4% |
| Local Government Employees | 7,786 | 6.9% |
| State Government Employees | 5,463 | 4.8% |
| Federal Government Employees | 13,034 | 11.5% |
| Unpaid Family Workers | 200 | 0.2% |
| Total | 113,737 | 100.0% |
Employment Status by Age in Berkeley County
According to the labor force statistics for Berkeley County, out of the total population over 16 years of age (182,687), 65.6% or 119,843 individuals are in the labor force, with 3.8% or 4,554 of them unemployed. The age group with the highest labor force participation rate is 30 to 34 years, with 86.2% or 14,590 individuals in the labor force. Within the labor force, the 75 years and over age range has the highest percentage of unemployed individuals, with 12.9% or 104 of them being unemployed.
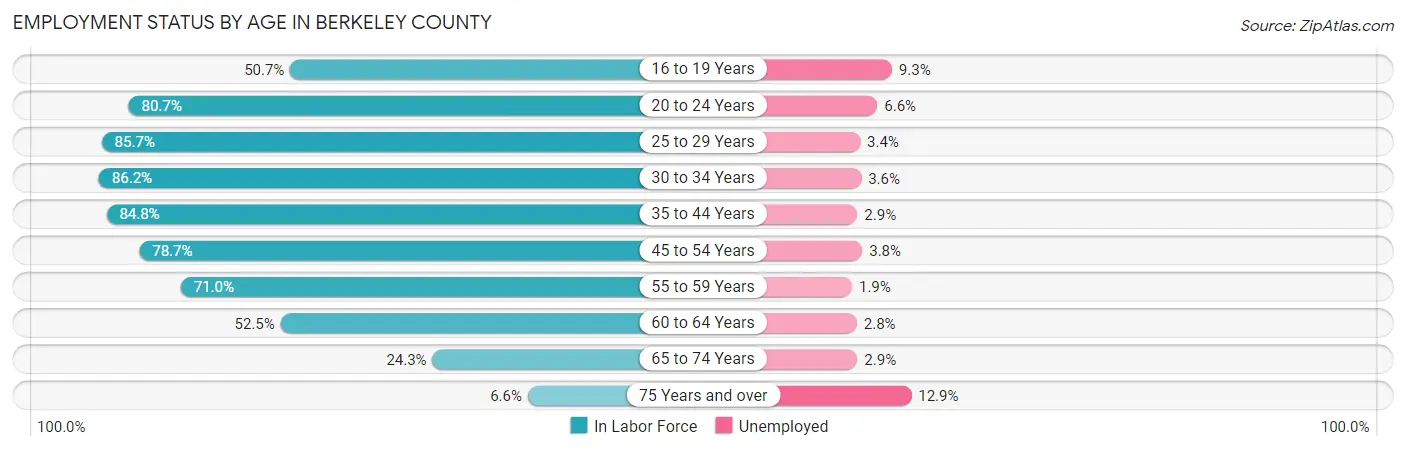
| Age Bracket | In Labor Force | Unemployed |
| 16 to 19 Years | 6,132 (50.7%) | 570 (9.3%) |
| 20 to 24 Years | 12,707 (80.7%) | 839 (6.6%) |
| 25 to 29 Years | 13,859 (85.7%) | 471 (3.4%) |
| 30 to 34 Years | 14,590 (86.2%) | 525 (3.6%) |
| 35 to 44 Years | 26,699 (84.8%) | 774 (2.9%) |
| 45 to 54 Years | 22,400 (78.7%) | 851 (3.8%) |
| 55 to 59 Years | 9,645 (71.0%) | 183 (1.9%) |
| 60 to 64 Years | 7,818 (52.5%) | 219 (2.8%) |
| 65 to 74 Years | 5,130 (24.3%) | 149 (2.9%) |
| 75 Years and over | 806 (6.6%) | 104 (12.9%) |
| Total | 119,843 (65.6%) | 4,554 (3.8%) |
Employment Status by Educational Attainment in Berkeley County
According to labor force statistics for Berkeley County, 78.2% of individuals (95,029) out of the total population between 25 and 64 years of age (121,521) are in the labor force, with 3.2% or 3,041 of them being unemployed. The group with the highest labor force participation rate are those with the educational attainment of bachelor's degree or higher, with 85.3% or 30,148 individuals in the labor force. Within the labor force, individuals with less than high school education have the highest percentage of unemployment, with 7.1% or 454 of them being unemployed.
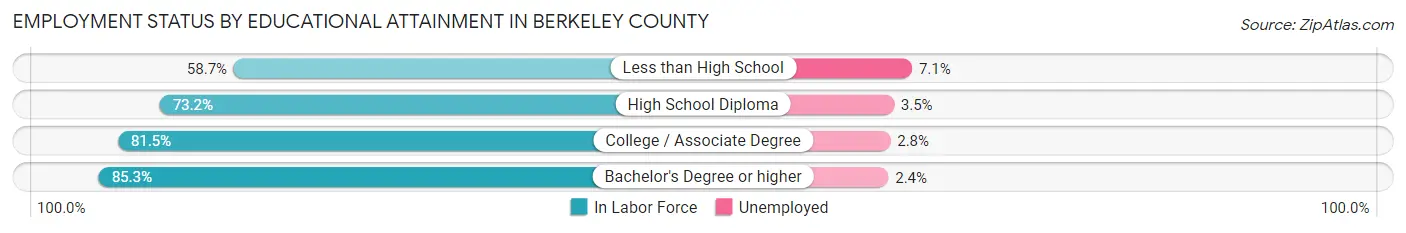
| Educational Attainment | In Labor Force | Unemployed |
| Less than High School | 6,391 (58.7%) | 773 (7.1%) |
| High School Diploma | 25,063 (73.2%) | 1,198 (3.5%) |
| College / Associate Degree | 33,457 (81.5%) | 1,149 (2.8%) |
| Bachelor's Degree or higher | 30,148 (85.3%) | 848 (2.4%) |
| Total | 95,029 (78.2%) | 3,889 (3.2%) |
Employment Occupations by Sex in Berkeley County
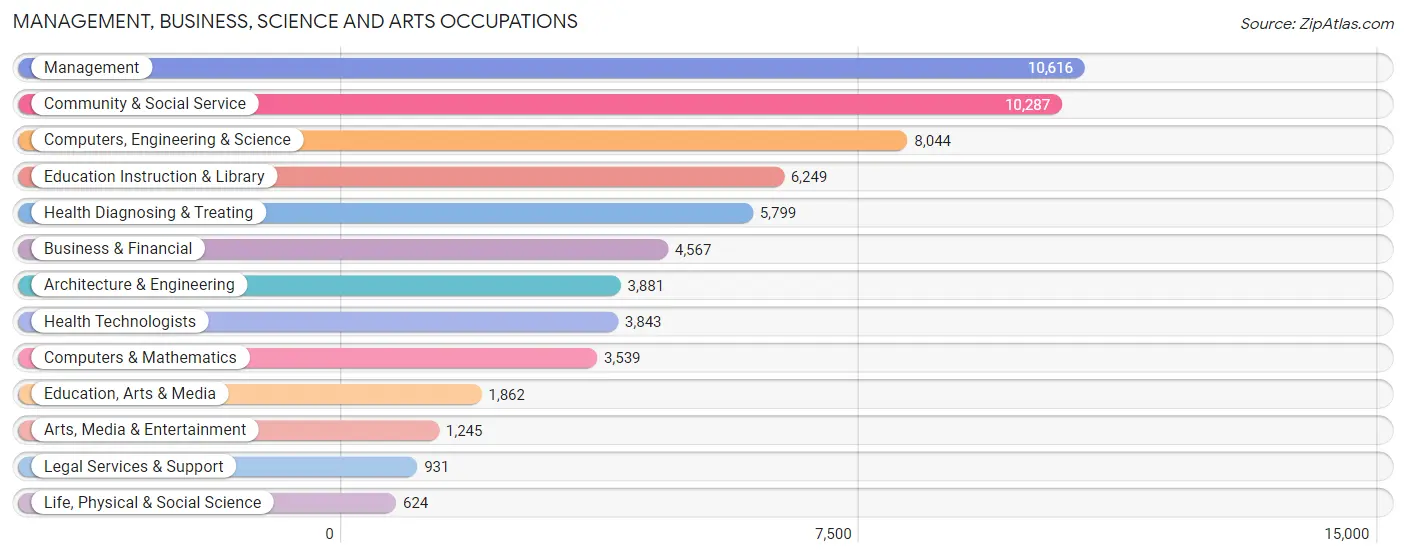
Management, Business, Science and Arts Occupations
The most common Management, Business, Science and Arts occupations in Berkeley County are Management (10,616 | 9.8%), Community & Social Service (10,287 | 9.5%), Computers, Engineering & Science (8,044 | 7.4%), Education Instruction & Library (6,249 | 5.8%), and Health Diagnosing & Treating (5,799 | 5.3%).
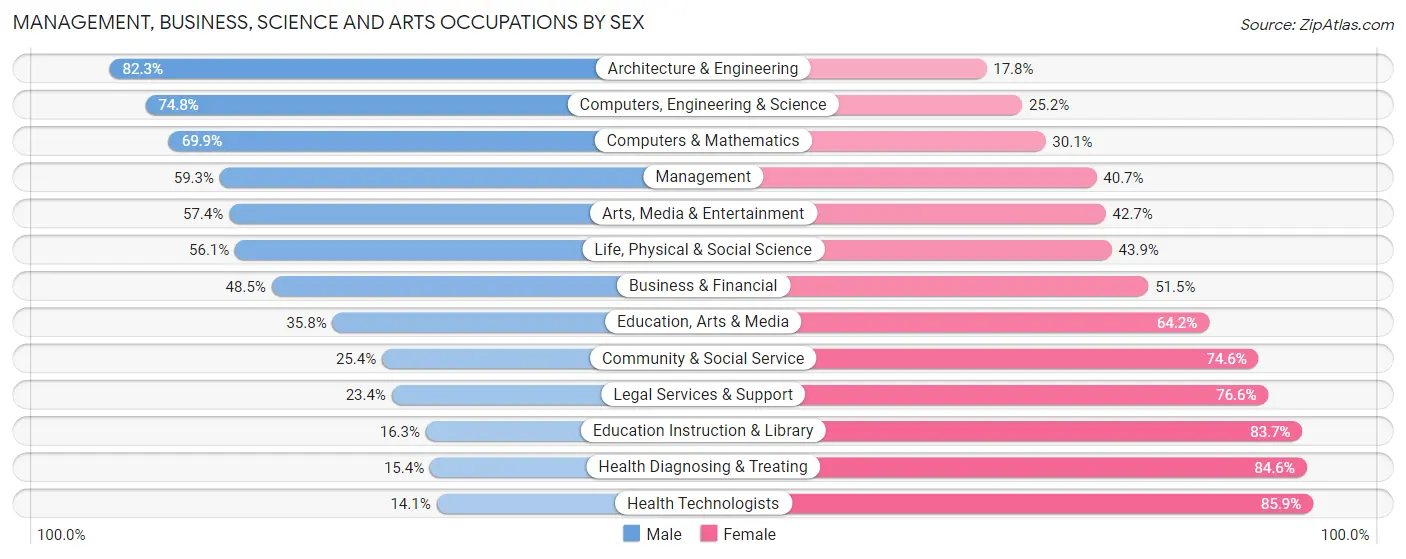
Management, Business, Science and Arts Occupations by Sex
Within the Management, Business, Science and Arts occupations in Berkeley County, the most male-oriented occupations are Architecture & Engineering (82.3%), Computers, Engineering & Science (74.8%), and Computers & Mathematics (69.9%), while the most female-oriented occupations are Health Technologists (85.9%), Health Diagnosing & Treating (84.6%), and Education Instruction & Library (83.7%).
| Occupation | Male | Female |
| Management | 6,293 (59.3%) | 4,323 (40.7%) |
| Business & Financial | 2,213 (48.5%) | 2,354 (51.5%) |
| Computers, Engineering & Science | 6,016 (74.8%) | 2,028 (25.2%) |
| Computers & Mathematics | 2,474 (69.9%) | 1,065 (30.1%) |
| Architecture & Engineering | 3,192 (82.3%) | 689 (17.7%) |
| Life, Physical & Social Science | 350 (56.1%) | 274 (43.9%) |
| Community & Social Service | 2,617 (25.4%) | 7,670 (74.6%) |
| Education, Arts & Media | 666 (35.8%) | 1,196 (64.2%) |
| Legal Services & Support | 218 (23.4%) | 713 (76.6%) |
| Education Instruction & Library | 1,019 (16.3%) | 5,230 (83.7%) |
| Arts, Media & Entertainment | 714 (57.4%) | 531 (42.6%) |
| Health Diagnosing & Treating | 895 (15.4%) | 4,904 (84.6%) |
| Health Technologists | 541 (14.1%) | 3,302 (85.9%) |
| Total (Category) | 18,034 (45.9%) | 21,279 (54.1%) |
| Total (Overall) | 57,009 (52.4%) | 51,717 (47.6%) |
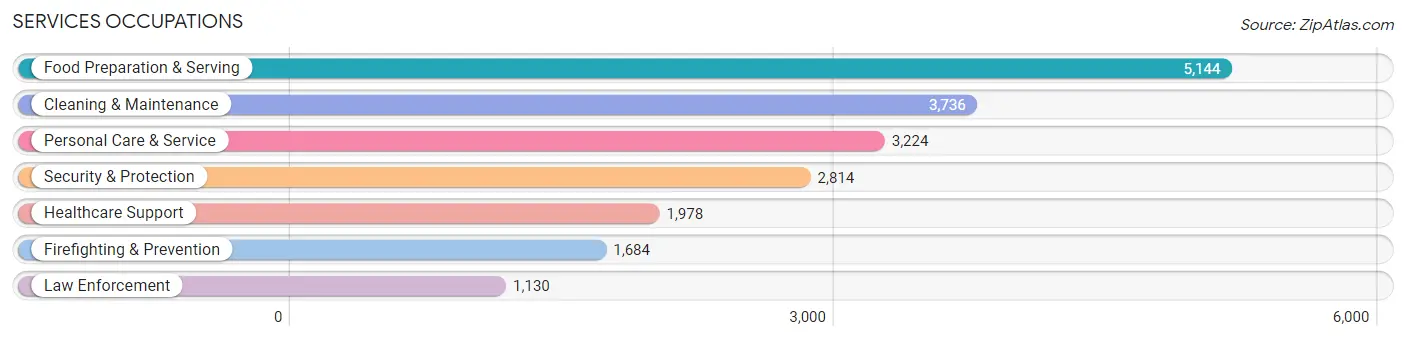
Services Occupations
The most common Services occupations in Berkeley County are Food Preparation & Serving (5,144 | 4.7%), Cleaning & Maintenance (3,736 | 3.4%), Personal Care & Service (3,224 | 3.0%), Security & Protection (2,814 | 2.6%), and Healthcare Support (1,978 | 1.8%).
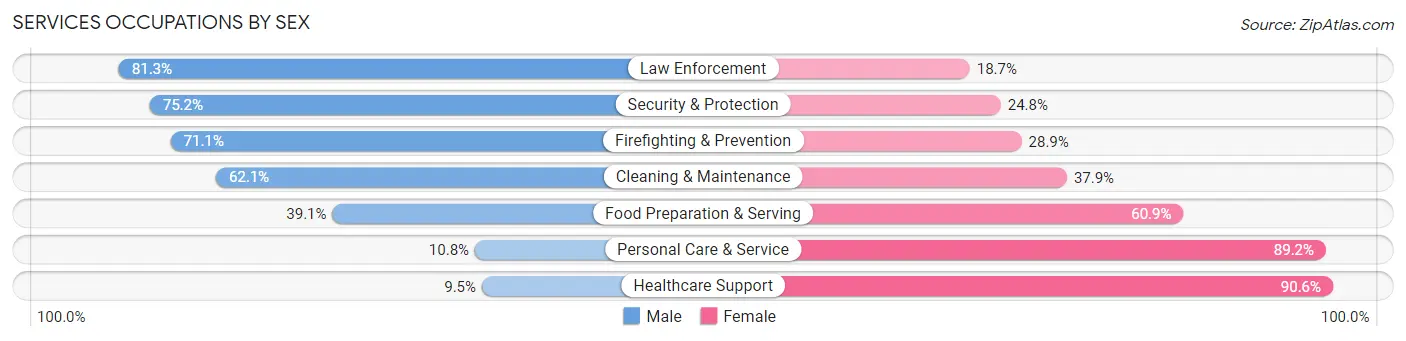
Services Occupations by Sex
Within the Services occupations in Berkeley County, the most male-oriented occupations are Law Enforcement (81.3%), Security & Protection (75.2%), and Firefighting & Prevention (71.1%), while the most female-oriented occupations are Healthcare Support (90.5%), Personal Care & Service (89.2%), and Food Preparation & Serving (60.9%).
| Occupation | Male | Female |
| Healthcare Support | 187 (9.5%) | 1,791 (90.5%) |
| Security & Protection | 2,116 (75.2%) | 698 (24.8%) |
| Firefighting & Prevention | 1,197 (71.1%) | 487 (28.9%) |
| Law Enforcement | 919 (81.3%) | 211 (18.7%) |
| Food Preparation & Serving | 2,009 (39.1%) | 3,135 (60.9%) |
| Cleaning & Maintenance | 2,320 (62.1%) | 1,416 (37.9%) |
| Personal Care & Service | 349 (10.8%) | 2,875 (89.2%) |
| Total (Category) | 6,981 (41.3%) | 9,915 (58.7%) |
| Total (Overall) | 57,009 (52.4%) | 51,717 (47.6%) |
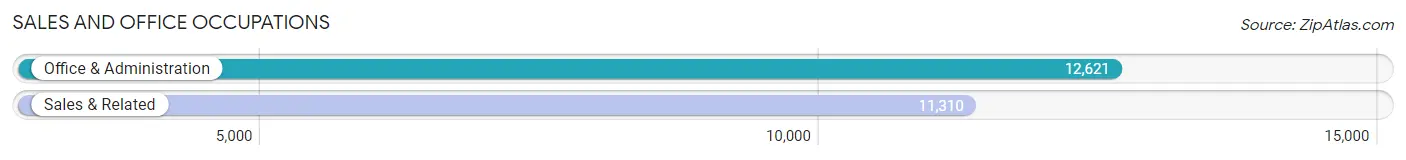
Sales and Office Occupations
The most common Sales and Office occupations in Berkeley County are Office & Administration (12,621 | 11.6%), and Sales & Related (11,310 | 10.4%).
Sales and Office Occupations by Sex
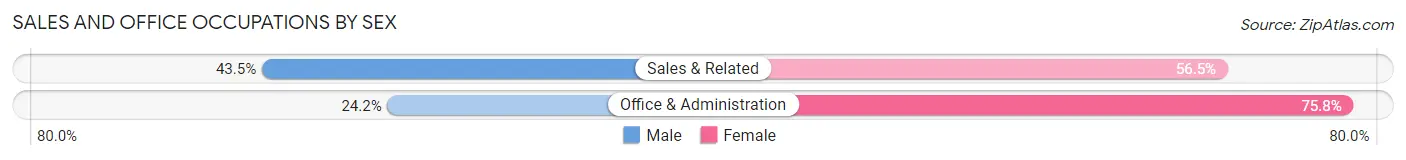
| Occupation | Male | Female |
| Sales & Related | 4,918 (43.5%) | 6,392 (56.5%) |
| Office & Administration | 3,050 (24.2%) | 9,571 (75.8%) |
| Total (Category) | 7,968 (33.3%) | 15,963 (66.7%) |
| Total (Overall) | 57,009 (52.4%) | 51,717 (47.6%) |
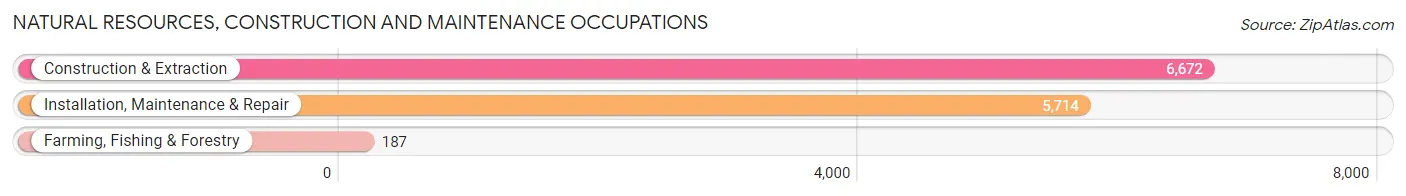
Natural Resources, Construction and Maintenance Occupations
The most common Natural Resources, Construction and Maintenance occupations in Berkeley County are Construction & Extraction (6,672 | 6.1%), Installation, Maintenance & Repair (5,714 | 5.3%), and Farming, Fishing & Forestry (187 | 0.2%).
Natural Resources, Construction and Maintenance Occupations by Sex
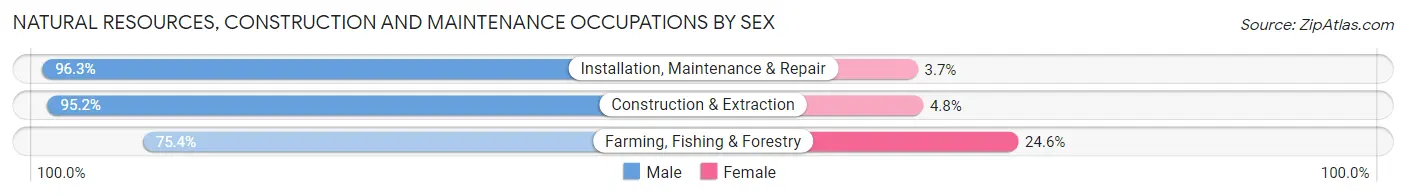
| Occupation | Male | Female |
| Farming, Fishing & Forestry | 141 (75.4%) | 46 (24.6%) |
| Construction & Extraction | 6,352 (95.2%) | 320 (4.8%) |
| Installation, Maintenance & Repair | 5,504 (96.3%) | 210 (3.7%) |
| Total (Category) | 11,997 (95.4%) | 576 (4.6%) |
| Total (Overall) | 57,009 (52.4%) | 51,717 (47.6%) |
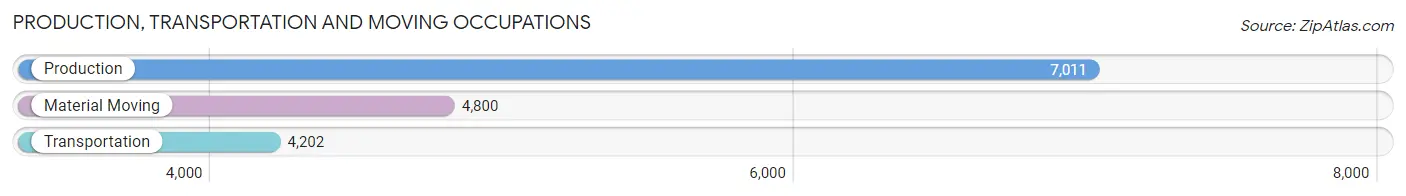
Production, Transportation and Moving Occupations
The most common Production, Transportation and Moving occupations in Berkeley County are Production (7,011 | 6.5%), Material Moving (4,800 | 4.4%), and Transportation (4,202 | 3.9%).
Production, Transportation and Moving Occupations by Sex
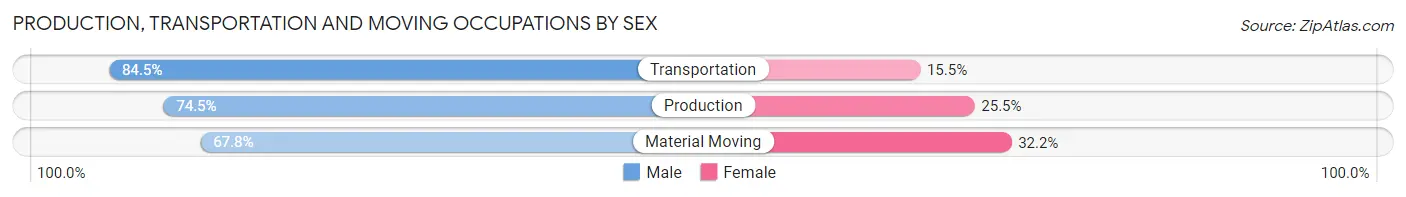
| Occupation | Male | Female |
| Production | 5,225 (74.5%) | 1,786 (25.5%) |
| Transportation | 3,551 (84.5%) | 651 (15.5%) |
| Material Moving | 3,253 (67.8%) | 1,547 (32.2%) |
| Total (Category) | 12,029 (75.1%) | 3,984 (24.9%) |
| Total (Overall) | 57,009 (52.4%) | 51,717 (47.6%) |
Employment Industries by Sex in Berkeley County
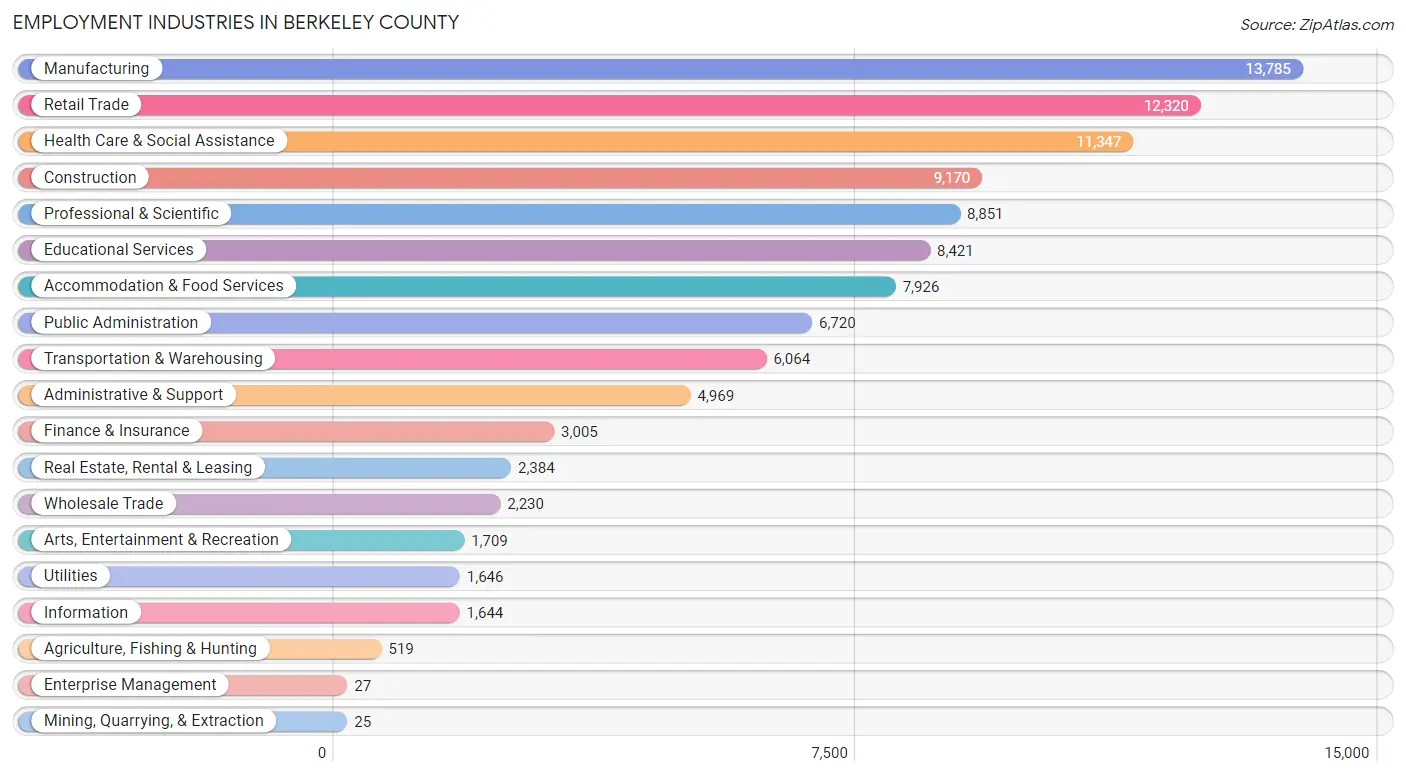
Employment Industries in Berkeley County
The major employment industries in Berkeley County include Manufacturing (13,785 | 12.7%), Retail Trade (12,320 | 11.3%), Health Care & Social Assistance (11,347 | 10.4%), Construction (9,170 | 8.4%), and Professional & Scientific (8,851 | 8.1%).
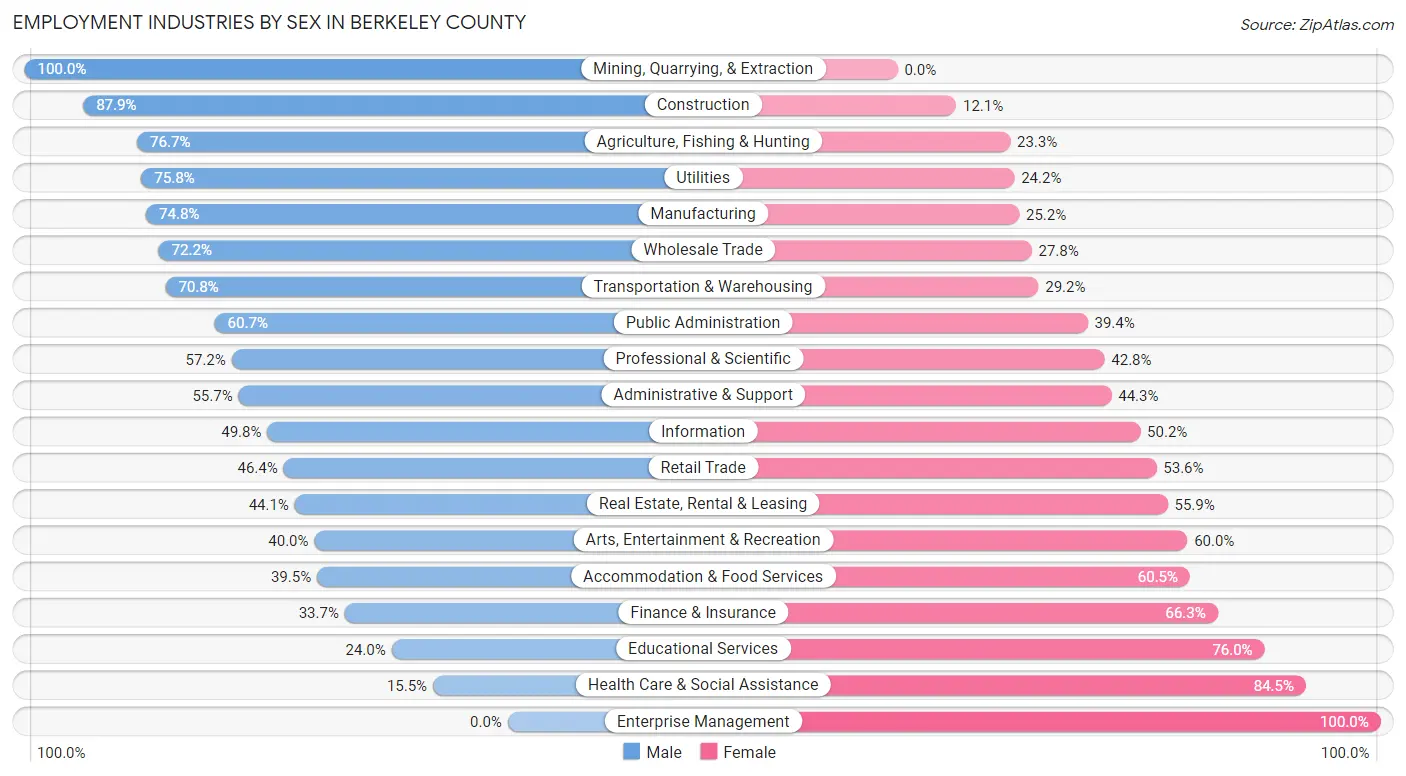
Employment Industries by Sex in Berkeley County
The Berkeley County industries that see more men than women are Mining, Quarrying, & Extraction (100.0%), Construction (87.9%), and Agriculture, Fishing & Hunting (76.7%), whereas the industries that tend to have a higher number of women are Enterprise Management (100.0%), Health Care & Social Assistance (84.5%), and Educational Services (76.0%).
| Industry | Male | Female |
| Agriculture, Fishing & Hunting | 398 (76.7%) | 121 (23.3%) |
| Mining, Quarrying, & Extraction | 25 (100.0%) | 0 (0.0%) |
| Construction | 8,057 (87.9%) | 1,113 (12.1%) |
| Manufacturing | 10,316 (74.8%) | 3,469 (25.2%) |
| Wholesale Trade | 1,611 (72.2%) | 619 (27.8%) |
| Retail Trade | 5,718 (46.4%) | 6,602 (53.6%) |
| Transportation & Warehousing | 4,296 (70.8%) | 1,768 (29.2%) |
| Utilities | 1,248 (75.8%) | 398 (24.2%) |
| Information | 818 (49.8%) | 826 (50.2%) |
| Finance & Insurance | 1,014 (33.7%) | 1,991 (66.3%) |
| Real Estate, Rental & Leasing | 1,051 (44.1%) | 1,333 (55.9%) |
| Professional & Scientific | 5,060 (57.2%) | 3,791 (42.8%) |
| Enterprise Management | 0 (0.0%) | 27 (100.0%) |
| Administrative & Support | 2,769 (55.7%) | 2,200 (44.3%) |
| Educational Services | 2,024 (24.0%) | 6,397 (76.0%) |
| Health Care & Social Assistance | 1,757 (15.5%) | 9,590 (84.5%) |
| Arts, Entertainment & Recreation | 684 (40.0%) | 1,025 (60.0%) |
| Accommodation & Food Services | 3,129 (39.5%) | 4,797 (60.5%) |
| Public Administration | 4,076 (60.7%) | 2,644 (39.4%) |
| Total | 57,009 (52.4%) | 51,717 (47.6%) |
Education in Berkeley County
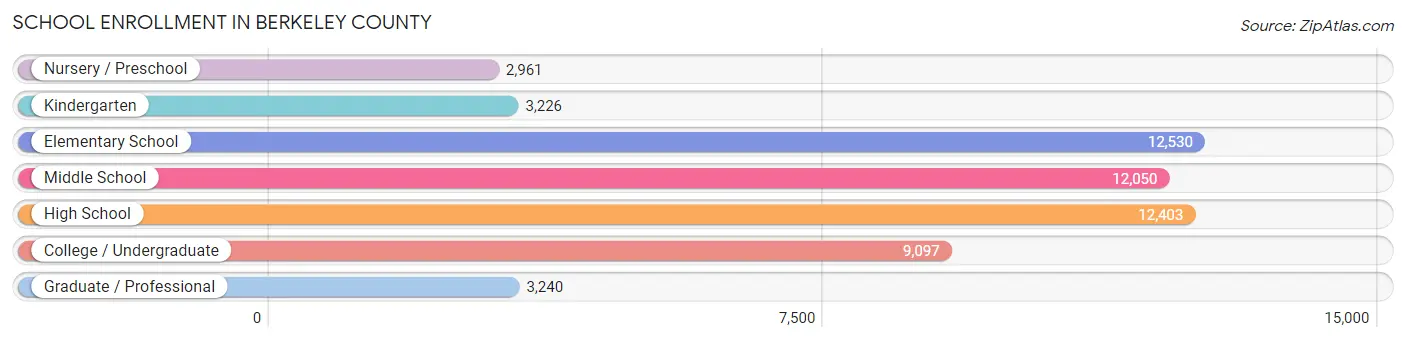
School Enrollment in Berkeley County
The most common levels of schooling among the 55,507 students in Berkeley County are elementary school (12,530 | 22.6%), high school (12,403 | 22.3%), and middle school (12,050 | 21.7%).
| School Level | # Students | % Students |
| Nursery / Preschool | 2,961 | 5.3% |
| Kindergarten | 3,226 | 5.8% |
| Elementary School | 12,530 | 22.6% |
| Middle School | 12,050 | 21.7% |
| High School | 12,403 | 22.3% |
| College / Undergraduate | 9,097 | 16.4% |
| Graduate / Professional | 3,240 | 5.8% |
| Total | 55,507 | 100.0% |
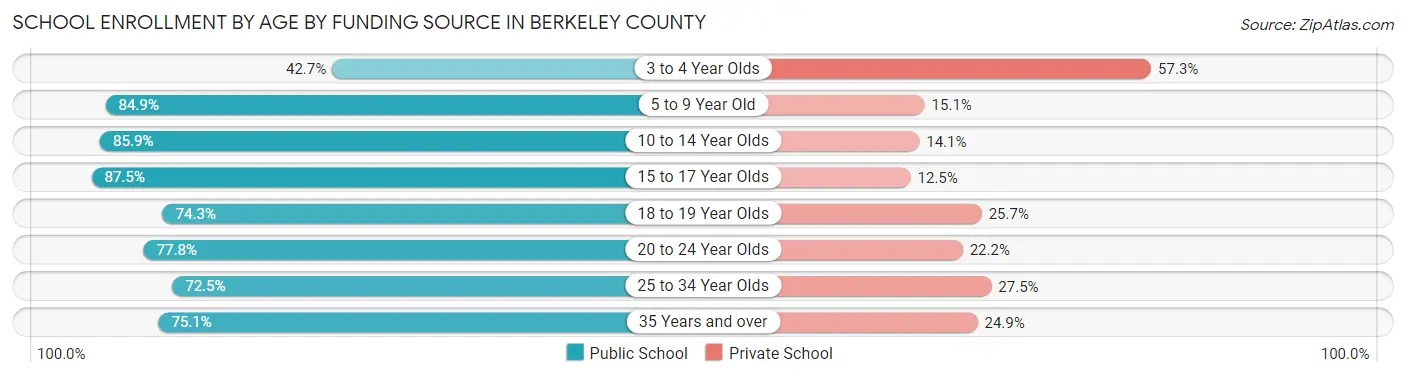
School Enrollment by Age by Funding Source in Berkeley County
Out of a total of 55,507 students who are enrolled in schools in Berkeley County, 10,435 (18.8%) attend a private institution, while the remaining 45,072 (81.2%) are enrolled in public schools. The age group of 3 to 4 year olds has the highest likelihood of being enrolled in private schools, with 1,366 (57.3% in the age bracket) enrolled. Conversely, the age group of 15 to 17 year olds has the lowest likelihood of being enrolled in a private school, with 7,884 (87.5% in the age bracket) attending a public institution.
| Age Bracket | Public School | Private School |
| 3 to 4 Year Olds | 1,019 (42.7%) | 1,366 (57.3%) |
| 5 to 9 Year Old | 12,586 (84.9%) | 2,235 (15.1%) |
| 10 to 14 Year Olds | 12,715 (85.9%) | 2,084 (14.1%) |
| 15 to 17 Year Olds | 7,884 (87.5%) | 1,123 (12.5%) |
| 18 to 19 Year Olds | 2,244 (74.3%) | 777 (25.7%) |
| 20 to 24 Year Olds | 3,028 (77.8%) | 863 (22.2%) |
| 25 to 34 Year Olds | 2,665 (72.5%) | 1,012 (27.5%) |
| 35 Years and over | 2,932 (75.1%) | 974 (24.9%) |
| Total | 45,072 (81.2%) | 10,435 (18.8%) |
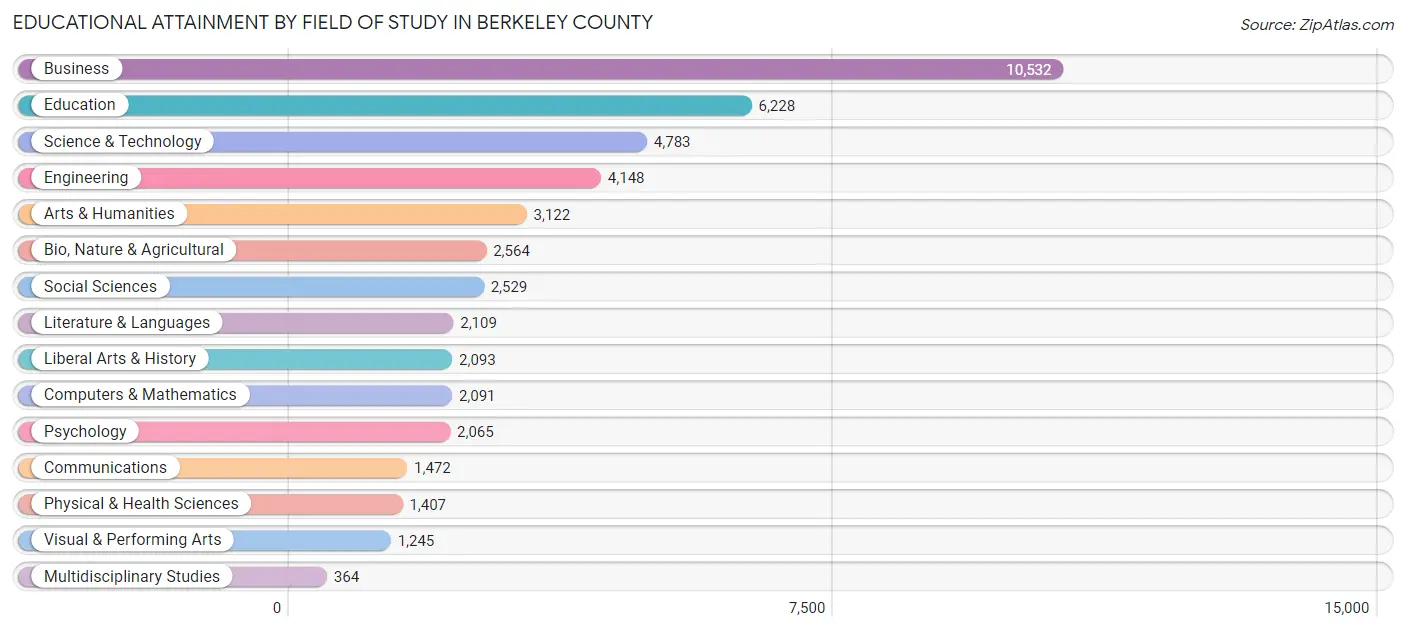
Educational Attainment by Field of Study in Berkeley County
Business (10,532 | 22.5%), education (6,228 | 13.3%), science & technology (4,783 | 10.2%), engineering (4,148 | 8.9%), and arts & humanities (3,122 | 6.7%) are the most common fields of study among 46,752 individuals in Berkeley County who have obtained a bachelor's degree or higher.
| Field of Study | # Graduates | % Graduates |
| Computers & Mathematics | 2,091 | 4.5% |
| Bio, Nature & Agricultural | 2,564 | 5.5% |
| Physical & Health Sciences | 1,407 | 3.0% |
| Psychology | 2,065 | 4.4% |
| Social Sciences | 2,529 | 5.4% |
| Engineering | 4,148 | 8.9% |
| Multidisciplinary Studies | 364 | 0.8% |
| Science & Technology | 4,783 | 10.2% |
| Business | 10,532 | 22.5% |
| Education | 6,228 | 13.3% |
| Literature & Languages | 2,109 | 4.5% |
| Liberal Arts & History | 2,093 | 4.5% |
| Visual & Performing Arts | 1,245 | 2.7% |
| Communications | 1,472 | 3.2% |
| Arts & Humanities | 3,122 | 6.7% |
| Total | 46,752 | 100.0% |
Transportation & Commute in Berkeley County
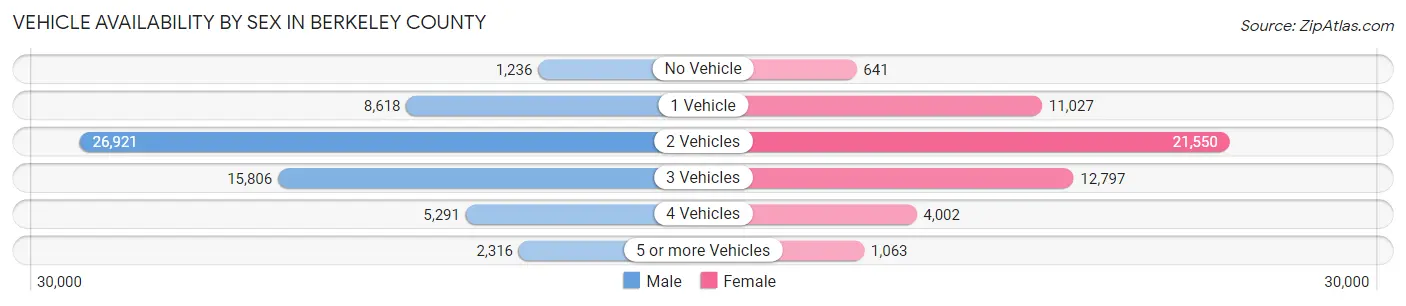
Vehicle Availability by Sex in Berkeley County
The most prevalent vehicle ownership categories in Berkeley County are males with 2 vehicles (26,921, accounting for 44.7%) and females with 2 vehicles (21,550, making up 52.7%).
| Vehicles Available | Male | Female |
| No Vehicle | 1,236 (2.1%) | 641 (1.3%) |
| 1 Vehicle | 8,618 (14.3%) | 11,027 (21.6%) |
| 2 Vehicles | 26,921 (44.7%) | 21,550 (42.2%) |
| 3 Vehicles | 15,806 (26.3%) | 12,797 (25.1%) |
| 4 Vehicles | 5,291 (8.8%) | 4,002 (7.8%) |
| 5 or more Vehicles | 2,316 (3.8%) | 1,063 (2.1%) |
| Total | 60,188 (100.0%) | 51,080 (100.0%) |
Commute Time in Berkeley County
The most frequently occuring commute durations in Berkeley County are 30 to 34 minutes (18,901 commuters, 18.2%), 20 to 24 minutes (15,448 commuters, 14.8%), and 15 to 19 minutes (13,344 commuters, 12.8%).
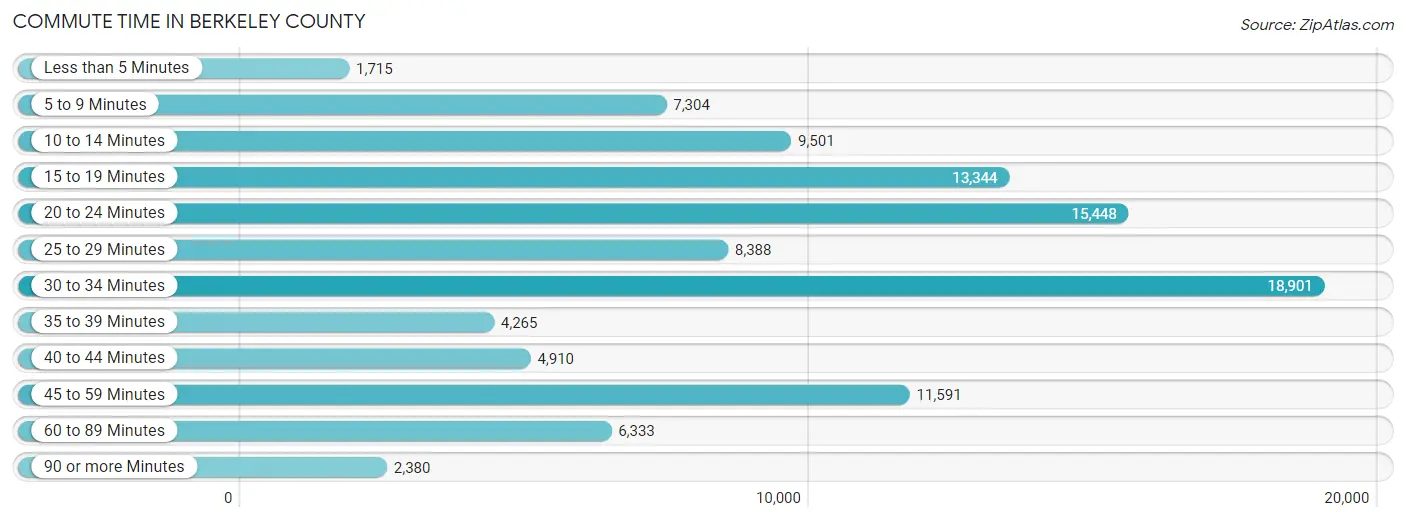
| Commute Time | # Commuters | % Commuters |
| Less than 5 Minutes | 1,715 | 1.7% |
| 5 to 9 Minutes | 7,304 | 7.0% |
| 10 to 14 Minutes | 9,501 | 9.1% |
| 15 to 19 Minutes | 13,344 | 12.8% |
| 20 to 24 Minutes | 15,448 | 14.8% |
| 25 to 29 Minutes | 8,388 | 8.1% |
| 30 to 34 Minutes | 18,901 | 18.2% |
| 35 to 39 Minutes | 4,265 | 4.1% |
| 40 to 44 Minutes | 4,910 | 4.7% |
| 45 to 59 Minutes | 11,591 | 11.1% |
| 60 to 89 Minutes | 6,333 | 6.1% |
| 90 or more Minutes | 2,380 | 2.3% |
Commute Time by Sex in Berkeley County
The most common commute times in Berkeley County are 30 to 34 minutes (11,037 commuters, 19.2%) for males and 30 to 34 minutes (7,864 commuters, 16.9%) for females.
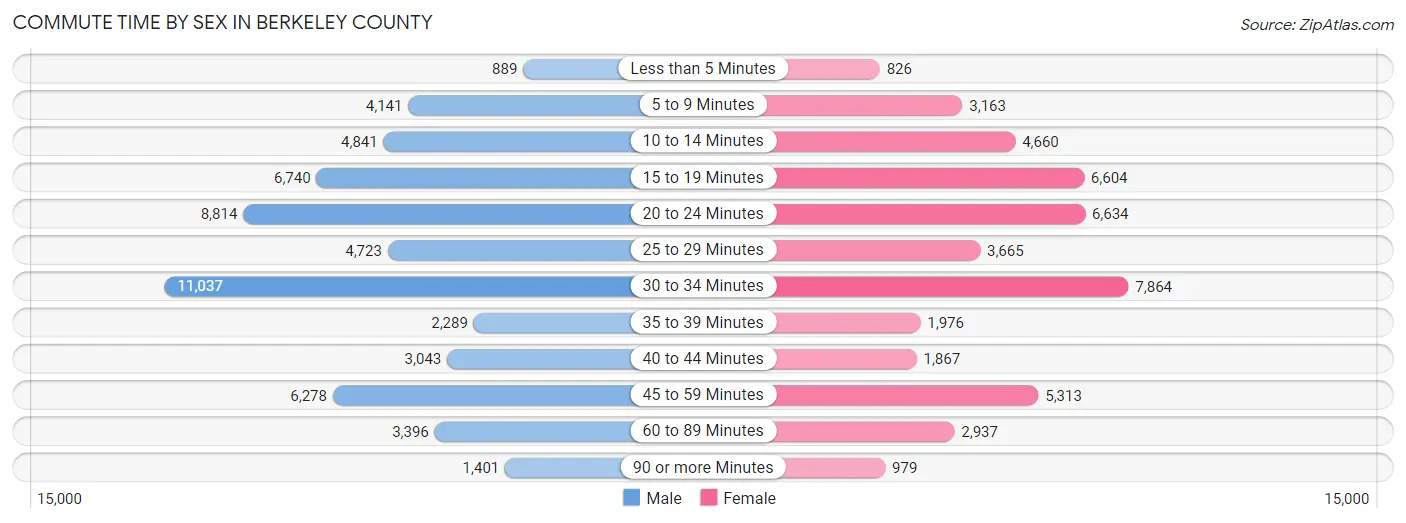
| Commute Time | Male | Female |
| Less than 5 Minutes | 889 (1.5%) | 826 (1.8%) |
| 5 to 9 Minutes | 4,141 (7.2%) | 3,163 (6.8%) |
| 10 to 14 Minutes | 4,841 (8.4%) | 4,660 (10.0%) |
| 15 to 19 Minutes | 6,740 (11.7%) | 6,604 (14.2%) |
| 20 to 24 Minutes | 8,814 (15.3%) | 6,634 (14.3%) |
| 25 to 29 Minutes | 4,723 (8.2%) | 3,665 (7.9%) |
| 30 to 34 Minutes | 11,037 (19.2%) | 7,864 (16.9%) |
| 35 to 39 Minutes | 2,289 (4.0%) | 1,976 (4.3%) |
| 40 to 44 Minutes | 3,043 (5.3%) | 1,867 (4.0%) |
| 45 to 59 Minutes | 6,278 (10.9%) | 5,313 (11.4%) |
| 60 to 89 Minutes | 3,396 (5.9%) | 2,937 (6.3%) |
| 90 or more Minutes | 1,401 (2.4%) | 979 (2.1%) |
Time of Departure to Work by Sex in Berkeley County
The most frequent times of departure to work in Berkeley County are 6:00 AM to 6:29 AM (9,390, 16.3%) for males and 7:00 AM to 7:29 AM (7,308, 15.7%) for females.
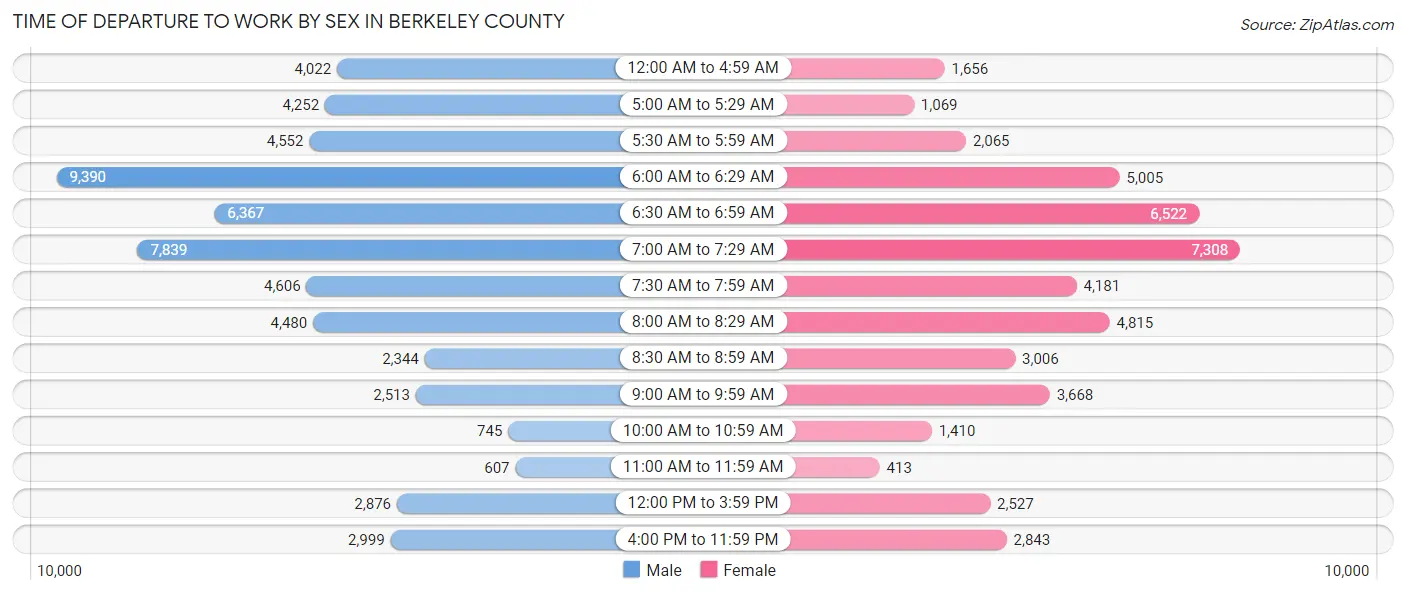
| Time of Departure | Male | Female |
| 12:00 AM to 4:59 AM | 4,022 (7.0%) | 1,656 (3.6%) |
| 5:00 AM to 5:29 AM | 4,252 (7.4%) | 1,069 (2.3%) |
| 5:30 AM to 5:59 AM | 4,552 (7.9%) | 2,065 (4.4%) |
| 6:00 AM to 6:29 AM | 9,390 (16.3%) | 5,005 (10.8%) |
| 6:30 AM to 6:59 AM | 6,367 (11.1%) | 6,522 (14.0%) |
| 7:00 AM to 7:29 AM | 7,839 (13.6%) | 7,308 (15.7%) |
| 7:30 AM to 7:59 AM | 4,606 (8.0%) | 4,181 (9.0%) |
| 8:00 AM to 8:29 AM | 4,480 (7.8%) | 4,815 (10.4%) |
| 8:30 AM to 8:59 AM | 2,344 (4.1%) | 3,006 (6.5%) |
| 9:00 AM to 9:59 AM | 2,513 (4.4%) | 3,668 (7.9%) |
| 10:00 AM to 10:59 AM | 745 (1.3%) | 1,410 (3.0%) |
| 11:00 AM to 11:59 AM | 607 (1.1%) | 413 (0.9%) |
| 12:00 PM to 3:59 PM | 2,876 (5.0%) | 2,527 (5.4%) |
| 4:00 PM to 11:59 PM | 2,999 (5.2%) | 2,843 (6.1%) |
| Total | 57,592 (100.0%) | 46,488 (100.0%) |
Housing Occupancy in Berkeley County
Occupancy by Ownership in Berkeley County
Of the total 86,958 dwellings in Berkeley County, owner-occupied units account for 64,310 (74.0%), while renter-occupied units make up 22,648 (26.0%).
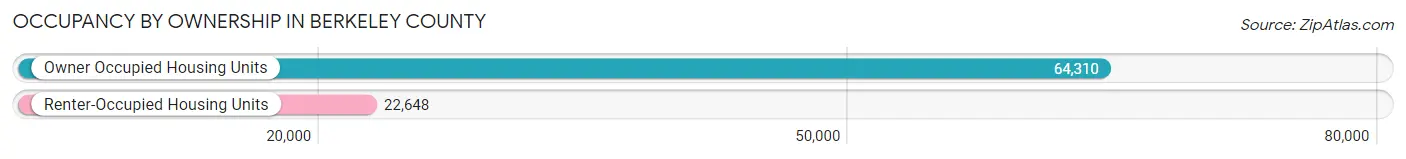
| Occupancy | # Housing Units | % Housing Units |
| Owner Occupied Housing Units | 64,310 | 74.0% |
| Renter-Occupied Housing Units | 22,648 | 26.0% |
| Total Occupied Housing Units | 86,958 | 100.0% |
Occupancy by Household Size in Berkeley County
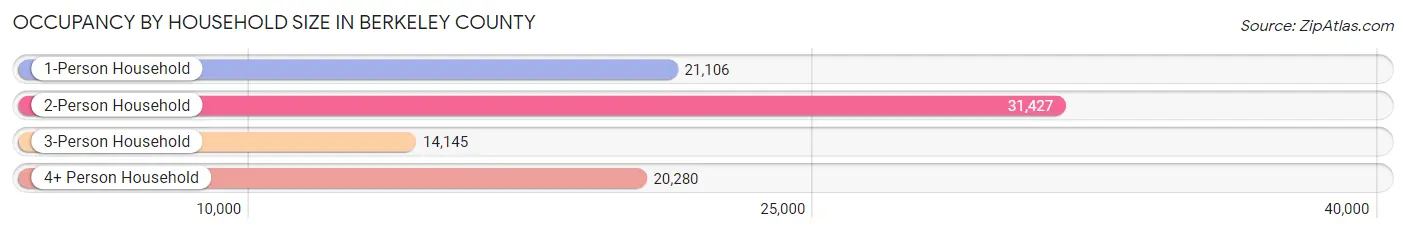
| Household Size | # Housing Units | % Housing Units |
| 1-Person Household | 21,106 | 24.3% |
| 2-Person Household | 31,427 | 36.1% |
| 3-Person Household | 14,145 | 16.3% |
| 4+ Person Household | 20,280 | 23.3% |
| Total Housing Units | 86,958 | 100.0% |
Occupancy by Ownership by Household Size in Berkeley County
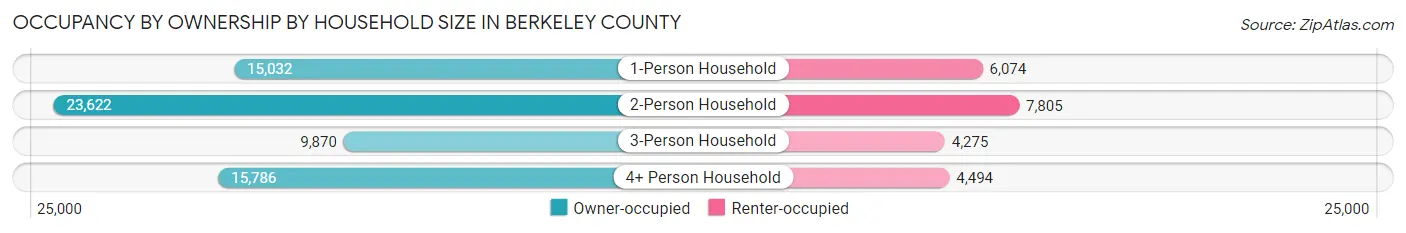
| Household Size | Owner-occupied | Renter-occupied |
| 1-Person Household | 15,032 (71.2%) | 6,074 (28.8%) |
| 2-Person Household | 23,622 (75.2%) | 7,805 (24.8%) |
| 3-Person Household | 9,870 (69.8%) | 4,275 (30.2%) |
| 4+ Person Household | 15,786 (77.8%) | 4,494 (22.2%) |
| Total Housing Units | 64,310 (74.0%) | 22,648 (26.0%) |
Occupancy by Educational Attainment in Berkeley County
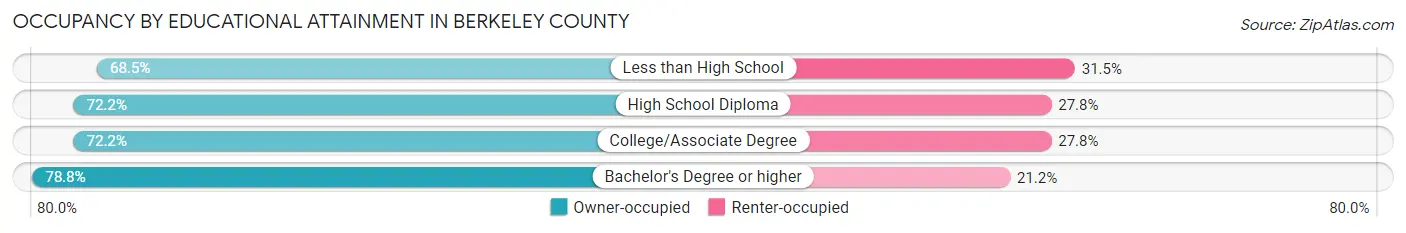
| Household Size | Owner-occupied | Renter-occupied |
| Less than High School | 4,859 (68.5%) | 2,234 (31.5%) |
| High School Diploma | 16,565 (72.2%) | 6,369 (27.8%) |
| College/Associate Degree | 21,578 (72.2%) | 8,302 (27.8%) |
| Bachelor's Degree or higher | 21,308 (78.8%) | 5,743 (21.2%) |
Occupancy by Age of Householder in Berkeley County
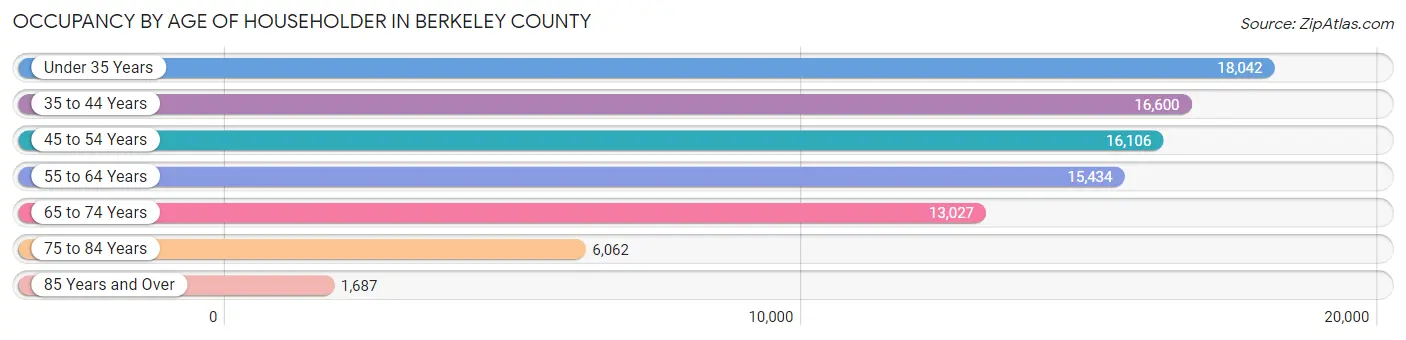
| Age Bracket | # Households | % Households |
| Under 35 Years | 18,042 | 20.7% |
| 35 to 44 Years | 16,600 | 19.1% |
| 45 to 54 Years | 16,106 | 18.5% |
| 55 to 64 Years | 15,434 | 17.7% |
| 65 to 74 Years | 13,027 | 15.0% |
| 75 to 84 Years | 6,062 | 7.0% |
| 85 Years and Over | 1,687 | 1.9% |
| Total | 86,958 | 100.0% |
Housing Finances in Berkeley County
Median Income by Occupancy in Berkeley County
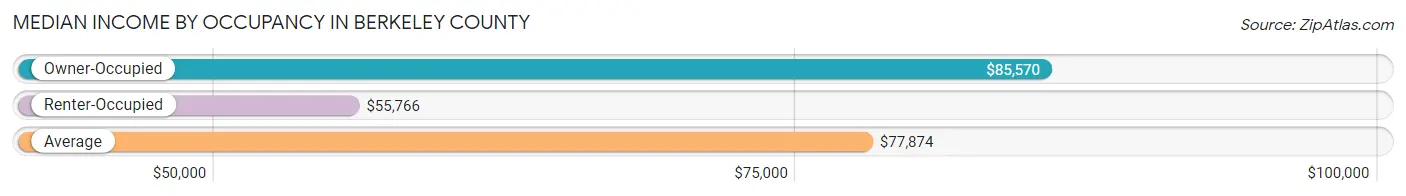
| Occupancy Type | # Households | Median Income |
| Owner-Occupied | 64,310 (74.0%) | $85,570 |
| Renter-Occupied | 22,648 (26.0%) | $55,766 |
| Average | 86,958 (100.0%) | $77,874 |
Occupancy by Householder Income Bracket in Berkeley County
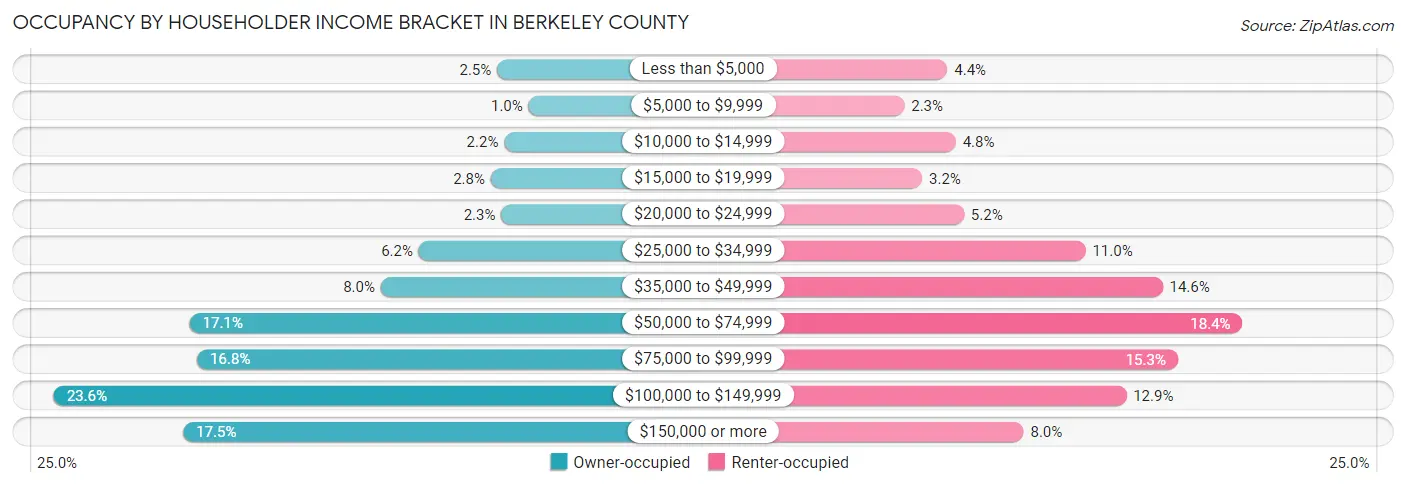
| Income Bracket | Owner-occupied | Renter-occupied |
| Less than $5,000 | 1,606 (2.5%) | 989 (4.4%) |
| $5,000 to $9,999 | 646 (1.0%) | 525 (2.3%) |
| $10,000 to $14,999 | 1,386 (2.2%) | 1,081 (4.8%) |
| $15,000 to $19,999 | 1,800 (2.8%) | 717 (3.2%) |
| $20,000 to $24,999 | 1,476 (2.3%) | 1,169 (5.2%) |
| $25,000 to $34,999 | 4,006 (6.2%) | 2,479 (11.0%) |
| $35,000 to $49,999 | 5,172 (8.0%) | 3,311 (14.6%) |
| $50,000 to $74,999 | 11,021 (17.1%) | 4,171 (18.4%) |
| $75,000 to $99,999 | 10,796 (16.8%) | 3,474 (15.3%) |
| $100,000 to $149,999 | 15,181 (23.6%) | 2,920 (12.9%) |
| $150,000 or more | 11,220 (17.4%) | 1,812 (8.0%) |
| Total | 64,310 (100.0%) | 22,648 (100.0%) |
Monthly Housing Cost Tiers in Berkeley County
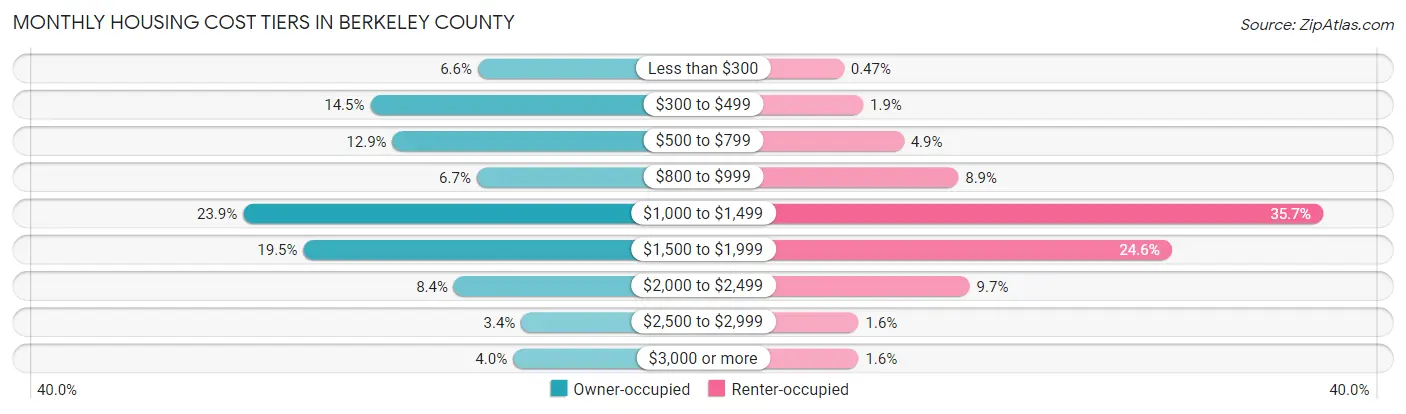
| Monthly Cost | Owner-occupied | Renter-occupied |
| Less than $300 | 4,257 (6.6%) | 106 (0.5%) |
| $300 to $499 | 9,351 (14.5%) | 429 (1.9%) |
| $500 to $799 | 8,303 (12.9%) | 1,105 (4.9%) |
| $800 to $999 | 4,306 (6.7%) | 2,015 (8.9%) |
| $1,000 to $1,499 | 15,378 (23.9%) | 8,090 (35.7%) |
| $1,500 to $1,999 | 12,519 (19.5%) | 5,571 (24.6%) |
| $2,000 to $2,499 | 5,398 (8.4%) | 2,205 (9.7%) |
| $2,500 to $2,999 | 2,206 (3.4%) | 354 (1.6%) |
| $3,000 or more | 2,592 (4.0%) | 350 (1.5%) |
| Total | 64,310 (100.0%) | 22,648 (100.0%) |
Physical Housing Characteristics in Berkeley County
Housing Structures in Berkeley County
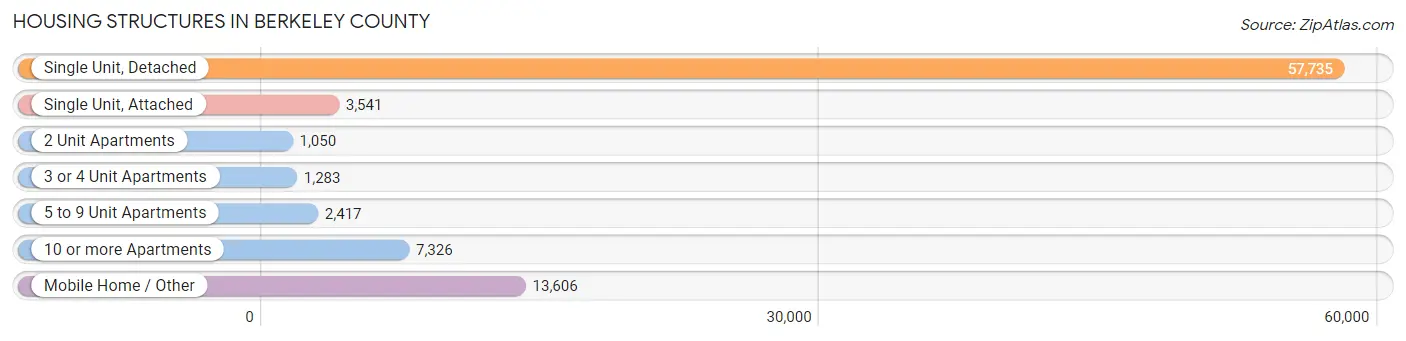
| Structure Type | # Housing Units | % Housing Units |
| Single Unit, Detached | 57,735 | 66.4% |
| Single Unit, Attached | 3,541 | 4.1% |
| 2 Unit Apartments | 1,050 | 1.2% |
| 3 or 4 Unit Apartments | 1,283 | 1.5% |
| 5 to 9 Unit Apartments | 2,417 | 2.8% |
| 10 or more Apartments | 7,326 | 8.4% |
| Mobile Home / Other | 13,606 | 15.7% |
| Total | 86,958 | 100.0% |
Housing Structures by Occupancy in Berkeley County
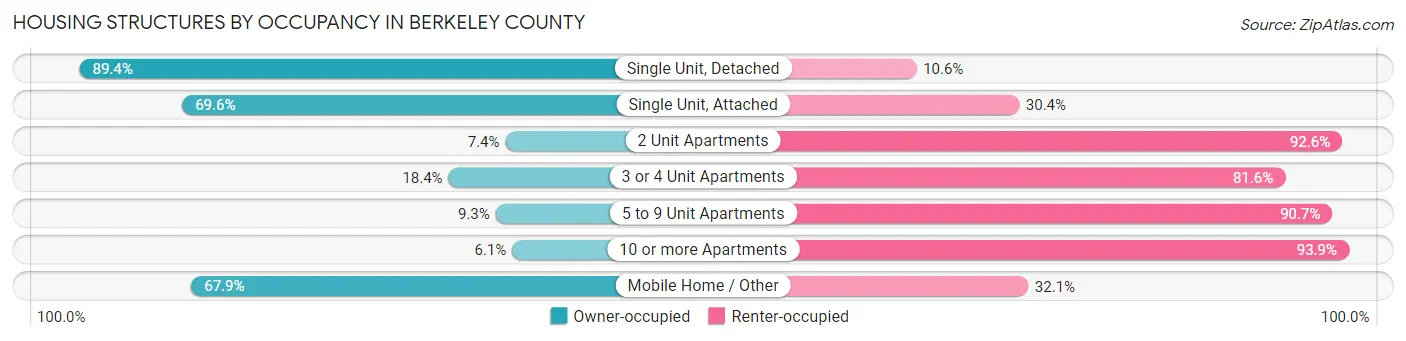
| Structure Type | Owner-occupied | Renter-occupied |
| Single Unit, Detached | 51,619 (89.4%) | 6,116 (10.6%) |
| Single Unit, Attached | 2,466 (69.6%) | 1,075 (30.4%) |
| 2 Unit Apartments | 78 (7.4%) | 972 (92.6%) |
| 3 or 4 Unit Apartments | 236 (18.4%) | 1,047 (81.6%) |
| 5 to 9 Unit Apartments | 225 (9.3%) | 2,192 (90.7%) |
| 10 or more Apartments | 448 (6.1%) | 6,878 (93.9%) |
| Mobile Home / Other | 9,238 (67.9%) | 4,368 (32.1%) |
| Total | 64,310 (74.0%) | 22,648 (26.0%) |
Housing Structures by Number of Rooms in Berkeley County
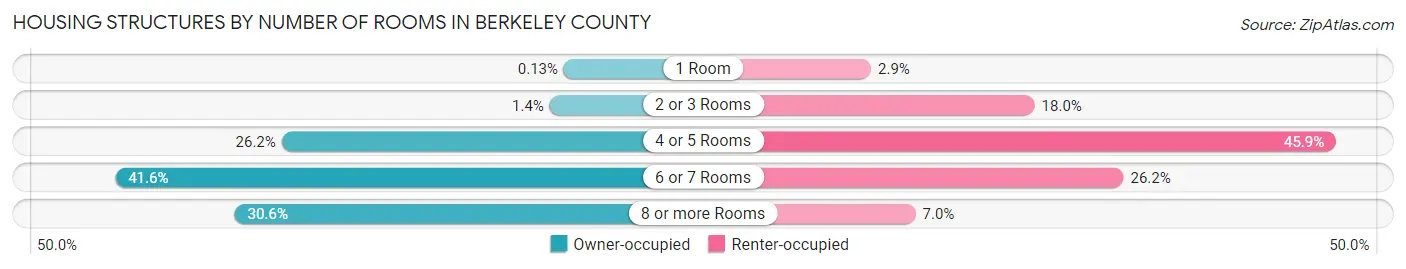
| Number of Rooms | Owner-occupied | Renter-occupied |
| 1 Room | 84 (0.1%) | 652 (2.9%) |
| 2 or 3 Rooms | 926 (1.4%) | 4,078 (18.0%) |
| 4 or 5 Rooms | 16,869 (26.2%) | 10,391 (45.9%) |
| 6 or 7 Rooms | 26,766 (41.6%) | 5,941 (26.2%) |
| 8 or more Rooms | 19,665 (30.6%) | 1,586 (7.0%) |
| Total | 64,310 (100.0%) | 22,648 (100.0%) |
Housing Structure by Heating Type in Berkeley County
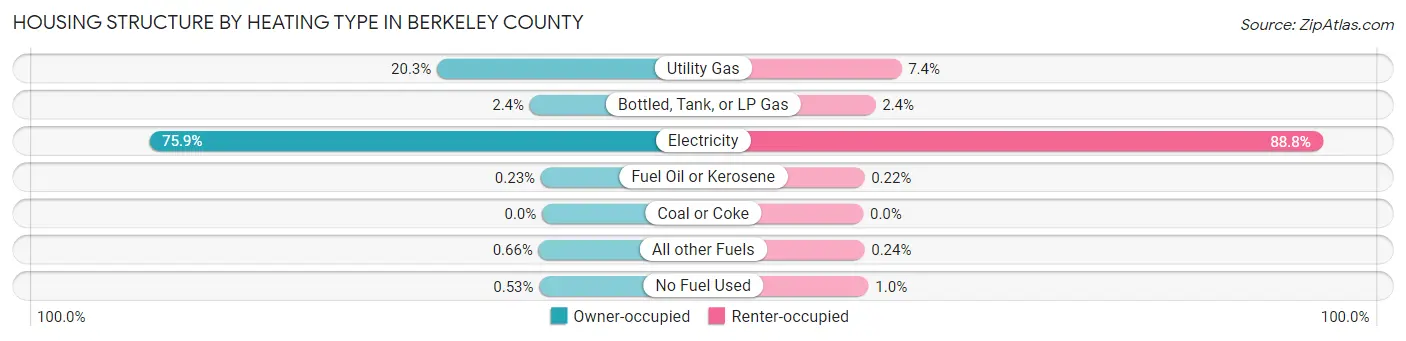
| Heating Type | Owner-occupied | Renter-occupied |
| Utility Gas | 13,050 (20.3%) | 1,669 (7.4%) |
| Bottled, Tank, or LP Gas | 1,519 (2.4%) | 536 (2.4%) |
| Electricity | 48,830 (75.9%) | 20,104 (88.8%) |
| Fuel Oil or Kerosene | 145 (0.2%) | 50 (0.2%) |
| Coal or Coke | 0 (0.0%) | 0 (0.0%) |
| All other Fuels | 423 (0.7%) | 54 (0.2%) |
| No Fuel Used | 343 (0.5%) | 235 (1.0%) |
| Total | 64,310 (100.0%) | 22,648 (100.0%) |
Household Vehicle Usage in Berkeley County
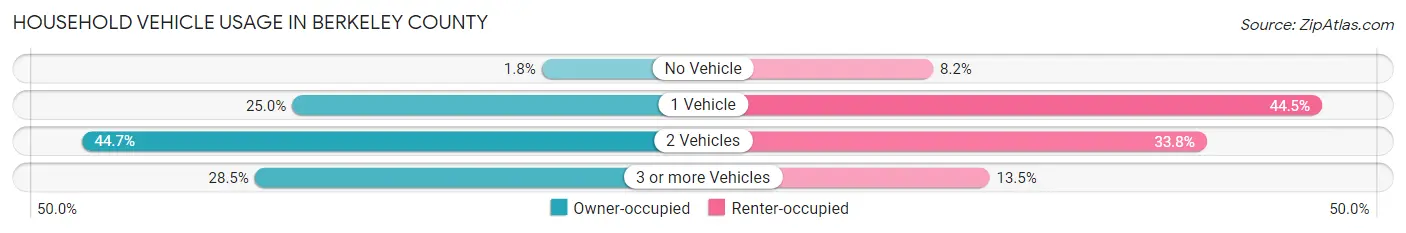
| Vehicles per Household | Owner-occupied | Renter-occupied |
| No Vehicle | 1,124 (1.8%) | 1,863 (8.2%) |
| 1 Vehicle | 16,106 (25.0%) | 10,083 (44.5%) |
| 2 Vehicles | 28,732 (44.7%) | 7,644 (33.8%) |
| 3 or more Vehicles | 18,348 (28.5%) | 3,058 (13.5%) |
| Total | 64,310 (100.0%) | 22,648 (100.0%) |
Real Estate & Mortgages in Berkeley County
Real Estate and Mortgage Overview in Berkeley County
| Characteristic | Without Mortgage | With Mortgage |
| Housing Units | 22,349 | 41,961 |
| Median Property Value | $208,600 | $273,200 |
| Median Household Income | $58,612 | $8,803 |
| Monthly Housing Costs | $453 | $2,581 |
| Real Estate Taxes | $967 | $1,202 |
Property Value by Mortgage Status in Berkeley County
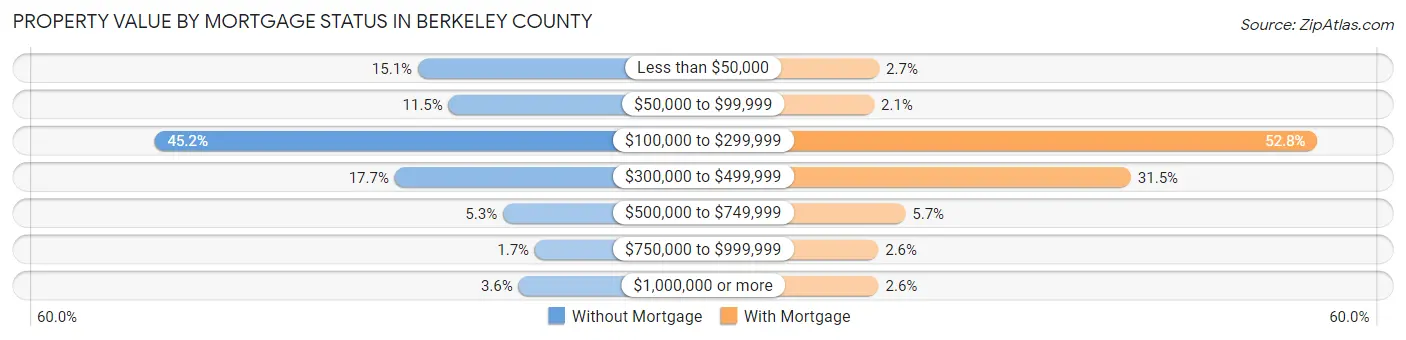
| Property Value | Without Mortgage | With Mortgage |
| Less than $50,000 | 3,363 (15.0%) | 1,131 (2.7%) |
| $50,000 to $99,999 | 2,580 (11.5%) | 891 (2.1%) |
| $100,000 to $299,999 | 10,091 (45.2%) | 22,148 (52.8%) |
| $300,000 to $499,999 | 3,955 (17.7%) | 13,205 (31.5%) |
| $500,000 to $749,999 | 1,192 (5.3%) | 2,388 (5.7%) |
| $750,000 to $999,999 | 375 (1.7%) | 1,093 (2.6%) |
| $1,000,000 or more | 793 (3.5%) | 1,105 (2.6%) |
| Total | 22,349 (100.0%) | 41,961 (100.0%) |
Household Income by Mortgage Status in Berkeley County
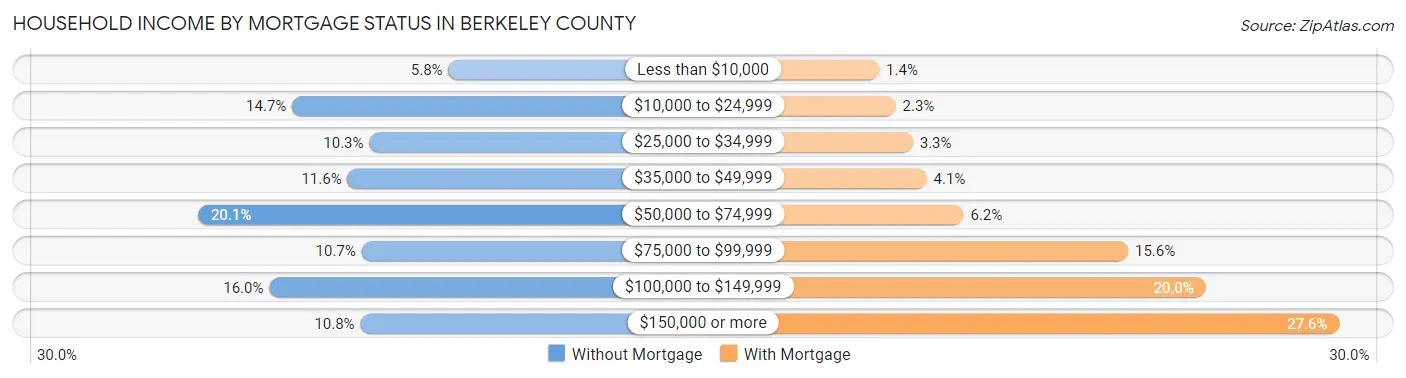
| Household Income | Without Mortgage | With Mortgage |
| Less than $10,000 | 1,291 (5.8%) | 566 (1.3%) |
| $10,000 to $24,999 | 3,288 (14.7%) | 961 (2.3%) |
| $25,000 to $34,999 | 2,302 (10.3%) | 1,374 (3.3%) |
| $35,000 to $49,999 | 2,581 (11.6%) | 1,704 (4.1%) |
| $50,000 to $74,999 | 4,489 (20.1%) | 2,591 (6.2%) |
| $75,000 to $99,999 | 2,400 (10.7%) | 6,532 (15.6%) |
| $100,000 to $149,999 | 3,581 (16.0%) | 8,396 (20.0%) |
| $150,000 or more | 2,417 (10.8%) | 11,600 (27.6%) |
| Total | 22,349 (100.0%) | 41,961 (100.0%) |
Property Value to Household Income Ratio in Berkeley County
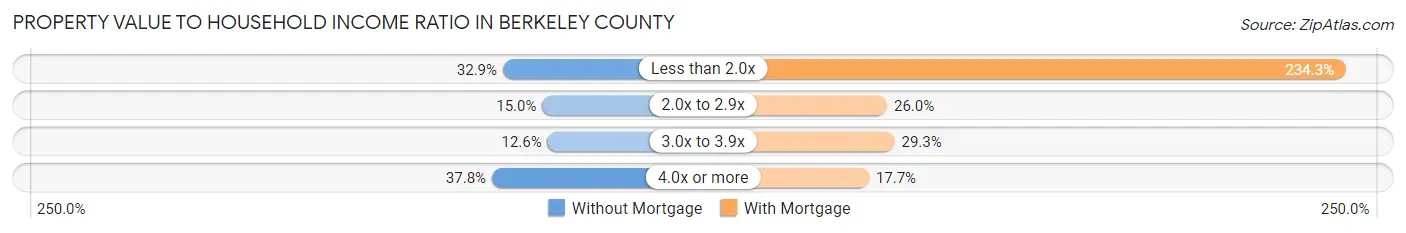
| Value-to-Income Ratio | Without Mortgage | With Mortgage |
| Less than 2.0x | 7,341 (32.9%) | 98,315 (234.3%) |
| 2.0x to 2.9x | 3,344 (15.0%) | 10,888 (26.0%) |
| 3.0x to 3.9x | 2,809 (12.6%) | 12,311 (29.3%) |
| 4.0x or more | 8,455 (37.8%) | 7,437 (17.7%) |
| Total | 22,349 (100.0%) | 41,961 (100.0%) |
Real Estate Taxes by Mortgage Status in Berkeley County
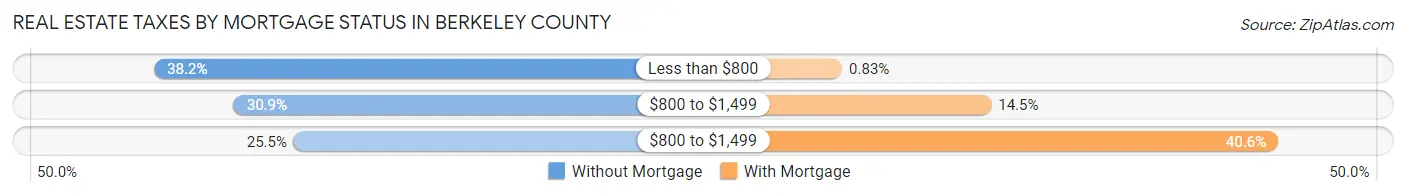
| Property Taxes | Without Mortgage | With Mortgage |
| Less than $800 | 8,531 (38.2%) | 347 (0.8%) |
| $800 to $1,499 | 6,904 (30.9%) | 6,064 (14.4%) |
| $800 to $1,499 | 5,701 (25.5%) | 17,055 (40.6%) |
| Total | 22,349 (100.0%) | 41,961 (100.0%) |
Health & Disability in Berkeley County
Health Insurance Coverage by Age in Berkeley County
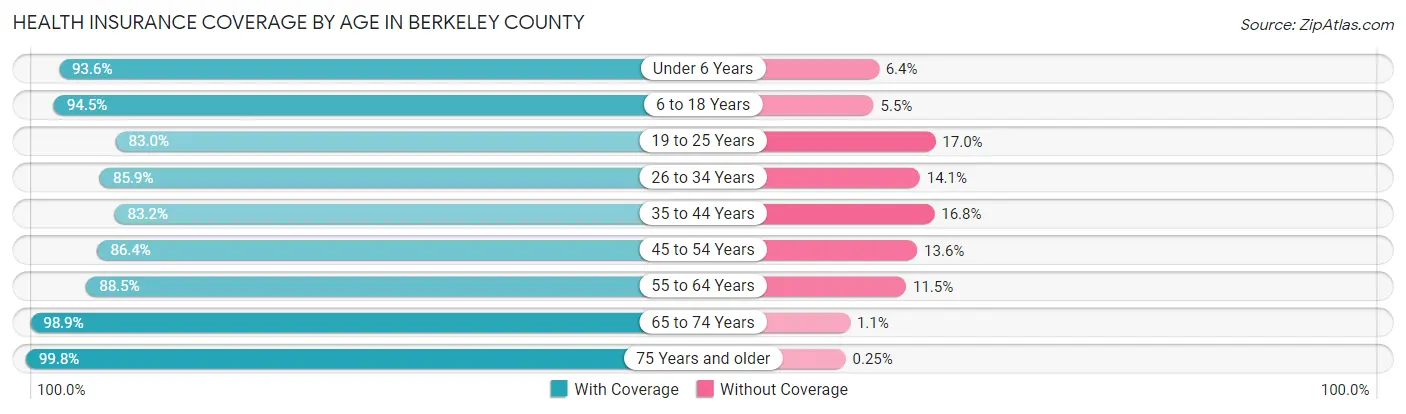
| Age Bracket | With Coverage | Without Coverage |
| Under 6 Years | 16,408 (93.6%) | 1,125 (6.4%) |
| 6 to 18 Years | 37,407 (94.5%) | 2,166 (5.5%) |
| 19 to 25 Years | 15,411 (83.0%) | 3,155 (17.0%) |
| 26 to 34 Years | 23,541 (85.9%) | 3,857 (14.1%) |
| 35 to 44 Years | 25,538 (83.2%) | 5,152 (16.8%) |
| 45 to 54 Years | 24,346 (86.4%) | 3,829 (13.6%) |
| 55 to 64 Years | 25,142 (88.5%) | 3,273 (11.5%) |
| 65 to 74 Years | 20,769 (98.9%) | 222 (1.1%) |
| 75 Years and older | 12,004 (99.8%) | 30 (0.3%) |
| Total | 200,566 (89.8%) | 22,809 (10.2%) |
Health Insurance Coverage by Citizenship Status in Berkeley County
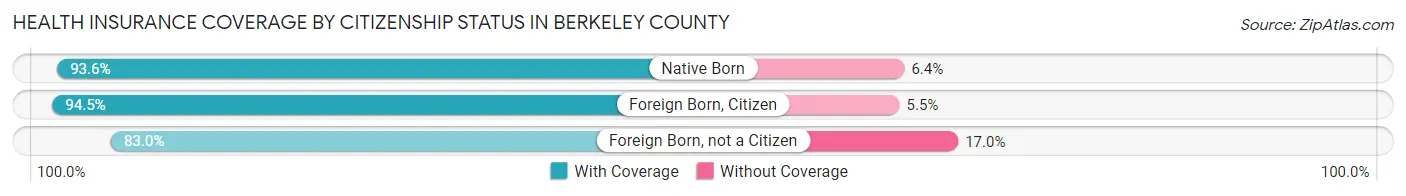
| Citizenship Status | With Coverage | Without Coverage |
| Native Born | 16,408 (93.6%) | 1,125 (6.4%) |
| Foreign Born, Citizen | 37,407 (94.5%) | 2,166 (5.5%) |
| Foreign Born, not a Citizen | 15,411 (83.0%) | 3,155 (17.0%) |
Health Insurance Coverage by Household Income in Berkeley County
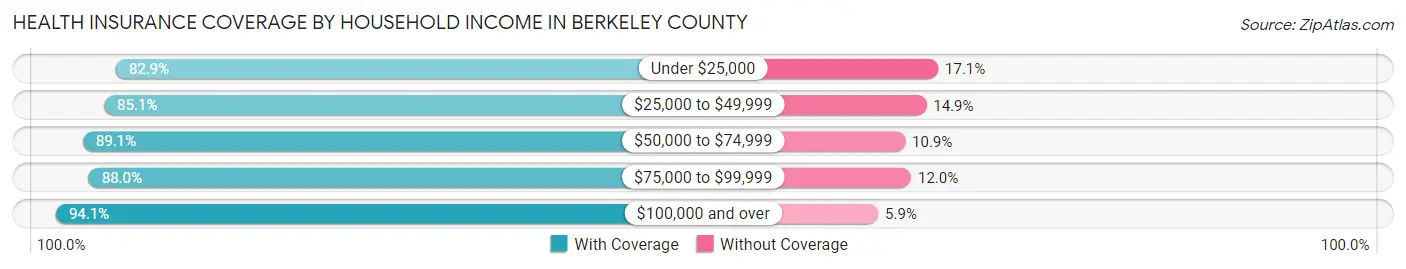
| Household Income | With Coverage | Without Coverage |
| Under $25,000 | 16,793 (82.9%) | 3,467 (17.1%) |
| $25,000 to $49,999 | 29,769 (85.1%) | 5,210 (14.9%) |
| $50,000 to $74,999 | 32,180 (89.1%) | 3,944 (10.9%) |
| $75,000 to $99,999 | 33,684 (88.0%) | 4,611 (12.0%) |
| $100,000 and over | 87,992 (94.1%) | 5,495 (5.9%) |
Public vs Private Health Insurance Coverage by Age in Berkeley County
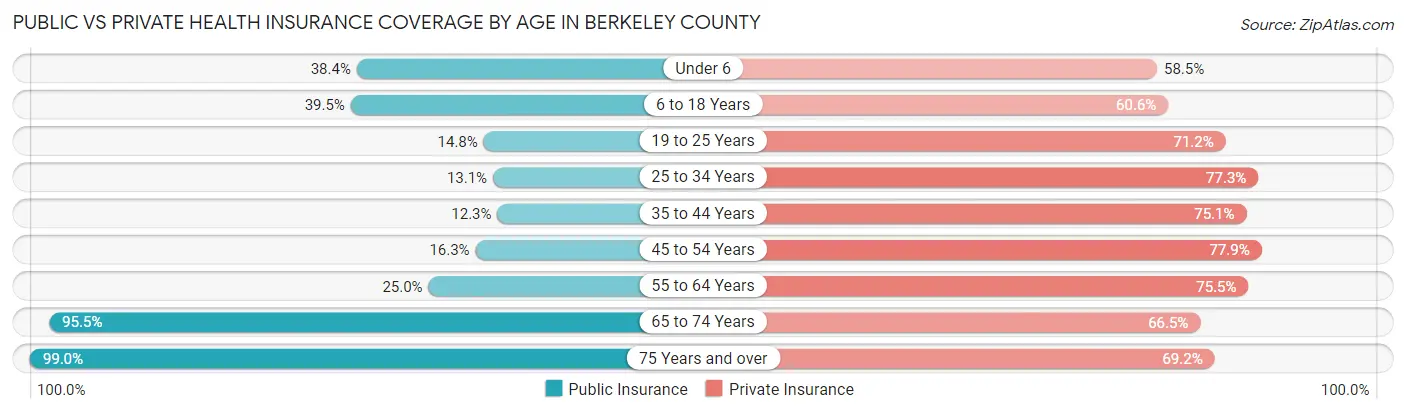
| Age Bracket | Public Insurance | Private Insurance |
| Under 6 | 6,724 (38.4%) | 10,259 (58.5%) |
| 6 to 18 Years | 15,618 (39.5%) | 23,968 (60.6%) |
| 19 to 25 Years | 2,748 (14.8%) | 13,222 (71.2%) |
| 25 to 34 Years | 3,581 (13.1%) | 21,172 (77.3%) |
| 35 to 44 Years | 3,761 (12.2%) | 23,040 (75.1%) |
| 45 to 54 Years | 4,599 (16.3%) | 21,947 (77.9%) |
| 55 to 64 Years | 7,116 (25.0%) | 21,443 (75.5%) |
| 65 to 74 Years | 20,036 (95.5%) | 13,963 (66.5%) |
| 75 Years and over | 11,916 (99.0%) | 8,324 (69.2%) |
| Total | 76,099 (34.1%) | 157,338 (70.4%) |
Disability Status by Sex by Age in Berkeley County
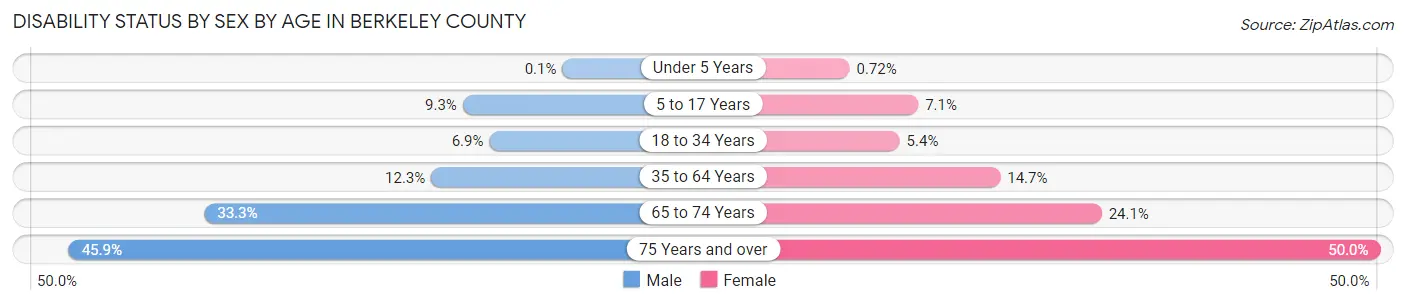
| Age Bracket | Male | Female |
| Under 5 Years | 7 (0.1%) | 50 (0.7%) |
| 5 to 17 Years | 1,918 (9.3%) | 1,394 (7.1%) |
| 18 to 34 Years | 1,607 (6.9%) | 1,352 (5.4%) |
| 35 to 64 Years | 5,184 (12.3%) | 6,624 (14.7%) |
| 65 to 74 Years | 3,227 (33.3%) | 2,727 (24.1%) |
| 75 Years and over | 2,471 (45.9%) | 3,324 (50.0%) |
Disability Class by Sex by Age in Berkeley County
Disability Class: Hearing Difficulty
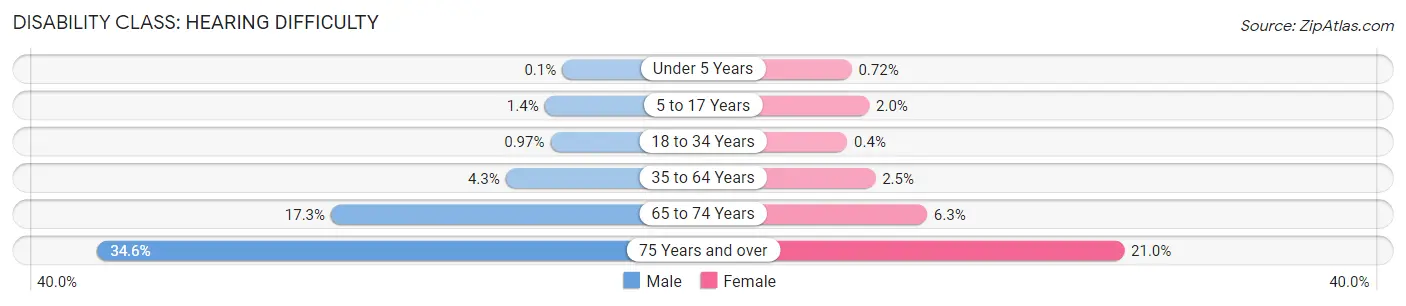
| Age Bracket | Male | Female |
| Under 5 Years | 7 (0.1%) | 50 (0.7%) |
| 5 to 17 Years | 288 (1.4%) | 399 (2.0%) |
| 18 to 34 Years | 227 (1.0%) | 100 (0.4%) |
| 35 to 64 Years | 1,811 (4.3%) | 1,116 (2.5%) |
| 65 to 74 Years | 1,672 (17.3%) | 714 (6.3%) |
| 75 Years and over | 1,863 (34.6%) | 1,394 (21.0%) |
Disability Class: Vision Difficulty
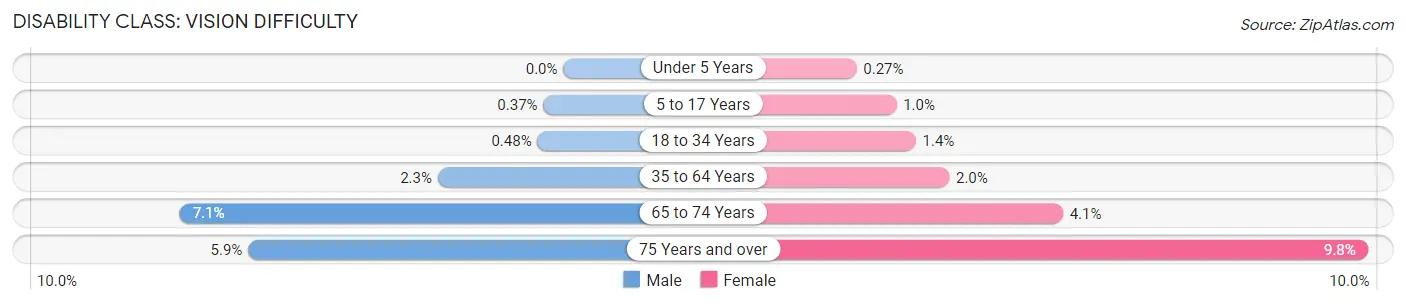
| Age Bracket | Male | Female |
| Under 5 Years | 0 (0.0%) | 19 (0.3%) |
| 5 to 17 Years | 75 (0.4%) | 198 (1.0%) |
| 18 to 34 Years | 112 (0.5%) | 345 (1.4%) |
| 35 to 64 Years | 982 (2.3%) | 897 (2.0%) |
| 65 to 74 Years | 690 (7.1%) | 463 (4.1%) |
| 75 Years and over | 315 (5.9%) | 649 (9.8%) |
Disability Class: Cognitive Difficulty
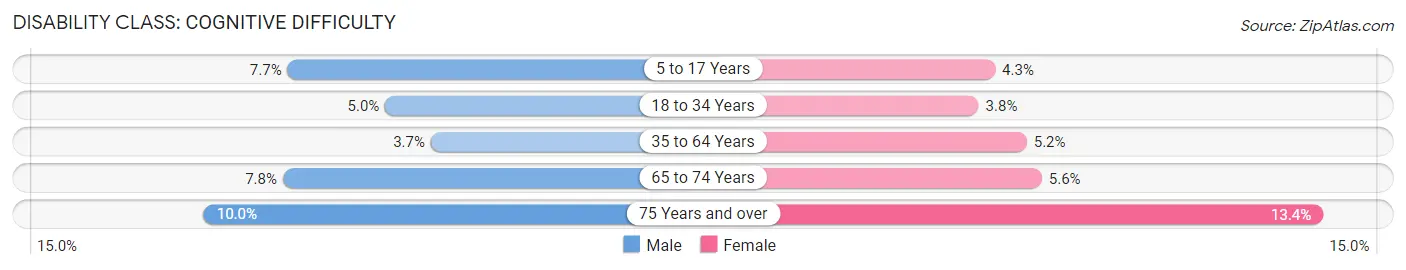
| Age Bracket | Male | Female |
| 5 to 17 Years | 1,578 (7.7%) | 839 (4.3%) |
| 18 to 34 Years | 1,159 (5.0%) | 960 (3.8%) |
| 35 to 64 Years | 1,560 (3.7%) | 2,319 (5.1%) |
| 65 to 74 Years | 756 (7.8%) | 630 (5.6%) |
| 75 Years and over | 539 (10.0%) | 891 (13.4%) |
Disability Class: Ambulatory Difficulty
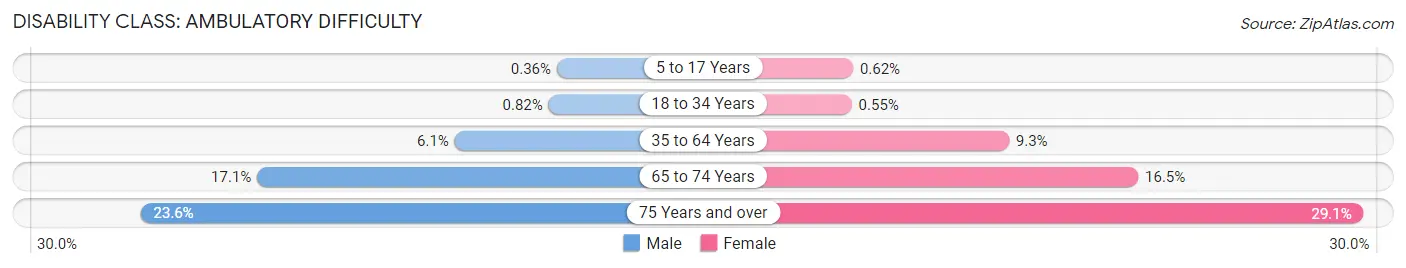
| Age Bracket | Male | Female |
| 5 to 17 Years | 74 (0.4%) | 121 (0.6%) |
| 18 to 34 Years | 192 (0.8%) | 139 (0.5%) |
| 35 to 64 Years | 2,555 (6.0%) | 4,187 (9.3%) |
| 65 to 74 Years | 1,651 (17.1%) | 1,866 (16.5%) |
| 75 Years and over | 1,268 (23.5%) | 1,932 (29.0%) |
Disability Class: Self-Care Difficulty
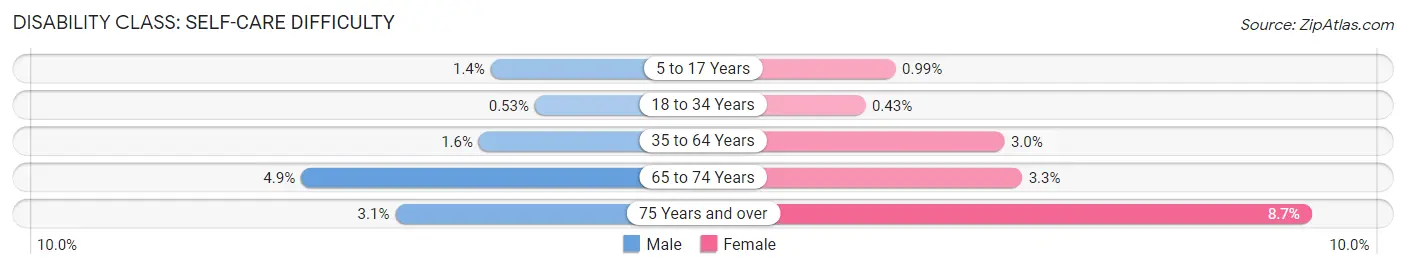
| Age Bracket | Male | Female |
| 5 to 17 Years | 278 (1.3%) | 195 (1.0%) |
| 18 to 34 Years | 124 (0.5%) | 108 (0.4%) |
| 35 to 64 Years | 665 (1.6%) | 1,355 (3.0%) |
| 65 to 74 Years | 472 (4.9%) | 378 (3.3%) |
| 75 Years and over | 168 (3.1%) | 580 (8.7%) |
Technology Access in Berkeley County
Computing Device Access in Berkeley County
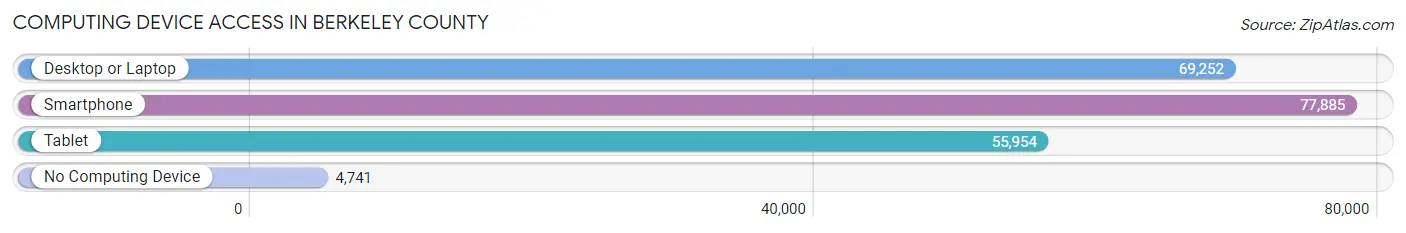
| Device Type | # Households | % Households |
| Desktop or Laptop | 69,252 | 79.6% |
| Smartphone | 77,885 | 89.6% |
| Tablet | 55,954 | 64.3% |
| No Computing Device | 4,741 | 5.4% |
| Total | 86,958 | 100.0% |
Internet Access in Berkeley County
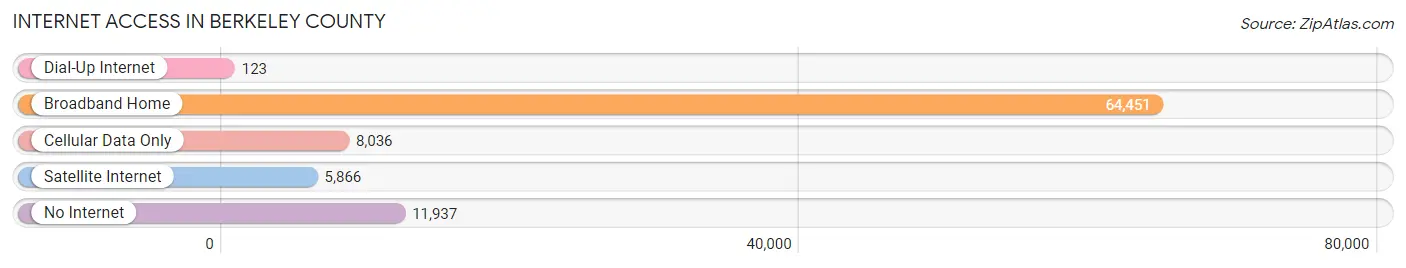
| Internet Type | # Households | % Households |
| Dial-Up Internet | 123 | 0.1% |
| Broadband Home | 64,451 | 74.1% |
| Cellular Data Only | 8,036 | 9.2% |
| Satellite Internet | 5,866 | 6.8% |
| No Internet | 11,937 | 13.7% |
| Total | 86,958 | 100.0% |
Berkeley County Summary
Berkeley County is located in the Lowcountry region of South Carolina, and is one of the state’s 46 counties. It is bordered by Charleston County to the north, Dorchester County to the east, and Colleton County to the west. The county seat is Moncks Corner, and the largest city is Goose Creek. As of the 2010 census, the population of Berkeley County was 177,843, making it the third most populous county in South Carolina.
History
Berkeley County was established in 1682 as part of the colonial Province of Carolina. It was named for John Berkeley, one of the eight Lords Proprietors of the Province. The county was originally part of the larger Colleton County, but was split off in 1882.
During the American Revolution, Berkeley County was the site of several battles, including the Battle of Monck’s Corner in 1780. The county was also the site of the Battle of Eutaw Springs in 1781, which was the last major battle of the war in the South.
Geography
Berkeley County covers an area of 843 square miles, making it the fourth largest county in South Carolina. The county is located in the Lowcountry region of the state, and is mostly flat with some rolling hills. The terrain is mostly covered in pine and hardwood forests, with some wetlands and swamps. The Santee River forms the northern border of the county, and the Cooper River forms the eastern border.
The county is divided into four townships: Berkeley, Goose Creek, Jamestown, and Moncks Corner. The county seat is Moncks Corner, and the largest city is Goose Creek. Other cities and towns in the county include Bonneau, Cross, Huger, Jamestown, Pineville, and St. Stephen.
Economy
Berkeley County has a diverse economy, with a mix of manufacturing, agriculture, and services. The county’s largest employers are Boeing, Santee Cooper, and the Berkeley County School District. Other major employers include Trident Technical College, Berkeley Electric Cooperative, and the Berkeley County Government.
Agriculture is an important part of the county’s economy, with crops such as corn, soybeans, cotton, and peanuts being grown. Livestock production is also important, with cattle, hogs, and poultry being raised.
Demographics
As of the 2010 census, the population of Berkeley County was 177,843, making it the third most populous county in South Carolina. The population was spread out, with 24.3% under the age of 18, 8.2% from 18 to 24, 28.2% from 25 to 44, 25.2% from 45 to 64, and 14.1% who were 65 years of age or older. The median age was 37.4 years.
The racial makeup of the county was 68.2% White, 25.3% African American, 0.5% Native American, 2.2% Asian, 0.1% Pacific Islander, 1.7% from other races, and 2.1% from two or more races. Hispanic or Latino of any race were 4.2% of the population.
The median income for a household in the county was $50,845, and the median income for a family was $60,945. The per capita income for the county was $25,845. About 8.2% of families and 10.7% of the population were below the poverty line, including 14.2% of those under age 18 and 8.2% of those age 65 or over.
Common Questions
What is Per Capita Income in Berkeley County?
Per Capita income in Berkeley County is $37,563.
What is the Median Family Income in Berkeley County?
Median Family Income in Berkeley County is $88,689.
What is the Median Household income in Berkeley County?
Median Household Income in Berkeley County is $77,874.
What is Income or Wage Gap in Berkeley County?
Income or Wage Gap in Berkeley County is 33.1%.
Women in Berkeley County earn 66.9 cents for every dollar earned by a man.
What is Family Income Deficit in Berkeley County?
Family Income Deficit in Berkeley County is $9,715.
Families that are below poverty line in Berkeley County earn $9,715 less on average than the poverty threshold level.
What is Inequality or Gini Index in Berkeley County?
Inequality or Gini Index in Berkeley County is 0.43.
What is the Total Population of Berkeley County?
Total Population of Berkeley County is 231,419.
What is the Total Male Population of Berkeley County?
Total Male Population of Berkeley County is 115,726.
What is the Total Female Population of Berkeley County?
Total Female Population of Berkeley County is 115,693.
What is the Ratio of Males per 100 Females in Berkeley County?
There are 100.03 Males per 100 Females in Berkeley County.
What is the Ratio of Females per 100 Males in Berkeley County?
There are 99.97 Females per 100 Males in Berkeley County.
What is the Median Population Age in Berkeley County?
Median Population Age in Berkeley County is 36.7 Years.
What is the Average Family Size in Berkeley County
Average Family Size in Berkeley County is 3.1 People.
What is the Average Household Size in Berkeley County
Average Household Size in Berkeley County is 2.6 People.
How Large is the Labor Force in Berkeley County?
There are 119,843 People in the Labor Forcein in Berkeley County.
What is the Percentage of People in the Labor Force in Berkeley County?
65.6% of People are in the Labor Force in Berkeley County.
What is the Unemployment Rate in Berkeley County?
Unemployment Rate in Berkeley County is 3.8%.