South Dakota Map & Demographics
South Dakota Map
South Dakota Overview
Nov 2, 1889
INCORPORATED
77,116
TOTAL AREA [ SQ MI ]
75,811
LAND AREA [ SQ MI ]
1,305
WATER AREA [ SQ MI ]
2,200
ELEVATION AVG [ FT ]
7,242
ELEVATION HIGH [ FT ]
966
ELEVATION LOW [ FT ]
11.7
POP DENSITY [ PPL / SQ MI ]
$36,850
PER CAPITA INCOME
$88,996
AVG FAMILY INCOME
$69,457
AVG HOUSEHOLD INCOME
26.9%
WAGE / INCOME GAP [ % ]
73.1¢/ $1
WAGE / INCOME GAP [ $ ]
$11,819
FAMILY INCOME DEFICIT
0.45
INEQUALITY / GINI INDEX
57106
LARGEST ZIP CODE
Sioux Falls
LARGEST CITY
Minnehaha County
LARGEST COUNTY
890,342
TOTAL POPULATION
451,671
MALE POPULATION
438,671
FEMALE POPULATION
102.96
MALES / 100 FEMALES
97.12
FEMALES / 100 MALES
37.5
MEDIAN AGE
3.1
AVG FAMILY SIZE
2.4
AVG HOUSEHOLD SIZE
471,598
LABOR FORCE [ PEOPLE ]
67.6%
PERCENT IN LABOR FORCE
3.1%
UNEMPLOYMENT RATE
South Dakota Area Codes
Income in South Dakota
Income Overview in South Dakota
Per Capita Income in South Dakota is $36,850, while median incomes of families and households are $88,996 and $69,457 respectively.
| Characteristic | Number | Measure |
| Per Capita Income | 890,342 | $36,850 |
| Median Family Income | 218,521 | $88,996 |
| Mean Family Income | 218,521 | $110,466 |
| Median Household Income | 351,182 | $69,457 |
| Mean Household Income | 351,182 | $90,706 |
| Income Deficit | 218,521 | $11,819 |
| Wage / Income Gap (%) | 890,342 | 26.88% |
| Wage / Income Gap ($) | 890,342 | 73.12¢ per $1 |
| Gini / Inequality Index | 890,342 | 0.45 |
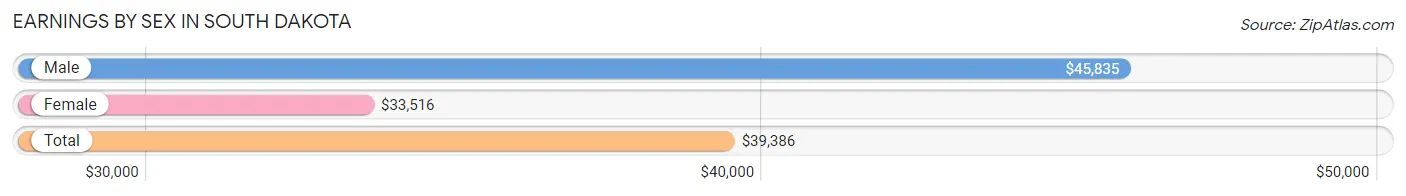
Earnings by Sex in South Dakota
Average Earnings in South Dakota are $39,386, $45,835 for men and $33,516 for women, a difference of 26.9%.
| Sex | Number | Average Earnings |
| Male | 270,553 (53.6%) | $45,835 |
| Female | 234,438 (46.4%) | $33,516 |
| Total | 504,991 (100.0%) | $39,386 |
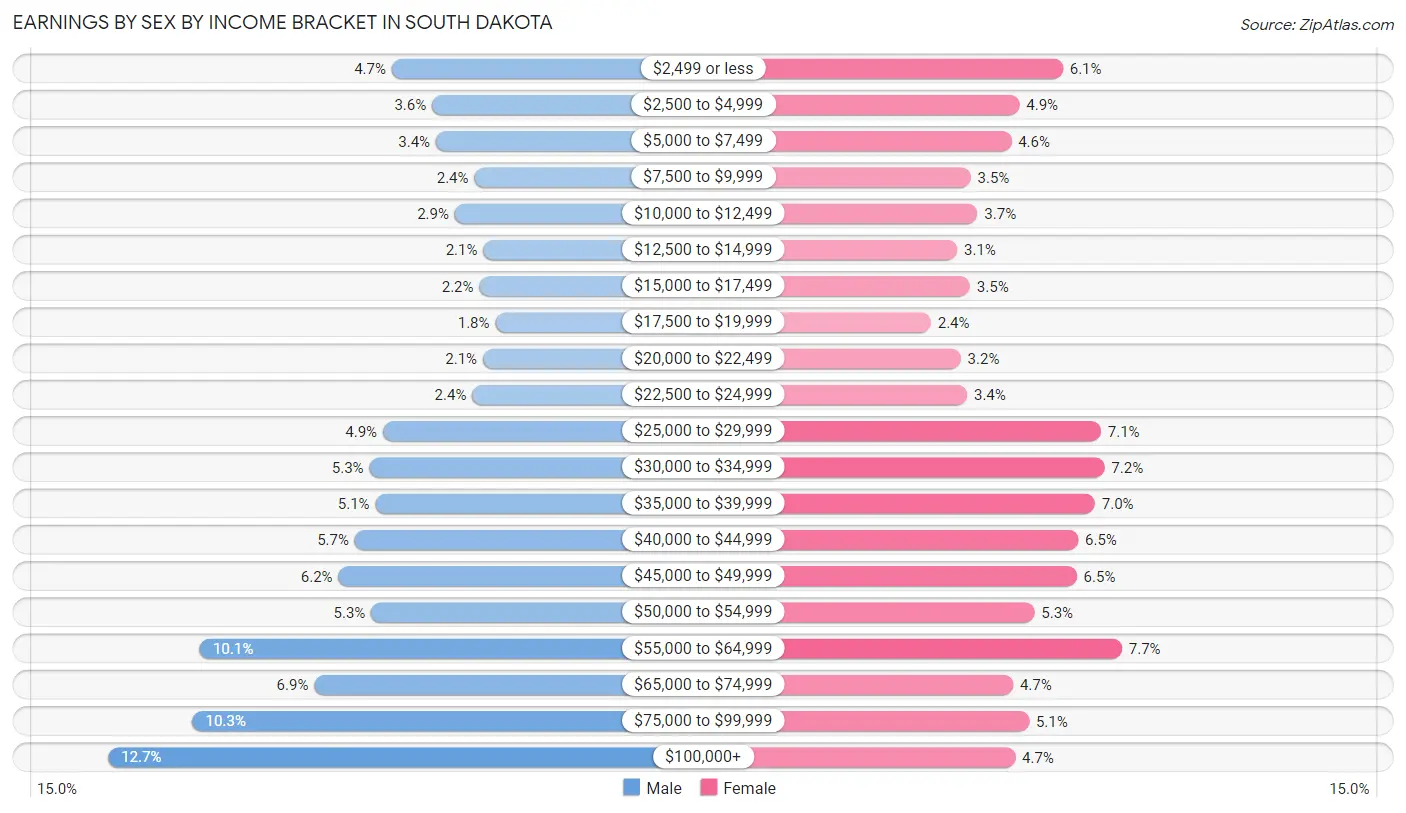
Earnings by Sex by Income Bracket in South Dakota
The most common earnings brackets in South Dakota are $100,000+ for men (34,232 | 12.7%) and $55,000 to $64,999 for women (18,112 | 7.7%).
| Income | Male | Female |
| $2,499 or less | 12,664 (4.7%) | 14,221 (6.1%) |
| $2,500 to $4,999 | 9,600 (3.5%) | 11,360 (4.9%) |
| $5,000 to $7,499 | 9,315 (3.4%) | 10,831 (4.6%) |
| $7,500 to $9,999 | 6,385 (2.4%) | 8,154 (3.5%) |
| $10,000 to $12,499 | 7,874 (2.9%) | 8,596 (3.7%) |
| $12,500 to $14,999 | 5,699 (2.1%) | 7,274 (3.1%) |
| $15,000 to $17,499 | 6,019 (2.2%) | 8,107 (3.5%) |
| $17,500 to $19,999 | 4,800 (1.8%) | 5,529 (2.4%) |
| $20,000 to $22,499 | 5,737 (2.1%) | 7,494 (3.2%) |
| $22,500 to $24,999 | 6,559 (2.4%) | 7,920 (3.4%) |
| $25,000 to $29,999 | 13,344 (4.9%) | 16,749 (7.1%) |
| $30,000 to $34,999 | 14,377 (5.3%) | 16,973 (7.2%) |
| $35,000 to $39,999 | 13,914 (5.1%) | 16,339 (7.0%) |
| $40,000 to $44,999 | 15,466 (5.7%) | 15,231 (6.5%) |
| $45,000 to $49,999 | 16,716 (6.2%) | 15,155 (6.5%) |
| $50,000 to $54,999 | 14,240 (5.3%) | 12,352 (5.3%) |
| $55,000 to $64,999 | 27,244 (10.1%) | 18,112 (7.7%) |
| $65,000 to $74,999 | 18,568 (6.9%) | 10,941 (4.7%) |
| $75,000 to $99,999 | 27,800 (10.3%) | 12,004 (5.1%) |
| $100,000+ | 34,232 (12.7%) | 11,096 (4.7%) |
| Total | 270,553 (100.0%) | 234,438 (100.0%) |
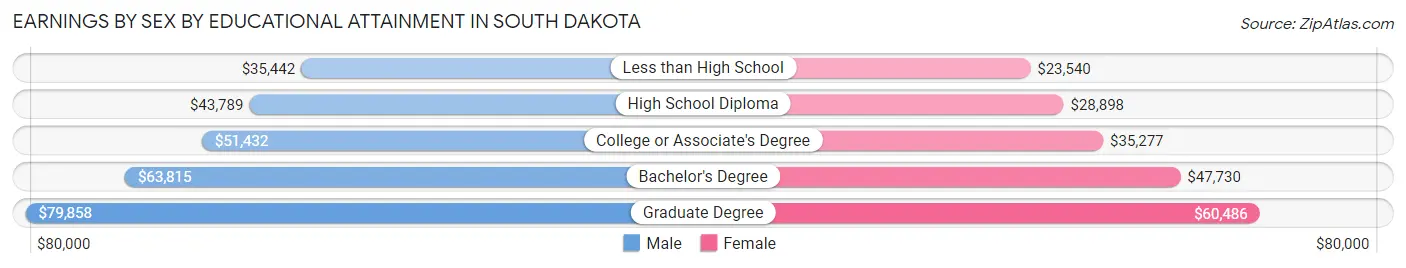
Earnings by Sex by Educational Attainment in South Dakota
Average earnings in South Dakota are $51,969 for men and $38,045 for women, a difference of 26.8%. Men with an educational attainment of graduate degree enjoy the highest average annual earnings of $79,858, while those with less than high school education earn the least with $35,442. Women with an educational attainment of graduate degree earn the most with the average annual earnings of $60,486, while those with less than high school education have the smallest earnings of $23,540.
| Educational Attainment | Male Income | Female Income |
| Less than High School | $35,442 | $23,540 |
| High School Diploma | $43,789 | $28,898 |
| College or Associate's Degree | $51,432 | $35,277 |
| Bachelor's Degree | $63,815 | $47,730 |
| Graduate Degree | $79,858 | $60,486 |
| Total | $51,969 | $38,045 |
Family Income in South Dakota
Family Income Brackets in South Dakota
According to the South Dakota family income data, there are 50,697 families falling into the $100,000 to $149,999 income range, which is the most common income bracket and makes up 23.2% of all families. Conversely, the $10,000 to $14,999 income bracket is the least frequent group with only 3,278 families (1.5%) belonging to this category.
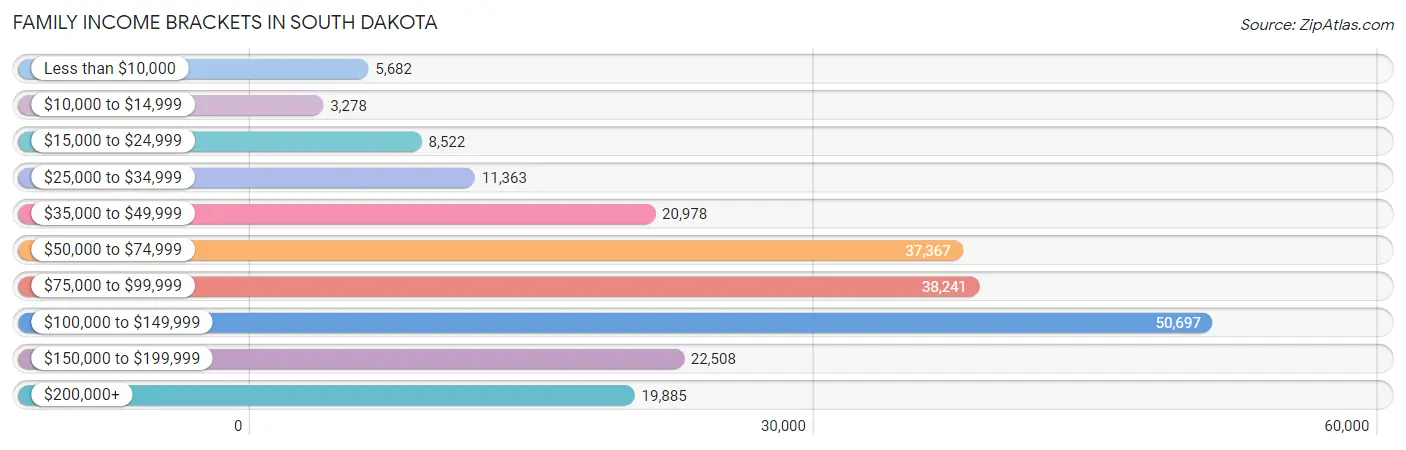
| Income Bracket | # Families | % Families |
| Less than $10,000 | 5,682 | 2.6% |
| $10,000 to $14,999 | 3,278 | 1.5% |
| $15,000 to $24,999 | 8,522 | 3.9% |
| $25,000 to $34,999 | 11,363 | 5.2% |
| $35,000 to $49,999 | 20,978 | 9.6% |
| $50,000 to $74,999 | 37,367 | 17.1% |
| $75,000 to $99,999 | 38,241 | 17.5% |
| $100,000 to $149,999 | 50,697 | 23.2% |
| $150,000 to $199,999 | 22,508 | 10.3% |
| $200,000+ | 19,885 | 9.1% |
Family Income by Famaliy Size in South Dakota
5-person families (19,265 | 8.8%) account for the highest median family income in South Dakota with $106,059 per family, while 2-person families (113,388 | 51.9%) have the highest median income of $40,836 per family member.
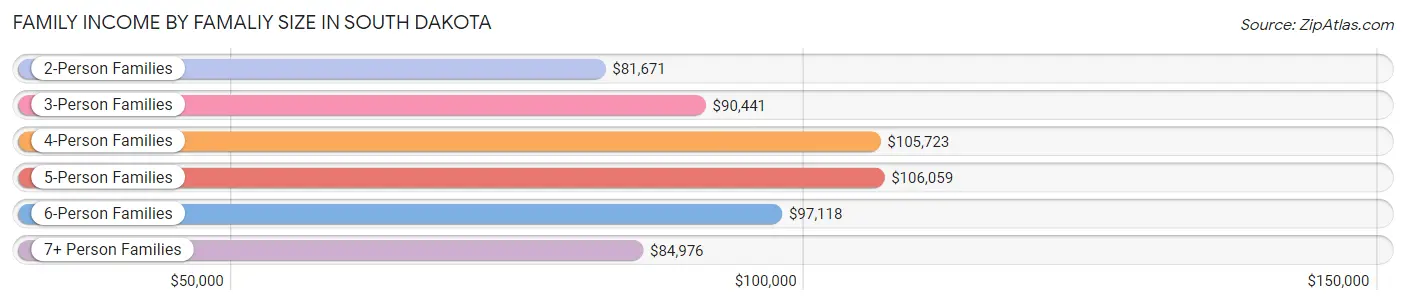
| Income Bracket | # Families | Median Income |
| 2-Person Families | 113,388 (51.9%) | $81,671 |
| 3-Person Families | 39,843 (18.2%) | $90,441 |
| 4-Person Families | 35,343 (16.2%) | $105,723 |
| 5-Person Families | 19,265 (8.8%) | $106,059 |
| 6-Person Families | 6,581 (3.0%) | $97,118 |
| 7+ Person Families | 4,101 (1.9%) | $84,976 |
| Total | 218,521 (100.0%) | $88,996 |
Family Income by Number of Earners in South Dakota
The median family income in South Dakota is $88,996, with families comprising 3+ earners (24,446) having the highest median family income of $136,977, while families with no earners (29,307) have the lowest median family income of $51,424, accounting for 11.2% and 13.4% of families, respectively.
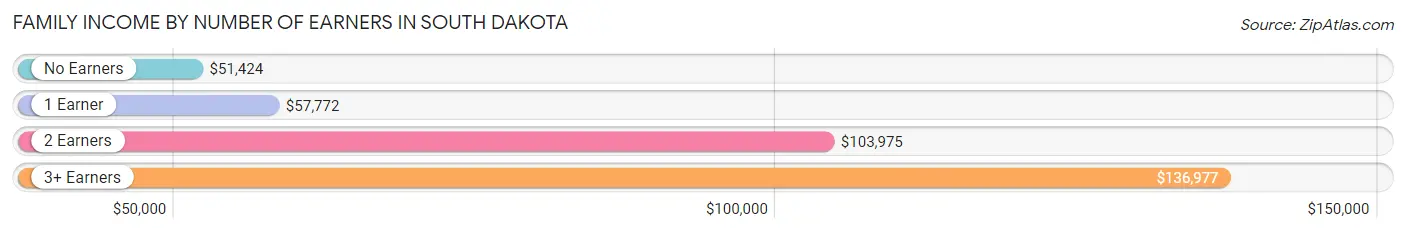
| Number of Earners | # Families | Median Income |
| No Earners | 29,307 (13.4%) | $51,424 |
| 1 Earner | 58,982 (27.0%) | $57,772 |
| 2 Earners | 105,786 (48.4%) | $103,975 |
| 3+ Earners | 24,446 (11.2%) | $136,977 |
| Total | 218,521 (100.0%) | $88,996 |
Household Income in South Dakota
Household Income Brackets in South Dakota
With 62,510 households falling in the category, the $50,000 to $74,999 income range is the most frequent in South Dakota, accounting for 17.8% of all households. In contrast, only 12,994 households (3.7%) fall into the $10,000 to $14,999 income bracket, making it the least populous group.
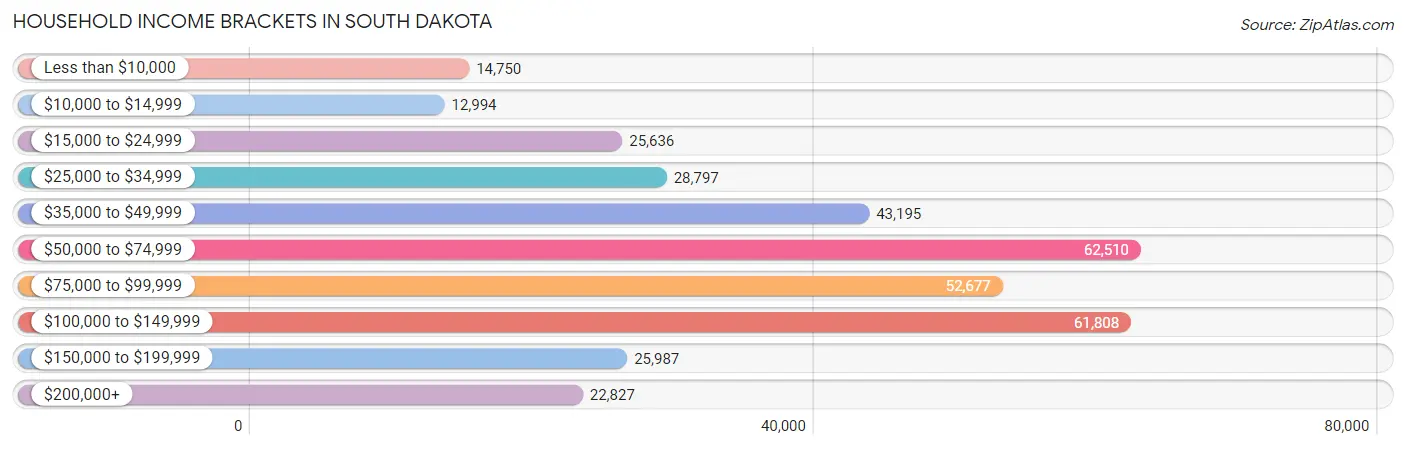
| Income Bracket | # Households | % Households |
| Less than $10,000 | 14,750 | 4.2% |
| $10,000 to $14,999 | 12,994 | 3.7% |
| $15,000 to $24,999 | 25,636 | 7.3% |
| $25,000 to $34,999 | 28,797 | 8.2% |
| $35,000 to $49,999 | 43,195 | 12.3% |
| $50,000 to $74,999 | 62,510 | 17.8% |
| $75,000 to $99,999 | 52,677 | 15.0% |
| $100,000 to $149,999 | 61,808 | 17.6% |
| $150,000 to $199,999 | 25,987 | 7.4% |
| $200,000+ | 22,827 | 6.5% |
Household Income by Householder Age in South Dakota
The median household income in South Dakota is $69,457, with the highest median household income of $84,713 found in the 45 to 64 years age bracket for the primary householder. A total of 119,528 households (34.0%) fall into this category. Meanwhile, the 15 to 24 years age bracket for the primary householder has the lowest median household income of $39,841, with 21,496 households (6.1%) in this group.
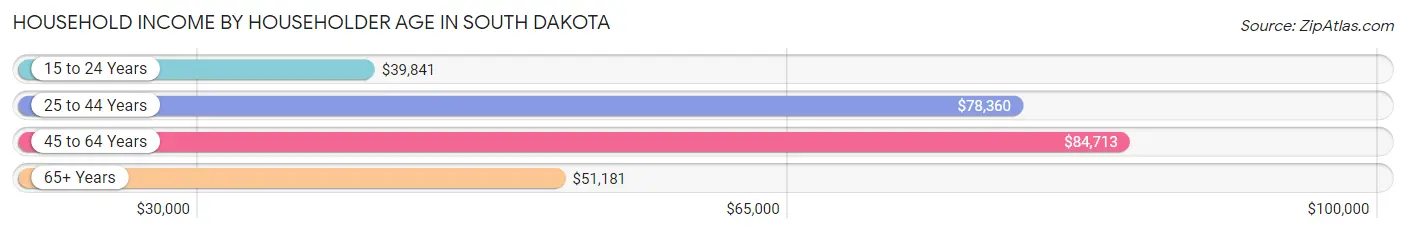
| Income Bracket | # Households | Median Income |
| 15 to 24 Years | 21,496 (6.1%) | $39,841 |
| 25 to 44 Years | 113,975 (32.5%) | $78,360 |
| 45 to 64 Years | 119,528 (34.0%) | $84,713 |
| 65+ Years | 96,183 (27.4%) | $51,181 |
| Total | 351,182 (100.0%) | $69,457 |
Poverty in South Dakota
Income Below Poverty by Sex and Age in South Dakota
With 11.0% poverty level for males and 13.6% for females among the residents of South Dakota, 5 year old males and 18 to 24 year old females are the most vulnerable to poverty, with 1,196 males (19.9%) and 10,091 females (28.1%) in their respective age groups living below the poverty level.
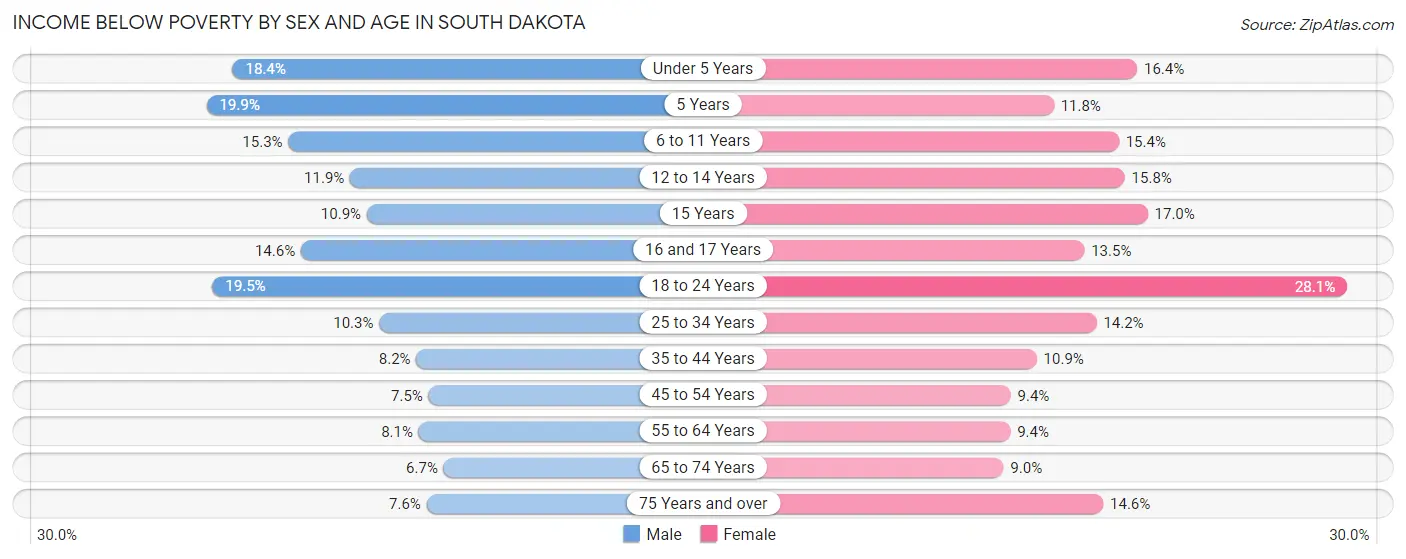
| Age Bracket | Male | Female |
| Under 5 Years | 5,301 (18.4%) | 4,643 (16.4%) |
| 5 Years | 1,196 (19.9%) | 670 (11.8%) |
| 6 to 11 Years | 5,602 (15.3%) | 5,378 (15.4%) |
| 12 to 14 Years | 2,203 (11.9%) | 2,846 (15.8%) |
| 15 Years | 683 (10.9%) | 906 (17.0%) |
| 16 and 17 Years | 1,713 (14.6%) | 1,611 (13.5%) |
| 18 to 24 Years | 7,437 (19.5%) | 10,091 (28.1%) |
| 25 to 34 Years | 5,924 (10.2%) | 7,604 (14.2%) |
| 35 to 44 Years | 4,581 (8.2%) | 5,629 (10.8%) |
| 45 to 54 Years | 3,636 (7.5%) | 4,302 (9.4%) |
| 55 to 64 Years | 4,661 (8.1%) | 5,353 (9.4%) |
| 65 to 74 Years | 3,052 (6.7%) | 4,042 (9.0%) |
| 75 Years and over | 1,801 (7.6%) | 4,677 (14.5%) |
| Total | 47,790 (11.0%) | 57,752 (13.6%) |
Income Above Poverty by Sex and Age in South Dakota
According to the poverty statistics in South Dakota, males aged 65 to 74 years and females aged 65 to 74 years are the age groups that are most secure financially, with 93.3% of males and 91.0% of females in these age groups living above the poverty line.
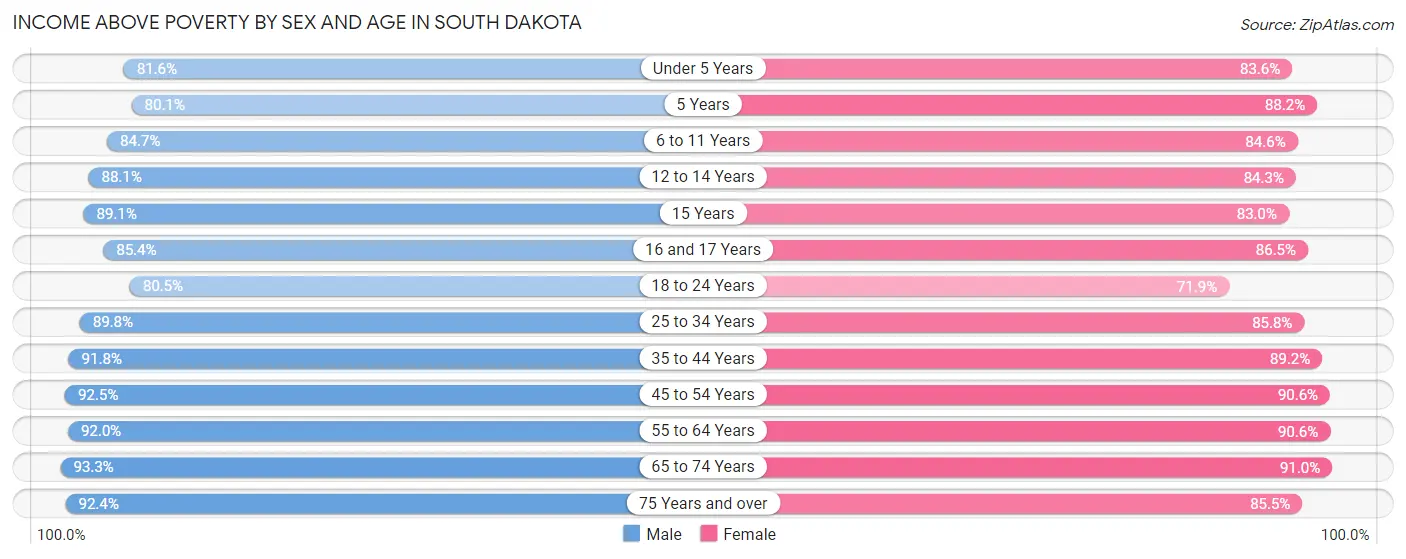
| Age Bracket | Male | Female |
| Under 5 Years | 23,479 (81.6%) | 23,591 (83.6%) |
| 5 Years | 4,823 (80.1%) | 5,010 (88.2%) |
| 6 to 11 Years | 30,996 (84.7%) | 29,492 (84.6%) |
| 12 to 14 Years | 16,352 (88.1%) | 15,227 (84.3%) |
| 15 Years | 5,558 (89.1%) | 4,413 (83.0%) |
| 16 and 17 Years | 10,008 (85.4%) | 10,319 (86.5%) |
| 18 to 24 Years | 30,619 (80.5%) | 25,785 (71.9%) |
| 25 to 34 Years | 51,849 (89.7%) | 46,025 (85.8%) |
| 35 to 44 Years | 51,394 (91.8%) | 46,260 (89.1%) |
| 45 to 54 Years | 44,814 (92.5%) | 41,476 (90.6%) |
| 55 to 64 Years | 53,211 (91.9%) | 51,686 (90.6%) |
| 65 to 74 Years | 42,740 (93.3%) | 40,879 (91.0%) |
| 75 Years and over | 21,858 (92.4%) | 27,472 (85.5%) |
| Total | 387,701 (89.0%) | 367,635 (86.4%) |
Income Below Poverty Among Married-Couple Families in South Dakota
The poverty statistics for married-couple families in South Dakota show that 3.4% or 5,804 of the total 172,549 families live below the poverty line. Families with 5 or more children have the highest poverty rate of 20.4%, comprising of 412 families. On the other hand, families with 1 or 2 children have the lowest poverty rate of 2.5%, which includes 1,225 families.
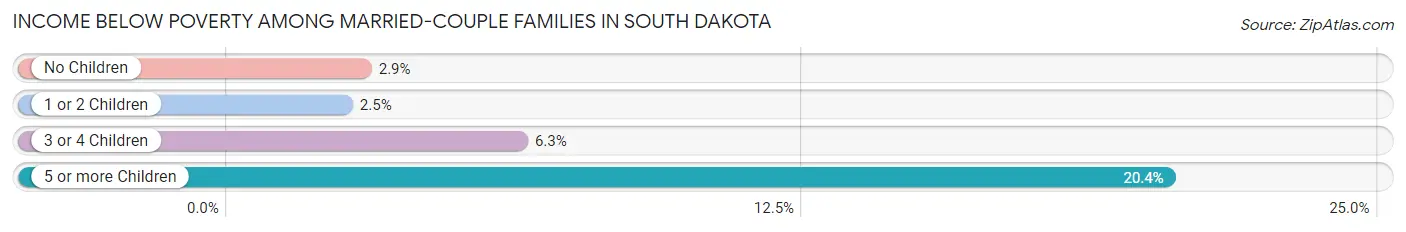
| Children | Above Poverty | Below Poverty |
| No Children | 99,861 (97.1%) | 2,991 (2.9%) |
| 1 or 2 Children | 47,820 (97.5%) | 1,225 (2.5%) |
| 3 or 4 Children | 17,456 (93.7%) | 1,176 (6.3%) |
| 5 or more Children | 1,608 (79.6%) | 412 (20.4%) |
| Total | 166,745 (96.6%) | 5,804 (3.4%) |
Income Below Poverty Among Single-Parent Households in South Dakota
According to the poverty data in South Dakota, 13.1% or 2,134 single-father households and 28.6% or 8,507 single-mother households are living below the poverty line. Among single-father households, those with 5 or more children have the highest poverty rate, with 63 households (40.9%) experiencing poverty. Likewise, among single-mother households, those with 5 or more children have the highest poverty rate, with 640 households (77.9%) falling below the poverty line.
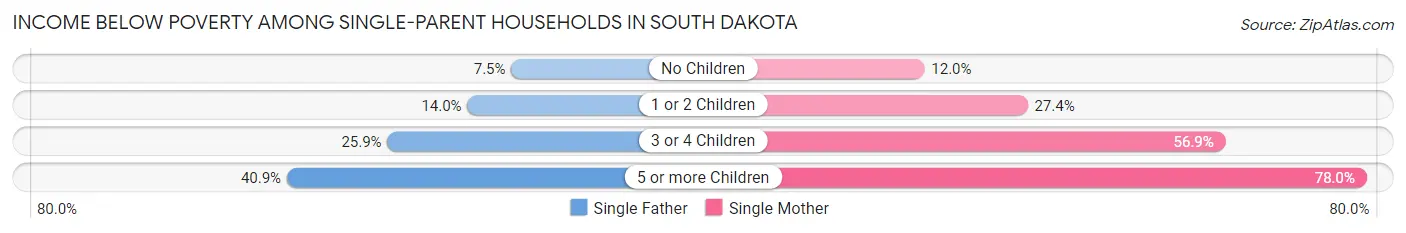
| Children | Single Father | Single Mother |
| No Children | 438 (7.5%) | 997 (12.0%) |
| 1 or 2 Children | 1,195 (14.0%) | 4,516 (27.4%) |
| 3 or 4 Children | 438 (25.9%) | 2,354 (56.9%) |
| 5 or more Children | 63 (40.9%) | 640 (77.9%) |
| Total | 2,134 (13.1%) | 8,507 (28.6%) |
Income Below Poverty Among Married-Couple vs Single-Parent Households in South Dakota
The poverty data for South Dakota shows that 5,804 of the married-couple family households (3.4%) and 10,641 of the single-parent households (23.2%) are living below the poverty level. Within the married-couple family households, those with 5 or more children have the highest poverty rate, with 412 households (20.4%) falling below the poverty line. Among the single-parent households, those with 5 or more children have the highest poverty rate, with 703 household (72.1%) living below poverty.
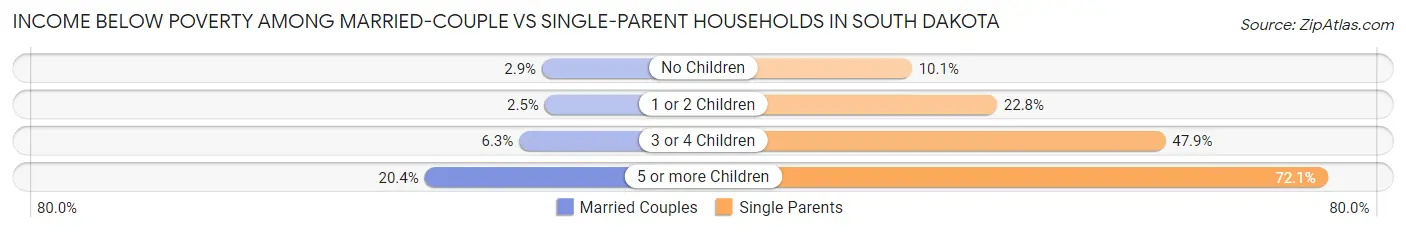
| Children | Married-Couple Families | Single-Parent Households |
| No Children | 2,991 (2.9%) | 1,435 (10.1%) |
| 1 or 2 Children | 1,225 (2.5%) | 5,711 (22.8%) |
| 3 or 4 Children | 1,176 (6.3%) | 2,792 (47.9%) |
| 5 or more Children | 412 (20.4%) | 703 (72.1%) |
| Total | 5,804 (3.4%) | 10,641 (23.2%) |
Largest Zip Codes by Population in South Dakota
The largest zip codes in South Dakota by population are 57106 (50,299), 57701 (45,046), 57103 (35,785), 57702 (34,985), and 57401 (32,217).
1.57106
50,299 (5.65%)
2.57701
45,046 (5.06%)
3.57103
35,785 (4.02%)
4.57702
34,985 (3.93%)
5.57401
32,217 (3.62%)
6.57108
31,255 (3.51%)
7.57104
26,627 (2.99%)
8.57201
26,119 (2.93%)
9.57006
23,402 (2.63%)
10.57105
22,754 (2.56%)
11.57110
21,138 (2.37%)
12.57078
20,266 (2.28%)
13.57301
18,967 (2.13%)
14.57501
17,380 (1.95%)
15.57703
16,951 (1.90%)
16.57783
16,533 (1.86%)
17.57350
15,899 (1.79%)
18.57069
12,872 (1.45%)
19.57005
12,169 (1.37%)
20.57719
11,583 (1.30%)
21.57107
10,994 (1.23%)
22.57785
10,523 (1.18%)
23.57032
8,960 (1.01%)
24.57717
8,468 (0.95%)
25.57042
8,178 (0.92%)
26.57049
7,661 (0.86%)
27.57718
7,507 (0.84%)
28.57064
7,240 (0.81%)
29.57033
6,050 (0.68%)
30.57770
5,815 (0.65%)
Largest Cities by Population in South Dakota
The largest cities in South Dakota by population are Sioux Falls (193,401), Rapid City (75,632), Aberdeen (28,388), Brookings (23,530), and Watertown (22,718).
193,401 (21.72%)
75,632 (8.49%)
3.Aberdeen
28,388 (3.19%)
23,530 (2.64%)
22,718 (2.55%)
6.Mitchell
15,656 (1.76%)
7.Yankton
15,421 (1.73%)
8.Huron
14,179 (1.59%)
9.Pierre
14,105 (1.58%)
10.Spearfish
12,268 (1.38%)
11.Box Elder
11,905 (1.34%)
12.Vermillion
11,667 (1.31%)
13.Brandon
10,919 (1.23%)
14.Rapid Valley
7,324 (0.82%)
15.Harrisburg
7,157 (0.80%)
16.Sturgis
7,121 (0.80%)
17.Madison
6,271 (0.70%)
18.Tea
5,922 (0.67%)
5,670 (0.64%)
20.Dakota Dunes
3,997 (0.45%)
21.Dell Rapids
3,953 (0.44%)
22.Milbank
3,506 (0.39%)
23.Hot Springs
3,465 (0.39%)
24.Hartford
3,340 (0.38%)
25.Mobridge
3,130 (0.35%)
26.Canton
3,060 (0.34%)
27.Lead
2,993 (0.34%)
2,984 (0.34%)
29.Summerset
2,950 (0.33%)
30.Blackhawk
2,930 (0.33%)
Largest Counties by Population in South Dakota
The largest counties in South Dakota by population are Minnehaha County (197,742), Pennington County (110,386), Lincoln County (65,801), Brown County (38,278), and Brookings County (34,631).
197,742 (22.21%)
110,386 (12.40%)
65,801 (7.39%)
38,278 (4.30%)
34,631 (3.89%)
29,970 (3.37%)
28,402 (3.19%)
26,047 (2.93%)
23,311 (2.62%)
19,966 (2.24%)
19,089 (2.14%)
17,812 (2.00%)
13.Union County
16,700 (1.88%)
14.Clay County
14,953 (1.68%)
13,695 (1.54%)
16.Lake County
11,207 (1.26%)
17.Butte County
10,369 (1.16%)
10,242 (1.15%)
19.Todd County
9,353 (1.05%)
9,302 (1.04%)
8,687 (0.98%)
8,515 (0.96%)
23.Grant County
7,533 (0.85%)
7,401 (0.83%)
7,079 (0.80%)
7,018 (0.79%)
27.Spink County
6,355 (0.71%)
28.Moody County
6,346 (0.71%)
6,196 (0.70%)
5,714 (0.64%)
Race in South Dakota
The most populous races in South Dakota are White / Caucasian (731,624 | 82.2%), Native / Alaskan (70,948 | 8.0%), and Two or more Races (44,430 | 5.0%).
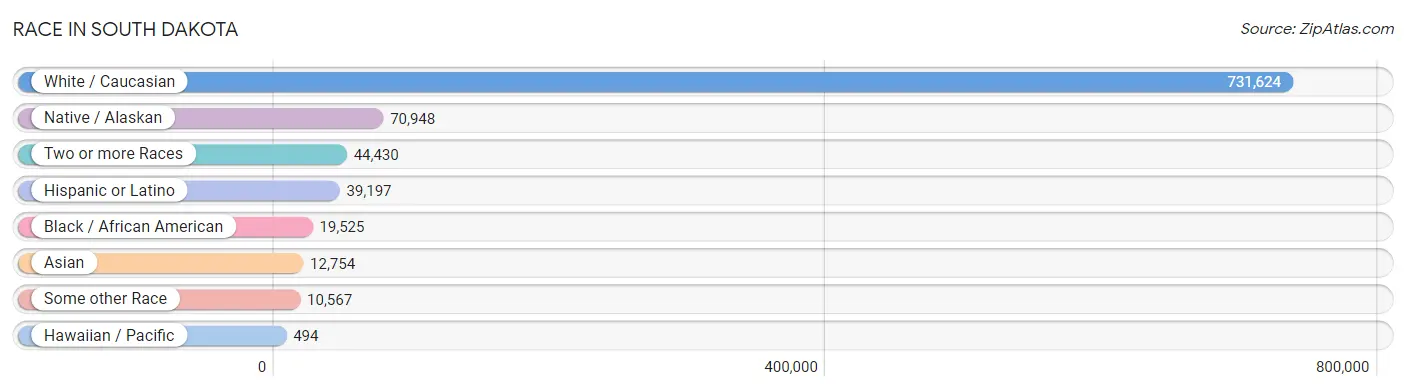
| Race | # Population | % Population |
| Asian | 12,754 | 1.4% |
| Black / African American | 19,525 | 2.2% |
| Hawaiian / Pacific | 494 | 0.1% |
| Hispanic or Latino | 39,197 | 4.4% |
| Native / Alaskan | 70,948 | 8.0% |
| White / Caucasian | 731,624 | 82.2% |
| Two or more Races | 44,430 | 5.0% |
| Some other Race | 10,567 | 1.2% |
| Total | 890,342 | 100.0% |
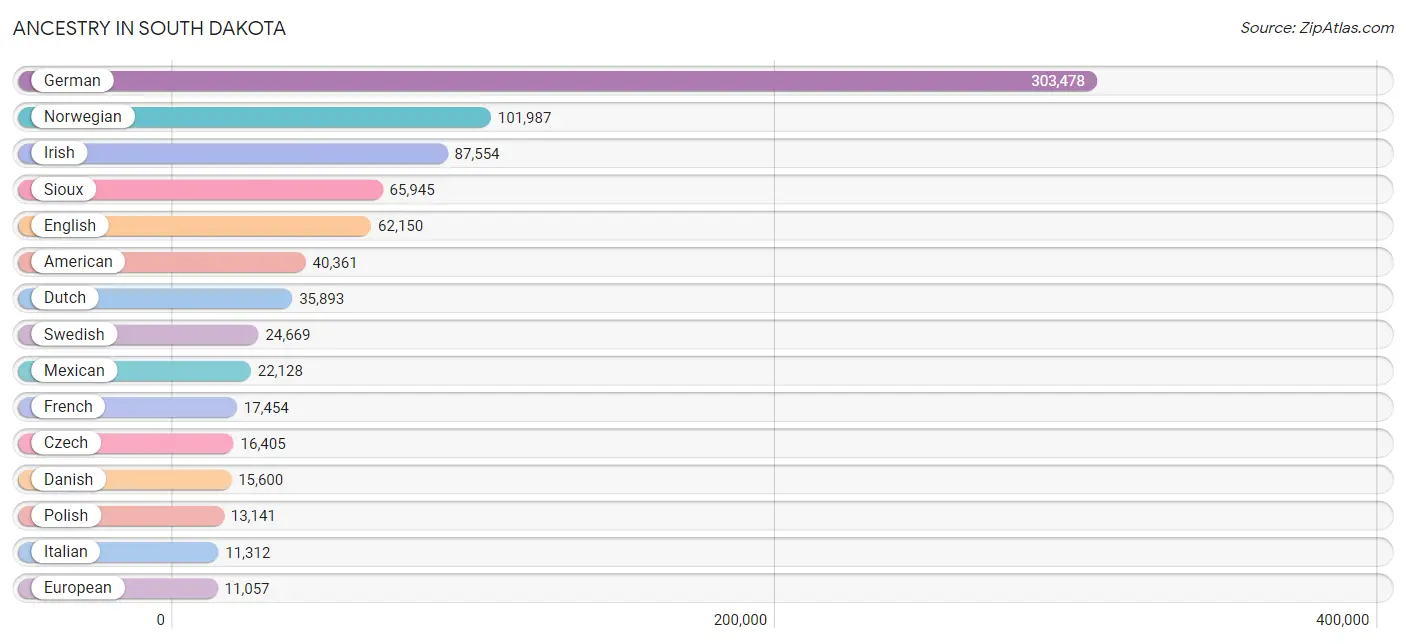
Ancestry in South Dakota
The most populous ancestries reported in South Dakota are German (303,478 | 34.1%), Norwegian (101,987 | 11.5%), Irish (87,554 | 9.8%), Sioux (65,945 | 7.4%), and English (62,150 | 7.0%), together accounting for 69.8% of all South Dakota residents.
| Ancestry | # Population | % Population |
| Afghan | 166 | 0.0% |
| African | 3,001 | 0.3% |
| Alaska Native | 114 | 0.0% |
| Alaskan Athabascan | 14 | 0.0% |
| Albanian | 267 | 0.0% |
| Aleut | 13 | 0.0% |
| Alsatian | 49 | 0.0% |
| American | 40,361 | 4.5% |
| Apache | 218 | 0.0% |
| Arab | 1,994 | 0.2% |
| Arapaho | 296 | 0.0% |
| Argentinean | 63 | 0.0% |
| Armenian | 114 | 0.0% |
| Australian | 28 | 0.0% |
| Austrian | 1,608 | 0.2% |
| Bahamian | 13 | 0.0% |
| Bangladeshi | 403 | 0.1% |
| Barbadian | 21 | 0.0% |
| Basque | 110 | 0.0% |
| Belgian | 1,638 | 0.2% |
| Belizean | 6 | 0.0% |
| Bermudan | 51 | 0.0% |
| Bhutanese | 1,308 | 0.2% |
| Blackfeet | 310 | 0.0% |
| Bolivian | 53 | 0.0% |
| Brazilian | 306 | 0.0% |
| British | 2,497 | 0.3% |
| British West Indian | 15 | 0.0% |
| Bulgarian | 61 | 0.0% |
| Burmese | 1,869 | 0.2% |
| Cajun | 15 | 0.0% |
| Cambodian | 16 | 0.0% |
| Canadian | 982 | 0.1% |
| Carpatho Rusyn | 14 | 0.0% |
| Celtic | 131 | 0.0% |
| Central American | 6,938 | 0.8% |
| Central American Indian | 123 | 0.0% |
| Cherokee | 1,290 | 0.1% |
| Cheyenne | 675 | 0.1% |
| Chickasaw | 10 | 0.0% |
| Chilean | 329 | 0.0% |
| Chippewa | 1,204 | 0.1% |
| Choctaw | 340 | 0.0% |
| Colombian | 227 | 0.0% |
| Comanche | 15 | 0.0% |
| Costa Rican | 38 | 0.0% |
| Cree | 8 | 0.0% |
| Creek | 86 | 0.0% |
| Croatian | 411 | 0.1% |
| Crow | 198 | 0.0% |
| Cuban | 871 | 0.1% |
| Cypriot | 6 | 0.0% |
| Czech | 16,405 | 1.8% |
| Czechoslovakian | 1,202 | 0.1% |
| Danish | 15,600 | 1.8% |
| Dominican | 466 | 0.1% |
| Dutch | 35,893 | 4.0% |
| Dutch West Indian | 2 | 0.0% |
| Eastern European | 1,026 | 0.1% |
| Ecuadorian | 27 | 0.0% |
| Egyptian | 228 | 0.0% |
| English | 62,150 | 7.0% |
| Estonian | 64 | 0.0% |
| Ethiopian | 3,212 | 0.4% |
| European | 11,057 | 1.2% |
| Fijian | 29 | 0.0% |
| Filipino | 4 | 0.0% |
| Finnish | 4,202 | 0.5% |
| French | 17,454 | 2.0% |
| French American Indian | 124 | 0.0% |
| French Canadian | 3,204 | 0.4% |
| German | 303,478 | 34.1% |
| German Russian | 397 | 0.0% |
| Ghanaian | 81 | 0.0% |
| Greek | 1,225 | 0.1% |
| Guamanian / Chamorro | 209 | 0.0% |
| Guatemalan | 3,873 | 0.4% |
| Guyanese | 33 | 0.0% |
| Haitian | 334 | 0.0% |
| Honduran | 399 | 0.0% |
| Hopi | 4 | 0.0% |
| Hungarian | 1,066 | 0.1% |
| Icelander | 348 | 0.0% |
| Indian (Asian) | 1,784 | 0.2% |
| Indonesian | 1,507 | 0.2% |
| Inupiat | 65 | 0.0% |
| Iranian | 76 | 0.0% |
| Iraqi | 143 | 0.0% |
| Irish | 87,554 | 9.8% |
| Iroquois | 277 | 0.0% |
| Israeli | 12 | 0.0% |
| Italian | 11,312 | 1.3% |
| Jamaican | 193 | 0.0% |
| Japanese | 218 | 0.0% |
| Jordanian | 13 | 0.0% |
| Kenyan | 43 | 0.0% |
| Kiowa | 5 | 0.0% |
| Korean | 3,893 | 0.4% |
| Laotian | 94 | 0.0% |
| Latvian | 157 | 0.0% |
| Lebanese | 708 | 0.1% |
| Liberian | 978 | 0.1% |
| Lithuanian | 422 | 0.1% |
| Lumbee | 6 | 0.0% |
| Luxembourger | 540 | 0.1% |
| Macedonian | 9 | 0.0% |
| Malaysian | 343 | 0.0% |
| Maltese | 14 | 0.0% |
| Menominee | 32 | 0.0% |
| Mexican | 22,128 | 2.5% |
| Mexican American Indian | 402 | 0.1% |
| Mongolian | 7 | 0.0% |
| Moroccan | 39 | 0.0% |
| Native Hawaiian | 445 | 0.1% |
| Navajo | 415 | 0.1% |
| New Zealander | 17 | 0.0% |
| Nicaraguan | 503 | 0.1% |
| Nigerian | 122 | 0.0% |
| Northern European | 1,510 | 0.2% |
| Norwegian | 101,987 | 11.5% |
| Okinawan | 28 | 0.0% |
| Ottawa | 9 | 0.0% |
| Paiute | 18 | 0.0% |
| Pakistani | 673 | 0.1% |
| Palestinian | 52 | 0.0% |
| Panamanian | 19 | 0.0% |
| Paraguayan | 1 | 0.0% |
| Pennsylvania German | 558 | 0.1% |
| Peruvian | 272 | 0.0% |
| Pima | 24 | 0.0% |
| Polish | 13,141 | 1.5% |
| Portuguese | 775 | 0.1% |
| Potawatomi | 48 | 0.0% |
| Pueblo | 72 | 0.0% |
| Puerto Rican | 3,791 | 0.4% |
| Puget Sound Salish | 56 | 0.0% |
| Romanian | 261 | 0.0% |
| Russian | 8,533 | 1.0% |
| Salvadoran | 2,105 | 0.2% |
| Samoan | 87 | 0.0% |
| Scandinavian | 9,195 | 1.0% |
| Scotch-Irish | 4,808 | 0.5% |
| Scottish | 9,620 | 1.1% |
| Seminole | 65 | 0.0% |
| Serbian | 247 | 0.0% |
| Shoshone | 37 | 0.0% |
| Sioux | 65,945 | 7.4% |
| Slavic | 175 | 0.0% |
| Slovak | 578 | 0.1% |
| Slovene | 118 | 0.0% |
| Somali | 918 | 0.1% |
| South African | 236 | 0.0% |
| South American | 1,025 | 0.1% |
| South American Indian | 22 | 0.0% |
| Spaniard | 660 | 0.1% |
| Spanish | 1,231 | 0.1% |
| Spanish American | 8 | 0.0% |
| Spanish American Indian | 7 | 0.0% |
| Sri Lankan | 1,286 | 0.1% |
| Subsaharan African | 9,945 | 1.1% |
| Sudanese | 767 | 0.1% |
| Swedish | 24,669 | 2.8% |
| Swiss | 2,973 | 0.3% |
| Syrian | 111 | 0.0% |
| Thai | 2,705 | 0.3% |
| Tlingit-Haida | 37 | 0.0% |
| Tohono O'Odham | 42 | 0.0% |
| Tongan | 12 | 0.0% |
| Turkish | 117 | 0.0% |
| U.S. Virgin Islander | 2 | 0.0% |
| Ugandan | 24 | 0.0% |
| Ukrainian | 2,229 | 0.3% |
| Ute | 50 | 0.0% |
| Venezuelan | 53 | 0.0% |
| Vietnamese | 28 | 0.0% |
| Welsh | 3,932 | 0.4% |
| West Indian | 484 | 0.1% |
| Yaqui | 12 | 0.0% |
| Yugoslavian | 692 | 0.1% |
| Yuman | 32 | 0.0% | View All 180 Rows |
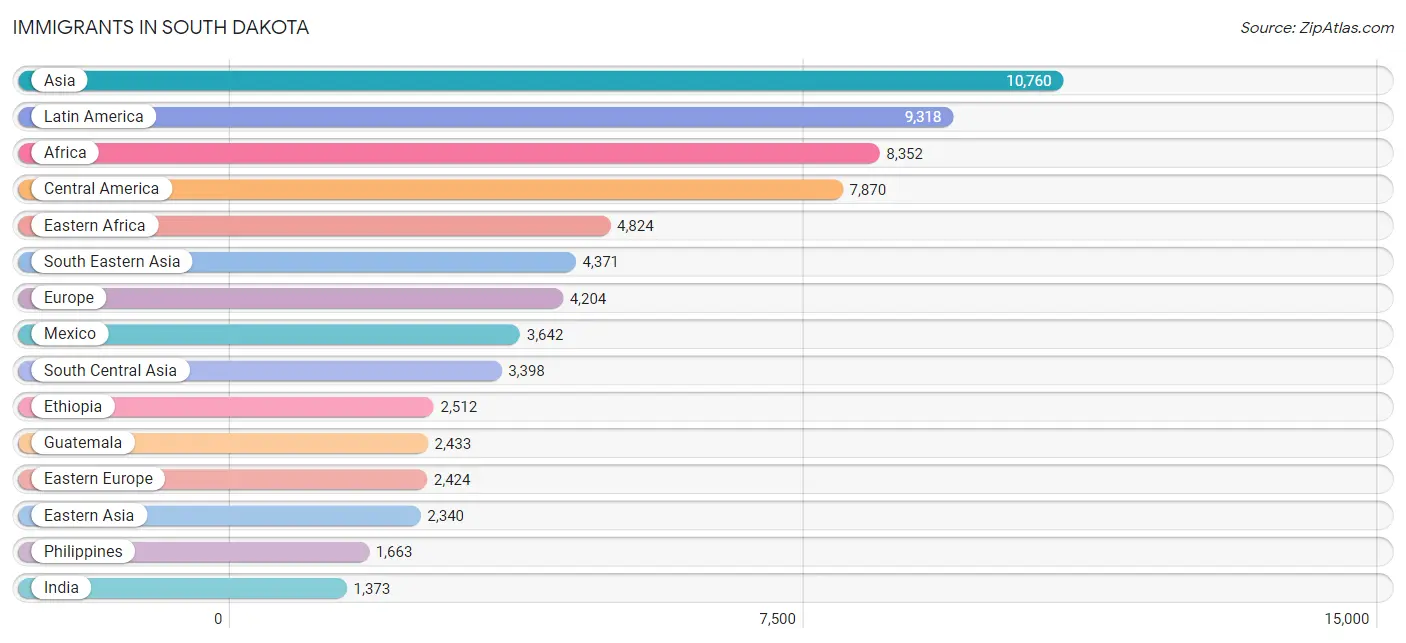
Immigrants in South Dakota
The most numerous immigrant groups reported in South Dakota came from Asia (10,760 | 1.2%), Latin America (9,318 | 1.1%), Africa (8,352 | 0.9%), Central America (7,870 | 0.9%), and Eastern Africa (4,824 | 0.5%), together accounting for 4.6% of all South Dakota residents.
| Immigration Origin | # Population | % Population |
| Afghanistan | 114 | 0.0% |
| Africa | 8,352 | 0.9% |
| Albania | 130 | 0.0% |
| Argentina | 6 | 0.0% |
| Armenia | 2 | 0.0% |
| Asia | 10,760 | 1.2% |
| Australia | 17 | 0.0% |
| Austria | 12 | 0.0% |
| Bahamas | 9 | 0.0% |
| Bangladesh | 134 | 0.0% |
| Belarus | 103 | 0.0% |
| Belgium | 11 | 0.0% |
| Belize | 22 | 0.0% |
| Bolivia | 18 | 0.0% |
| Bosnia and Herzegovina | 91 | 0.0% |
| Brazil | 116 | 0.0% |
| Cambodia | 192 | 0.0% |
| Cameroon | 2 | 0.0% |
| Canada | 1,125 | 0.1% |
| Caribbean | 829 | 0.1% |
| Central America | 7,870 | 0.9% |
| Chile | 130 | 0.0% |
| China | 970 | 0.1% |
| Colombia | 86 | 0.0% |
| Congo | 405 | 0.1% |
| Costa Rica | 12 | 0.0% |
| Croatia | 119 | 0.0% |
| Cuba | 304 | 0.0% |
| Czechoslovakia | 79 | 0.0% |
| Denmark | 24 | 0.0% |
| Dominican Republic | 208 | 0.0% |
| Eastern Africa | 4,824 | 0.5% |
| Eastern Asia | 2,340 | 0.3% |
| Eastern Europe | 2,424 | 0.3% |
| Ecuador | 113 | 0.0% |
| Egypt | 325 | 0.0% |
| El Salvador | 1,337 | 0.2% |
| England | 365 | 0.0% |
| Eritrea | 975 | 0.1% |
| Ethiopia | 2,512 | 0.3% |
| Europe | 4,204 | 0.5% |
| Fiji | 5 | 0.0% |
| France | 49 | 0.0% |
| Germany | 624 | 0.1% |
| Ghana | 81 | 0.0% |
| Greece | 13 | 0.0% |
| Guatemala | 2,433 | 0.3% |
| Haiti | 75 | 0.0% |
| Honduras | 205 | 0.0% |
| Hong Kong | 32 | 0.0% |
| Hungary | 7 | 0.0% |
| India | 1,373 | 0.2% |
| Indonesia | 49 | 0.0% |
| Iran | 48 | 0.0% |
| Iraq | 393 | 0.0% |
| Ireland | 9 | 0.0% |
| Israel | 13 | 0.0% |
| Italy | 24 | 0.0% |
| Jamaica | 111 | 0.0% |
| Japan | 474 | 0.1% |
| Jordan | 13 | 0.0% |
| Kazakhstan | 25 | 0.0% |
| Kenya | 152 | 0.0% |
| Korea | 896 | 0.1% |
| Laos | 221 | 0.0% |
| Latin America | 9,318 | 1.1% |
| Latvia | 5 | 0.0% |
| Lebanon | 105 | 0.0% |
| Liberia | 978 | 0.1% |
| Malaysia | 36 | 0.0% |
| Mexico | 3,642 | 0.4% |
| Middle Africa | 1,079 | 0.1% |
| Moldova | 30 | 0.0% |
| Morocco | 37 | 0.0% |
| Nepal | 1,180 | 0.1% |
| Netherlands | 134 | 0.0% |
| Nicaragua | 126 | 0.0% |
| Nigeria | 152 | 0.0% |
| Northern Africa | 721 | 0.1% |
| Northern Europe | 750 | 0.1% |
| Norway | 35 | 0.0% |
| Oceania | 327 | 0.0% |
| Pakistan | 75 | 0.0% |
| Panama | 91 | 0.0% |
| Peru | 125 | 0.0% |
| Philippines | 1,663 | 0.2% |
| Poland | 49 | 0.0% |
| Portugal | 29 | 0.0% |
| Romania | 24 | 0.0% |
| Russia | 199 | 0.0% |
| Scotland | 63 | 0.0% |
| Serbia | 21 | 0.0% |
| Singapore | 20 | 0.0% |
| Somalia | 455 | 0.1% |
| South Africa | 346 | 0.0% |
| South America | 619 | 0.1% |
| South Central Asia | 3,398 | 0.4% |
| South Eastern Asia | 4,371 | 0.5% |
| Southern Europe | 166 | 0.0% |
| Spain | 70 | 0.0% |
| St. Vincent and the Grenadines | 61 | 0.0% |
| Sudan | 257 | 0.0% |
| Sweden | 36 | 0.0% |
| Switzerland | 34 | 0.0% |
| Taiwan | 33 | 0.0% |
| Thailand | 847 | 0.1% |
| Turkey | 37 | 0.0% |
| Uganda | 73 | 0.0% |
| Ukraine | 1,237 | 0.1% |
| Uzbekistan | 13 | 0.0% |
| Venezuela | 21 | 0.0% |
| Vietnam | 510 | 0.1% |
| Western Africa | 1,349 | 0.2% |
| Western Asia | 632 | 0.1% |
| Western Europe | 864 | 0.1% |
| Zaire | 672 | 0.1% |
| Zimbabwe | 18 | 0.0% | View All 117 Rows |
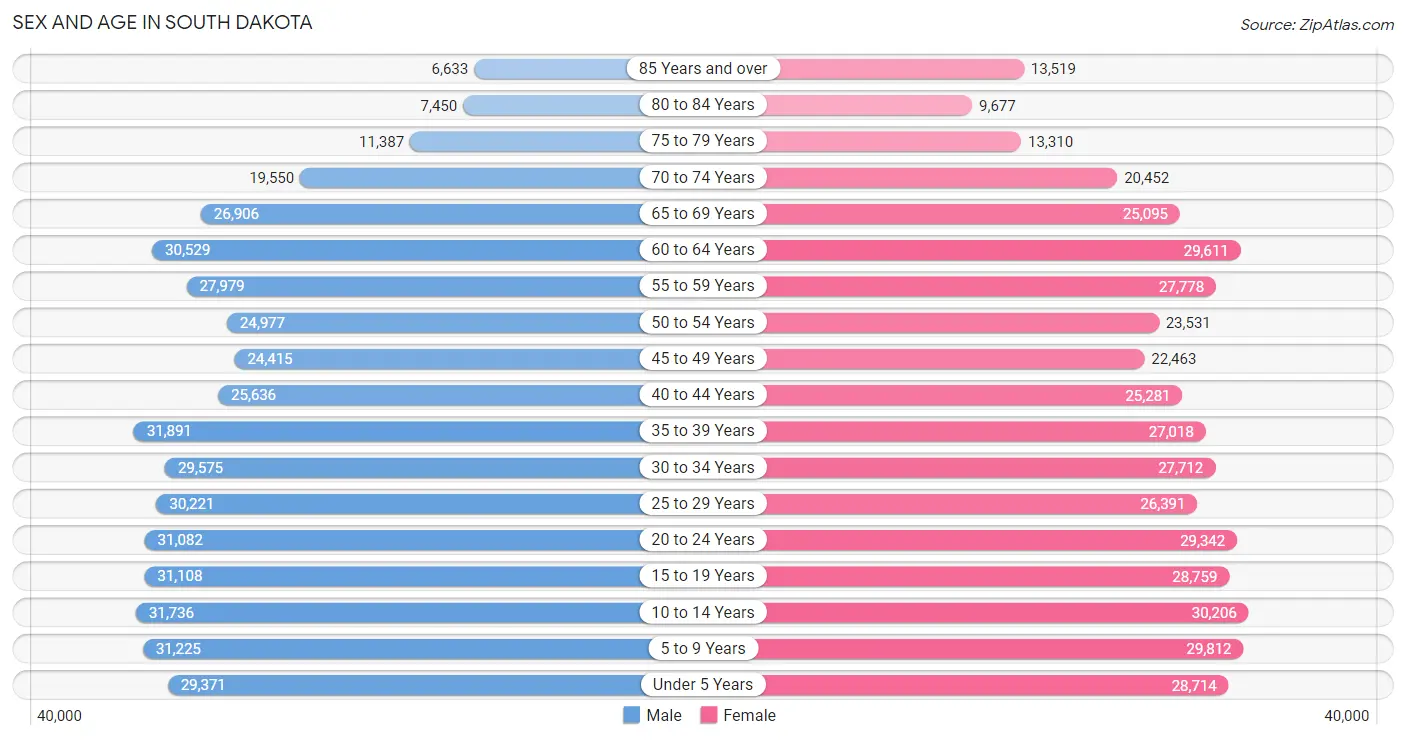
Sex and Age in South Dakota
Sex and Age in South Dakota
The most populous age groups in South Dakota are 35 to 39 Years (31,891 | 7.1%) for men and 10 to 14 Years (30,206 | 6.9%) for women.
| Age Bracket | Male | Female |
| Under 5 Years | 29,371 (6.5%) | 28,714 (6.6%) |
| 5 to 9 Years | 31,225 (6.9%) | 29,812 (6.8%) |
| 10 to 14 Years | 31,736 (7.0%) | 30,206 (6.9%) |
| 15 to 19 Years | 31,108 (6.9%) | 28,759 (6.6%) |
| 20 to 24 Years | 31,082 (6.9%) | 29,342 (6.7%) |
| 25 to 29 Years | 30,221 (6.7%) | 26,391 (6.0%) |
| 30 to 34 Years | 29,575 (6.6%) | 27,712 (6.3%) |
| 35 to 39 Years | 31,891 (7.1%) | 27,018 (6.2%) |
| 40 to 44 Years | 25,636 (5.7%) | 25,281 (5.8%) |
| 45 to 49 Years | 24,415 (5.4%) | 22,463 (5.1%) |
| 50 to 54 Years | 24,977 (5.5%) | 23,531 (5.4%) |
| 55 to 59 Years | 27,979 (6.2%) | 27,778 (6.3%) |
| 60 to 64 Years | 30,529 (6.8%) | 29,611 (6.8%) |
| 65 to 69 Years | 26,906 (6.0%) | 25,095 (5.7%) |
| 70 to 74 Years | 19,550 (4.3%) | 20,452 (4.7%) |
| 75 to 79 Years | 11,387 (2.5%) | 13,310 (3.0%) |
| 80 to 84 Years | 7,450 (1.7%) | 9,677 (2.2%) |
| 85 Years and over | 6,633 (1.5%) | 13,519 (3.1%) |
| Total | 451,671 (100.0%) | 438,671 (100.0%) |
Families and Households in South Dakota
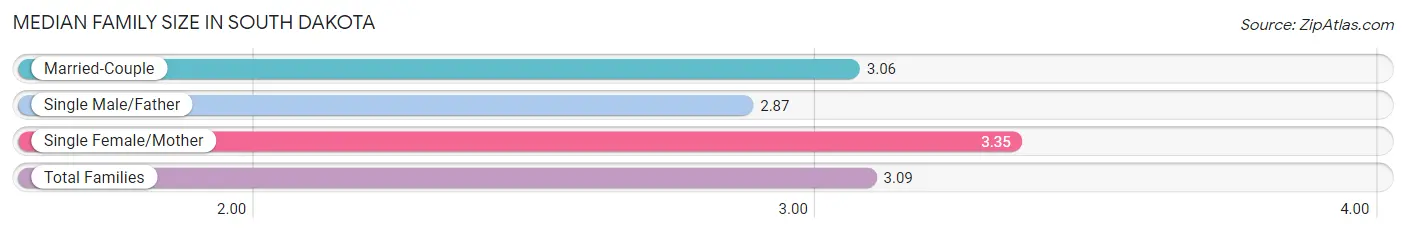
Median Family Size in South Dakota
The median family size in South Dakota is 3.09 persons per family, with single female/mother families (29,737 | 13.6%) accounting for the largest median family size of 3.35 persons per family. On the other hand, single male/father families (16,235 | 7.4%) represent the smallest median family size with 2.87 persons per family.
| Family Type | # Families | Family Size |
| Married-Couple | 172,549 (79.0%) | 3.06 |
| Single Male/Father | 16,235 (7.4%) | 2.87 |
| Single Female/Mother | 29,737 (13.6%) | 3.35 |
| Total Families | 218,521 (100.0%) | 3.09 |
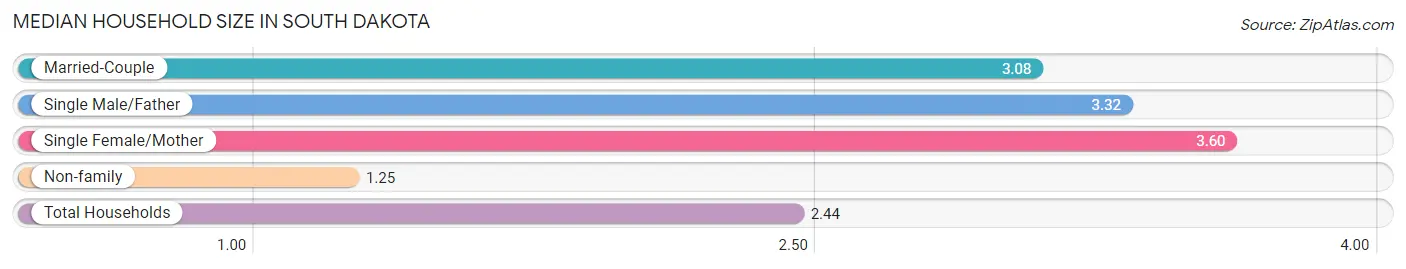
Median Household Size in South Dakota
The median household size in South Dakota is 2.44 persons per household, with single female/mother households (29,737 | 8.5%) accounting for the largest median household size of 3.6 persons per household. non-family households (132,661 | 37.8%) represent the smallest median household size with 1.25 persons per household.
| Household Type | # Households | Household Size |
| Married-Couple | 172,549 (49.1%) | 3.08 |
| Single Male/Father | 16,235 (4.6%) | 3.32 |
| Single Female/Mother | 29,737 (8.5%) | 3.60 |
| Non-family | 132,661 (37.8%) | 1.25 |
| Total Households | 351,182 (100.0%) | 2.44 |
Household Size by Marriage Status in South Dakota
Out of a total of 351,182 households in South Dakota, 218,521 (62.2%) are family households, while 132,661 (37.8%) are nonfamily households. The most numerous type of family households are 2-person households, comprising 107,281, and the most common type of nonfamily households are 1-person households, comprising 108,183.
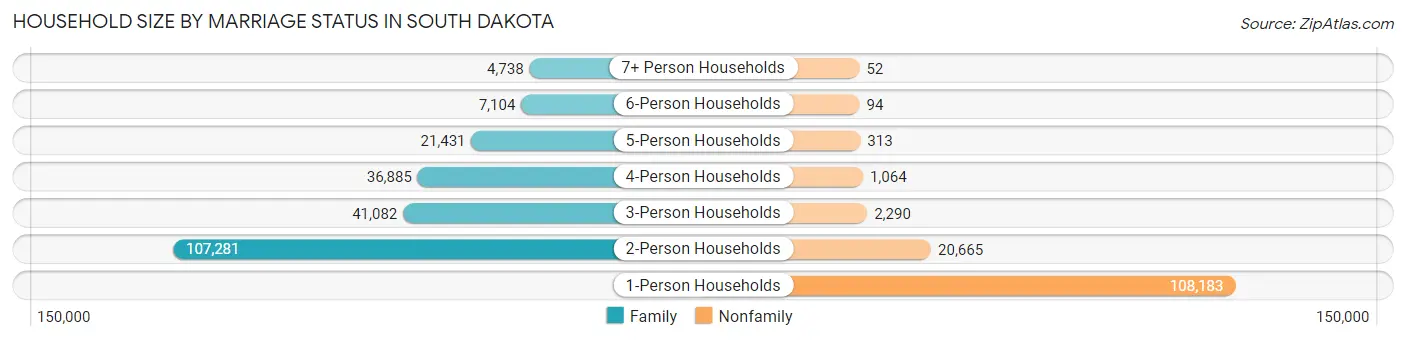
| Household Size | Family Households | Nonfamily Households |
| 1-Person Households | - | 108,183 (30.8%) |
| 2-Person Households | 107,281 (30.5%) | 20,665 (5.9%) |
| 3-Person Households | 41,082 (11.7%) | 2,290 (0.6%) |
| 4-Person Households | 36,885 (10.5%) | 1,064 (0.3%) |
| 5-Person Households | 21,431 (6.1%) | 313 (0.1%) |
| 6-Person Households | 7,104 (2.0%) | 94 (0.0%) |
| 7+ Person Households | 4,738 (1.3%) | 52 (0.0%) |
| Total | 218,521 (62.2%) | 132,661 (37.8%) |
Female Fertility in South Dakota
Fertility by Age in South Dakota
Average fertility rate in South Dakota is 64.0 births per 1,000 women. Women in the age bracket of 20 to 34 years have the highest fertility rate with 110.0 births per 1,000 women. Women in the age bracket of 20 to 34 years acount for 74.9% of all women with births.
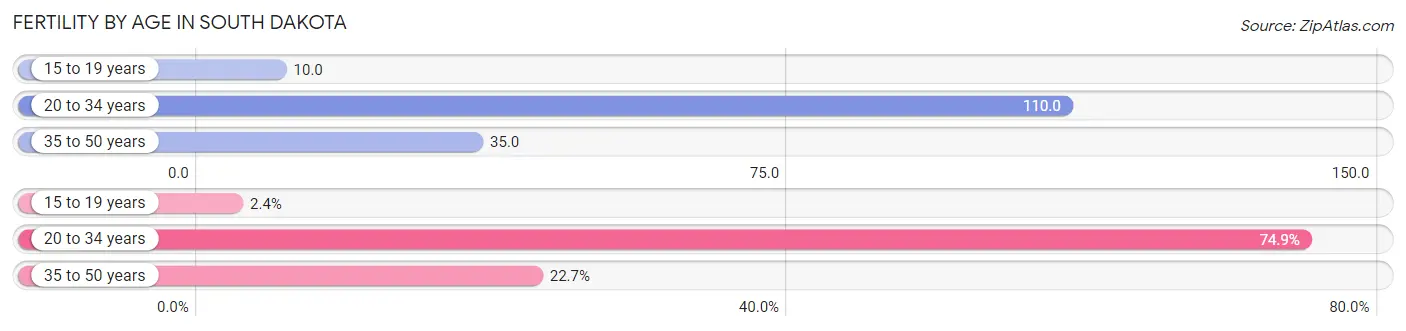
| Age Bracket | Women with Births | Births / 1,000 Women |
| 15 to 19 years | 291 (2.4%) | 10.0 |
| 20 to 34 years | 9,159 (74.9%) | 110.0 |
| 35 to 50 years | 2,778 (22.7%) | 35.0 |
| Total | 12,228 (100.0%) | 64.0 |
Fertility by Age by Marriage Status in South Dakota
71.4% of women with births (12,228) in South Dakota are married. The highest percentage of unmarried women with births falls into 15 to 19 years age bracket with 81.8% of them unmarried at the time of birth, while the lowest percentage of unmarried women with births belong to 35 to 50 years age bracket with 23.3% of them unmarried.
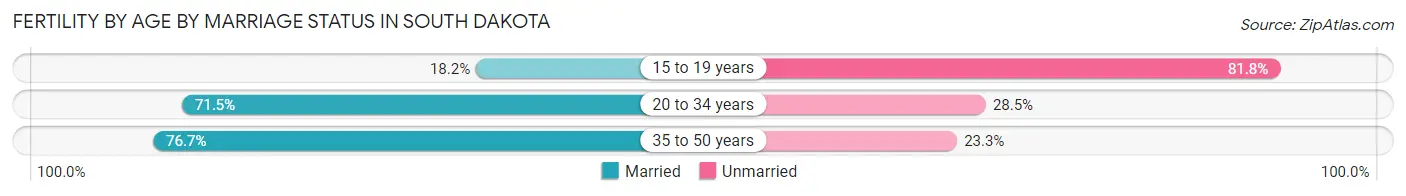
| Age Bracket | Married | Unmarried |
| 15 to 19 years | 53 (18.2%) | 238 (81.8%) |
| 20 to 34 years | 6,549 (71.5%) | 2,610 (28.5%) |
| 35 to 50 years | 2,131 (76.7%) | 647 (23.3%) |
| Total | 8,731 (71.4%) | 3,497 (28.6%) |
Fertility by Education in South Dakota
Average fertility rate in South Dakota is 64.0 births per 1,000 women. Women with the education attainment of graduate degree have the highest fertility rate of 91.0 births per 1,000 women, while women with the education attainment of less than high school have the lowest fertility at 44.0 births per 1,000 women. Women with the education attainment of college or associate's degree represent 29.8% of all women with births.
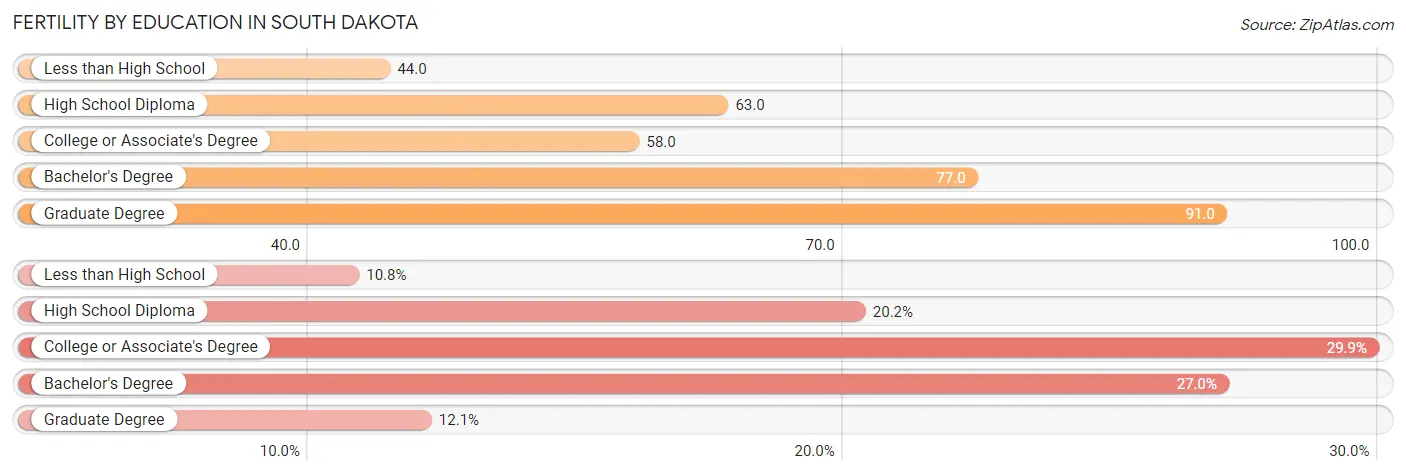
| Educational Attainment | Women with Births | Births / 1,000 Women |
| Less than High School | 1,315 (10.7%) | 44.0 |
| High School Diploma | 2,475 (20.2%) | 63.0 |
| College or Associate's Degree | 3,650 (29.8%) | 58.0 |
| Bachelor's Degree | 3,307 (27.0%) | 77.0 |
| Graduate Degree | 1,481 (12.1%) | 91.0 |
| Total | 12,228 (100.0%) | 64.0 |
Fertility by Education by Marriage Status in South Dakota
28.6% of women with births in South Dakota are unmarried. Women with the educational attainment of graduate degree are most likely to be married with 97.7% of them married at childbirth, while women with the educational attainment of less than high school are least likely to be married with 55.3% of them unmarried at childbirth.
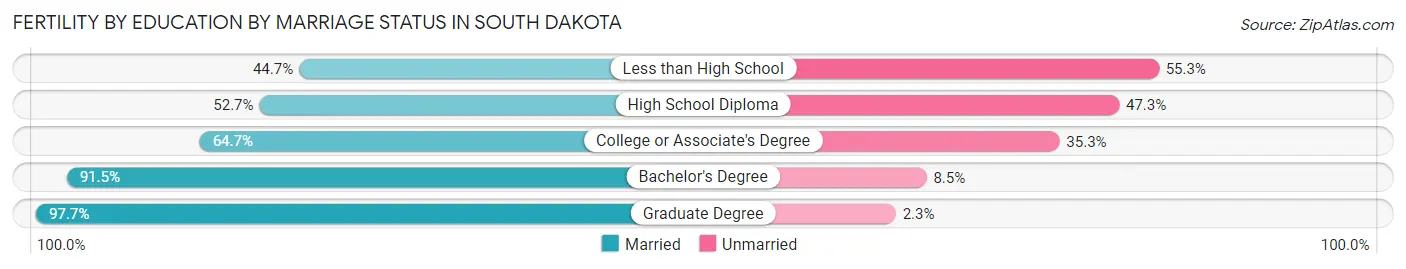
| Educational Attainment | Married | Unmarried |
| Less than High School | 588 (44.7%) | 727 (55.3%) |
| High School Diploma | 1,304 (52.7%) | 1,171 (47.3%) |
| College or Associate's Degree | 2,362 (64.7%) | 1,288 (35.3%) |
| Bachelor's Degree | 3,026 (91.5%) | 281 (8.5%) |
| Graduate Degree | 1,447 (97.7%) | 34 (2.3%) |
| Total | 8,731 (71.4%) | 3,497 (28.6%) |
Employment Characteristics in South Dakota
Employment by Class of Employer in South Dakota
Among the 449,118 employed individuals in South Dakota, private company employees (270,784 | 60.3%), not-for-profit organizations (51,114 | 11.4%), and self-employed (not incorporated) (35,232 | 7.8%) make up the most common classes of employment.
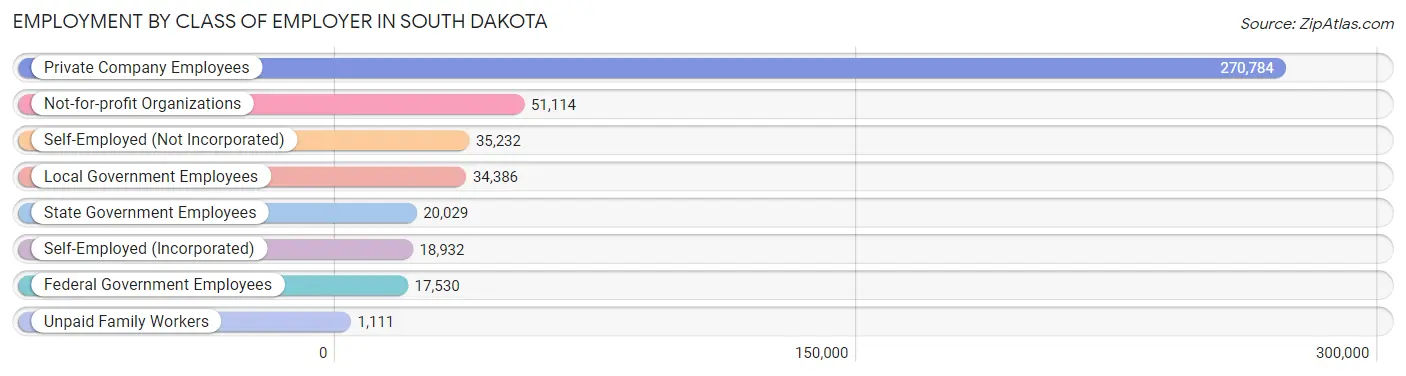
| Employer Class | # Employees | % Employees |
| Private Company Employees | 270,784 | 60.3% |
| Self-Employed (Incorporated) | 18,932 | 4.2% |
| Self-Employed (Not Incorporated) | 35,232 | 7.8% |
| Not-for-profit Organizations | 51,114 | 11.4% |
| Local Government Employees | 34,386 | 7.7% |
| State Government Employees | 20,029 | 4.5% |
| Federal Government Employees | 17,530 | 3.9% |
| Unpaid Family Workers | 1,111 | 0.3% |
| Total | 449,118 | 100.0% |
Employment Status by Age in South Dakota
According to the labor force statistics for South Dakota, out of the total population over 16 years of age (697,630), 67.6% or 471,598 individuals are in the labor force, with 3.1% or 14,620 of them unemployed. The age group with the highest labor force participation rate is 35 to 44 years, with 87.1% or 95,658 individuals in the labor force. Within the labor force, the 16 to 19 years age range has the highest percentage of unemployed individuals, with 10.7% or 2,760 of them being unemployed.
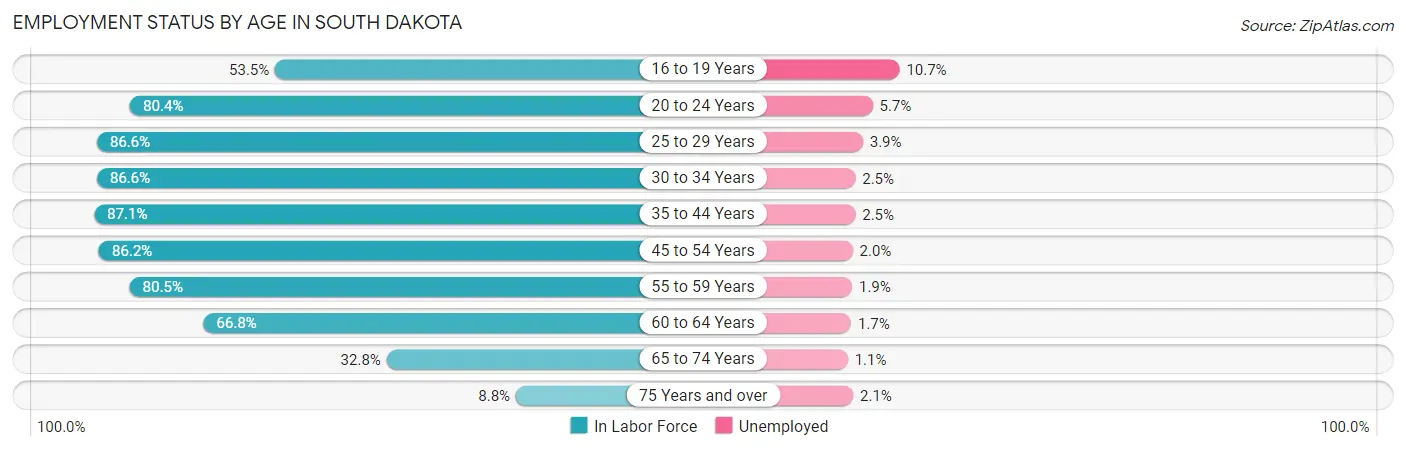
| Age Bracket | In Labor Force | Unemployed |
| 16 to 19 Years | 25,797 (53.5%) | 2,760 (10.7%) |
| 20 to 24 Years | 48,581 (80.4%) | 2,769 (5.7%) |
| 25 to 29 Years | 49,026 (86.6%) | 1,912 (3.9%) |
| 30 to 34 Years | 49,611 (86.6%) | 1,240 (2.5%) |
| 35 to 44 Years | 95,658 (87.1%) | 2,391 (2.5%) |
| 45 to 54 Years | 82,223 (86.2%) | 1,644 (2.0%) |
| 55 to 59 Years | 44,884 (80.5%) | 853 (1.9%) |
| 60 to 64 Years | 40,174 (66.8%) | 683 (1.7%) |
| 65 to 74 Years | 30,177 (32.8%) | 332 (1.1%) |
| 75 Years and over | 5,454 (8.8%) | 115 (2.1%) |
| Total | 471,598 (67.6%) | 14,620 (3.1%) |
Employment Status by Educational Attainment in South Dakota
According to labor force statistics for South Dakota, 83.1% of individuals (361,492) out of the total population between 25 and 64 years of age (435,008) are in the labor force, with 2.4% or 8,676 of them being unemployed. The group with the highest labor force participation rate are those with the educational attainment of bachelor's degree or higher, with 90.3% or 125,703 individuals in the labor force. Within the labor force, individuals with less than high school education have the highest percentage of unemployment, with 7.9% or 1,507 of them being unemployed.
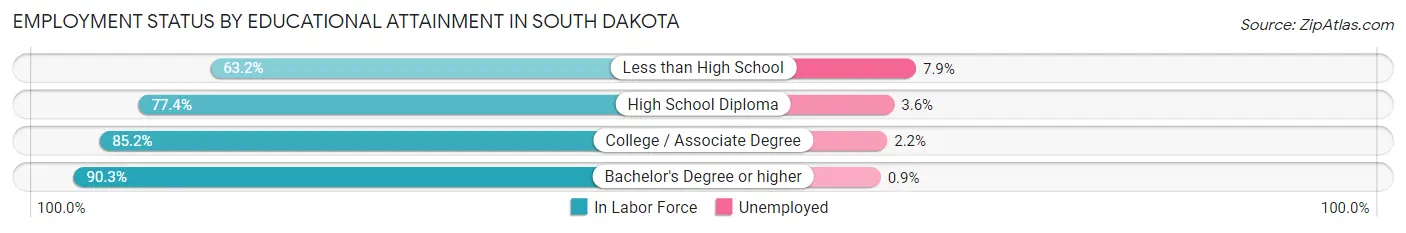
| Educational Attainment | In Labor Force | Unemployed |
| Less than High School | 19,081 (63.2%) | 2,385 (7.9%) |
| High School Diploma | 92,786 (77.4%) | 4,316 (3.6%) |
| College / Associate Degree | 124,164 (85.2%) | 3,206 (2.2%) |
| Bachelor's Degree or higher | 125,703 (90.3%) | 1,253 (0.9%) |
| Total | 361,492 (83.1%) | 10,440 (2.4%) |
Employment Occupations by Sex in South Dakota
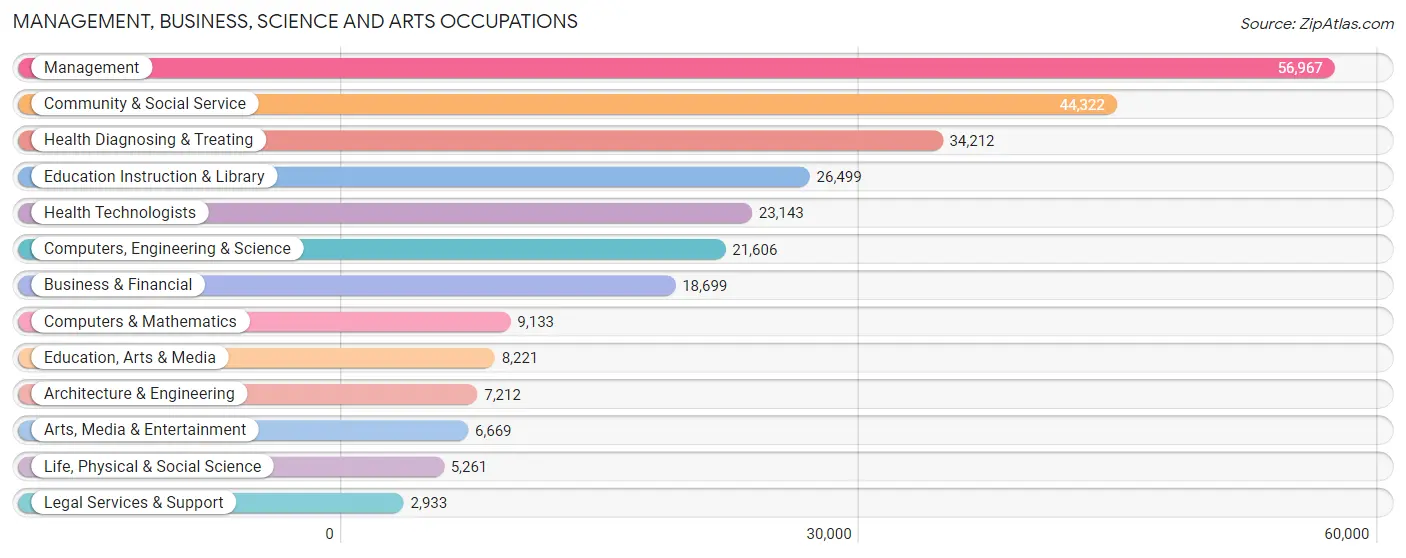
Management, Business, Science and Arts Occupations
The most common Management, Business, Science and Arts occupations in South Dakota are Management (56,967 | 12.6%), Community & Social Service (44,322 | 9.8%), Health Diagnosing & Treating (34,212 | 7.5%), Education Instruction & Library (26,499 | 5.8%), and Health Technologists (23,143 | 5.1%).
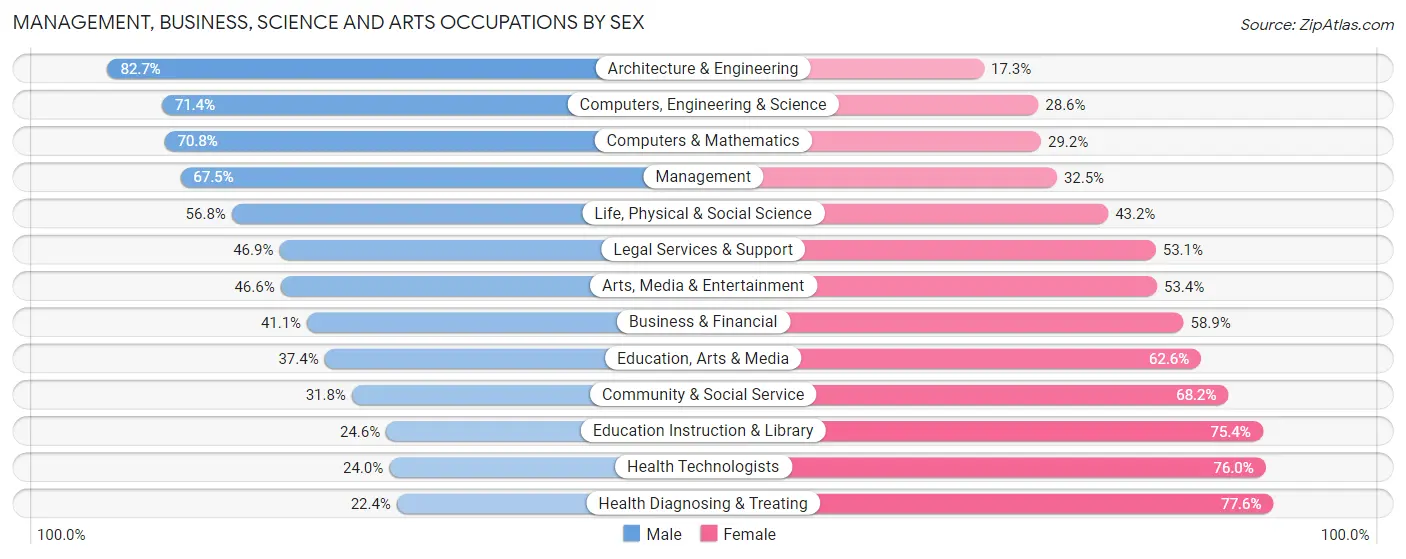
Management, Business, Science and Arts Occupations by Sex
Within the Management, Business, Science and Arts occupations in South Dakota, the most male-oriented occupations are Architecture & Engineering (82.7%), Computers, Engineering & Science (71.4%), and Computers & Mathematics (70.8%), while the most female-oriented occupations are Health Diagnosing & Treating (77.6%), Health Technologists (76.0%), and Education Instruction & Library (75.4%).
| Occupation | Male | Female |
| Management | 38,450 (67.5%) | 18,517 (32.5%) |
| Business & Financial | 7,686 (41.1%) | 11,013 (58.9%) |
| Computers, Engineering & Science | 15,422 (71.4%) | 6,184 (28.6%) |
| Computers & Mathematics | 6,468 (70.8%) | 2,665 (29.2%) |
| Architecture & Engineering | 5,965 (82.7%) | 1,247 (17.3%) |
| Life, Physical & Social Science | 2,989 (56.8%) | 2,272 (43.2%) |
| Community & Social Service | 14,082 (31.8%) | 30,240 (68.2%) |
| Education, Arts & Media | 3,078 (37.4%) | 5,143 (62.6%) |
| Legal Services & Support | 1,375 (46.9%) | 1,558 (53.1%) |
| Education Instruction & Library | 6,520 (24.6%) | 19,979 (75.4%) |
| Arts, Media & Entertainment | 3,109 (46.6%) | 3,560 (53.4%) |
| Health Diagnosing & Treating | 7,657 (22.4%) | 26,555 (77.6%) |
| Health Technologists | 5,549 (24.0%) | 17,594 (76.0%) |
| Total (Category) | 83,297 (47.4%) | 92,509 (52.6%) |
| Total (Overall) | 239,926 (52.9%) | 213,578 (47.1%) |
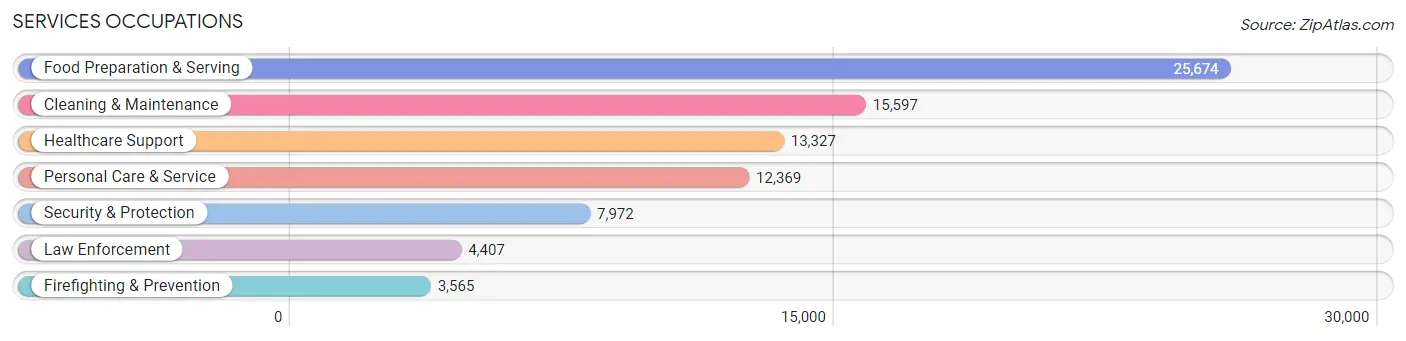
Services Occupations
The most common Services occupations in South Dakota are Food Preparation & Serving (25,674 | 5.7%), Cleaning & Maintenance (15,597 | 3.4%), Healthcare Support (13,327 | 2.9%), Personal Care & Service (12,369 | 2.7%), and Security & Protection (7,972 | 1.8%).
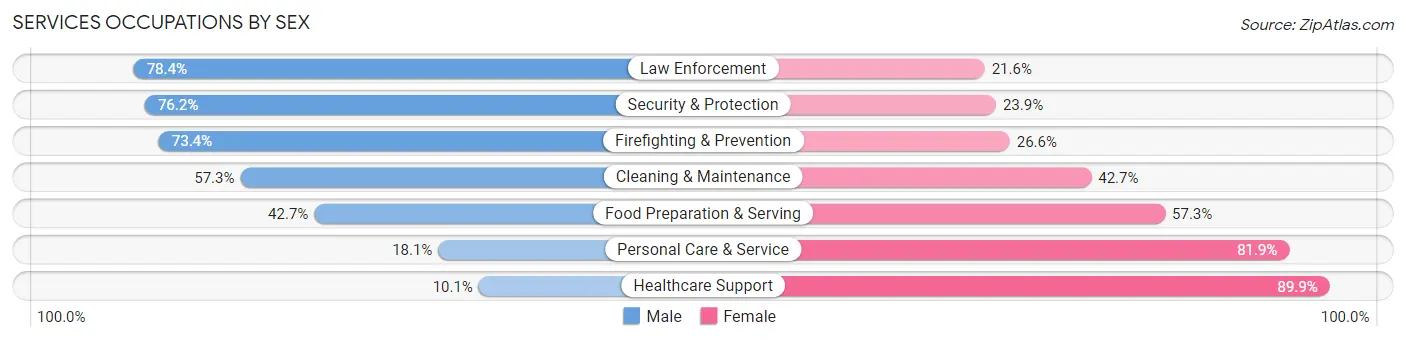
Services Occupations by Sex
Within the Services occupations in South Dakota, the most male-oriented occupations are Law Enforcement (78.4%), Security & Protection (76.1%), and Firefighting & Prevention (73.4%), while the most female-oriented occupations are Healthcare Support (89.9%), Personal Care & Service (81.9%), and Food Preparation & Serving (57.3%).
| Occupation | Male | Female |
| Healthcare Support | 1,343 (10.1%) | 11,984 (89.9%) |
| Security & Protection | 6,071 (76.1%) | 1,901 (23.8%) |
| Firefighting & Prevention | 2,617 (73.4%) | 948 (26.6%) |
| Law Enforcement | 3,454 (78.4%) | 953 (21.6%) |
| Food Preparation & Serving | 10,953 (42.7%) | 14,721 (57.3%) |
| Cleaning & Maintenance | 8,934 (57.3%) | 6,663 (42.7%) |
| Personal Care & Service | 2,239 (18.1%) | 10,130 (81.9%) |
| Total (Category) | 29,540 (39.4%) | 45,399 (60.6%) |
| Total (Overall) | 239,926 (52.9%) | 213,578 (47.1%) |
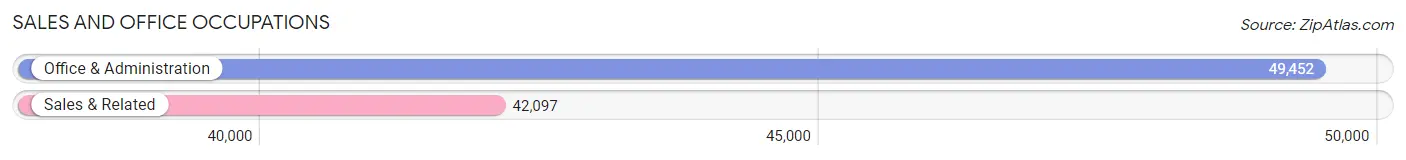
Sales and Office Occupations
The most common Sales and Office occupations in South Dakota are Office & Administration (49,452 | 10.9%), and Sales & Related (42,097 | 9.3%).
Sales and Office Occupations by Sex
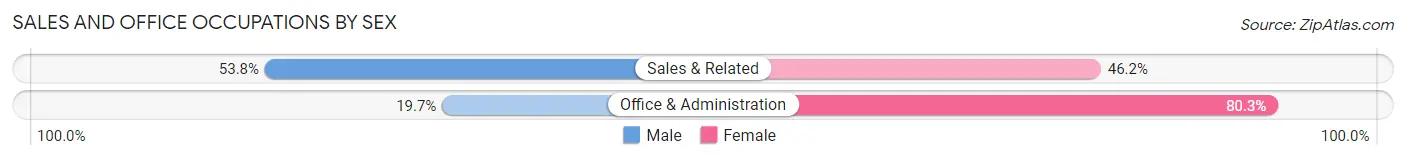
| Occupation | Male | Female |
| Sales & Related | 22,643 (53.8%) | 19,454 (46.2%) |
| Office & Administration | 9,736 (19.7%) | 39,716 (80.3%) |
| Total (Category) | 32,379 (35.4%) | 59,170 (64.6%) |
| Total (Overall) | 239,926 (52.9%) | 213,578 (47.1%) |
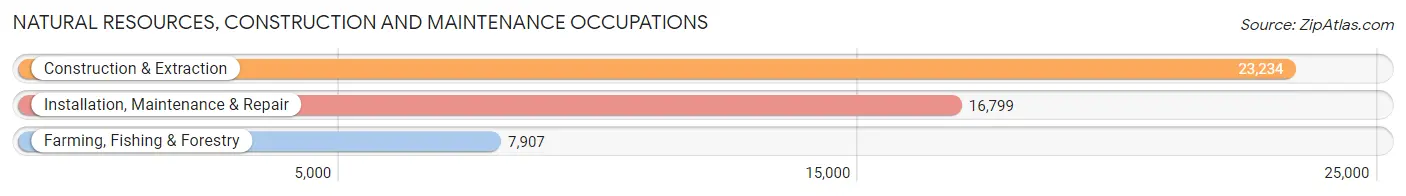
Natural Resources, Construction and Maintenance Occupations
The most common Natural Resources, Construction and Maintenance occupations in South Dakota are Construction & Extraction (23,234 | 5.1%), Installation, Maintenance & Repair (16,799 | 3.7%), and Farming, Fishing & Forestry (7,907 | 1.7%).
Natural Resources, Construction and Maintenance Occupations by Sex
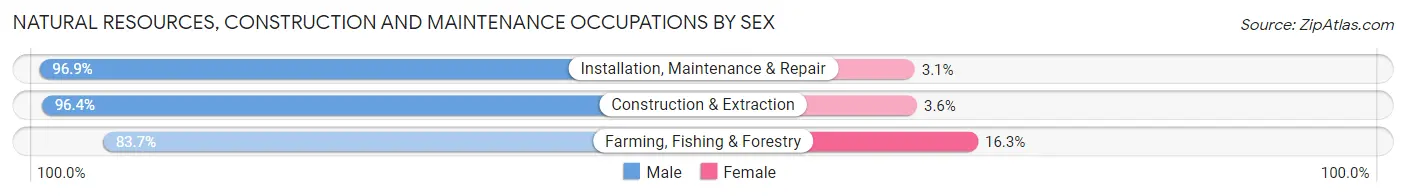
| Occupation | Male | Female |
| Farming, Fishing & Forestry | 6,621 (83.7%) | 1,286 (16.3%) |
| Construction & Extraction | 22,407 (96.4%) | 827 (3.6%) |
| Installation, Maintenance & Repair | 16,280 (96.9%) | 519 (3.1%) |
| Total (Category) | 45,308 (94.5%) | 2,632 (5.5%) |
| Total (Overall) | 239,926 (52.9%) | 213,578 (47.1%) |
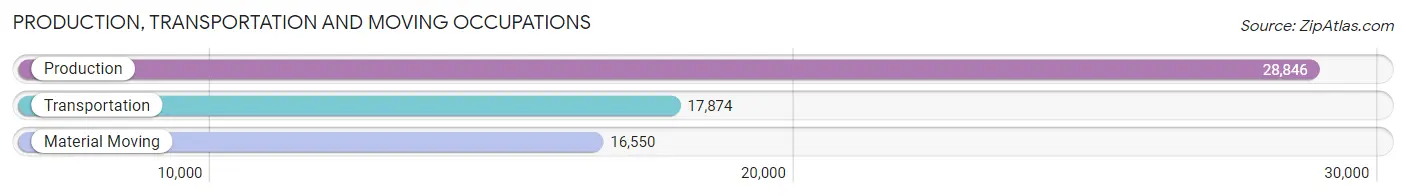
Production, Transportation and Moving Occupations
The most common Production, Transportation and Moving occupations in South Dakota are Production (28,846 | 6.4%), Transportation (17,874 | 3.9%), and Material Moving (16,550 | 3.6%).
Production, Transportation and Moving Occupations by Sex
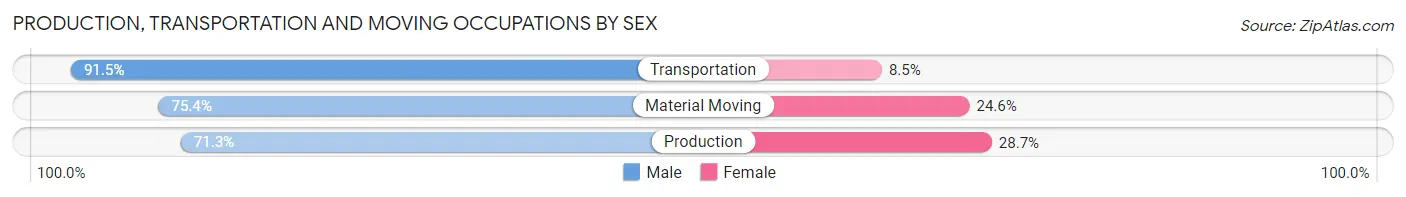
| Occupation | Male | Female |
| Production | 20,570 (71.3%) | 8,276 (28.7%) |
| Transportation | 16,351 (91.5%) | 1,523 (8.5%) |
| Material Moving | 12,481 (75.4%) | 4,069 (24.6%) |
| Total (Category) | 49,402 (78.1%) | 13,868 (21.9%) |
| Total (Overall) | 239,926 (52.9%) | 213,578 (47.1%) |
Employment Industries by Sex in South Dakota
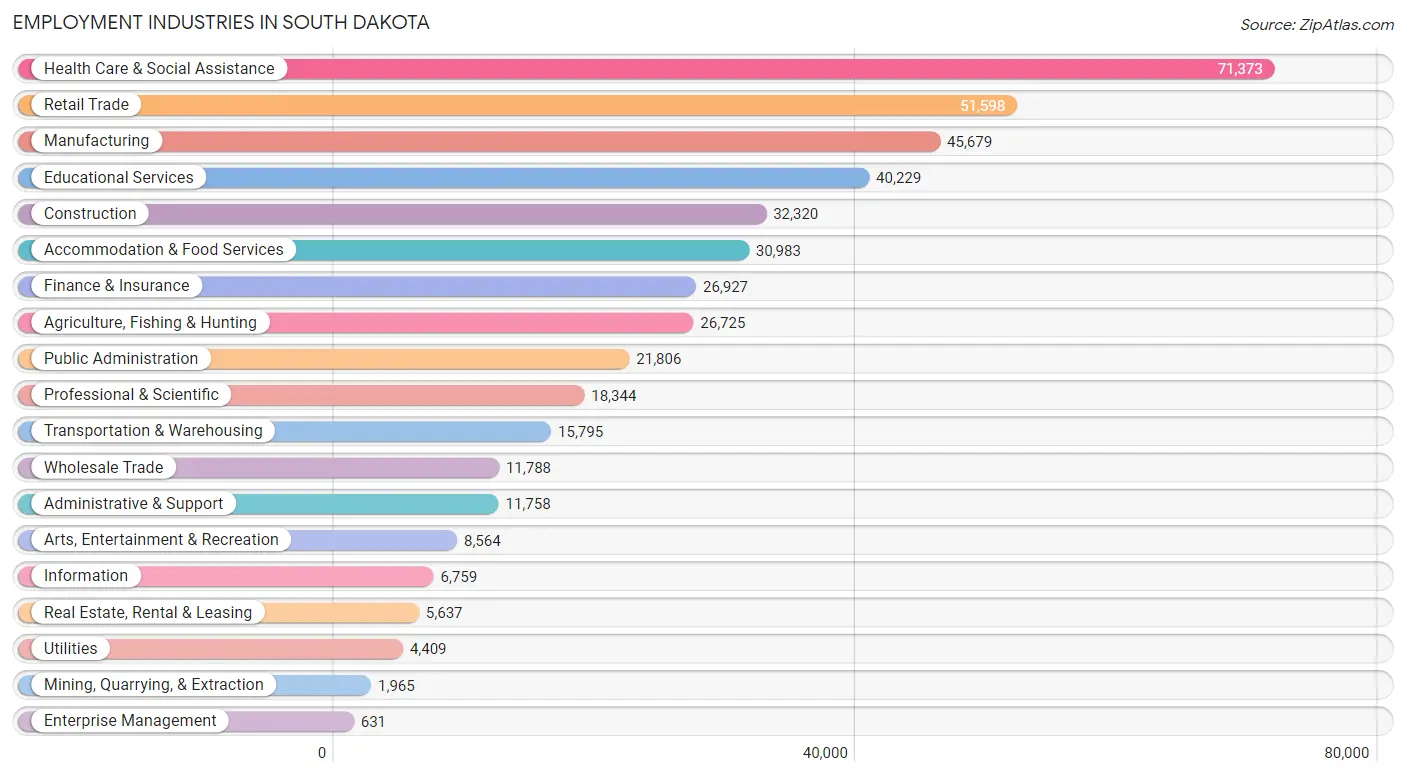
Employment Industries in South Dakota
The major employment industries in South Dakota include Health Care & Social Assistance (71,373 | 15.7%), Retail Trade (51,598 | 11.4%), Manufacturing (45,679 | 10.1%), Educational Services (40,229 | 8.9%), and Construction (32,320 | 7.1%).
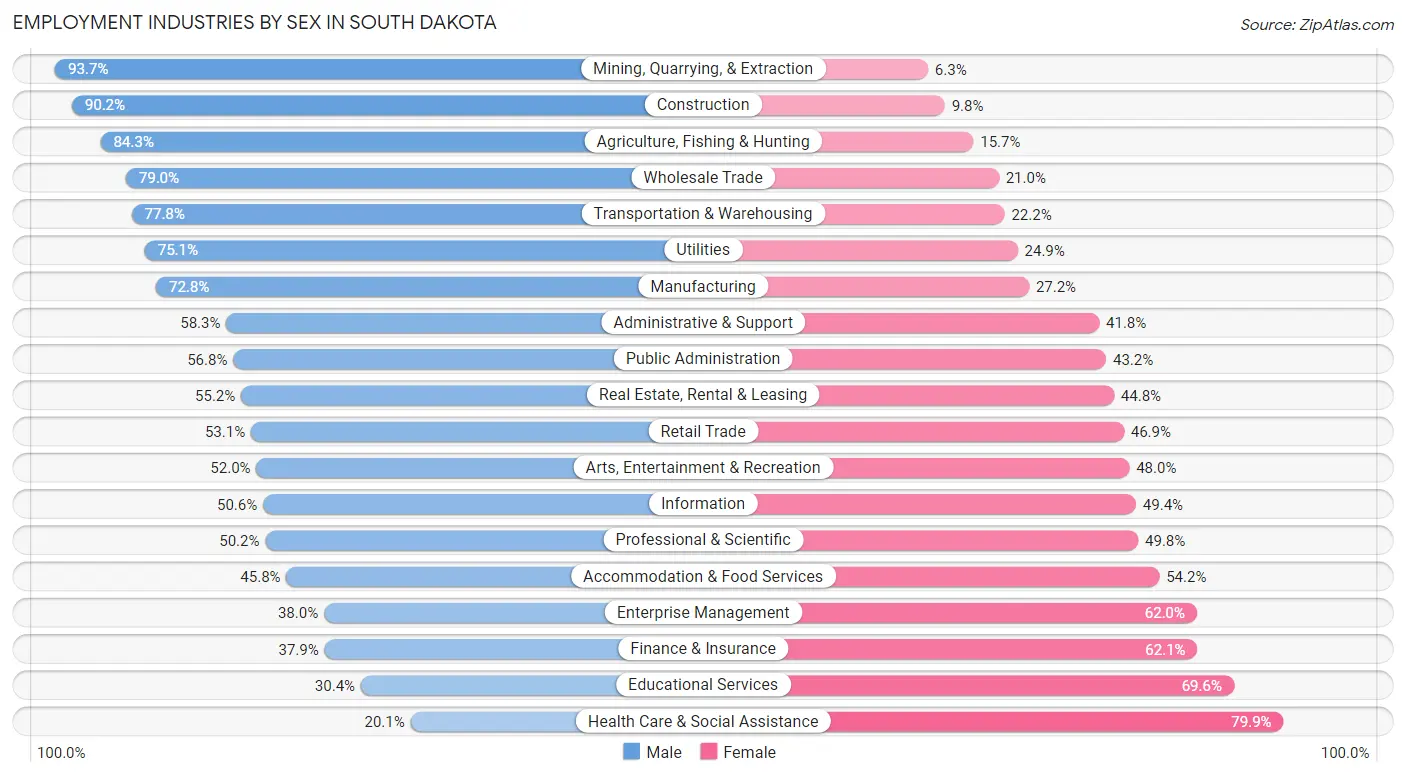
Employment Industries by Sex in South Dakota
The South Dakota industries that see more men than women are Mining, Quarrying, & Extraction (93.7%), Construction (90.2%), and Agriculture, Fishing & Hunting (84.3%), whereas the industries that tend to have a higher number of women are Health Care & Social Assistance (79.9%), Educational Services (69.6%), and Finance & Insurance (62.1%).
| Industry | Male | Female |
| Agriculture, Fishing & Hunting | 22,526 (84.3%) | 4,199 (15.7%) |
| Mining, Quarrying, & Extraction | 1,841 (93.7%) | 124 (6.3%) |
| Construction | 29,156 (90.2%) | 3,164 (9.8%) |
| Manufacturing | 33,244 (72.8%) | 12,435 (27.2%) |
| Wholesale Trade | 9,316 (79.0%) | 2,472 (21.0%) |
| Retail Trade | 27,421 (53.1%) | 24,177 (46.9%) |
| Transportation & Warehousing | 12,295 (77.8%) | 3,500 (22.2%) |
| Utilities | 3,312 (75.1%) | 1,097 (24.9%) |
| Information | 3,423 (50.6%) | 3,336 (49.4%) |
| Finance & Insurance | 10,211 (37.9%) | 16,716 (62.1%) |
| Real Estate, Rental & Leasing | 3,111 (55.2%) | 2,526 (44.8%) |
| Professional & Scientific | 9,205 (50.2%) | 9,139 (49.8%) |
| Enterprise Management | 240 (38.0%) | 391 (62.0%) |
| Administrative & Support | 6,849 (58.3%) | 4,909 (41.7%) |
| Educational Services | 12,224 (30.4%) | 28,005 (69.6%) |
| Health Care & Social Assistance | 14,352 (20.1%) | 57,021 (79.9%) |
| Arts, Entertainment & Recreation | 4,455 (52.0%) | 4,109 (48.0%) |
| Accommodation & Food Services | 14,193 (45.8%) | 16,790 (54.2%) |
| Public Administration | 12,390 (56.8%) | 9,416 (43.2%) |
| Total | 239,926 (52.9%) | 213,578 (47.1%) |
Education in South Dakota
School Enrollment in South Dakota
The most common levels of schooling among the 215,434 students in South Dakota are middle school (48,195 | 22.4%), elementary school (48,079 | 22.3%), and high school (45,658 | 21.2%).
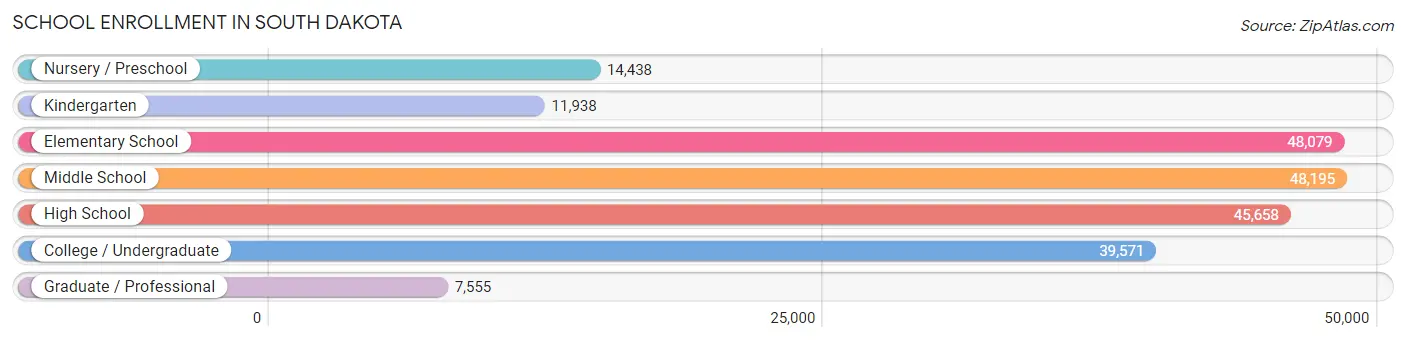
| School Level | # Students | % Students |
| Nursery / Preschool | 14,438 | 6.7% |
| Kindergarten | 11,938 | 5.5% |
| Elementary School | 48,079 | 22.3% |
| Middle School | 48,195 | 22.4% |
| High School | 45,658 | 21.2% |
| College / Undergraduate | 39,571 | 18.4% |
| Graduate / Professional | 7,555 | 3.5% |
| Total | 215,434 | 100.0% |
School Enrollment by Age by Funding Source in South Dakota
Out of a total of 215,434 students who are enrolled in schools in South Dakota, 28,222 (13.1%) attend a private institution, while the remaining 187,212 (86.9%) are enrolled in public schools. The age group of 3 to 4 year olds has the highest likelihood of being enrolled in private schools, with 2,645 (29.9% in the age bracket) enrolled. Conversely, the age group of 15 to 17 year olds has the lowest likelihood of being enrolled in a private school, with 31,083 (91.4% in the age bracket) attending a public institution.
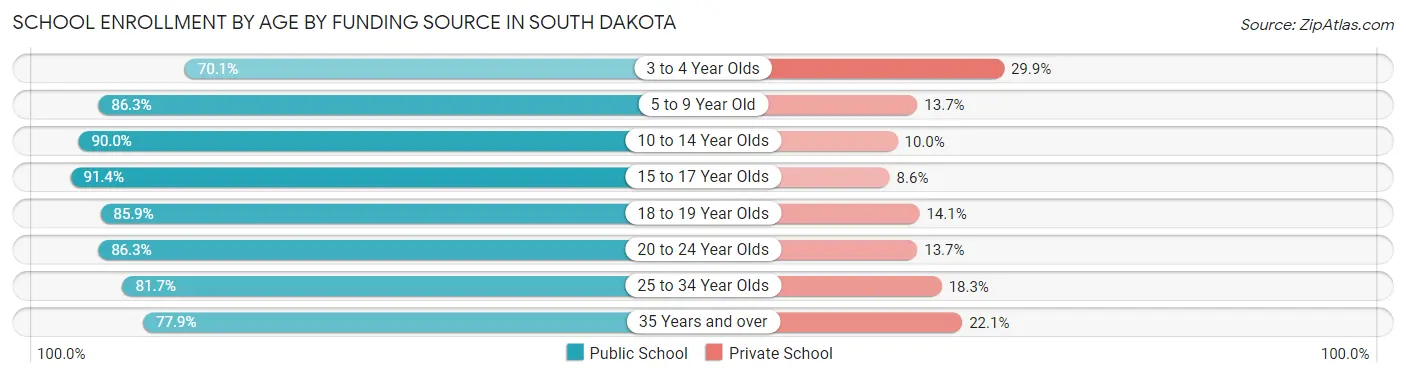
| Age Bracket | Public School | Private School |
| 3 to 4 Year Olds | 6,214 (70.1%) | 2,645 (29.9%) |
| 5 to 9 Year Old | 48,949 (86.3%) | 7,792 (13.7%) |
| 10 to 14 Year Olds | 54,337 (90.0%) | 6,067 (10.0%) |
| 15 to 17 Year Olds | 31,083 (91.4%) | 2,915 (8.6%) |
| 18 to 19 Year Olds | 15,194 (85.9%) | 2,499 (14.1%) |
| 20 to 24 Year Olds | 18,292 (86.3%) | 2,908 (13.7%) |
| 25 to 34 Year Olds | 7,142 (81.7%) | 1,595 (18.3%) |
| 35 Years and over | 6,079 (77.9%) | 1,723 (22.1%) |
| Total | 187,212 (86.9%) | 28,222 (13.1%) |
Educational Attainment by Field of Study in South Dakota
Education (36,899 | 18.8%), business (34,937 | 17.8%), science & technology (25,121 | 12.8%), bio, nature & agricultural (17,895 | 9.1%), and arts & humanities (13,870 | 7.1%) are the most common fields of study among 196,478 individuals in South Dakota who have obtained a bachelor's degree or higher.
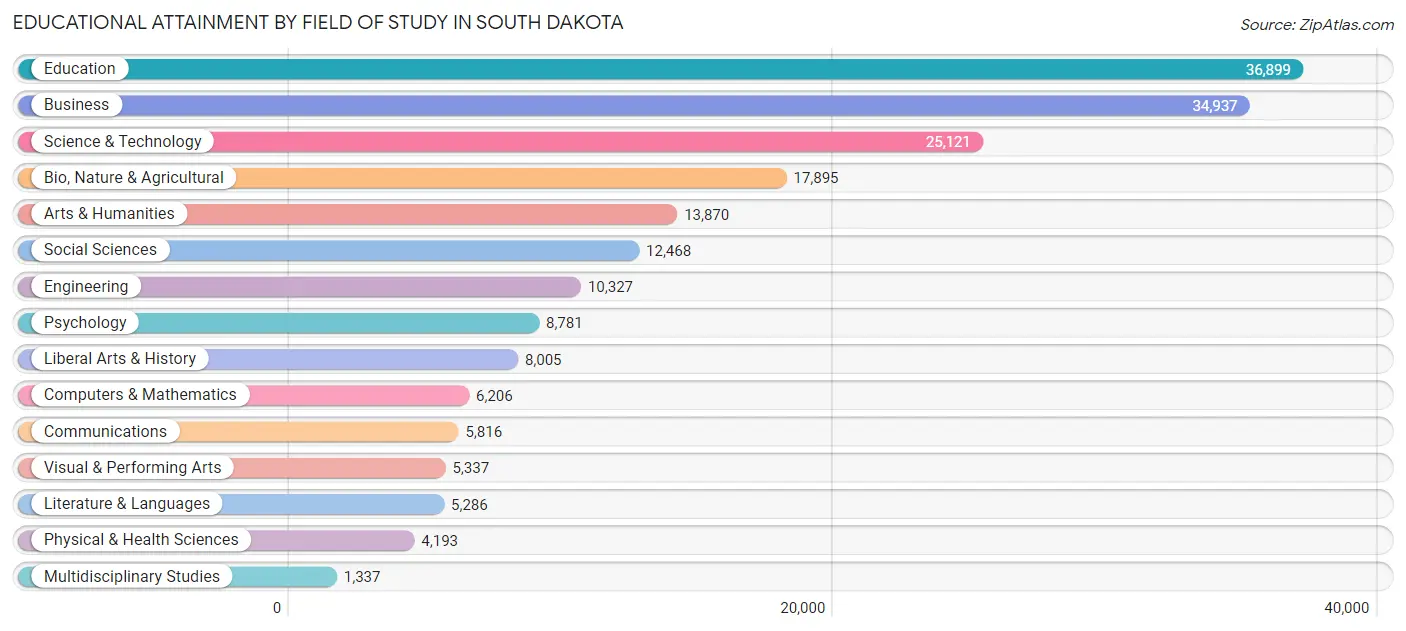
| Field of Study | # Graduates | % Graduates |
| Computers & Mathematics | 6,206 | 3.2% |
| Bio, Nature & Agricultural | 17,895 | 9.1% |
| Physical & Health Sciences | 4,193 | 2.1% |
| Psychology | 8,781 | 4.5% |
| Social Sciences | 12,468 | 6.4% |
| Engineering | 10,327 | 5.3% |
| Multidisciplinary Studies | 1,337 | 0.7% |
| Science & Technology | 25,121 | 12.8% |
| Business | 34,937 | 17.8% |
| Education | 36,899 | 18.8% |
| Literature & Languages | 5,286 | 2.7% |
| Liberal Arts & History | 8,005 | 4.1% |
| Visual & Performing Arts | 5,337 | 2.7% |
| Communications | 5,816 | 3.0% |
| Arts & Humanities | 13,870 | 7.1% |
| Total | 196,478 | 100.0% |
Transportation & Commute in South Dakota
Vehicle Availability by Sex in South Dakota
The most prevalent vehicle ownership categories in South Dakota are males with 2 vehicles (90,983, accounting for 38.7%) and females with 2 vehicles (76,467, making up 44.0%).
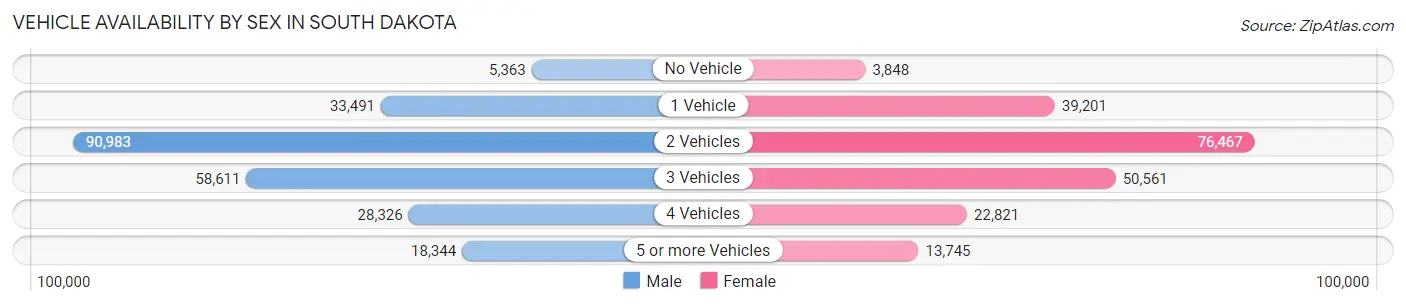
| Vehicles Available | Male | Female |
| No Vehicle | 5,363 (2.3%) | 3,848 (1.9%) |
| 1 Vehicle | 33,491 (14.2%) | 39,201 (19.0%) |
| 2 Vehicles | 90,983 (38.7%) | 76,467 (37.0%) |
| 3 Vehicles | 58,611 (24.9%) | 50,561 (24.5%) |
| 4 Vehicles | 28,326 (12.0%) | 22,821 (11.0%) |
| 5 or more Vehicles | 18,344 (7.8%) | 13,745 (6.7%) |
| Total | 235,118 (100.0%) | 206,643 (100.0%) |
Commute Time in South Dakota
The most frequently occuring commute durations in South Dakota are 10 to 14 minutes (84,265 commuters, 20.5%), 5 to 9 minutes (81,146 commuters, 19.8%), and 15 to 19 minutes (75,057 commuters, 18.3%).
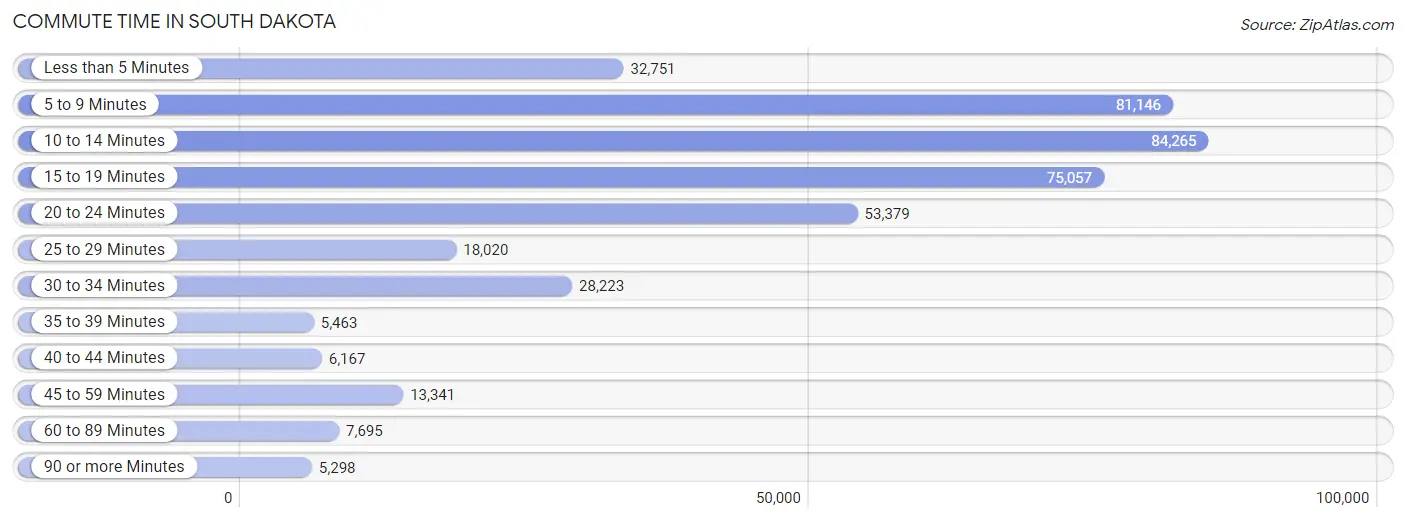
| Commute Time | # Commuters | % Commuters |
| Less than 5 Minutes | 32,751 | 8.0% |
| 5 to 9 Minutes | 81,146 | 19.8% |
| 10 to 14 Minutes | 84,265 | 20.5% |
| 15 to 19 Minutes | 75,057 | 18.3% |
| 20 to 24 Minutes | 53,379 | 13.0% |
| 25 to 29 Minutes | 18,020 | 4.4% |
| 30 to 34 Minutes | 28,223 | 6.9% |
| 35 to 39 Minutes | 5,463 | 1.3% |
| 40 to 44 Minutes | 6,167 | 1.5% |
| 45 to 59 Minutes | 13,341 | 3.3% |
| 60 to 89 Minutes | 7,695 | 1.9% |
| 90 or more Minutes | 5,298 | 1.3% |
Commute Time by Sex in South Dakota
The most common commute times in South Dakota are 10 to 14 minutes (44,340 commuters, 20.2%) for males and 5 to 9 minutes (40,789 commuters, 21.4%) for females.
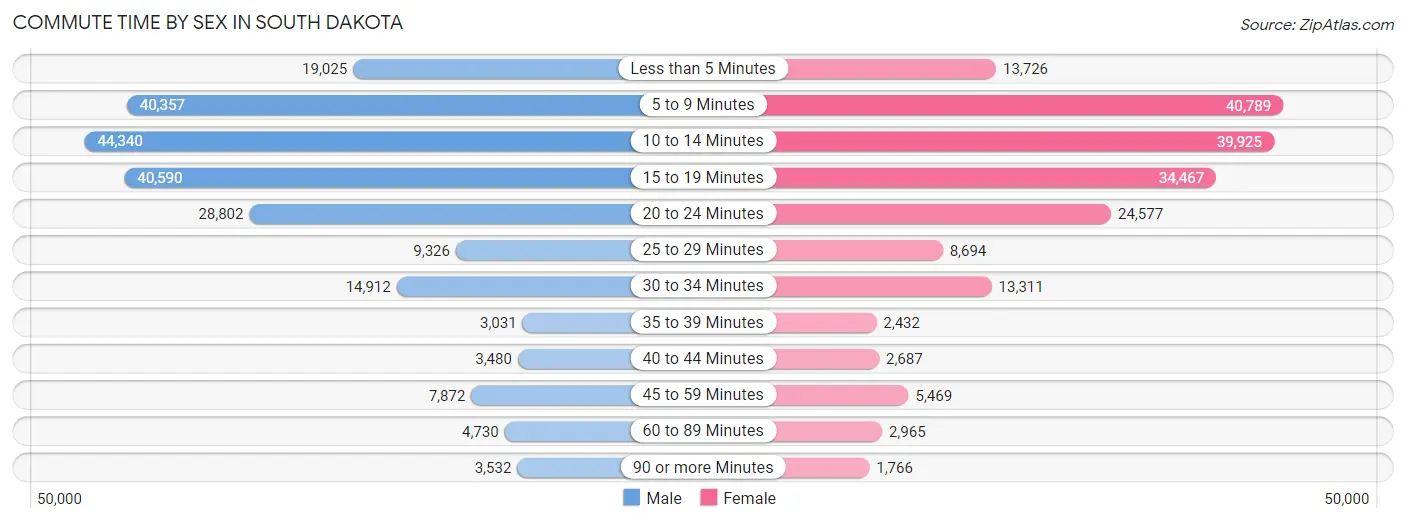
| Commute Time | Male | Female |
| Less than 5 Minutes | 19,025 (8.6%) | 13,726 (7.2%) |
| 5 to 9 Minutes | 40,357 (18.3%) | 40,789 (21.4%) |
| 10 to 14 Minutes | 44,340 (20.2%) | 39,925 (20.9%) |
| 15 to 19 Minutes | 40,590 (18.4%) | 34,467 (18.1%) |
| 20 to 24 Minutes | 28,802 (13.1%) | 24,577 (12.9%) |
| 25 to 29 Minutes | 9,326 (4.2%) | 8,694 (4.6%) |
| 30 to 34 Minutes | 14,912 (6.8%) | 13,311 (7.0%) |
| 35 to 39 Minutes | 3,031 (1.4%) | 2,432 (1.3%) |
| 40 to 44 Minutes | 3,480 (1.6%) | 2,687 (1.4%) |
| 45 to 59 Minutes | 7,872 (3.6%) | 5,469 (2.9%) |
| 60 to 89 Minutes | 4,730 (2.1%) | 2,965 (1.5%) |
| 90 or more Minutes | 3,532 (1.6%) | 1,766 (0.9%) |
Time of Departure to Work by Sex in South Dakota
The most frequent times of departure to work in South Dakota are 7:30 AM to 7:59 AM (41,490, 18.9%) for males and 7:30 AM to 7:59 AM (44,625, 23.4%) for females.
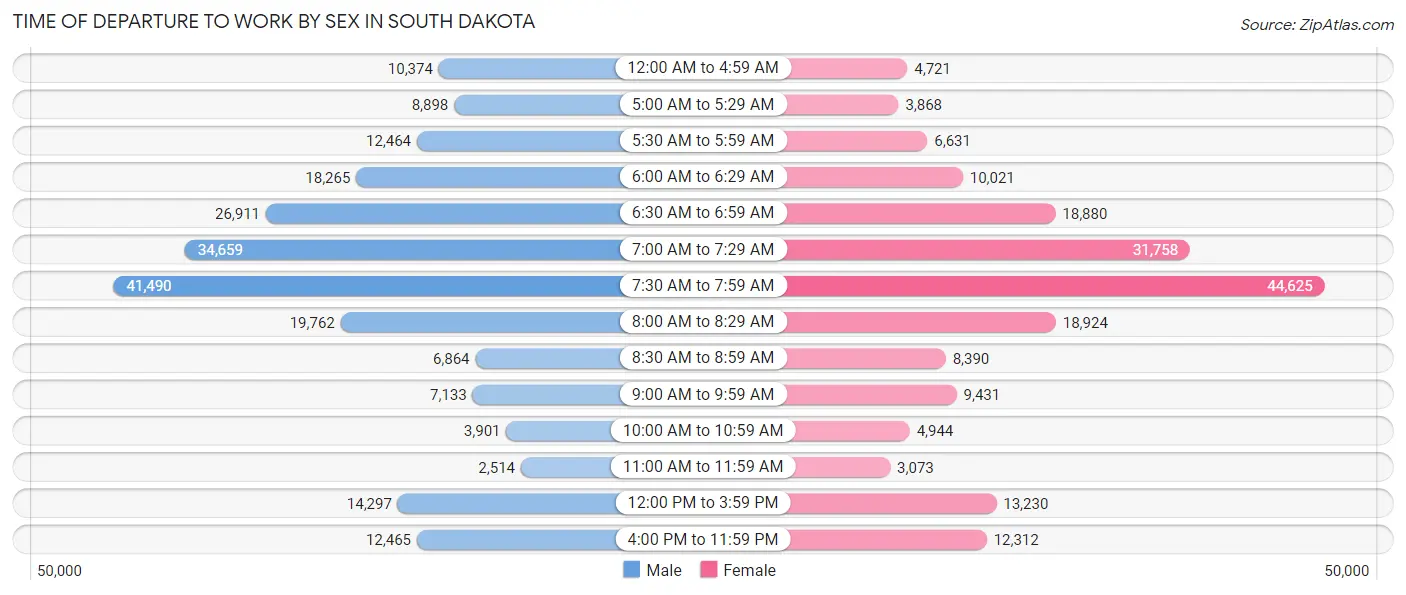
| Time of Departure | Male | Female |
| 12:00 AM to 4:59 AM | 10,374 (4.7%) | 4,721 (2.5%) |
| 5:00 AM to 5:29 AM | 8,898 (4.0%) | 3,868 (2.0%) |
| 5:30 AM to 5:59 AM | 12,464 (5.7%) | 6,631 (3.5%) |
| 6:00 AM to 6:29 AM | 18,265 (8.3%) | 10,021 (5.2%) |
| 6:30 AM to 6:59 AM | 26,911 (12.2%) | 18,880 (9.9%) |
| 7:00 AM to 7:29 AM | 34,659 (15.8%) | 31,758 (16.6%) |
| 7:30 AM to 7:59 AM | 41,490 (18.9%) | 44,625 (23.4%) |
| 8:00 AM to 8:29 AM | 19,762 (9.0%) | 18,924 (9.9%) |
| 8:30 AM to 8:59 AM | 6,864 (3.1%) | 8,390 (4.4%) |
| 9:00 AM to 9:59 AM | 7,133 (3.2%) | 9,431 (4.9%) |
| 10:00 AM to 10:59 AM | 3,901 (1.8%) | 4,944 (2.6%) |
| 11:00 AM to 11:59 AM | 2,514 (1.1%) | 3,073 (1.6%) |
| 12:00 PM to 3:59 PM | 14,297 (6.5%) | 13,230 (6.9%) |
| 4:00 PM to 11:59 PM | 12,465 (5.7%) | 12,312 (6.5%) |
| Total | 219,997 (100.0%) | 190,808 (100.0%) |
Housing Occupancy in South Dakota
Occupancy by Ownership in South Dakota
Of the total 351,182 dwellings in South Dakota, owner-occupied units account for 240,328 (68.4%), while renter-occupied units make up 110,854 (31.6%).
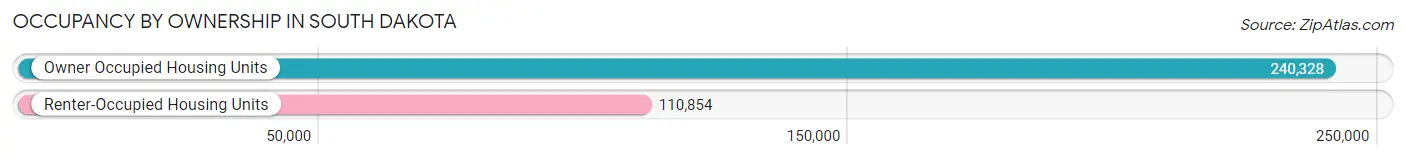
| Occupancy | # Housing Units | % Housing Units |
| Owner Occupied Housing Units | 240,328 | 68.4% |
| Renter-Occupied Housing Units | 110,854 | 31.6% |
| Total Occupied Housing Units | 351,182 | 100.0% |
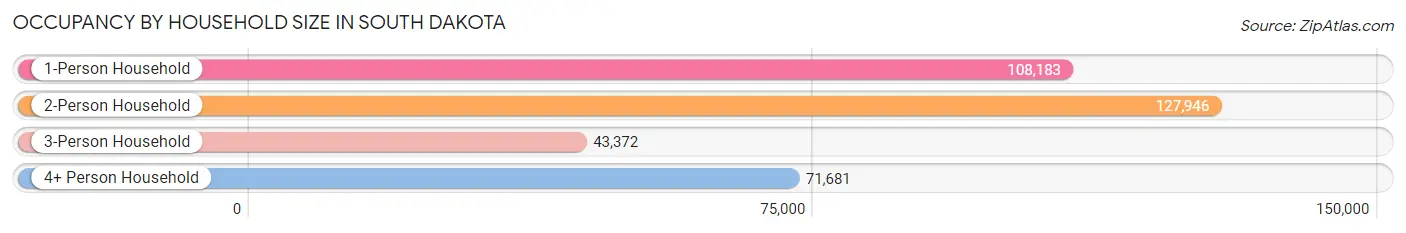
Occupancy by Household Size in South Dakota
| Household Size | # Housing Units | % Housing Units |
| 1-Person Household | 108,183 | 30.8% |
| 2-Person Household | 127,946 | 36.4% |
| 3-Person Household | 43,372 | 12.3% |
| 4+ Person Household | 71,681 | 20.4% |
| Total Housing Units | 351,182 | 100.0% |
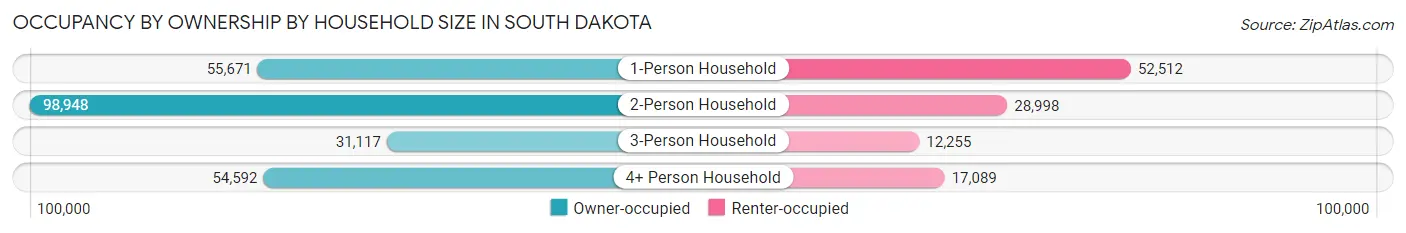
Occupancy by Ownership by Household Size in South Dakota
| Household Size | Owner-occupied | Renter-occupied |
| 1-Person Household | 55,671 (51.5%) | 52,512 (48.5%) |
| 2-Person Household | 98,948 (77.3%) | 28,998 (22.7%) |
| 3-Person Household | 31,117 (71.7%) | 12,255 (28.3%) |
| 4+ Person Household | 54,592 (76.2%) | 17,089 (23.8%) |
| Total Housing Units | 240,328 (68.4%) | 110,854 (31.6%) |
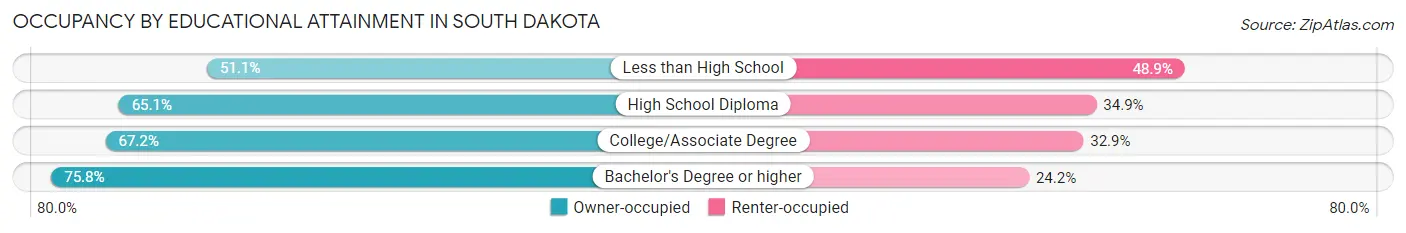
Occupancy by Educational Attainment in South Dakota
| Household Size | Owner-occupied | Renter-occupied |
| Less than High School | 10,110 (51.1%) | 9,691 (48.9%) |
| High School Diploma | 63,994 (65.1%) | 34,359 (34.9%) |
| College/Associate Degree | 80,468 (67.1%) | 39,359 (32.9%) |
| Bachelor's Degree or higher | 85,756 (75.8%) | 27,445 (24.2%) |
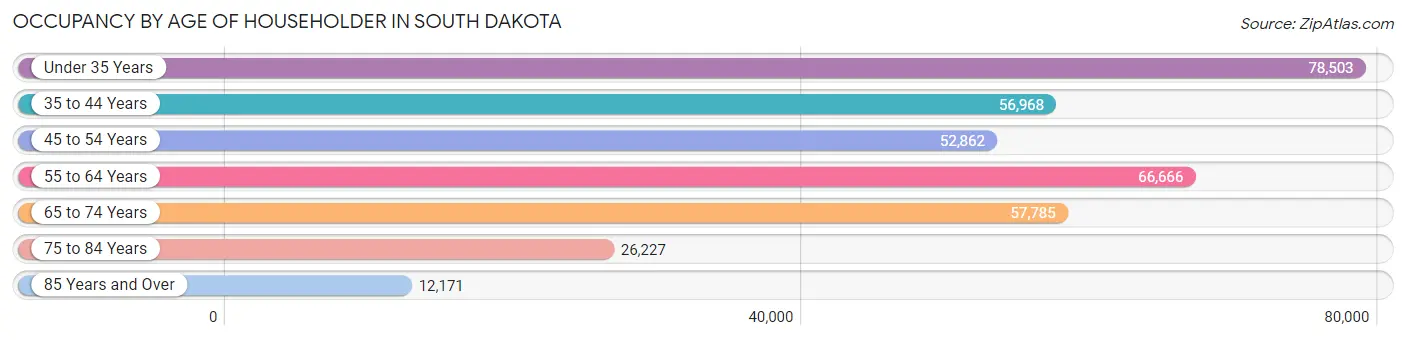
Occupancy by Age of Householder in South Dakota
| Age Bracket | # Households | % Households |
| Under 35 Years | 78,503 | 22.4% |
| 35 to 44 Years | 56,968 | 16.2% |
| 45 to 54 Years | 52,862 | 15.0% |
| 55 to 64 Years | 66,666 | 19.0% |
| 65 to 74 Years | 57,785 | 16.5% |
| 75 to 84 Years | 26,227 | 7.5% |
| 85 Years and Over | 12,171 | 3.5% |
| Total | 351,182 | 100.0% |
Housing Finances in South Dakota
Median Income by Occupancy in South Dakota
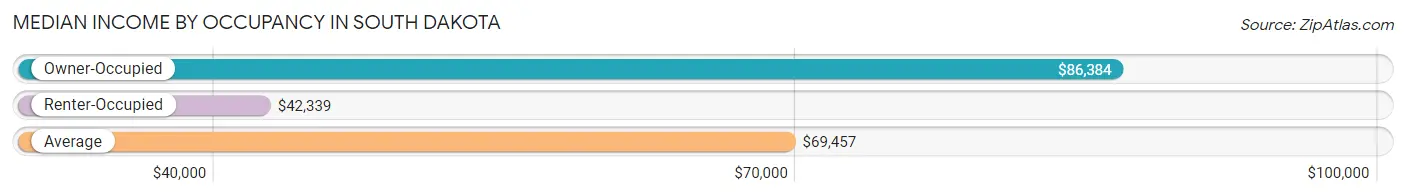
| Occupancy Type | # Households | Median Income |
| Owner-Occupied | 240,328 (68.4%) | $86,384 |
| Renter-Occupied | 110,854 (31.6%) | $42,339 |
| Average | 351,182 (100.0%) | $69,457 |
Occupancy by Householder Income Bracket in South Dakota
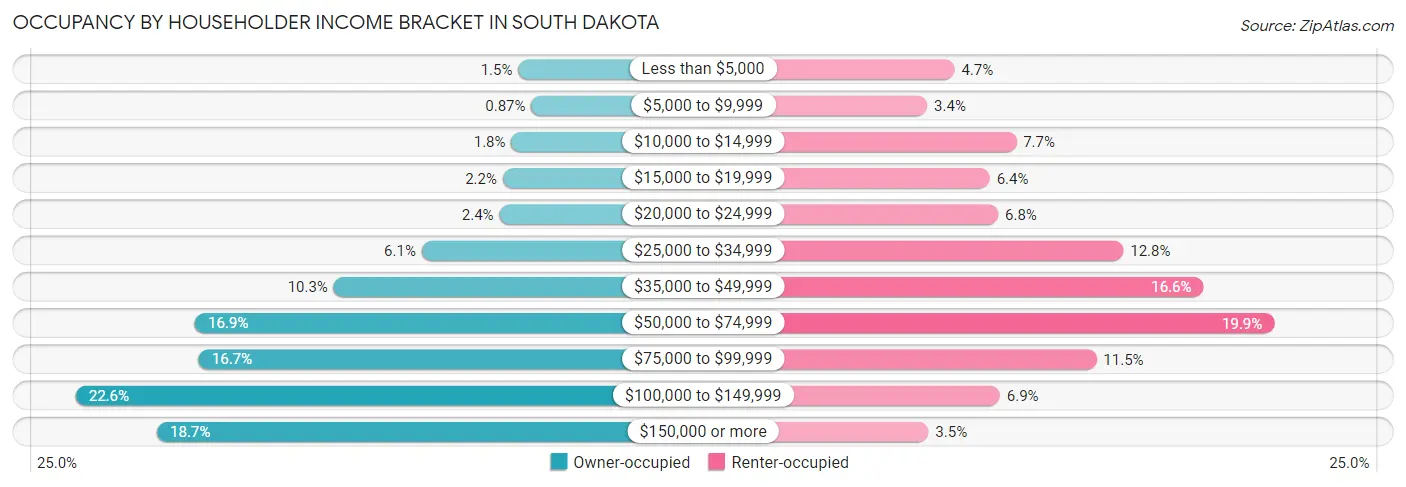
| Income Bracket | Owner-occupied | Renter-occupied |
| Less than $5,000 | 3,592 (1.5%) | 5,223 (4.7%) |
| $5,000 to $9,999 | 2,092 (0.9%) | 3,783 (3.4%) |
| $10,000 to $14,999 | 4,377 (1.8%) | 8,478 (7.6%) |
| $15,000 to $19,999 | 5,370 (2.2%) | 7,082 (6.4%) |
| $20,000 to $24,999 | 5,737 (2.4%) | 7,528 (6.8%) |
| $25,000 to $34,999 | 14,626 (6.1%) | 14,133 (12.8%) |
| $35,000 to $49,999 | 24,699 (10.3%) | 18,352 (16.6%) |
| $50,000 to $74,999 | 40,567 (16.9%) | 22,097 (19.9%) |
| $75,000 to $99,999 | 40,131 (16.7%) | 12,710 (11.5%) |
| $100,000 to $149,999 | 54,224 (22.6%) | 7,620 (6.9%) |
| $150,000 or more | 44,913 (18.7%) | 3,848 (3.5%) |
| Total | 240,328 (100.0%) | 110,854 (100.0%) |
Monthly Housing Cost Tiers in South Dakota
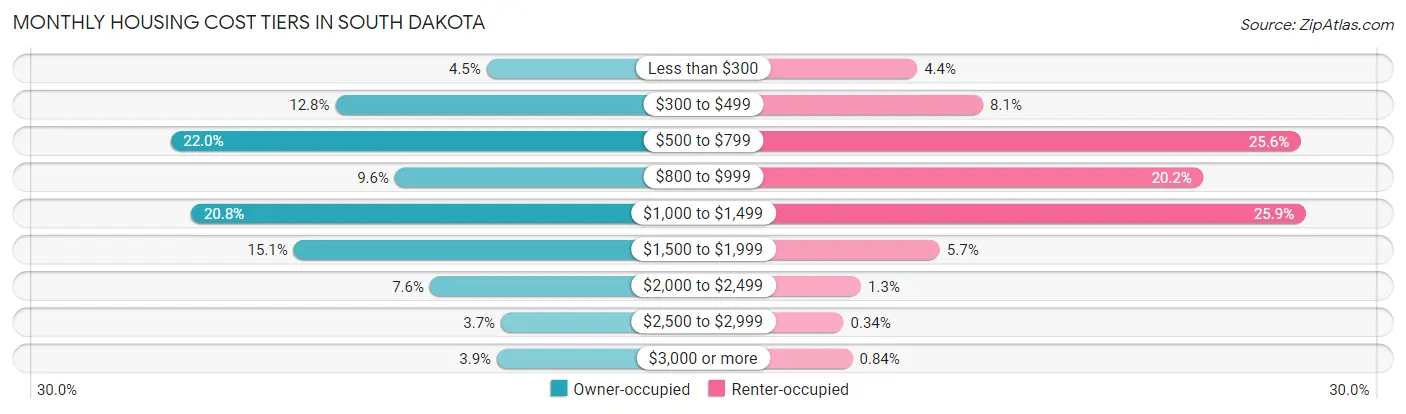
| Monthly Cost | Owner-occupied | Renter-occupied |
| Less than $300 | 10,763 (4.5%) | 4,884 (4.4%) |
| $300 to $499 | 30,856 (12.8%) | 8,926 (8.1%) |
| $500 to $799 | 52,764 (22.0%) | 28,393 (25.6%) |
| $800 to $999 | 22,948 (9.6%) | 22,423 (20.2%) |
| $1,000 to $1,499 | 50,015 (20.8%) | 28,691 (25.9%) |
| $1,500 to $1,999 | 36,390 (15.1%) | 6,273 (5.7%) |
| $2,000 to $2,499 | 18,322 (7.6%) | 1,447 (1.3%) |
| $2,500 to $2,999 | 8,878 (3.7%) | 373 (0.3%) |
| $3,000 or more | 9,392 (3.9%) | 930 (0.8%) |
| Total | 240,328 (100.0%) | 110,854 (100.0%) |
Physical Housing Characteristics in South Dakota
Housing Structures in South Dakota
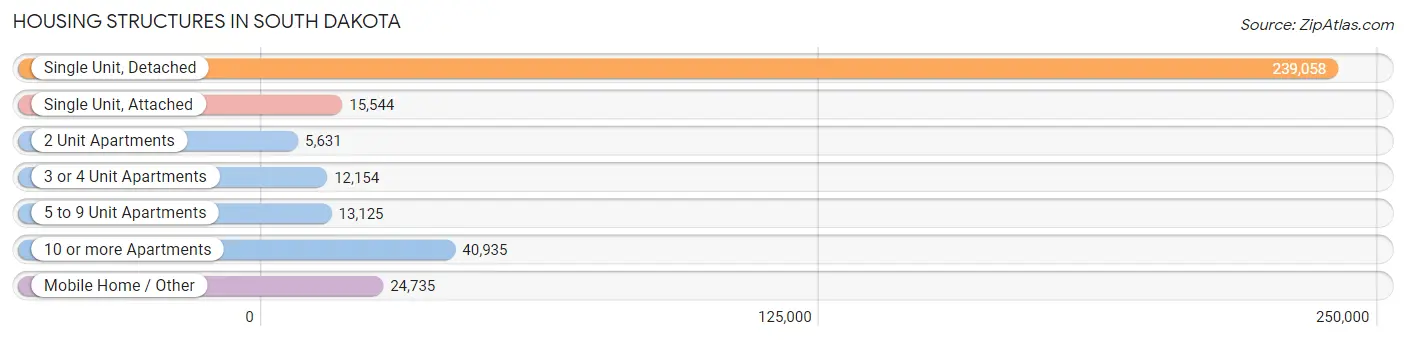
| Structure Type | # Housing Units | % Housing Units |
| Single Unit, Detached | 239,058 | 68.1% |
| Single Unit, Attached | 15,544 | 4.4% |
| 2 Unit Apartments | 5,631 | 1.6% |
| 3 or 4 Unit Apartments | 12,154 | 3.5% |
| 5 to 9 Unit Apartments | 13,125 | 3.7% |
| 10 or more Apartments | 40,935 | 11.7% |
| Mobile Home / Other | 24,735 | 7.0% |
| Total | 351,182 | 100.0% |
Housing Structures by Occupancy in South Dakota
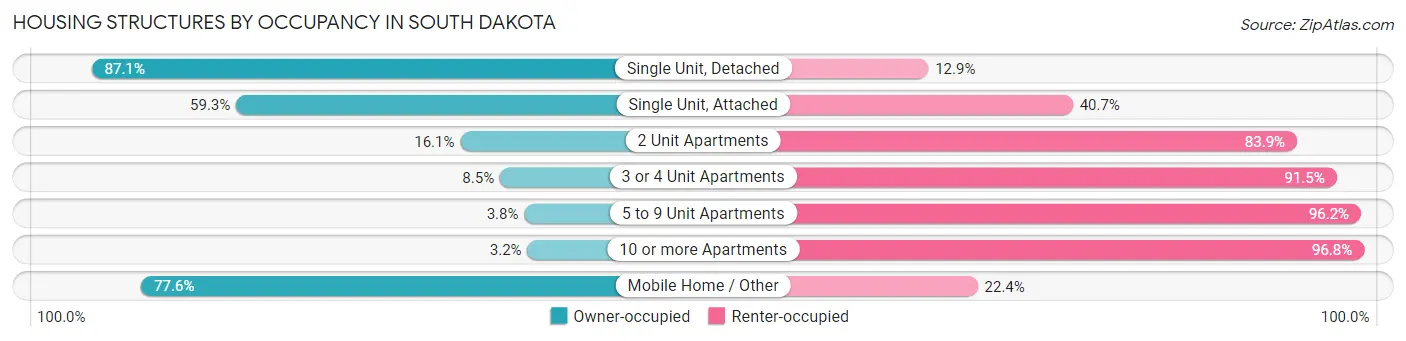
| Structure Type | Owner-occupied | Renter-occupied |
| Single Unit, Detached | 208,186 (87.1%) | 30,872 (12.9%) |
| Single Unit, Attached | 9,213 (59.3%) | 6,331 (40.7%) |
| 2 Unit Apartments | 907 (16.1%) | 4,724 (83.9%) |
| 3 or 4 Unit Apartments | 1,030 (8.5%) | 11,124 (91.5%) |
| 5 to 9 Unit Apartments | 496 (3.8%) | 12,629 (96.2%) |
| 10 or more Apartments | 1,306 (3.2%) | 39,629 (96.8%) |
| Mobile Home / Other | 19,190 (77.6%) | 5,545 (22.4%) |
| Total | 240,328 (68.4%) | 110,854 (31.6%) |
Housing Structures by Number of Rooms in South Dakota
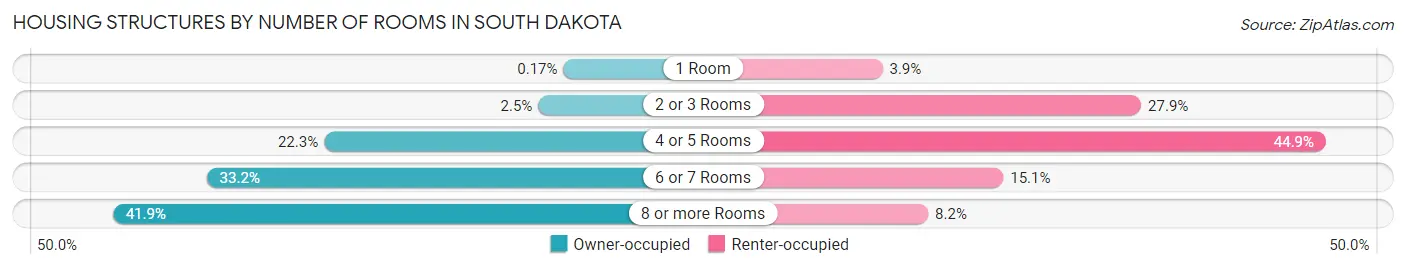
| Number of Rooms | Owner-occupied | Renter-occupied |
| 1 Room | 417 (0.2%) | 4,363 (3.9%) |
| 2 or 3 Rooms | 6,020 (2.5%) | 30,885 (27.9%) |
| 4 or 5 Rooms | 53,626 (22.3%) | 49,814 (44.9%) |
| 6 or 7 Rooms | 79,697 (33.2%) | 16,745 (15.1%) |
| 8 or more Rooms | 100,568 (41.8%) | 9,047 (8.2%) |
| Total | 240,328 (100.0%) | 110,854 (100.0%) |
Housing Structure by Heating Type in South Dakota
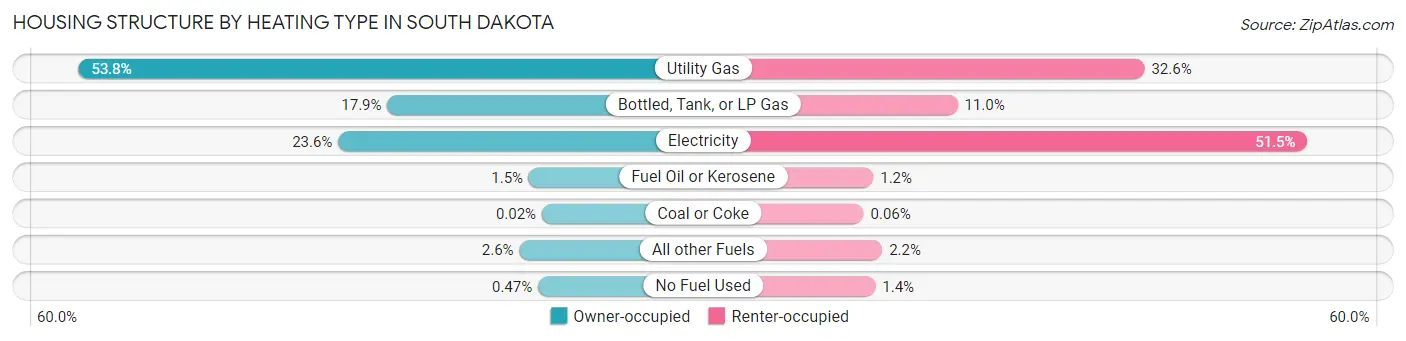
| Heating Type | Owner-occupied | Renter-occupied |
| Utility Gas | 129,219 (53.8%) | 36,170 (32.6%) |
| Bottled, Tank, or LP Gas | 43,114 (17.9%) | 12,155 (11.0%) |
| Electricity | 56,809 (23.6%) | 57,097 (51.5%) |
| Fuel Oil or Kerosene | 3,673 (1.5%) | 1,323 (1.2%) |
| Coal or Coke | 54 (0.0%) | 64 (0.1%) |
| All other Fuels | 6,323 (2.6%) | 2,459 (2.2%) |
| No Fuel Used | 1,136 (0.5%) | 1,586 (1.4%) |
| Total | 240,328 (100.0%) | 110,854 (100.0%) |
Household Vehicle Usage in South Dakota
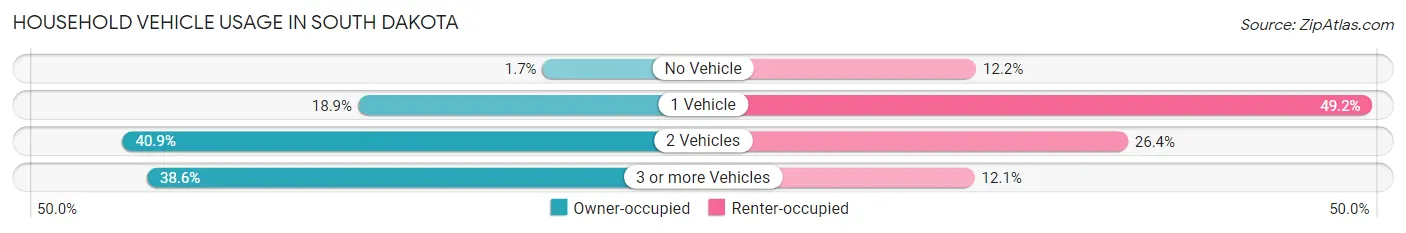
| Vehicles per Household | Owner-occupied | Renter-occupied |
| No Vehicle | 3,985 (1.7%) | 13,571 (12.2%) |
| 1 Vehicle | 45,406 (18.9%) | 54,581 (49.2%) |
| 2 Vehicles | 98,210 (40.9%) | 29,277 (26.4%) |
| 3 or more Vehicles | 92,727 (38.6%) | 13,425 (12.1%) |
| Total | 240,328 (100.0%) | 110,854 (100.0%) |
Real Estate & Mortgages in South Dakota
Real Estate and Mortgage Overview in South Dakota
| Characteristic | Without Mortgage | With Mortgage |
| Housing Units | 108,500 | 131,828 |
| Median Property Value | $185,700 | $240,300 |
| Median Household Income | $68,430 | $29,313 |
| Monthly Housing Costs | $571 | $9,268 |
| Real Estate Taxes | $2,191 | $2,704 |
Property Value by Mortgage Status in South Dakota
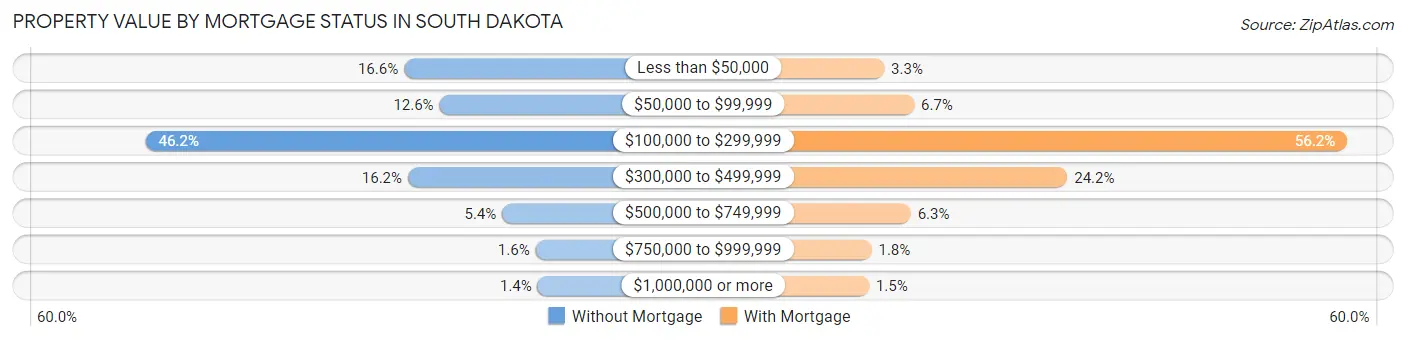
| Property Value | Without Mortgage | With Mortgage |
| Less than $50,000 | 18,054 (16.6%) | 4,307 (3.3%) |
| $50,000 to $99,999 | 13,662 (12.6%) | 8,821 (6.7%) |
| $100,000 to $299,999 | 50,090 (46.2%) | 74,056 (56.2%) |
| $300,000 to $499,999 | 17,580 (16.2%) | 31,902 (24.2%) |
| $500,000 to $749,999 | 5,887 (5.4%) | 8,312 (6.3%) |
| $750,000 to $999,999 | 1,745 (1.6%) | 2,410 (1.8%) |
| $1,000,000 or more | 1,482 (1.4%) | 2,020 (1.5%) |
| Total | 108,500 (100.0%) | 131,828 (100.0%) |
Household Income by Mortgage Status in South Dakota
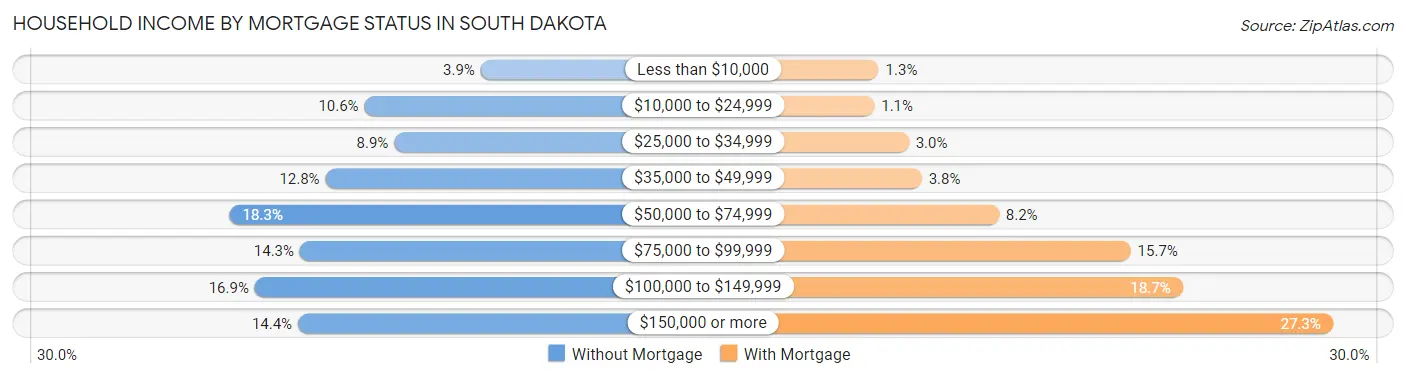
| Household Income | Without Mortgage | With Mortgage |
| Less than $10,000 | 4,273 (3.9%) | 1,737 (1.3%) |
| $10,000 to $24,999 | 11,480 (10.6%) | 1,411 (1.1%) |
| $25,000 to $34,999 | 9,637 (8.9%) | 4,004 (3.0%) |
| $35,000 to $49,999 | 13,901 (12.8%) | 4,989 (3.8%) |
| $50,000 to $74,999 | 19,841 (18.3%) | 10,798 (8.2%) |
| $75,000 to $99,999 | 15,488 (14.3%) | 20,726 (15.7%) |
| $100,000 to $149,999 | 18,280 (16.9%) | 24,643 (18.7%) |
| $150,000 or more | 15,600 (14.4%) | 35,944 (27.3%) |
| Total | 108,500 (100.0%) | 131,828 (100.0%) |
Property Value to Household Income Ratio in South Dakota
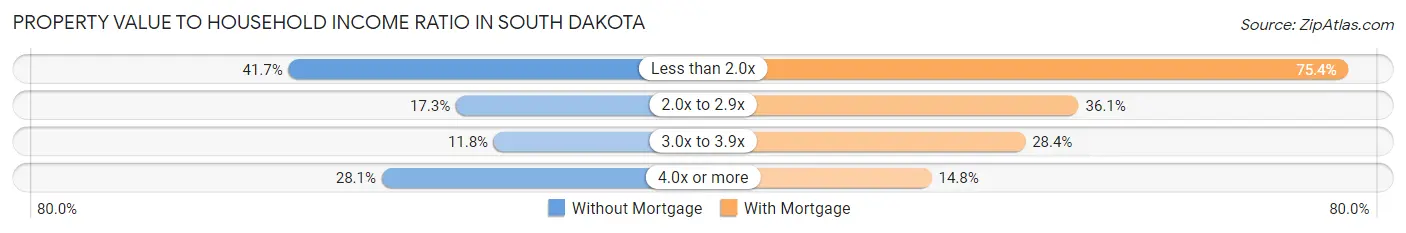
| Value-to-Income Ratio | Without Mortgage | With Mortgage |
| Less than 2.0x | 45,194 (41.6%) | 99,338 (75.3%) |
| 2.0x to 2.9x | 18,783 (17.3%) | 47,631 (36.1%) |
| 3.0x to 3.9x | 12,814 (11.8%) | 37,402 (28.4%) |
| 4.0x or more | 30,493 (28.1%) | 19,455 (14.8%) |
| Total | 108,500 (100.0%) | 131,828 (100.0%) |
Real Estate Taxes by Mortgage Status in South Dakota
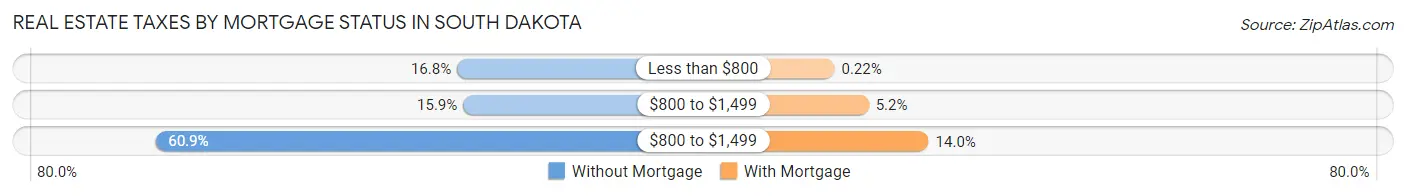
| Property Taxes | Without Mortgage | With Mortgage |
| Less than $800 | 18,247 (16.8%) | 289 (0.2%) |
| $800 to $1,499 | 17,282 (15.9%) | 6,865 (5.2%) |
| $800 to $1,499 | 66,079 (60.9%) | 18,410 (14.0%) |
| Total | 108,500 (100.0%) | 131,828 (100.0%) |
Health & Disability in South Dakota
Health Insurance Coverage by Age in South Dakota
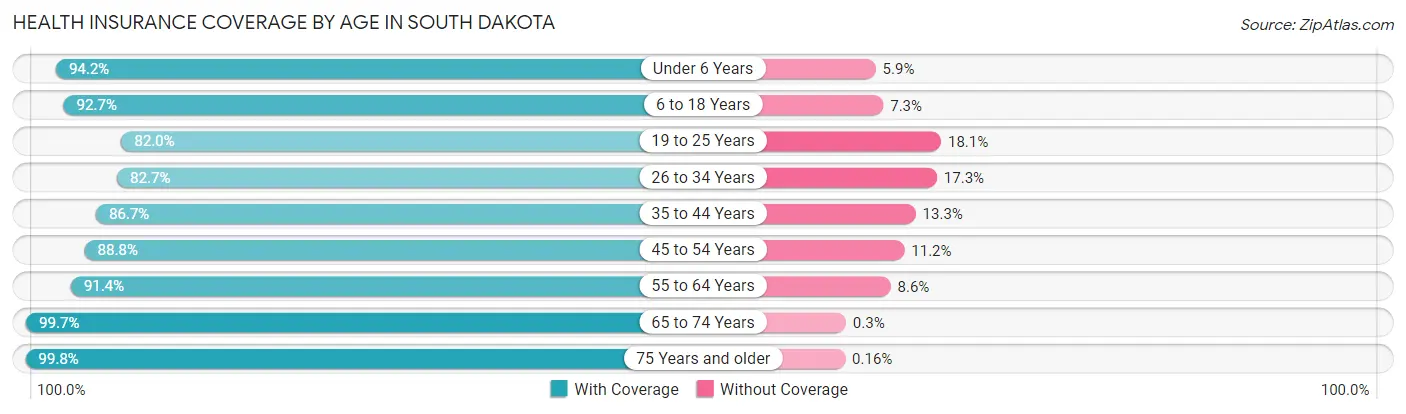
| Age Bracket | With Coverage | Without Coverage |
| Under 6 Years | 65,990 (94.2%) | 4,099 (5.9%) |
| 6 to 18 Years | 146,211 (92.7%) | 11,456 (7.3%) |
| 19 to 25 Years | 66,356 (82.0%) | 14,616 (18.0%) |
| 26 to 34 Years | 82,690 (82.7%) | 17,256 (17.3%) |
| 35 to 44 Years | 92,825 (86.7%) | 14,246 (13.3%) |
| 45 to 54 Years | 83,372 (88.8%) | 10,514 (11.2%) |
| 55 to 64 Years | 104,989 (91.4%) | 9,911 (8.6%) |
| 65 to 74 Years | 90,439 (99.7%) | 274 (0.3%) |
| 75 Years and older | 55,717 (99.8%) | 91 (0.2%) |
| Total | 788,589 (90.5%) | 82,463 (9.5%) |
Health Insurance Coverage by Citizenship Status in South Dakota
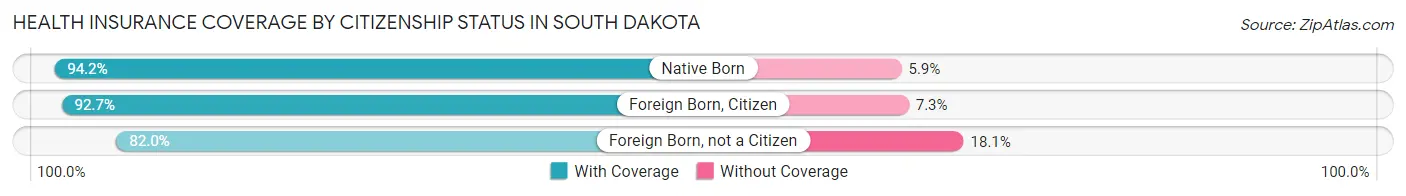
| Citizenship Status | With Coverage | Without Coverage |
| Native Born | 65,990 (94.2%) | 4,099 (5.9%) |
| Foreign Born, Citizen | 146,211 (92.7%) | 11,456 (7.3%) |
| Foreign Born, not a Citizen | 66,356 (82.0%) | 14,616 (18.0%) |
Health Insurance Coverage by Household Income in South Dakota
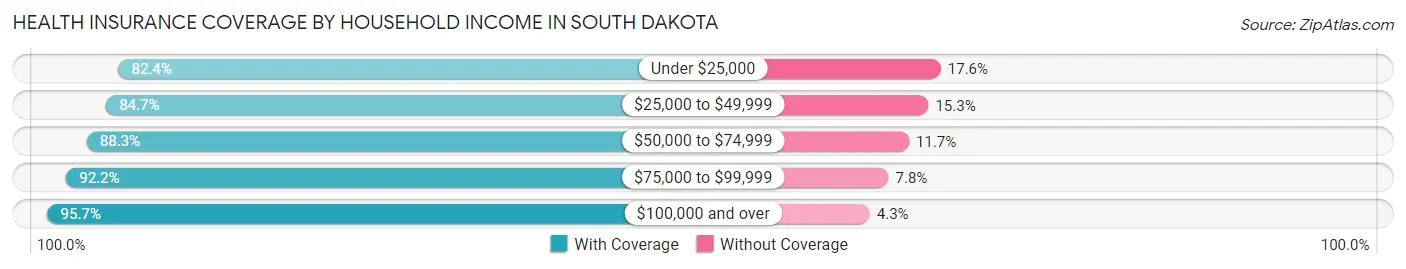
| Household Income | With Coverage | Without Coverage |
| Under $25,000 | 76,546 (82.4%) | 16,368 (17.6%) |
| $25,000 to $49,999 | 118,326 (84.7%) | 21,375 (15.3%) |
| $50,000 to $74,999 | 127,110 (88.3%) | 16,787 (11.7%) |
| $75,000 to $99,999 | 127,819 (92.2%) | 10,860 (7.8%) |
| $100,000 and over | 325,427 (95.7%) | 14,710 (4.3%) |
Public vs Private Health Insurance Coverage by Age in South Dakota
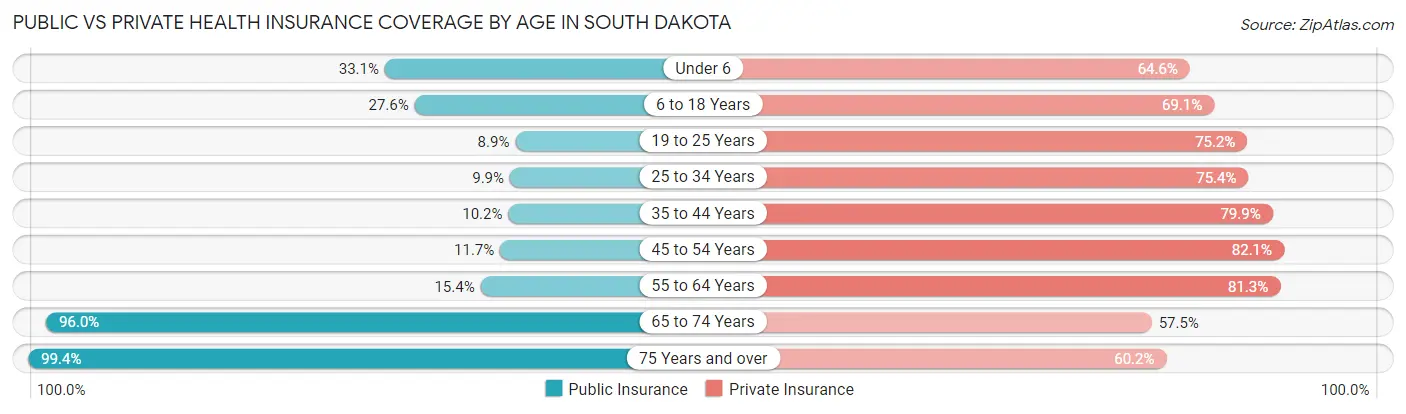
| Age Bracket | Public Insurance | Private Insurance |
| Under 6 | 23,226 (33.1%) | 45,264 (64.6%) |
| 6 to 18 Years | 43,555 (27.6%) | 108,938 (69.1%) |
| 19 to 25 Years | 7,232 (8.9%) | 60,926 (75.2%) |
| 25 to 34 Years | 9,928 (9.9%) | 75,401 (75.4%) |
| 35 to 44 Years | 10,948 (10.2%) | 85,595 (79.9%) |
| 45 to 54 Years | 11,018 (11.7%) | 77,032 (82.1%) |
| 55 to 64 Years | 17,673 (15.4%) | 93,457 (81.3%) |
| 65 to 74 Years | 87,113 (96.0%) | 52,175 (57.5%) |
| 75 Years and over | 55,445 (99.4%) | 33,607 (60.2%) |
| Total | 266,138 (30.5%) | 632,395 (72.6%) |
Disability Status by Sex by Age in South Dakota
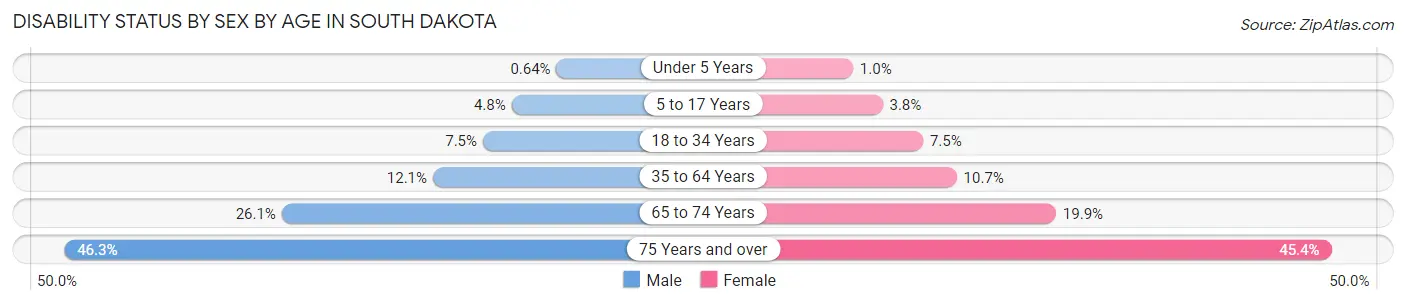
| Age Bracket | Male | Female |
| Under 5 Years | 187 (0.6%) | 297 (1.0%) |
| 5 to 17 Years | 3,883 (4.8%) | 2,917 (3.8%) |
| 18 to 34 Years | 7,376 (7.5%) | 7,074 (7.5%) |
| 35 to 64 Years | 19,530 (12.1%) | 16,482 (10.7%) |
| 65 to 74 Years | 11,972 (26.1%) | 8,927 (19.9%) |
| 75 Years and over | 10,959 (46.3%) | 14,610 (45.4%) |
Disability Class by Sex by Age in South Dakota
Disability Class: Hearing Difficulty
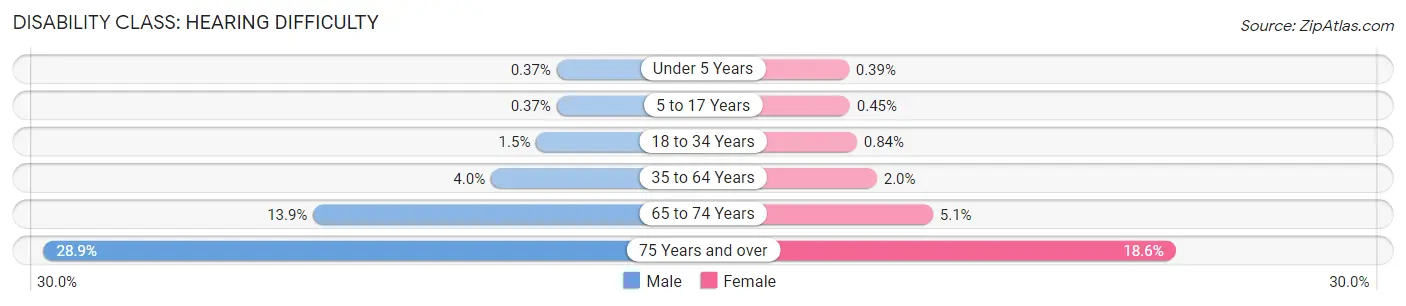
| Age Bracket | Male | Female |
| Under 5 Years | 109 (0.4%) | 111 (0.4%) |
| 5 to 17 Years | 295 (0.4%) | 351 (0.4%) |
| 18 to 34 Years | 1,490 (1.5%) | 793 (0.8%) |
| 35 to 64 Years | 6,506 (4.0%) | 3,020 (1.9%) |
| 65 to 74 Years | 6,380 (13.9%) | 2,279 (5.1%) |
| 75 Years and over | 6,848 (28.9%) | 5,974 (18.6%) |
Disability Class: Vision Difficulty
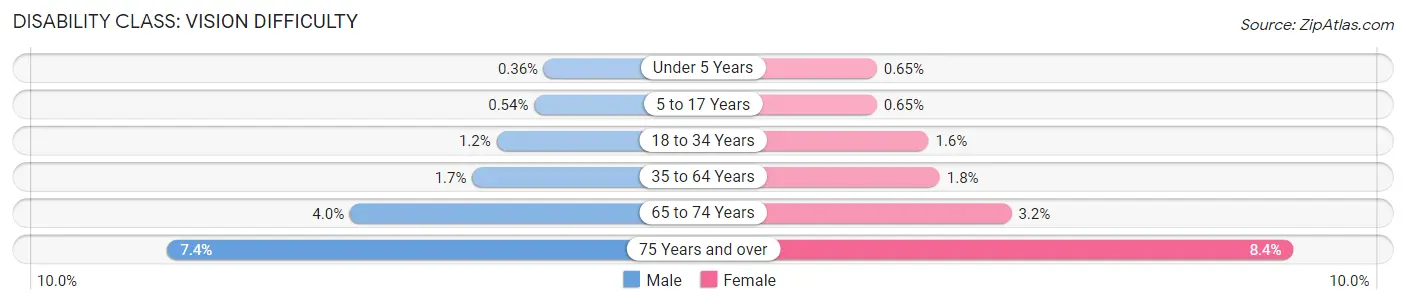
| Age Bracket | Male | Female |
| Under 5 Years | 107 (0.4%) | 186 (0.6%) |
| 5 to 17 Years | 433 (0.5%) | 499 (0.6%) |
| 18 to 34 Years | 1,227 (1.2%) | 1,513 (1.6%) |
| 35 to 64 Years | 2,718 (1.7%) | 2,820 (1.8%) |
| 65 to 74 Years | 1,813 (4.0%) | 1,416 (3.2%) |
| 75 Years and over | 1,738 (7.3%) | 2,694 (8.4%) |
Disability Class: Cognitive Difficulty
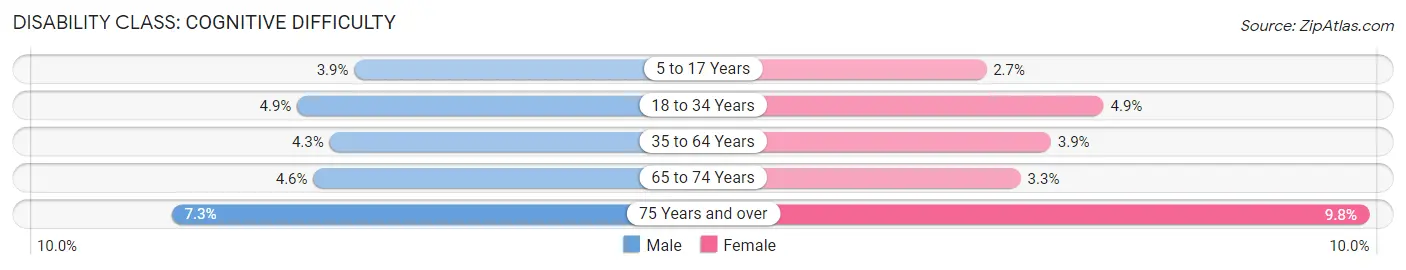
| Age Bracket | Male | Female |
| 5 to 17 Years | 3,130 (3.9%) | 2,068 (2.7%) |
| 18 to 34 Years | 4,882 (4.9%) | 4,568 (4.9%) |
| 35 to 64 Years | 7,004 (4.3%) | 5,996 (3.9%) |
| 65 to 74 Years | 2,125 (4.6%) | 1,492 (3.3%) |
| 75 Years and over | 1,720 (7.3%) | 3,145 (9.8%) |
Disability Class: Ambulatory Difficulty
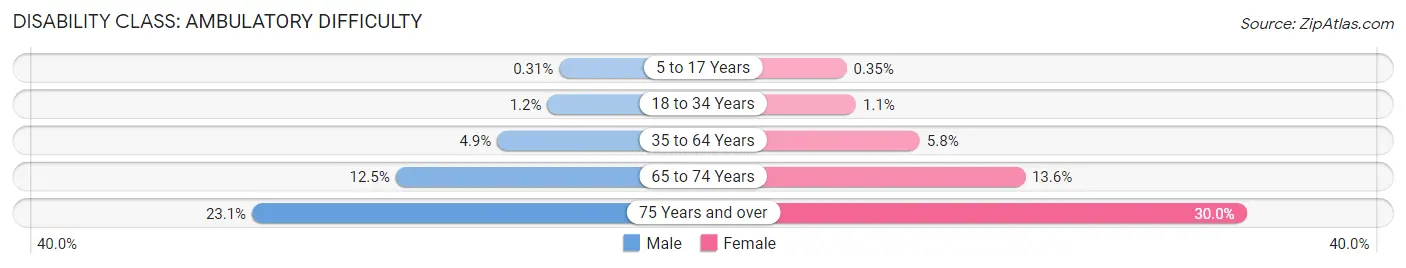
| Age Bracket | Male | Female |
| 5 to 17 Years | 249 (0.3%) | 273 (0.4%) |
| 18 to 34 Years | 1,174 (1.2%) | 1,000 (1.1%) |
| 35 to 64 Years | 7,931 (4.9%) | 8,974 (5.8%) |
| 65 to 74 Years | 5,706 (12.5%) | 6,110 (13.6%) |
| 75 Years and over | 5,470 (23.1%) | 9,657 (30.0%) |
Disability Class: Self-Care Difficulty
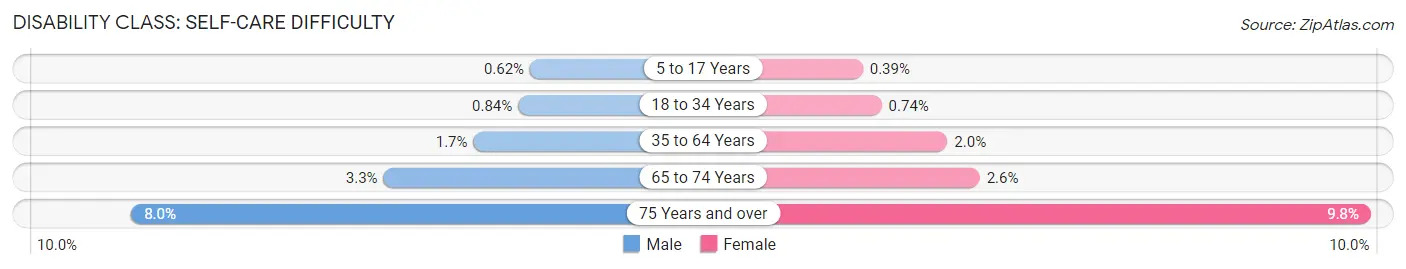
| Age Bracket | Male | Female |
| 5 to 17 Years | 504 (0.6%) | 300 (0.4%) |
| 18 to 34 Years | 834 (0.8%) | 696 (0.7%) |
| 35 to 64 Years | 2,690 (1.7%) | 3,032 (2.0%) |
| 65 to 74 Years | 1,530 (3.3%) | 1,152 (2.6%) |
| 75 Years and over | 1,898 (8.0%) | 3,158 (9.8%) |
Technology Access in South Dakota
Computing Device Access in South Dakota
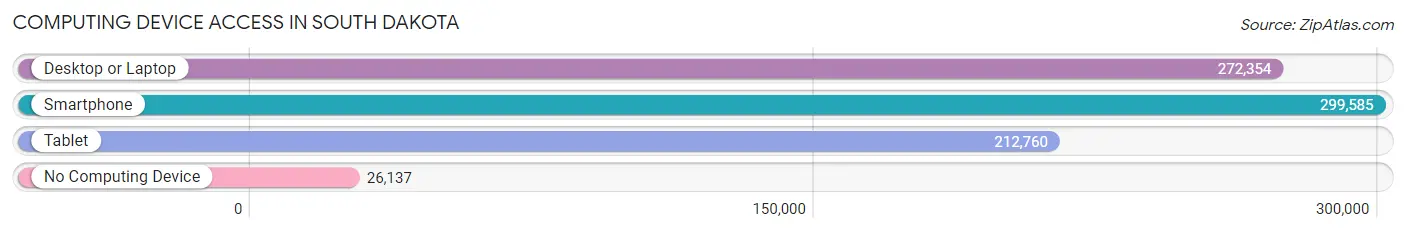
| Device Type | # Households | % Households |
| Desktop or Laptop | 272,354 | 77.5% |
| Smartphone | 299,585 | 85.3% |
| Tablet | 212,760 | 60.6% |
| No Computing Device | 26,137 | 7.4% |
| Total | 351,182 | 100.0% |
Internet Access in South Dakota
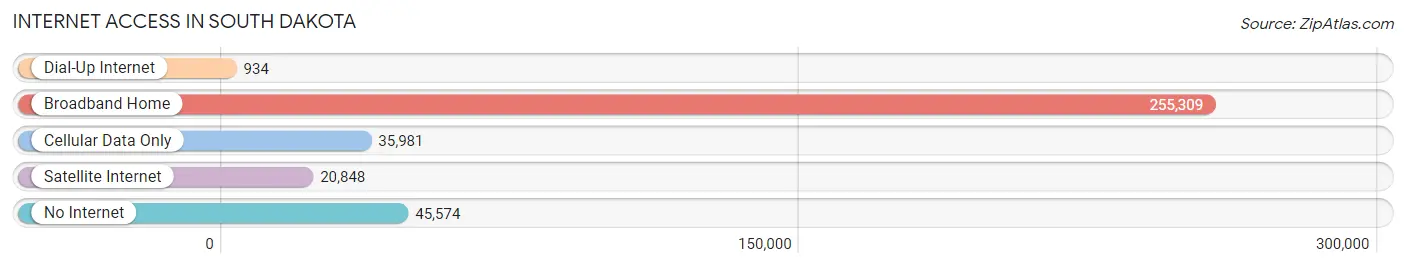
| Internet Type | # Households | % Households |
| Dial-Up Internet | 934 | 0.3% |
| Broadband Home | 255,309 | 72.7% |
| Cellular Data Only | 35,981 | 10.2% |
| Satellite Internet | 20,848 | 5.9% |
| No Internet | 45,574 | 13.0% |
| Total | 351,182 | 100.0% |
South Dakota Summary
South Dakota is a state located in the Midwestern region of the United States. It is bordered by North Dakota to the north, Minnesota to the east, Iowa to the southeast, Nebraska to the south, Wyoming to the west, and Montana to the northwest. South Dakota is the seventeenth largest state by area, and the fifth least populous state in the country. As of 2020, the population of South Dakota was estimated to be 884,659.
History
The area that is now South Dakota has been inhabited by various Native American tribes for thousands of years. The first Europeans to explore the area were French fur traders, who arrived in the late 17th century. In 1803, the United States acquired the area as part of the Louisiana Purchase. The area was part of the Dakota Territory until 1889, when it was divided into North and South Dakota. South Dakota became the 40th state in the Union on November 2, 1889.
Geography
South Dakota is located in the Midwestern region of the United States. It is bordered by North Dakota to the north, Minnesota to the east, Iowa to the southeast, Nebraska to the south, Wyoming to the west, and Montana to the northwest. South Dakota is the seventeenth largest state by area, covering an area of 77,116 square miles.
The geography of South Dakota is diverse, ranging from the Great Plains in the east to the Black Hills in the west. The Missouri River forms the eastern border of the state, while the Big Sioux River forms the western border. The Black Hills, an area of rugged mountains and forests, are located in the southwestern part of the state. Other major geographic features include the Badlands, the White River, and the Missouri National Recreational River.
Economy
South Dakota’s economy is largely based on agriculture, tourism, and manufacturing. The state’s agricultural sector is the largest in the nation, with the top five commodities being corn, soybeans, wheat, hogs, and cattle. Tourism is also a major industry in South Dakota, with the state’s most popular attractions being Mount Rushmore, the Badlands, and the Black Hills. The state’s manufacturing sector is centered around the production of food products, machinery, and chemicals.
Demographics
As of 2020, the population of South Dakota was estimated to be 884,659. The state has a population density of 11.6 people per square mile. The largest city in South Dakota is Sioux Falls, with a population of 183,200. Other major cities include Rapid City (74,716), Aberdeen (27,091), and Watertown (21,482).
The racial makeup of South Dakota is 87.2% White, 8.2% Native American, 1.7% Black or African American, 0.7% Asian, 0.1% Pacific Islander, and 2.1% from two or more races. The state’s Hispanic or Latino population is 4.3%.
The median household income in South Dakota is $54,919, and the median home value is $179,400. The state’s poverty rate is 11.2%. The largest industries in South Dakota are agriculture, manufacturing, and tourism. The state’s unemployment rate is 3.2%.
Common Questions
When was South Dakota Incorporated?
South Dakota was Incorporated into the Union on Nov 2, 1889.
What is the Total Area of South Dakota?
Total Area of South Dakota is 77,116 Square Miles.
What is the Total Land Area of South Dakota?
Total Land Area of South Dakota is 75,811 Square Miles.
What is the Total Water Area of South Dakota?
Total Water Area of South Dakota is 1,305 Square Miles.
What is the Average Elevation in South Dakota?
Average Elevation in South Dakota is 2,200 Feet.
What is the Highest Elevation in South Dakota?
Highest Elevation in South Dakota is 7,242 Feet.
What is the Lowest Elevation in South Dakota?
Lowest Elevation in South Dakota is 966 Feet.
What is the Population Density in South Dakota?
Population Density in South Dakota is 11.7 People per Square Mile.
What is Per Capita Income in South Dakota?
Per Capita income in South Dakota is $36,850.
What is the Median Family Income in South Dakota?
Median Family Income in South Dakota is $88,996.
What is the Median Household income in South Dakota?
Median Household Income in South Dakota is $69,457.
What is Income or Wage Gap in South Dakota?
Income or Wage Gap in South Dakota is 26.9%.
Women in South Dakota earn 73.1 cents for every dollar earned by a man.
What is Family Income Deficit in South Dakota?
Family Income Deficit in South Dakota is $11,819.
Families that are below poverty line in South Dakota earn $11,819 less on average than the poverty threshold level.
What is Inequality or Gini Index in South Dakota?
Inequality or Gini Index in South Dakota is 0.45.
What is the Total Population of South Dakota?
Total Population of South Dakota is 890,342.
What is the Total Male Population of South Dakota?
Total Male Population of South Dakota is 451,671.
What is the Total Female Population of South Dakota?
Total Female Population of South Dakota is 438,671.
What is the Ratio of Males per 100 Females in South Dakota?
There are 102.96 Males per 100 Females in South Dakota.
What is the Ratio of Females per 100 Males in South Dakota?
There are 97.12 Females per 100 Males in South Dakota.
What is the Median Population Age in South Dakota?
Median Population Age in South Dakota is 37.5 Years.
What is the Average Family Size in South Dakota
Average Family Size in South Dakota is 3.1 People.
What is the Average Household Size in South Dakota
Average Household Size in South Dakota is 2.4 People.
How Large is the Labor Force in South Dakota?
There are 471,598 People in the Labor Forcein in South Dakota.
What is the Percentage of People in the Labor Force in South Dakota?
67.6% of People are in the Labor Force in South Dakota.
What is the Unemployment Rate in South Dakota?
Unemployment Rate in South Dakota is 3.1%.