Cities with the Highest Percentage of Immigrants from Burma / Myanmar in the United States
RELATED REPORTS & OPTIONS
Burma / Myanmar
United States
Compare Cities
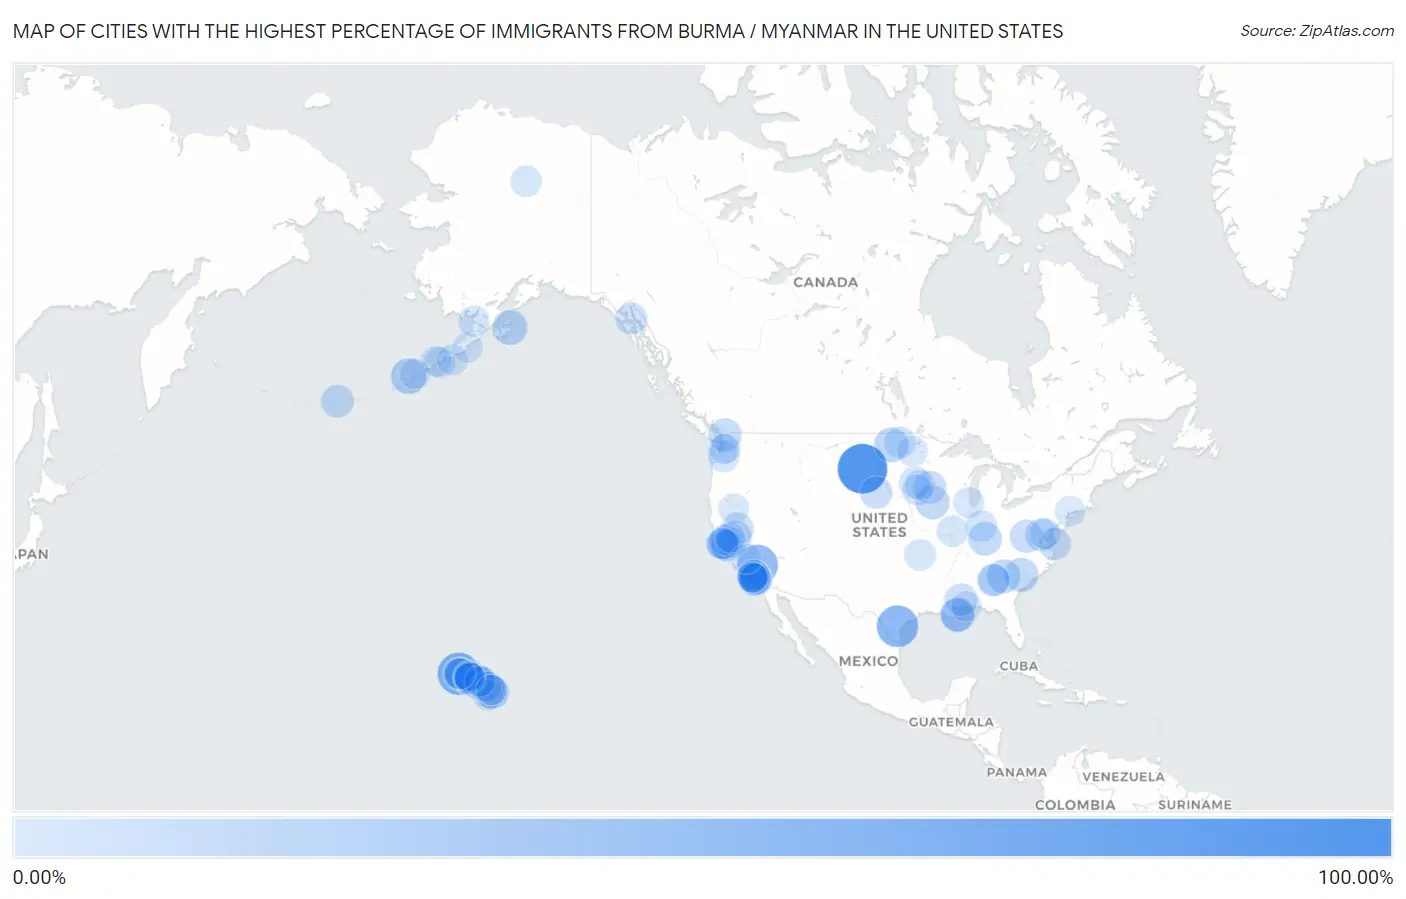
Map of Cities with the Highest Percentage of Immigrants from Burma / Myanmar in the United States
0.00%
20.00%
Cities with the Highest Percentage of Immigrants from Burma / Myanmar in the United States
| City | Burma / Myanmar | vs State | vs National | |
| 1. | Southport | 17.43% | 0.24%(+17.2)#1 | 0.047%(+17.4)#53 |
| 2. | Bloomington | 12.78% | 0.079%(+12.7)#1 | 0.047%(+12.7)#116 |
| 3. | Clarks Grove | 12.20% | 0.15%(+12.0)#1 | 0.047%(+12.1)#117 |
| 4. | Carlton | 11.17% | 0.047%(+11.1)#1 | 0.047%(+11.1)#118 |
| 5. | Greenehaven | 9.95% | 0.036%(+9.91)#1 | 0.047%(+9.90)#170 |
| 6. | Springfield | 5.11% | 0.041%(+5.07)#1 | 0.047%(+5.06)#269 |
| 7. | Clarkston | 4.69% | 0.047%(+4.64)#5 | 0.047%(+4.64)#366 |
| 8. | Columbus Junction | 4.48% | 0.14%(+4.34)#13 | 0.047%(+4.44)#556 |
| 9. | Lattingtown | 4.36% | 0.081%(+4.28)#12 | 0.047%(+4.32)#589 |
| 10. | Huron | 4.35% | 0.094%(+4.26)#3 | 0.047%(+4.30)#590 |
| 11. | Crescent Springs | 3.54% | 0.077%(+3.46)#9 | 0.047%(+3.49)#787 |
| 12. | Green Valley Cdp Solano County | 3.53% | 0.072%(+3.46)#202 | 0.047%(+3.48)#789 |
| 13. | Cactus | 3.50% | 0.042%(+3.46)#23 | 0.047%(+3.46)#790 |
| 14. | Jenks | 3.46% | 0.10%(+3.36)#7 | 0.047%(+3.41)#791 |
| 15. | Claypool | 3.44% | 0.24%(+3.20)#7 | 0.047%(+3.39)#828 |
| 16. | Bellerose Terrace | 3.33% | 0.081%(+3.24)#13 | 0.047%(+3.28)#829 |
| 17. | Conesville | 3.21% | 0.14%(+3.07)#20 | 0.047%(+3.16)#830 |
| 18. | Arbutus | 3.20% | 0.079%(+3.12)#22 | 0.047%(+3.15)#831 |
| 19. | Atoka | 3.16% | 0.10%(+3.06)#10 | 0.047%(+3.12)#940 |
| 20. | Adrian | 3.14% | 0.15%(+2.99)#26 | 0.047%(+3.10)#941 |
| 21. | Utica | 3.09% | 0.081%(+3.01)#14 | 0.047%(+3.04)#942 |
| 22. | Brewster | 2.80% | 0.15%(+2.65)#30 | 0.047%(+2.75)#943 |
| 23. | Crete | 2.71% | 0.20%(+2.51)#4 | 0.047%(+2.66)#993 |
| 24. | Edgecliff Village | 2.61% | 0.042%(+2.57)#33 | 0.047%(+2.56)#994 |
| 25. | Bowling Green | 2.53% | 0.077%(+2.45)#10 | 0.047%(+2.48)#995 |
| 26. | Marshalltown | 2.52% | 0.14%(+2.37)#22 | 0.047%(+2.47)#996 |
| 27. | Comer | 2.49% | 0.047%(+2.44)#18 | 0.047%(+2.44)#997 |
| 28. | Leesburg | 2.44% | 0.24%(+2.20)#12 | 0.047%(+2.39)#1,376 |
| 29. | Rensselaer | 2.37% | 0.081%(+2.29)#15 | 0.047%(+2.32)#1,377 |
| 30. | Davis City | 2.31% | 0.14%(+2.17)#29 | 0.047%(+2.27)#1,478 |
| 31. | Madison | 2.29% | 0.20%(+2.09)#6 | 0.047%(+2.24)#1,479 |
| 32. | St Anthony | 2.27% | 0.14%(+2.13)#30 | 0.047%(+2.23)#1,480 |
| 33. | Mayflower Village | 2.25% | 0.072%(+2.17)#203 | 0.047%(+2.20)#1,481 |
| 34. | Bel Aire | 2.22% | 0.096%(+2.12)#8 | 0.047%(+2.17)#1,482 |
| 35. | Breckinridge Center | 2.20% | 0.077%(+2.13)#15 | 0.047%(+2.16)#1,520 |
| 36. | Glidden | 2.18% | 0.14%(+2.04)#33 | 0.047%(+2.13)#1,595 |
| 37. | Daly City | 2.05% | 0.072%(+1.98)#204 | 0.047%(+2.00)#1,596 |
| 38. | Mattydale | 2.04% | 0.081%(+1.96)#21 | 0.047%(+2.00)#1,597 |
| 39. | Storm Lake | 1.96% | 0.14%(+1.81)#34 | 0.047%(+1.91)#1,598 |
| 40. | Swepsonville | 1.95% | 0.043%(+1.90)#19 | 0.047%(+1.90)#1,599 |
| 41. | Ranson Corporation | 1.89% | 0.0085%(+1.88)#6 | 0.047%(+1.84)#1,600 |
| 42. | Fulda | 1.89% | 0.15%(+1.74)#31 | 0.047%(+1.84)#1,601 |
| 43. | North St Paul | 1.89% | 0.15%(+1.73)#32 | 0.047%(+1.84)#1,602 |
| 44. | Battle Creek | 1.88% | 0.041%(+1.84)#9 | 0.047%(+1.83)#1,603 |
| 45. | Lyons | 1.87% | 0.24%(+1.63)#13 | 0.047%(+1.82)#1,604 |
| 46. | St Paul | 1.86% | 0.15%(+1.71)#33 | 0.047%(+1.81)#1,605 |
| 47. | La Habra Heights | 1.80% | 0.072%(+1.73)#235 | 0.047%(+1.76)#1,606 |
| 48. | Clive | 1.80% | 0.14%(+1.66)#35 | 0.047%(+1.75)#1,607 |
| 49. | Calcium | 1.77% | 0.081%(+1.69)#67 | 0.047%(+1.72)#2,024 |
| 50. | Melody Hill | 1.74% | 0.24%(+1.50)#14 | 0.047%(+1.69)#2,025 |
| 51. | Tukwila | 1.73% | 0.041%(+1.69)#3 | 0.047%(+1.68)#2,026 |
| 52. | Tucker | 1.72% | 0.047%(+1.68)#21 | 0.047%(+1.68)#2,027 |
| 53. | Rosemead | 1.68% | 0.072%(+1.61)#236 | 0.047%(+1.63)#2,028 |
| 54. | Fort Wayne | 1.63% | 0.24%(+1.39)#15 | 0.047%(+1.59)#2,029 |
| 55. | Mcleod | 1.62% | 0.042%(+1.58)#112 | 0.047%(+1.57)#2,252 |
| 56. | Byron Center | 1.62% | 0.041%(+1.58)#16 | 0.047%(+1.57)#2,253 |
| 57. | Marshall | 1.60% | 0.15%(+1.45)#34 | 0.047%(+1.56)#2,254 |
| 58. | Austin | 1.57% | 0.15%(+1.42)#35 | 0.047%(+1.52)#2,255 |
| 59. | Shorewood Forest | 1.56% | 0.24%(+1.32)#26 | 0.047%(+1.51)#2,351 |
| 60. | Kentwood | 1.49% | 0.041%(+1.45)#17 | 0.047%(+1.44)#2,352 |
| 61. | East Moline | 1.47% | 0.036%(+1.43)#86 | 0.047%(+1.42)#2,353 |
| 62. | Pine Ridge At Crestwood | 1.46% | 0.018%(+1.44)#125 | 0.047%(+1.41)#2,536 |
| 63. | North El Monte | 1.46% | 0.072%(+1.38)#237 | 0.047%(+1.41)#2,537 |
| 64. | Merritt Park | 1.44% | 0.081%(+1.36)#101 | 0.047%(+1.39)#2,568 |
| 65. | New Bern | 1.43% | 0.043%(+1.39)#22 | 0.047%(+1.39)#2,569 |
| 66. | Nashville | 1.43% | 0.047%(+1.38)#47 | 0.047%(+1.38)#2,593 |
| 67. | Lyman | 1.41% | 0.012%(+1.40)#25 | 0.047%(+1.36)#2,620 |
| 68. | Savage | 1.41% | 0.079%(+1.33)#44 | 0.047%(+1.36)#2,621 |
| 69. | Sully Square | 1.37% | 0.021%(+1.35)#94 | 0.047%(+1.32)#2,622 |
| 70. | Garden City | 1.35% | 0.096%(+1.25)#14 | 0.047%(+1.30)#2,623 |
| 71. | Urbandale | 1.34% | 0.14%(+1.20)#36 | 0.047%(+1.29)#2,624 |
| 72. | Wyndham | 1.33% | 0.021%(+1.31)#95 | 0.047%(+1.28)#2,625 |
| 73. | South San Gabriel | 1.30% | 0.072%(+1.23)#238 | 0.047%(+1.25)#2,626 |
| 74. | Catonsville | 1.28% | 0.079%(+1.20)#68 | 0.047%(+1.24)#2,627 |
| 75. | Clarksville | 1.26% | 0.0088%(+1.25)#7 | 0.047%(+1.21)#2,628 |
| 76. | Kansas City | 1.26% | 0.096%(+1.16)#20 | 0.047%(+1.21)#2,629 |
| 77. | Knob Noster | 1.25% | 0.020%(+1.23)#17 | 0.047%(+1.21)#2,630 |
| 78. | Walnut Grove | 1.23% | 0.15%(+1.07)#36 | 0.047%(+1.18)#2,631 |
| 79. | Wheaton | 1.20% | 0.036%(+1.16)#87 | 0.047%(+1.15)#2,632 |
| 80. | Woodlawn Cdp Baltimore County | 1.20% | 0.079%(+1.12)#69 | 0.047%(+1.15)#2,633 |
| 81. | Lincoln Village | 1.14% | 0.012%(+1.13)#38 | 0.047%(+1.09)#2,634 |
| 82. | South Burlington | 1.13% | 0.059%(+1.07)#8 | 0.047%(+1.08)#2,635 |
| 83. | Lewisville | 1.12% | 0.042%(+1.08)#113 | 0.047%(+1.07)#2,636 |
| 84. | New Hartford | 1.11% | 0.081%(+1.03)#135 | 0.047%(+1.06)#3,315 |
| 85. | Sunman | 1.09% | 0.24%(+0.852)#38 | 0.047%(+1.04)#3,362 |
| 86. | Homecroft | 1.09% | 0.24%(+0.845)#40 | 0.047%(+1.04)#3,385 |
| 87. | Westlake | 1.08% | 0.042%(+1.04)#114 | 0.047%(+1.03)#3,386 |
| 88. | Indianapolis | 1.08% | 0.24%(+0.837)#41 | 0.047%(+1.03)#3,387 |
| 89. | Shady Hollow | 1.08% | 0.042%(+1.03)#180 | 0.047%(+1.03)#3,419 |
| 90. | Timberlake | 1.07% | 0.012%(+1.06)#72 | 0.047%(+1.02)#3,433 |
| 91. | Knightdale | 1.06% | 0.043%(+1.02)#33 | 0.047%(+1.01)#3,434 |
| 92. | White River Junction | 1.05% | 0.059%(+0.989)#12 | 0.047%(+1.00)#3,435 |
| 93. | Knoxville | 1.04% | 0.14%(+0.895)#58 | 0.047%(+0.989)#3,539 |
| 94. | Albert Lea | 1.04% | 0.15%(+0.884)#79 | 0.047%(+0.989)#3,540 |
| 95. | Winooski | 1.01% | 0.059%(+0.950)#13 | 0.047%(+0.962)#3,541 |
| 96. | Calverton | 1.00% | 0.079%(+0.925)#70 | 0.047%(+0.957)#3,542 |
| 97. | Peaceful Valley | 0.99% | 0.041%(+0.953)#109 | 0.047%(+0.947)#3,543 |
| 98. | San Gabriel | 0.98% | 0.072%(+0.913)#239 | 0.047%(+0.937)#3,544 |
| 99. | Norcross | 0.97% | 0.047%(+0.923)#48 | 0.047%(+0.922)#3,545 |
| 100. | Owensboro | 0.95% | 0.077%(+0.876)#25 | 0.047%(+0.906)#3,546 |
Common Questions
What are the Top 10 Cities with the Highest Percentage of Immigrants from Burma / Myanmar in the United States?
Top 10 Cities with the Highest Percentage of Immigrants from Burma / Myanmar in the United States are:
#1
17.43%
#2
12.78%
#3
12.20%
#4
11.17%
#5
5.11%
#6
4.69%
#7
4.48%
#8
4.36%
#9
4.35%
#10
3.54%
What city has the Highest Percentage of Immigrants from Burma / Myanmar in the United States?
Southport has the Highest Percentage of Immigrants from Burma / Myanmar in the United States with 17.43%.
What is the Percentage of Immigrants from Burma / Myanmar in the United States?
Percentage of Immigrants from Burma / Myanmar in the United States is 0.047%.