Wyoming Map & Demographics
Wyoming Map
Wyoming Overview
Jul 10, 1890
INCORPORATED
97,812
TOTAL AREA [ SQ MI ]
97,088
LAND AREA [ SQ MI ]
724
WATER AREA [ SQ MI ]
6,700
ELEVATION AVG [ FT ]
13,804
ELEVATION HIGH [ FT ]
3,099
ELEVATION LOW [ FT ]
6.0
POP DENSITY [ PPL / SQ MI ]
$39,547
PER CAPITA INCOME
$92,028
AVG FAMILY INCOME
$72,495
AVG HOUSEHOLD INCOME
40.6%
WAGE / INCOME GAP [ % ]
59.4¢/ $1
WAGE / INCOME GAP [ $ ]
$10,562
FAMILY INCOME DEFICIT
0.45
INEQUALITY / GINI INDEX
82001
LARGEST ZIP CODE
Cheyenne
LARGEST CITY
Laramie County
LARGEST COUNTY
577,929
TOTAL POPULATION
295,835
MALE POPULATION
282,094
FEMALE POPULATION
104.87
MALES / 100 FEMALES
95.36
FEMALES / 100 MALES
38.5
MEDIAN AGE
3.0
AVG FAMILY SIZE
2.4
AVG HOUSEHOLD SIZE
302,639
LABOR FORCE [ PEOPLE ]
65.7%
PERCENT IN LABOR FORCE
3.8%
UNEMPLOYMENT RATE
Wyoming Area Codes
Income in Wyoming
Income Overview in Wyoming
Per Capita Income in Wyoming is $39,547, while median incomes of families and households are $92,028 and $72,495 respectively.
| Characteristic | Number | Measure |
| Per Capita Income | 577,929 | $39,547 |
| Median Family Income | 147,480 | $92,028 |
| Mean Family Income | 147,480 | $113,271 |
| Median Household Income | 234,156 | $72,495 |
| Mean Household Income | 234,156 | $94,901 |
| Income Deficit | 147,480 | $10,562 |
| Wage / Income Gap (%) | 577,929 | 40.56% |
| Wage / Income Gap ($) | 577,929 | 59.44¢ per $1 |
| Gini / Inequality Index | 577,929 | 0.45 |
Earnings by Sex in Wyoming
Average Earnings in Wyoming are $39,717, $51,640 for men and $30,693 for women, a difference of 40.6%.
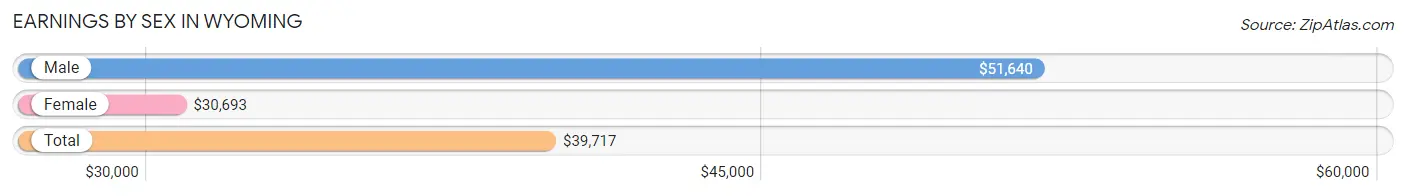
| Sex | Number | Average Earnings |
| Male | 177,334 (54.8%) | $51,640 |
| Female | 146,127 (45.2%) | $30,693 |
| Total | 323,461 (100.0%) | $39,717 |
Earnings by Sex by Income Bracket in Wyoming
The most common earnings brackets in Wyoming are $100,000+ for men (30,759 | 17.3%) and $25,000 to $29,999 for women (11,142 | 7.6%).
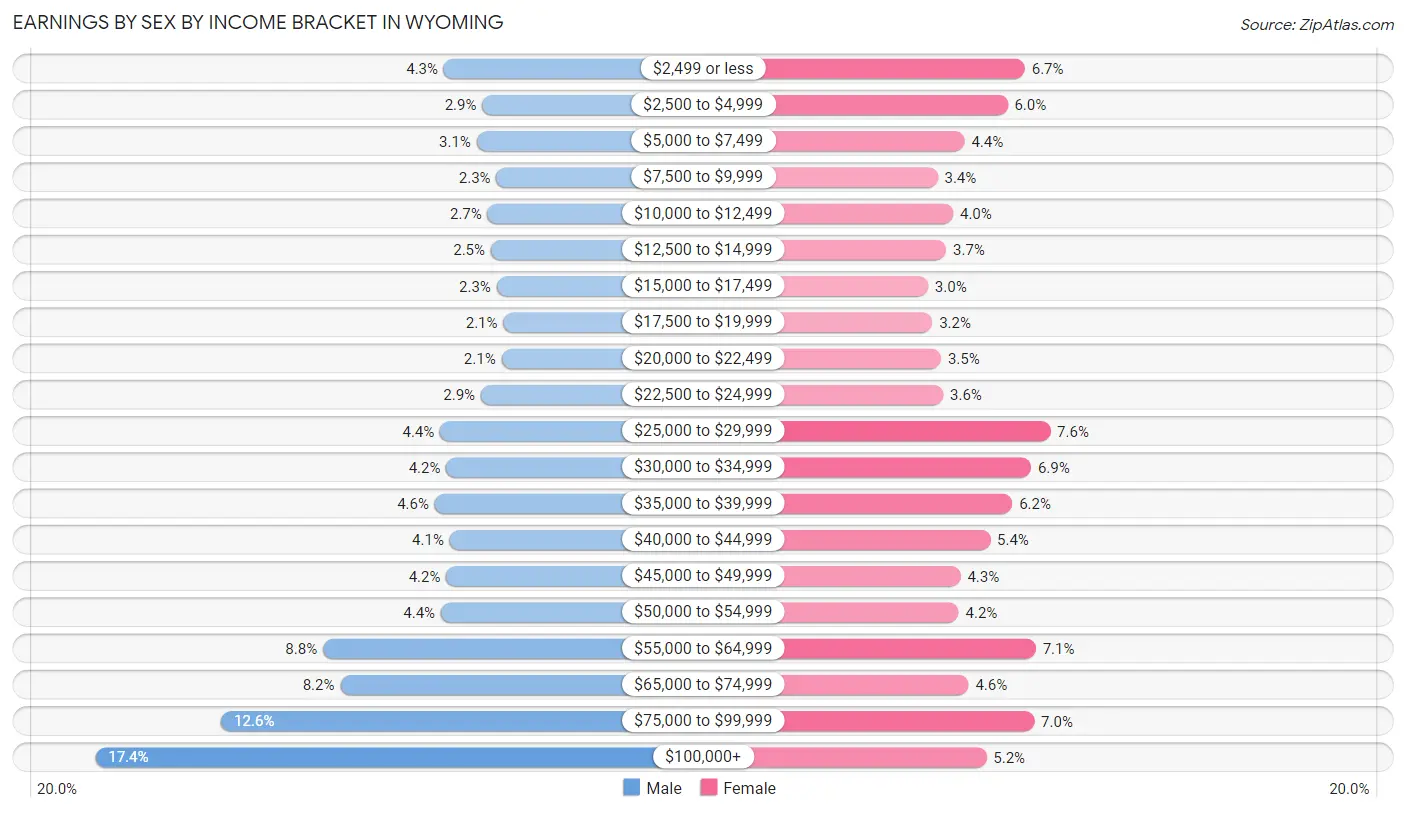
| Income | Male | Female |
| $2,499 or less | 7,609 (4.3%) | 9,748 (6.7%) |
| $2,500 to $4,999 | 5,050 (2.9%) | 8,796 (6.0%) |
| $5,000 to $7,499 | 5,422 (3.1%) | 6,449 (4.4%) |
| $7,500 to $9,999 | 4,117 (2.3%) | 4,970 (3.4%) |
| $10,000 to $12,499 | 4,694 (2.6%) | 5,816 (4.0%) |
| $12,500 to $14,999 | 4,495 (2.5%) | 5,432 (3.7%) |
| $15,000 to $17,499 | 4,093 (2.3%) | 4,448 (3.0%) |
| $17,500 to $19,999 | 3,661 (2.1%) | 4,674 (3.2%) |
| $20,000 to $22,499 | 3,779 (2.1%) | 5,154 (3.5%) |
| $22,500 to $24,999 | 5,136 (2.9%) | 5,279 (3.6%) |
| $25,000 to $29,999 | 7,851 (4.4%) | 11,142 (7.6%) |
| $30,000 to $34,999 | 7,442 (4.2%) | 10,077 (6.9%) |
| $35,000 to $39,999 | 8,207 (4.6%) | 9,053 (6.2%) |
| $40,000 to $44,999 | 7,216 (4.1%) | 7,842 (5.4%) |
| $45,000 to $49,999 | 7,454 (4.2%) | 6,218 (4.3%) |
| $50,000 to $54,999 | 7,803 (4.4%) | 6,127 (4.2%) |
| $55,000 to $64,999 | 15,640 (8.8%) | 10,351 (7.1%) |
| $65,000 to $74,999 | 14,492 (8.2%) | 6,661 (4.6%) |
| $75,000 to $99,999 | 22,414 (12.6%) | 10,252 (7.0%) |
| $100,000+ | 30,759 (17.3%) | 7,638 (5.2%) |
| Total | 177,334 (100.0%) | 146,127 (100.0%) |
Earnings by Sex by Educational Attainment in Wyoming
Average earnings in Wyoming are $59,232 for men and $36,045 for women, a difference of 39.2%. Men with an educational attainment of graduate degree enjoy the highest average annual earnings of $79,447, while those with less than high school education earn the least with $43,362. Women with an educational attainment of graduate degree earn the most with the average annual earnings of $65,517, while those with less than high school education have the smallest earnings of $20,038.
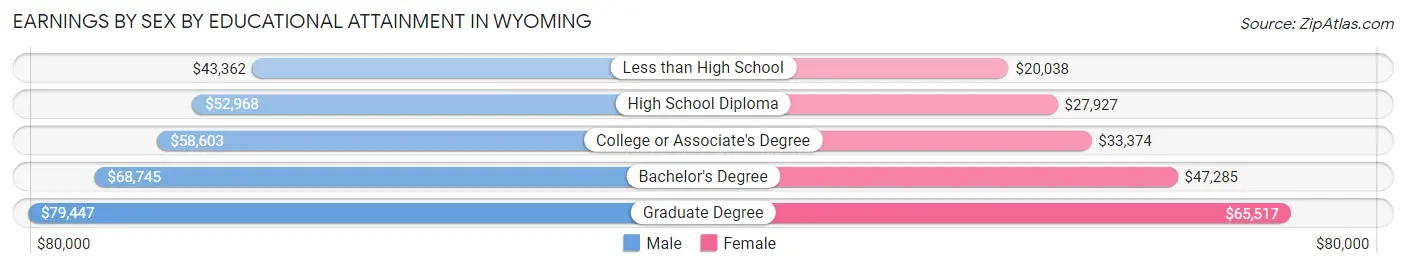
| Educational Attainment | Male Income | Female Income |
| Less than High School | $43,362 | $20,038 |
| High School Diploma | $52,968 | $27,927 |
| College or Associate's Degree | $58,603 | $33,374 |
| Bachelor's Degree | $68,745 | $47,285 |
| Graduate Degree | $79,447 | $65,517 |
| Total | $59,232 | $36,045 |
Family Income in Wyoming
Family Income Brackets in Wyoming
According to the Wyoming family income data, there are 35,100 families falling into the $100,000 to $149,999 income range, which is the most common income bracket and makes up 23.8% of all families. Conversely, the $10,000 to $14,999 income bracket is the least frequent group with only 2,212 families (1.5%) belonging to this category.
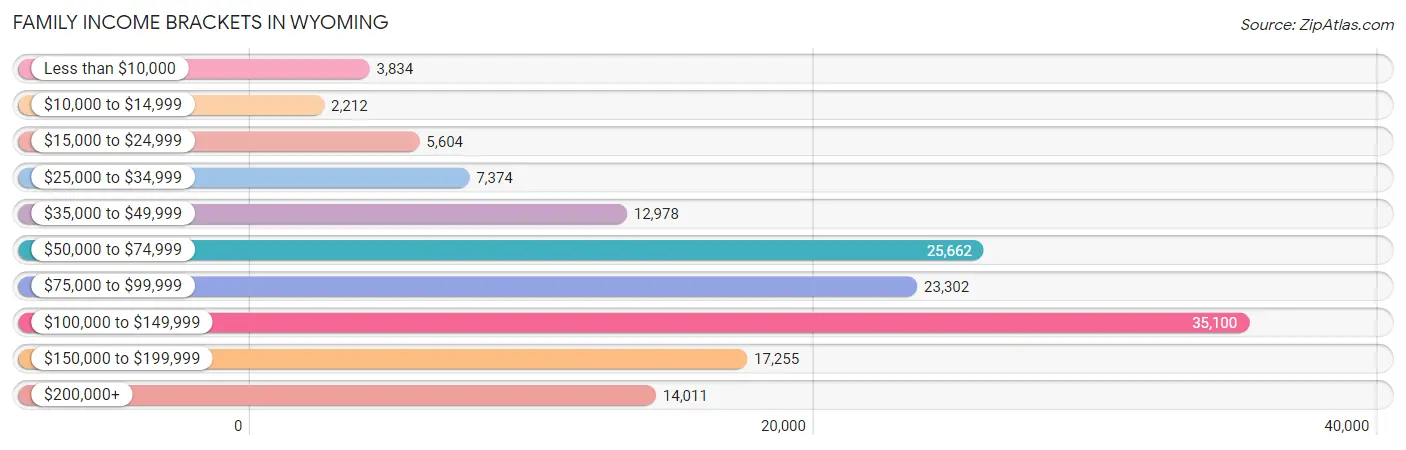
| Income Bracket | # Families | % Families |
| Less than $10,000 | 3,834 | 2.6% |
| $10,000 to $14,999 | 2,212 | 1.5% |
| $15,000 to $24,999 | 5,604 | 3.8% |
| $25,000 to $34,999 | 7,374 | 5.0% |
| $35,000 to $49,999 | 12,978 | 8.8% |
| $50,000 to $74,999 | 25,662 | 17.4% |
| $75,000 to $99,999 | 23,302 | 15.8% |
| $100,000 to $149,999 | 35,100 | 23.8% |
| $150,000 to $199,999 | 17,255 | 11.7% |
| $200,000+ | 14,011 | 9.5% |
Family Income by Famaliy Size in Wyoming
4-person families (23,493 | 15.9%) account for the highest median family income in Wyoming with $111,736 per family, while 2-person families (76,948 | 52.2%) have the highest median income of $41,170 per family member.
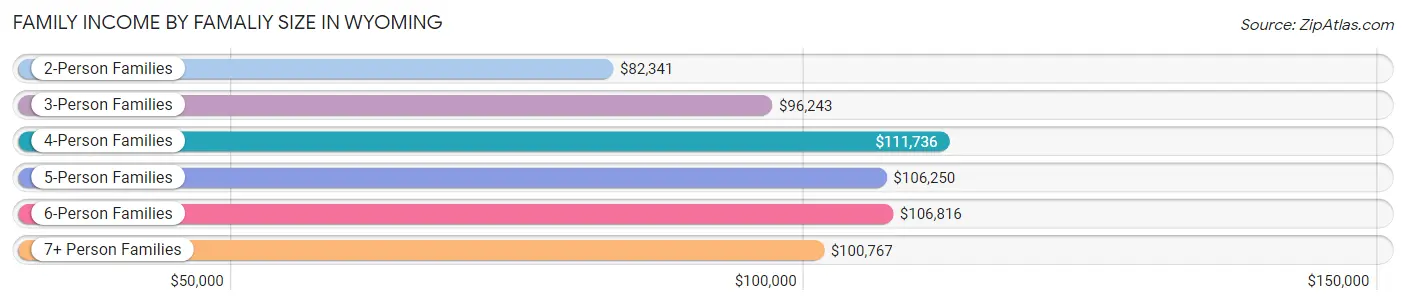
| Income Bracket | # Families | Median Income |
| 2-Person Families | 76,948 (52.2%) | $82,341 |
| 3-Person Families | 29,553 (20.0%) | $96,243 |
| 4-Person Families | 23,493 (15.9%) | $111,736 |
| 5-Person Families | 11,158 (7.6%) | $106,250 |
| 6-Person Families | 3,903 (2.6%) | $106,816 |
| 7+ Person Families | 2,425 (1.6%) | $100,767 |
| Total | 147,480 (100.0%) | $92,028 |
Family Income by Number of Earners in Wyoming
The median family income in Wyoming is $92,028, with families comprising 3+ earners (14,376) having the highest median family income of $139,549, while families with no earners (21,003) have the lowest median family income of $58,203, accounting for 9.8% and 14.2% of families, respectively.
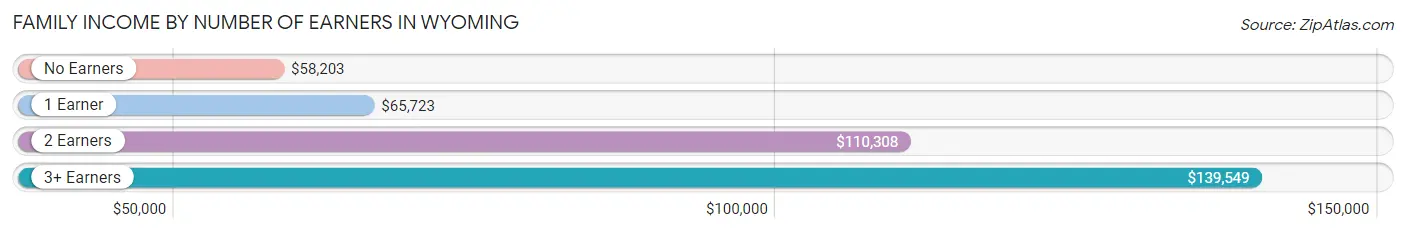
| Number of Earners | # Families | Median Income |
| No Earners | 21,003 (14.2%) | $58,203 |
| 1 Earner | 44,489 (30.2%) | $65,723 |
| 2 Earners | 67,612 (45.8%) | $110,308 |
| 3+ Earners | 14,376 (9.8%) | $139,549 |
| Total | 147,480 (100.0%) | $92,028 |
Household Income in Wyoming
Household Income Brackets in Wyoming
With 43,787 households falling in the category, the $100,000 to $149,999 income range is the most frequent in Wyoming, accounting for 18.7% of all households. In contrast, only 8,195 households (3.5%) fall into the $10,000 to $14,999 income bracket, making it the least populous group.
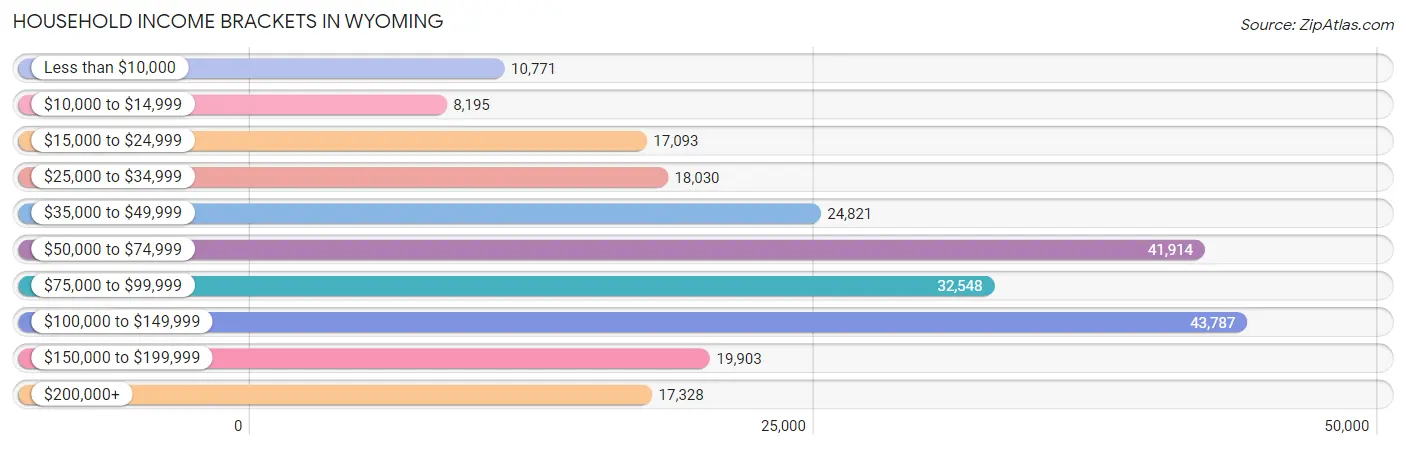
| Income Bracket | # Households | % Households |
| Less than $10,000 | 10,771 | 4.6% |
| $10,000 to $14,999 | 8,195 | 3.5% |
| $15,000 to $24,999 | 17,093 | 7.3% |
| $25,000 to $34,999 | 18,030 | 7.7% |
| $35,000 to $49,999 | 24,821 | 10.6% |
| $50,000 to $74,999 | 41,914 | 17.9% |
| $75,000 to $99,999 | 32,548 | 13.9% |
| $100,000 to $149,999 | 43,787 | 18.7% |
| $150,000 to $199,999 | 19,903 | 8.5% |
| $200,000+ | 17,328 | 7.4% |
Household Income by Householder Age in Wyoming
The median household income in Wyoming is $72,495, with the highest median household income of $87,483 found in the 45 to 64 years age bracket for the primary householder. A total of 80,827 households (34.5%) fall into this category. Meanwhile, the 15 to 24 years age bracket for the primary householder has the lowest median household income of $36,039, with 13,267 households (5.7%) in this group.
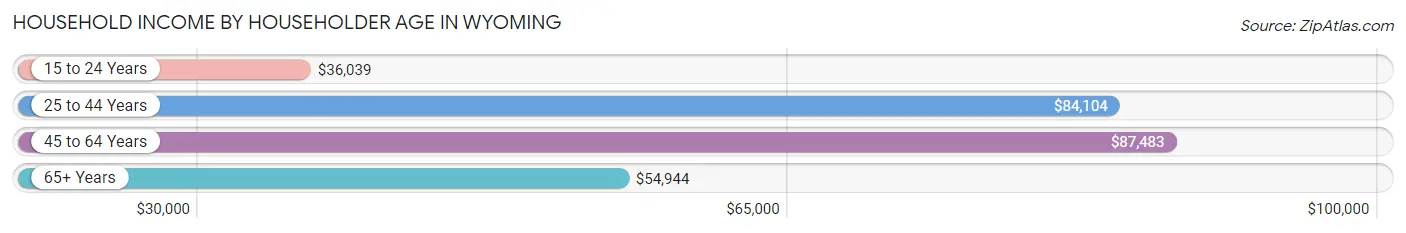
| Income Bracket | # Households | Median Income |
| 15 to 24 Years | 13,267 (5.7%) | $36,039 |
| 25 to 44 Years | 75,558 (32.3%) | $84,104 |
| 45 to 64 Years | 80,827 (34.5%) | $87,483 |
| 65+ Years | 64,504 (27.6%) | $54,944 |
| Total | 234,156 (100.0%) | $72,495 |
Poverty in Wyoming
Income Below Poverty by Sex and Age in Wyoming
With 9.4% poverty level for males and 11.9% for females among the residents of Wyoming, 18 to 24 year old males and 18 to 24 year old females are the most vulnerable to poverty, with 4,522 males (17.7%) and 6,794 females (29.6%) in their respective age groups living below the poverty level.
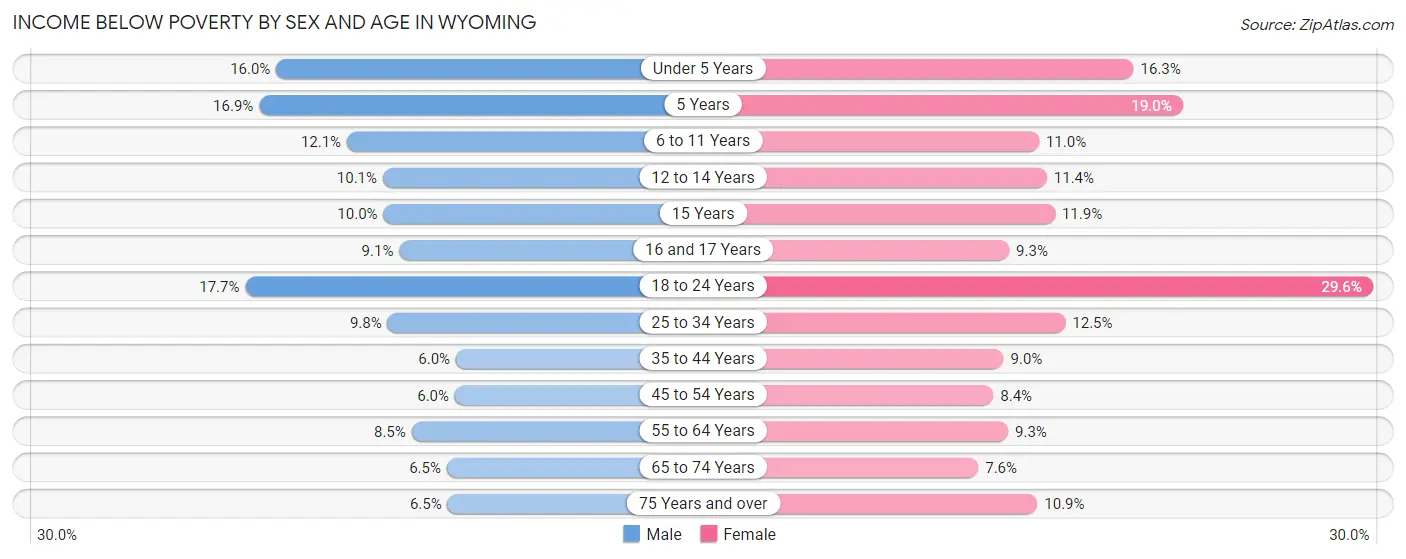
| Age Bracket | Male | Female |
| Under 5 Years | 2,620 (16.0%) | 2,545 (16.3%) |
| 5 Years | 619 (16.9%) | 628 (19.0%) |
| 6 to 11 Years | 2,729 (12.0%) | 2,377 (11.0%) |
| 12 to 14 Years | 1,218 (10.1%) | 1,304 (11.4%) |
| 15 Years | 383 (10.0%) | 503 (11.9%) |
| 16 and 17 Years | 734 (9.1%) | 637 (9.3%) |
| 18 to 24 Years | 4,522 (17.7%) | 6,794 (29.6%) |
| 25 to 34 Years | 3,702 (9.8%) | 4,342 (12.4%) |
| 35 to 44 Years | 2,310 (6.0%) | 3,265 (9.0%) |
| 45 to 54 Years | 2,033 (6.0%) | 2,620 (8.4%) |
| 55 to 64 Years | 3,187 (8.5%) | 3,478 (9.3%) |
| 65 to 74 Years | 2,049 (6.5%) | 2,324 (7.6%) |
| 75 Years and over | 1,057 (6.5%) | 2,154 (10.9%) |
| Total | 27,163 (9.4%) | 32,971 (11.9%) |
Income Above Poverty by Sex and Age in Wyoming
According to the poverty statistics in Wyoming, males aged 35 to 44 years and females aged 65 to 74 years are the age groups that are most secure financially, with 94.0% of males and 92.4% of females in these age groups living above the poverty line.
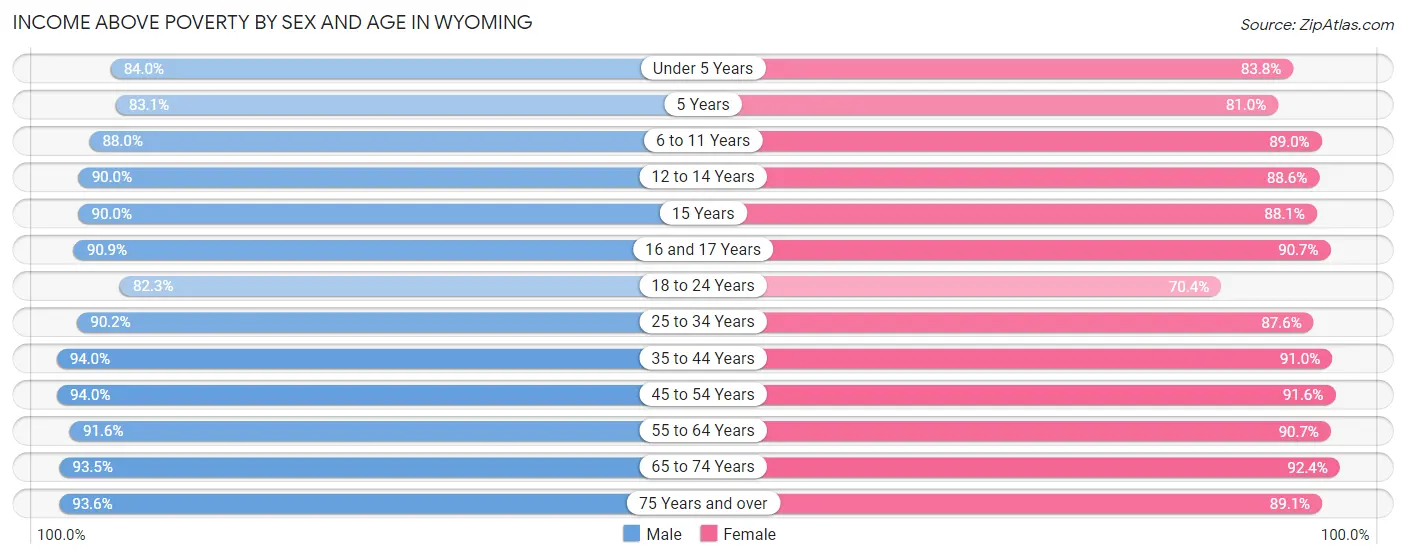
| Age Bracket | Male | Female |
| Under 5 Years | 13,766 (84.0%) | 13,119 (83.8%) |
| 5 Years | 3,034 (83.1%) | 2,672 (81.0%) |
| 6 to 11 Years | 19,915 (87.9%) | 19,273 (89.0%) |
| 12 to 14 Years | 10,898 (89.9%) | 10,119 (88.6%) |
| 15 Years | 3,441 (90.0%) | 3,734 (88.1%) |
| 16 and 17 Years | 7,301 (90.9%) | 6,196 (90.7%) |
| 18 to 24 Years | 21,006 (82.3%) | 16,149 (70.4%) |
| 25 to 34 Years | 34,129 (90.2%) | 30,527 (87.5%) |
| 35 to 44 Years | 36,290 (94.0%) | 32,992 (91.0%) |
| 45 to 54 Years | 31,604 (94.0%) | 28,432 (91.6%) |
| 55 to 64 Years | 34,547 (91.5%) | 34,080 (90.7%) |
| 65 to 74 Years | 29,509 (93.5%) | 28,270 (92.4%) |
| 75 Years and over | 15,337 (93.5%) | 17,631 (89.1%) |
| Total | 260,777 (90.6%) | 243,194 (88.1%) |
Income Below Poverty Among Married-Couple Families in Wyoming
The poverty statistics for married-couple families in Wyoming show that 3.6% or 4,246 of the total 118,766 families live below the poverty line. Families with 5 or more children have the highest poverty rate of 13.8%, comprising of 225 families. On the other hand, families with no children have the lowest poverty rate of 2.8%, which includes 1,993 families.
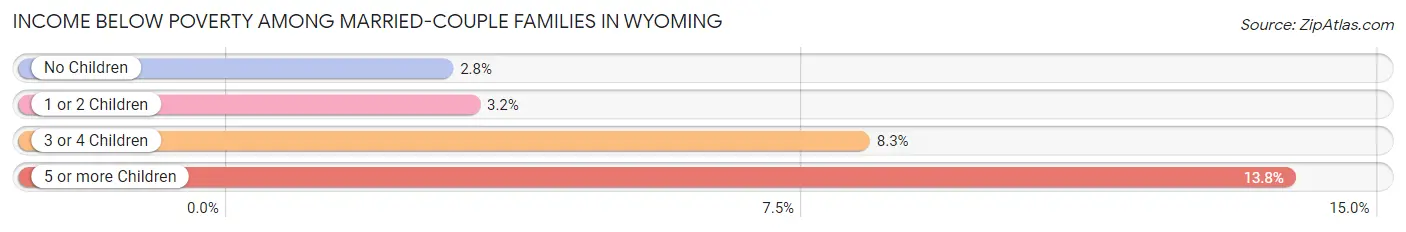
| Children | Above Poverty | Below Poverty |
| No Children | 69,036 (97.2%) | 1,993 (2.8%) |
| 1 or 2 Children | 33,810 (96.8%) | 1,104 (3.2%) |
| 3 or 4 Children | 10,270 (91.7%) | 924 (8.3%) |
| 5 or more Children | 1,404 (86.2%) | 225 (13.8%) |
| Total | 114,520 (96.4%) | 4,246 (3.6%) |
Income Below Poverty Among Single-Parent Households in Wyoming
According to the poverty data in Wyoming, 13.4% or 1,407 single-father households and 24.1% or 4,402 single-mother households are living below the poverty line. Among single-father households, those with 5 or more children have the highest poverty rate, with 23 households (53.5%) experiencing poverty. Likewise, among single-mother households, those with 3 or 4 children have the highest poverty rate, with 794 households (49.2%) falling below the poverty line.
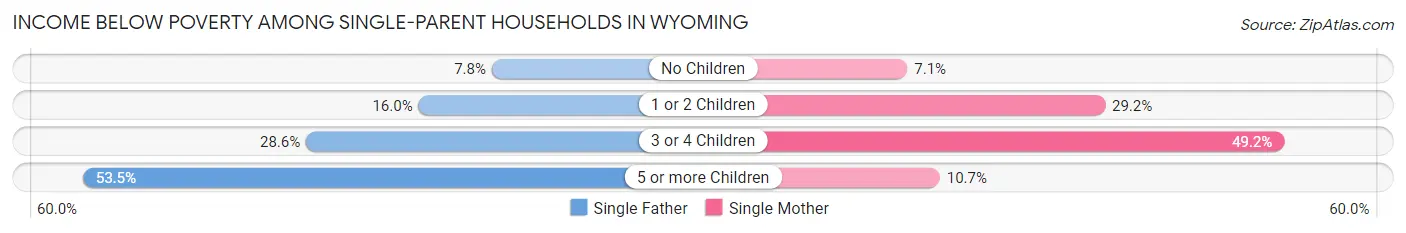
| Children | Single Father | Single Mother |
| No Children | 335 (7.8%) | 396 (7.1%) |
| 1 or 2 Children | 888 (16.0%) | 3,199 (29.2%) |
| 3 or 4 Children | 161 (28.5%) | 794 (49.2%) |
| 5 or more Children | 23 (53.5%) | 13 (10.7%) |
| Total | 1,407 (13.4%) | 4,402 (24.1%) |
Income Below Poverty Among Married-Couple vs Single-Parent Households in Wyoming
The poverty data for Wyoming shows that 4,246 of the married-couple family households (3.6%) and 5,809 of the single-parent households (20.2%) are living below the poverty level. Within the married-couple family households, those with 5 or more children have the highest poverty rate, with 225 households (13.8%) falling below the poverty line. Among the single-parent households, those with 3 or 4 children have the highest poverty rate, with 955 household (43.9%) living below poverty.

| Children | Married-Couple Families | Single-Parent Households |
| No Children | 1,993 (2.8%) | 731 (7.4%) |
| 1 or 2 Children | 1,104 (3.2%) | 4,087 (24.8%) |
| 3 or 4 Children | 924 (8.3%) | 955 (43.9%) |
| 5 or more Children | 225 (13.8%) | 36 (22.0%) |
| Total | 4,246 (3.6%) | 5,809 (20.2%) |
Largest Zip Codes by Population in Wyoming
The largest zip codes in Wyoming by population are 82001 (38,043), 82009 (34,835), 82901 (27,713), 82604 (27,492), and 82601 (26,973).
1.82001
38,043 (6.58%)
2.82009
34,835 (6.03%)
3.82901
27,713 (4.80%)
4.82604
27,492 (4.76%)
5.82601
26,973 (4.67%)
6.82801
25,665 (4.44%)
7.82718
25,413 (4.40%)
8.82007
21,755 (3.76%)
9.82070
19,598 (3.39%)
10.82501
18,898 (3.27%)
11.82609
18,567 (3.21%)
12.82716
18,167 (3.14%)
13.83001
17,721 (3.07%)
14.82072
16,835 (2.91%)
15.82414
15,932 (2.76%)
16.82930
14,804 (2.56%)
17.82520
13,248 (2.29%)
18.82435
12,398 (2.15%)
19.82935
12,316 (2.13%)
20.82240
9,752 (1.69%)
21.82633
9,555 (1.65%)
22.82301
8,349 (1.44%)
23.82834
7,517 (1.30%)
24.82401
6,942 (1.20%)
25.82201
6,597 (1.14%)
26.82701
5,383 (0.93%)
27.83110
5,172 (0.89%)
28.82941
4,773 (0.83%)
29.82443
4,546 (0.79%)
30.82637
4,107 (0.71%)
Largest Cities by Population in Wyoming
The largest cities in Wyoming by population are Cheyenne (64,795), Casper (58,631), Gillette (33,158), Laramie (31,735), and Rock Springs (23,361).
1.Cheyenne
64,795 (11.21%)
2.Casper
58,631 (10.15%)
3.Gillette
33,158 (5.74%)
4.Laramie
31,735 (5.49%)
23,361 (4.04%)
6.Sheridan
18,807 (3.25%)
7.Evanston
11,801 (2.04%)
11,772 (2.04%)
9.Jackson
10,748 (1.86%)
10.Riverton
10,733 (1.86%)
11.Cody
10,081 (1.74%)
12.Rawlins
8,287 (1.43%)
13.Lander
7,561 (1.31%)
14.Powell
6,460 (1.12%)
15.Douglas
6,356 (1.10%)
16.Torrington
6,161 (1.07%)
17.Ranchettes
5,731 (0.99%)
18.Worland
4,812 (0.83%)
19.Buffalo
4,475 (0.77%)
4,226 (0.73%)
21.Mills
4,218 (0.73%)
3,787 (0.66%)
23.Wheatland
3,575 (0.62%)
24.Newcastle
3,380 (0.58%)
25.Bar Nunn
2,945 (0.51%)
26.Glenrock
2,863 (0.50%)
27.Warren AFB
2,836 (0.49%)
28.Evansville
2,755 (0.48%)
29.Thermopolis
2,722 (0.47%)
30.Kemmerer
2,640 (0.46%)
Largest Counties by Population in Wyoming
The largest counties in Wyoming by population are Laramie County (100,316), Natrona County (79,506), Campbell County (46,857), Sweetwater County (42,079), and Fremont County (39,402).
100,316 (17.36%)
79,506 (13.76%)
46,857 (8.11%)
42,079 (7.28%)
39,402 (6.82%)
37,525 (6.49%)
31,176 (5.39%)
29,878 (5.17%)
23,346 (4.04%)
10.Uinta County
20,546 (3.56%)
19,794 (3.42%)
14,609 (2.53%)
13,729 (2.38%)
12,592 (2.18%)
11,690 (2.02%)
8,801 (1.52%)
8,618 (1.49%)
8,536 (1.48%)
7,725 (1.34%)
20.Crook County
7,258 (1.26%)
6,870 (1.19%)
4,616 (0.80%)
2,460 (0.43%)
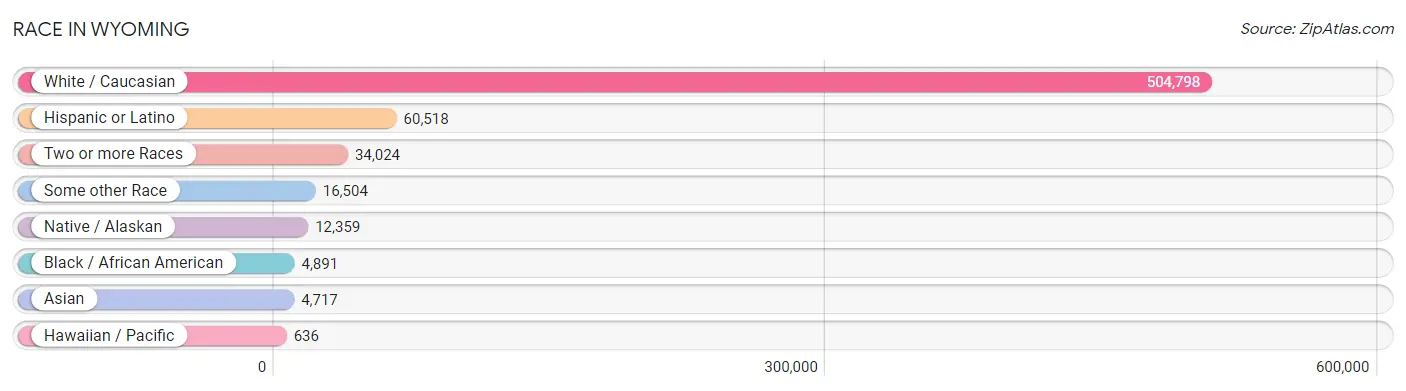
Race in Wyoming
The most populous races in Wyoming are White / Caucasian (504,798 | 87.4%), Hispanic or Latino (60,518 | 10.5%), and Two or more Races (34,024 | 5.9%).
| Race | # Population | % Population |
| Asian | 4,717 | 0.8% |
| Black / African American | 4,891 | 0.9% |
| Hawaiian / Pacific | 636 | 0.1% |
| Hispanic or Latino | 60,518 | 10.5% |
| Native / Alaskan | 12,359 | 2.1% |
| White / Caucasian | 504,798 | 87.4% |
| Two or more Races | 34,024 | 5.9% |
| Some other Race | 16,504 | 2.9% |
| Total | 577,929 | 100.0% |
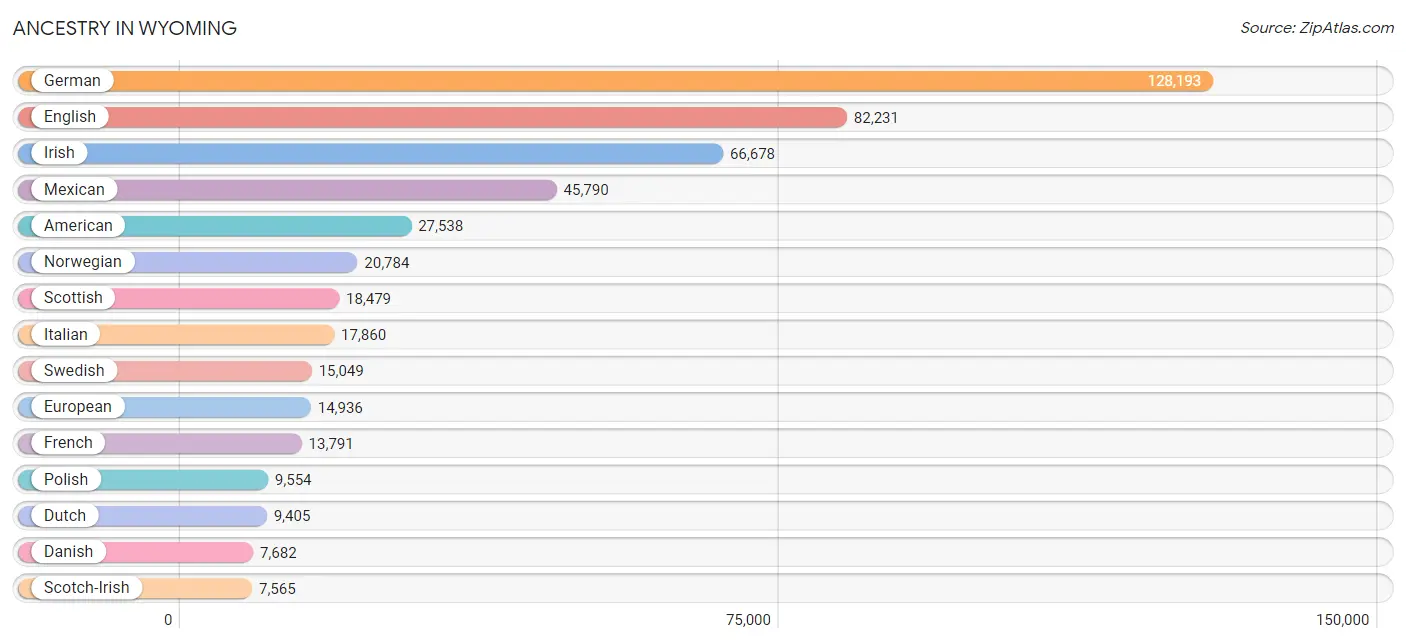
Ancestry in Wyoming
The most populous ancestries reported in Wyoming are German (128,193 | 22.2%), English (82,231 | 14.2%), Irish (66,678 | 11.5%), Mexican (45,790 | 7.9%), and American (27,538 | 4.8%), together accounting for 60.6% of all Wyoming residents.
| Ancestry | # Population | % Population |
| African | 467 | 0.1% |
| Alaska Native | 15 | 0.0% |
| Alaskan Athabascan | 8 | 0.0% |
| Albanian | 60 | 0.0% |
| Aleut | 11 | 0.0% |
| American | 27,538 | 4.8% |
| Apache | 854 | 0.2% |
| Arab | 560 | 0.1% |
| Arapaho | 4,917 | 0.9% |
| Argentinean | 68 | 0.0% |
| Armenian | 123 | 0.0% |
| Australian | 124 | 0.0% |
| Austrian | 1,563 | 0.3% |
| Bahamian | 21 | 0.0% |
| Bangladeshi | 7 | 0.0% |
| Barbadian | 42 | 0.0% |
| Basque | 676 | 0.1% |
| Belgian | 1,512 | 0.3% |
| Belizean | 73 | 0.0% |
| Bhutanese | 1,663 | 0.3% |
| Blackfeet | 298 | 0.1% |
| Bolivian | 37 | 0.0% |
| Brazilian | 18 | 0.0% |
| British | 4,553 | 0.8% |
| Bulgarian | 21 | 0.0% |
| Burmese | 913 | 0.2% |
| Cajun | 123 | 0.0% |
| Canadian | 1,436 | 0.3% |
| Celtic | 124 | 0.0% |
| Central American | 1,010 | 0.2% |
| Central American Indian | 288 | 0.1% |
| Cherokee | 1,889 | 0.3% |
| Cheyenne | 383 | 0.1% |
| Chickasaw | 36 | 0.0% |
| Chilean | 149 | 0.0% |
| Chinese | 55 | 0.0% |
| Chippewa | 445 | 0.1% |
| Choctaw | 423 | 0.1% |
| Colombian | 579 | 0.1% |
| Colville | 11 | 0.0% |
| Comanche | 48 | 0.0% |
| Costa Rican | 28 | 0.0% |
| Cree | 130 | 0.0% |
| Creek | 165 | 0.0% |
| Croatian | 629 | 0.1% |
| Crow | 282 | 0.1% |
| Cuban | 342 | 0.1% |
| Czech | 3,091 | 0.5% |
| Czechoslovakian | 481 | 0.1% |
| Danish | 7,682 | 1.3% |
| Dominican | 52 | 0.0% |
| Dutch | 9,405 | 1.6% |
| Dutch West Indian | 7 | 0.0% |
| Eastern European | 1,187 | 0.2% |
| Ecuadorian | 49 | 0.0% |
| Egyptian | 49 | 0.0% |
| English | 82,231 | 14.2% |
| Estonian | 69 | 0.0% |
| Ethiopian | 23 | 0.0% |
| European | 14,936 | 2.6% |
| Filipino | 80 | 0.0% |
| Finnish | 2,039 | 0.4% |
| French | 13,791 | 2.4% |
| French American Indian | 43 | 0.0% |
| French Canadian | 2,724 | 0.5% |
| German | 128,193 | 22.2% |
| German Russian | 74 | 0.0% |
| Ghanaian | 62 | 0.0% |
| Greek | 1,752 | 0.3% |
| Guamanian / Chamorro | 180 | 0.0% |
| Guatemalan | 533 | 0.1% |
| Haitian | 15 | 0.0% |
| Honduran | 41 | 0.0% |
| Hopi | 52 | 0.0% |
| Hungarian | 1,388 | 0.2% |
| Icelander | 220 | 0.0% |
| Indian (Asian) | 1,800 | 0.3% |
| Indonesian | 10 | 0.0% |
| Inupiat | 32 | 0.0% |
| Iranian | 88 | 0.0% |
| Irish | 66,678 | 11.5% |
| Iroquois | 74 | 0.0% |
| Israeli | 21 | 0.0% |
| Italian | 17,860 | 3.1% |
| Jamaican | 98 | 0.0% |
| Japanese | 13 | 0.0% |
| Jordanian | 15 | 0.0% |
| Kenyan | 148 | 0.0% |
| Korean | 2,222 | 0.4% |
| Laotian | 31 | 0.0% |
| Latvian | 258 | 0.0% |
| Lebanese | 130 | 0.0% |
| Liberian | 82 | 0.0% |
| Lithuanian | 797 | 0.1% |
| Luxembourger | 16 | 0.0% |
| Macedonian | 5 | 0.0% |
| Malaysian | 8 | 0.0% |
| Maltese | 11 | 0.0% |
| Mexican | 45,790 | 7.9% |
| Mexican American Indian | 631 | 0.1% |
| Mongolian | 83 | 0.0% |
| Moroccan | 40 | 0.0% |
| Native Hawaiian | 729 | 0.1% |
| Navajo | 868 | 0.2% |
| New Zealander | 29 | 0.0% |
| Nicaraguan | 72 | 0.0% |
| Nigerian | 234 | 0.0% |
| Northern European | 1,622 | 0.3% |
| Norwegian | 20,784 | 3.6% |
| Osage | 148 | 0.0% |
| Ottawa | 33 | 0.0% |
| Paiute | 11 | 0.0% |
| Pakistani | 322 | 0.1% |
| Palestinian | 1 | 0.0% |
| Panamanian | 198 | 0.0% |
| Pennsylvania German | 283 | 0.1% |
| Peruvian | 374 | 0.1% |
| Pima | 36 | 0.0% |
| Polish | 9,554 | 1.7% |
| Portuguese | 1,398 | 0.2% |
| Potawatomi | 45 | 0.0% |
| Pueblo | 120 | 0.0% |
| Puerto Rican | 1,549 | 0.3% |
| Romanian | 388 | 0.1% |
| Russian | 3,709 | 0.6% |
| Salvadoran | 138 | 0.0% |
| Samoan | 209 | 0.0% |
| Scandinavian | 6,466 | 1.1% |
| Scotch-Irish | 7,565 | 1.3% |
| Scottish | 18,479 | 3.2% |
| Seminole | 25 | 0.0% |
| Senegalese | 56 | 0.0% |
| Serbian | 244 | 0.0% |
| Shoshone | 3,542 | 0.6% |
| Sioux | 1,889 | 0.3% |
| Slavic | 663 | 0.1% |
| Slovak | 394 | 0.1% |
| Slovene | 404 | 0.1% |
| Somali | 26 | 0.0% |
| South African | 39 | 0.0% |
| South American | 1,730 | 0.3% |
| South American Indian | 6 | 0.0% |
| Spaniard | 2,304 | 0.4% |
| Spanish | 3,446 | 0.6% |
| Spanish American | 295 | 0.1% |
| Sri Lankan | 403 | 0.1% |
| Subsaharan African | 1,191 | 0.2% |
| Sudanese | 3 | 0.0% |
| Swedish | 15,049 | 2.6% |
| Swiss | 2,453 | 0.4% |
| Syrian | 19 | 0.0% |
| Thai | 950 | 0.2% |
| Tlingit-Haida | 63 | 0.0% |
| Tohono O'Odham | 12 | 0.0% |
| Tongan | 54 | 0.0% |
| Trinidadian and Tobagonian | 11 | 0.0% |
| Turkish | 116 | 0.0% |
| Ugandan | 36 | 0.0% |
| Ukrainian | 1,161 | 0.2% |
| Ute | 96 | 0.0% |
| Venezuelan | 403 | 0.1% |
| Vietnamese | 40 | 0.0% |
| Welsh | 6,312 | 1.1% |
| West Indian | 12 | 0.0% |
| Yakama | 13 | 0.0% |
| Yaqui | 18 | 0.0% |
| Yugoslavian | 873 | 0.2% |
| Yuman | 15 | 0.0% |
| Yup'ik | 11 | 0.0% | View All 169 Rows |
Immigrants in Wyoming
The most numerous immigrant groups reported in Wyoming came from Latin America (10,306 | 1.8%), Central America (9,029 | 1.6%), Mexico (8,470 | 1.5%), Europe (3,813 | 0.7%), and Asia (3,582 | 0.6%), together accounting for 6.1% of all Wyoming residents.

| Immigration Origin | # Population | % Population |
| Africa | 684 | 0.1% |
| Albania | 46 | 0.0% |
| Argentina | 66 | 0.0% |
| Asia | 3,582 | 0.6% |
| Australia | 146 | 0.0% |
| Austria | 107 | 0.0% |
| Azores | 7 | 0.0% |
| Bahamas | 21 | 0.0% |
| Bangladesh | 66 | 0.0% |
| Belgium | 30 | 0.0% |
| Bolivia | 3 | 0.0% |
| Bosnia and Herzegovina | 6 | 0.0% |
| Brazil | 26 | 0.0% |
| Bulgaria | 32 | 0.0% |
| Cambodia | 7 | 0.0% |
| Canada | 1,139 | 0.2% |
| Caribbean | 128 | 0.0% |
| Central America | 9,029 | 1.6% |
| Chile | 103 | 0.0% |
| China | 972 | 0.2% |
| Colombia | 284 | 0.1% |
| Costa Rica | 32 | 0.0% |
| Croatia | 35 | 0.0% |
| Cuba | 71 | 0.0% |
| Czechoslovakia | 24 | 0.0% |
| Denmark | 43 | 0.0% |
| Dominican Republic | 5 | 0.0% |
| Eastern Africa | 242 | 0.0% |
| Eastern Asia | 1,428 | 0.3% |
| Eastern Europe | 1,358 | 0.2% |
| Ecuador | 33 | 0.0% |
| Egypt | 52 | 0.0% |
| El Salvador | 105 | 0.0% |
| England | 514 | 0.1% |
| Ethiopia | 3 | 0.0% |
| Europe | 3,813 | 0.7% |
| Fiji | 9 | 0.0% |
| France | 132 | 0.0% |
| Germany | 696 | 0.1% |
| Ghana | 44 | 0.0% |
| Greece | 42 | 0.0% |
| Guatemala | 323 | 0.1% |
| Haiti | 10 | 0.0% |
| Honduras | 22 | 0.0% |
| Hong Kong | 44 | 0.0% |
| Hungary | 16 | 0.0% |
| India | 431 | 0.1% |
| Indonesia | 52 | 0.0% |
| Iran | 131 | 0.0% |
| Ireland | 79 | 0.0% |
| Italy | 108 | 0.0% |
| Jamaica | 19 | 0.0% |
| Japan | 166 | 0.0% |
| Jordan | 15 | 0.0% |
| Kenya | 61 | 0.0% |
| Korea | 290 | 0.1% |
| Latin America | 10,306 | 1.8% |
| Malaysia | 16 | 0.0% |
| Mexico | 8,470 | 1.5% |
| Moldova | 2 | 0.0% |
| Morocco | 21 | 0.0% |
| Nepal | 96 | 0.0% |
| Netherlands | 61 | 0.0% |
| Nicaragua | 26 | 0.0% |
| Nigeria | 132 | 0.0% |
| Northern Africa | 112 | 0.0% |
| Northern Europe | 1,045 | 0.2% |
| Norway | 12 | 0.0% |
| Oceania | 232 | 0.0% |
| Pakistan | 25 | 0.0% |
| Panama | 51 | 0.0% |
| Peru | 331 | 0.1% |
| Philippines | 712 | 0.1% |
| Poland | 141 | 0.0% |
| Portugal | 15 | 0.0% |
| Romania | 176 | 0.0% |
| Russia | 378 | 0.1% |
| Saudi Arabia | 25 | 0.0% |
| Scotland | 41 | 0.0% |
| Senegal | 26 | 0.0% |
| Serbia | 20 | 0.0% |
| Somalia | 26 | 0.0% |
| South Africa | 85 | 0.0% |
| South America | 1,149 | 0.2% |
| South Central Asia | 839 | 0.2% |
| South Eastern Asia | 1,192 | 0.2% |
| Southern Europe | 284 | 0.1% |
| Spain | 119 | 0.0% |
| Sri Lanka | 89 | 0.0% |
| Sudan | 7 | 0.0% |
| Sweden | 63 | 0.0% |
| Switzerland | 100 | 0.0% |
| Taiwan | 84 | 0.0% |
| Thailand | 156 | 0.0% |
| Trinidad and Tobago | 2 | 0.0% |
| Turkey | 72 | 0.0% |
| Uganda | 114 | 0.0% |
| Ukraine | 390 | 0.1% |
| Venezuela | 303 | 0.1% |
| Vietnam | 202 | 0.0% |
| Western Africa | 212 | 0.0% |
| Western Asia | 123 | 0.0% |
| Western Europe | 1,126 | 0.2% | View All 103 Rows |
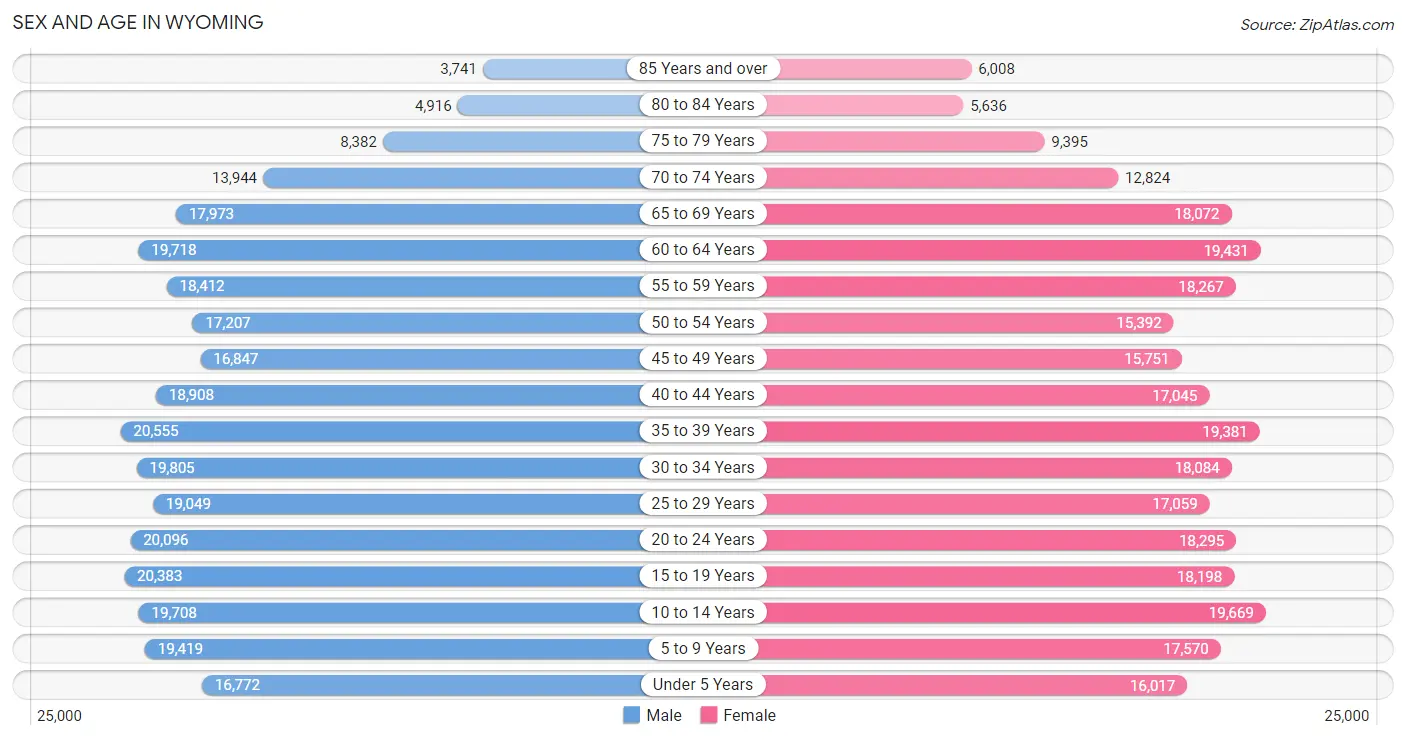
Sex and Age in Wyoming
Sex and Age in Wyoming
The most populous age groups in Wyoming are 35 to 39 Years (20,555 | 7.0%) for men and 10 to 14 Years (19,669 | 7.0%) for women.
| Age Bracket | Male | Female |
| Under 5 Years | 16,772 (5.7%) | 16,017 (5.7%) |
| 5 to 9 Years | 19,419 (6.6%) | 17,570 (6.2%) |
| 10 to 14 Years | 19,708 (6.7%) | 19,669 (7.0%) |
| 15 to 19 Years | 20,383 (6.9%) | 18,198 (6.5%) |
| 20 to 24 Years | 20,096 (6.8%) | 18,295 (6.5%) |
| 25 to 29 Years | 19,049 (6.4%) | 17,059 (6.0%) |
| 30 to 34 Years | 19,805 (6.7%) | 18,084 (6.4%) |
| 35 to 39 Years | 20,555 (7.0%) | 19,381 (6.9%) |
| 40 to 44 Years | 18,908 (6.4%) | 17,045 (6.0%) |
| 45 to 49 Years | 16,847 (5.7%) | 15,751 (5.6%) |
| 50 to 54 Years | 17,207 (5.8%) | 15,392 (5.5%) |
| 55 to 59 Years | 18,412 (6.2%) | 18,267 (6.5%) |
| 60 to 64 Years | 19,718 (6.7%) | 19,431 (6.9%) |
| 65 to 69 Years | 17,973 (6.1%) | 18,072 (6.4%) |
| 70 to 74 Years | 13,944 (4.7%) | 12,824 (4.5%) |
| 75 to 79 Years | 8,382 (2.8%) | 9,395 (3.3%) |
| 80 to 84 Years | 4,916 (1.7%) | 5,636 (2.0%) |
| 85 Years and over | 3,741 (1.3%) | 6,008 (2.1%) |
| Total | 295,835 (100.0%) | 282,094 (100.0%) |
Families and Households in Wyoming
Median Family Size in Wyoming
The median family size in Wyoming is 3.02 persons per family, with married-couple families (118,766 | 80.5%) accounting for the largest median family size of 3.05 persons per family. On the other hand, single male/father families (10,467 | 7.1%) represent the smallest median family size with 2.70 persons per family.
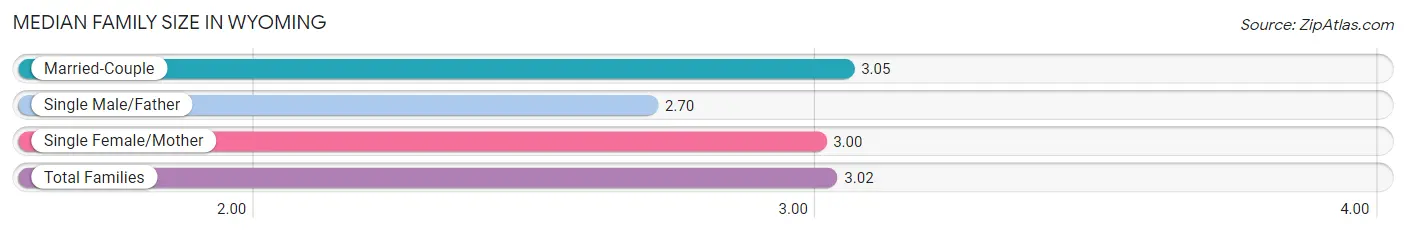
| Family Type | # Families | Family Size |
| Married-Couple | 118,766 (80.5%) | 3.05 |
| Single Male/Father | 10,467 (7.1%) | 2.70 |
| Single Female/Mother | 18,247 (12.4%) | 3.00 |
| Total Families | 147,480 (100.0%) | 3.02 |
Median Household Size in Wyoming
The median household size in Wyoming is 2.41 persons per household, with single female/mother households (18,247 | 7.8%) accounting for the largest median household size of 3.32 persons per household. non-family households (86,676 | 37.0%) represent the smallest median household size with 1.24 persons per household.

| Household Type | # Households | Household Size |
| Married-Couple | 118,766 (50.7%) | 3.07 |
| Single Male/Father | 10,467 (4.5%) | 3.06 |
| Single Female/Mother | 18,247 (7.8%) | 3.32 |
| Non-family | 86,676 (37.0%) | 1.24 |
| Total Households | 234,156 (100.0%) | 2.41 |
Household Size by Marriage Status in Wyoming
Out of a total of 234,156 households in Wyoming, 147,480 (63.0%) are family households, while 86,676 (37.0%) are nonfamily households. The most numerous type of family households are 2-person households, comprising 72,882, and the most common type of nonfamily households are 1-person households, comprising 70,996.
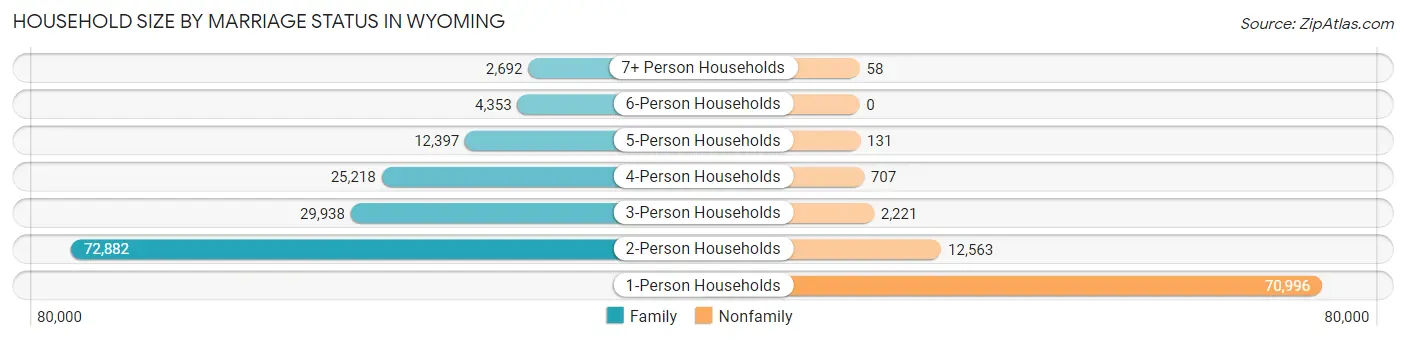
| Household Size | Family Households | Nonfamily Households |
| 1-Person Households | - | 70,996 (30.3%) |
| 2-Person Households | 72,882 (31.1%) | 12,563 (5.4%) |
| 3-Person Households | 29,938 (12.8%) | 2,221 (0.9%) |
| 4-Person Households | 25,218 (10.8%) | 707 (0.3%) |
| 5-Person Households | 12,397 (5.3%) | 131 (0.1%) |
| 6-Person Households | 4,353 (1.9%) | 0 (0.0%) |
| 7+ Person Households | 2,692 (1.1%) | 58 (0.0%) |
| Total | 147,480 (63.0%) | 86,676 (37.0%) |
Female Fertility in Wyoming
Fertility by Age in Wyoming
Average fertility rate in Wyoming is 62.0 births per 1,000 women. Women in the age bracket of 20 to 34 years have the highest fertility rate with 112.0 births per 1,000 women. Women in the age bracket of 20 to 34 years acount for 75.4% of all women with births.

| Age Bracket | Women with Births | Births / 1,000 Women |
| 15 to 19 years | 445 (5.6%) | 24.0 |
| 20 to 34 years | 5,995 (75.4%) | 112.0 |
| 35 to 50 years | 1,515 (19.0%) | 27.0 |
| Total | 7,955 (100.0%) | 62.0 |
Fertility by Age by Marriage Status in Wyoming
73.5% of women with births (7,955) in Wyoming are married. The highest percentage of unmarried women with births falls into 15 to 19 years age bracket with 94.2% of them unmarried at the time of birth, while the lowest percentage of unmarried women with births belong to 35 to 50 years age bracket with 16.6% of them unmarried.
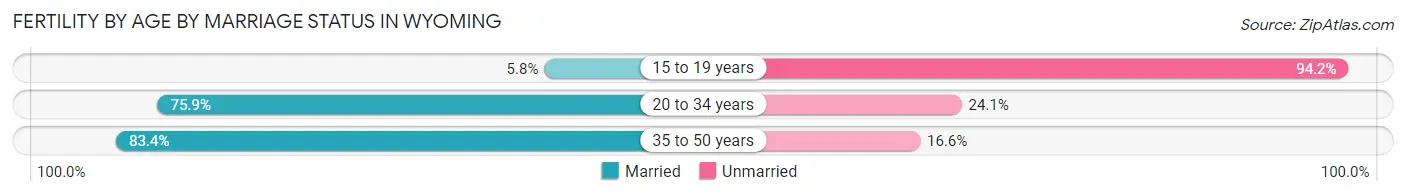
| Age Bracket | Married | Unmarried |
| 15 to 19 years | 26 (5.8%) | 419 (94.2%) |
| 20 to 34 years | 4,550 (75.9%) | 1,445 (24.1%) |
| 35 to 50 years | 1,264 (83.4%) | 251 (16.6%) |
| Total | 5,847 (73.5%) | 2,108 (26.5%) |
Fertility by Education in Wyoming
Average fertility rate in Wyoming is 62.0 births per 1,000 women. Women with the education attainment of high school diploma have the highest fertility rate of 80.0 births per 1,000 women, while women with the education attainment of less than high school have the lowest fertility at 43.0 births per 1,000 women. Women with the education attainment of college or associate's degree represent 31.1% of all women with births.
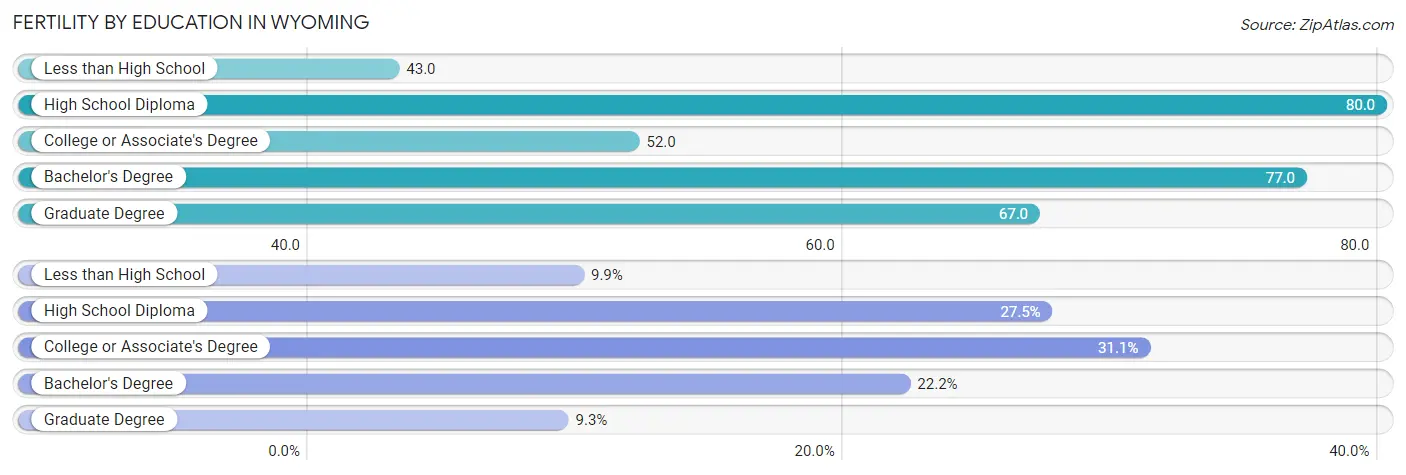
| Educational Attainment | Women with Births | Births / 1,000 Women |
| Less than High School | 789 (9.9%) | 43.0 |
| High School Diploma | 2,185 (27.5%) | 80.0 |
| College or Associate's Degree | 2,476 (31.1%) | 52.0 |
| Bachelor's Degree | 1,762 (22.2%) | 77.0 |
| Graduate Degree | 743 (9.3%) | 67.0 |
| Total | 7,955 (100.0%) | 62.0 |
Fertility by Education by Marriage Status in Wyoming
26.5% of women with births in Wyoming are unmarried. Women with the educational attainment of bachelor's degree are most likely to be married with 92.7% of them married at childbirth, while women with the educational attainment of less than high school are least likely to be married with 51.1% of them unmarried at childbirth.
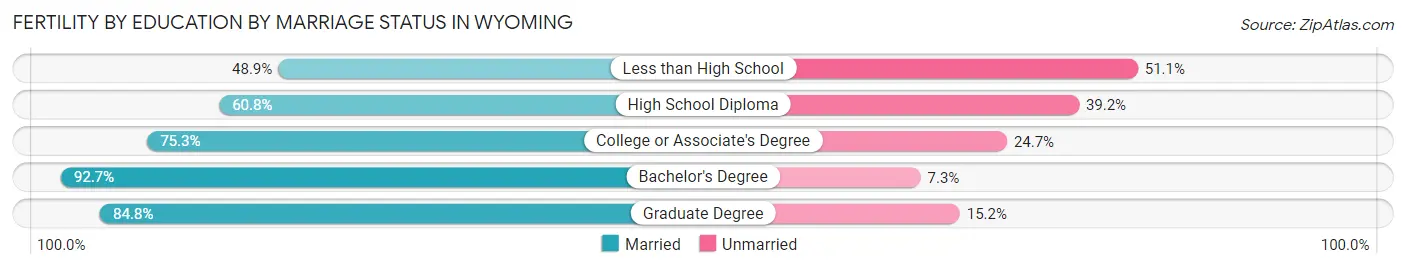
| Educational Attainment | Married | Unmarried |
| Less than High School | 386 (48.9%) | 403 (51.1%) |
| High School Diploma | 1,328 (60.8%) | 857 (39.2%) |
| College or Associate's Degree | 1,864 (75.3%) | 612 (24.7%) |
| Bachelor's Degree | 1,633 (92.7%) | 129 (7.3%) |
| Graduate Degree | 630 (84.8%) | 113 (15.2%) |
| Total | 5,847 (73.5%) | 2,108 (26.5%) |
Employment Characteristics in Wyoming
Employment by Class of Employer in Wyoming
Among the 284,555 employed individuals in Wyoming, private company employees (168,317 | 59.2%), local government employees (29,773 | 10.5%), and not-for-profit organizations (19,520 | 6.9%) make up the most common classes of employment.
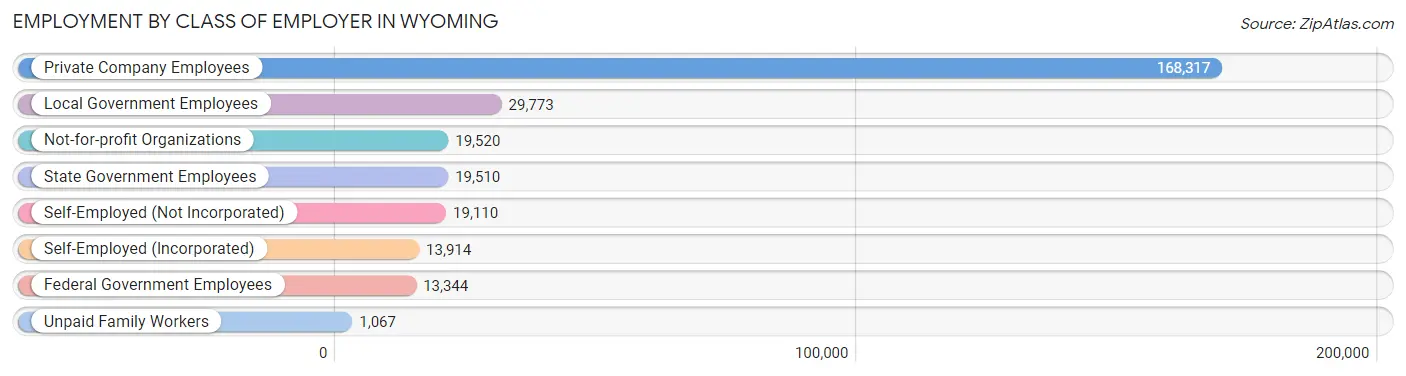
| Employer Class | # Employees | % Employees |
| Private Company Employees | 168,317 | 59.2% |
| Self-Employed (Incorporated) | 13,914 | 4.9% |
| Self-Employed (Not Incorporated) | 19,110 | 6.7% |
| Not-for-profit Organizations | 19,520 | 6.9% |
| Local Government Employees | 29,773 | 10.5% |
| State Government Employees | 19,510 | 6.9% |
| Federal Government Employees | 13,344 | 4.7% |
| Unpaid Family Workers | 1,067 | 0.4% |
| Total | 284,555 | 100.0% |
Employment Status by Age in Wyoming
According to the labor force statistics for Wyoming, out of the total population over 16 years of age (460,637), 65.7% or 302,639 individuals are in the labor force, with 3.8% or 11,500 of them unemployed. The age group with the highest labor force participation rate is 35 to 44 years, with 87.0% or 66,023 individuals in the labor force. Within the labor force, the 16 to 19 years age range has the highest percentage of unemployed individuals, with 13.2% or 1,997 of them being unemployed.

| Age Bracket | In Labor Force | Unemployed |
| 16 to 19 Years | 15,131 (49.7%) | 1,997 (13.2%) |
| 20 to 24 Years | 31,135 (81.1%) | 2,117 (6.8%) |
| 25 to 29 Years | 30,186 (83.6%) | 1,057 (3.5%) |
| 30 to 34 Years | 32,660 (86.2%) | 1,078 (3.3%) |
| 35 to 44 Years | 66,023 (87.0%) | 1,717 (2.6%) |
| 45 to 54 Years | 54,700 (83.9%) | 1,641 (3.0%) |
| 55 to 59 Years | 28,353 (77.3%) | 595 (2.1%) |
| 60 to 64 Years | 23,489 (60.0%) | 893 (3.8%) |
| 65 to 74 Years | 17,839 (28.4%) | 428 (2.4%) |
| 75 Years and over | 3,313 (8.7%) | 89 (2.7%) |
| Total | 302,639 (65.7%) | 11,500 (3.8%) |
Employment Status by Educational Attainment in Wyoming
According to labor force statistics for Wyoming, 80.9% of individuals (235,347) out of the total population between 25 and 64 years of age (290,911) are in the labor force, with 3.0% or 7,060 of them being unemployed. The group with the highest labor force participation rate are those with the educational attainment of bachelor's degree or higher, with 85.8% or 73,089 individuals in the labor force. Within the labor force, individuals with less than high school education have the highest percentage of unemployment, with 8.3% or 949 of them being unemployed.
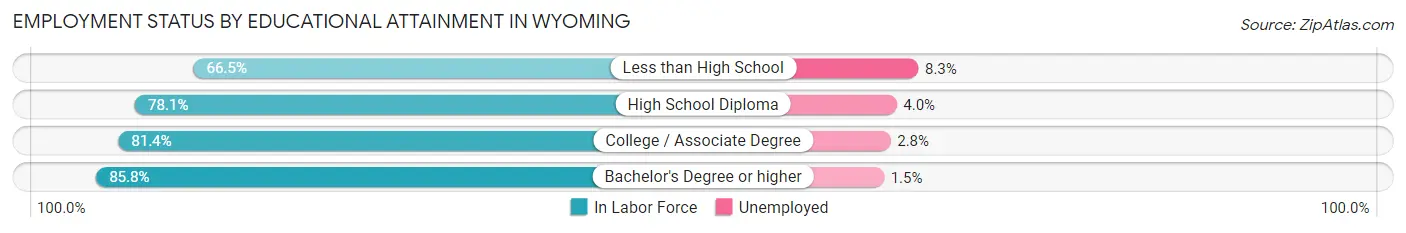
| Educational Attainment | In Labor Force | Unemployed |
| Less than High School | 11,435 (66.5%) | 1,427 (8.3%) |
| High School Diploma | 61,483 (78.1%) | 3,149 (4.0%) |
| College / Associate Degree | 89,382 (81.4%) | 3,075 (2.8%) |
| Bachelor's Degree or higher | 73,089 (85.8%) | 1,278 (1.5%) |
| Total | 235,347 (80.9%) | 8,727 (3.0%) |
Employment Occupations by Sex in Wyoming
Management, Business, Science and Arts Occupations
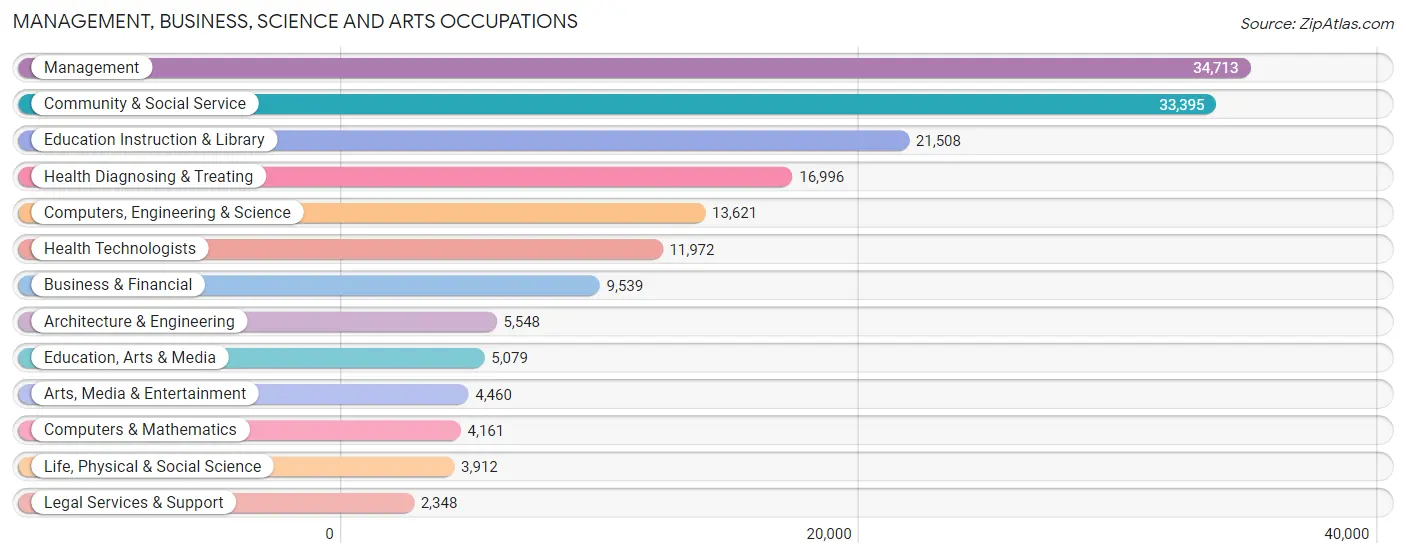
The most common Management, Business, Science and Arts occupations in Wyoming are Management (34,713 | 12.1%), Community & Social Service (33,395 | 11.6%), Education Instruction & Library (21,508 | 7.5%), Health Diagnosing & Treating (16,996 | 5.9%), and Computers, Engineering & Science (13,621 | 4.7%).
Management, Business, Science and Arts Occupations by Sex
Within the Management, Business, Science and Arts occupations in Wyoming, the most male-oriented occupations are Architecture & Engineering (86.6%), Computers, Engineering & Science (74.4%), and Computers & Mathematics (73.9%), while the most female-oriented occupations are Health Diagnosing & Treating (74.5%), Health Technologists (73.7%), and Education Instruction & Library (69.9%).
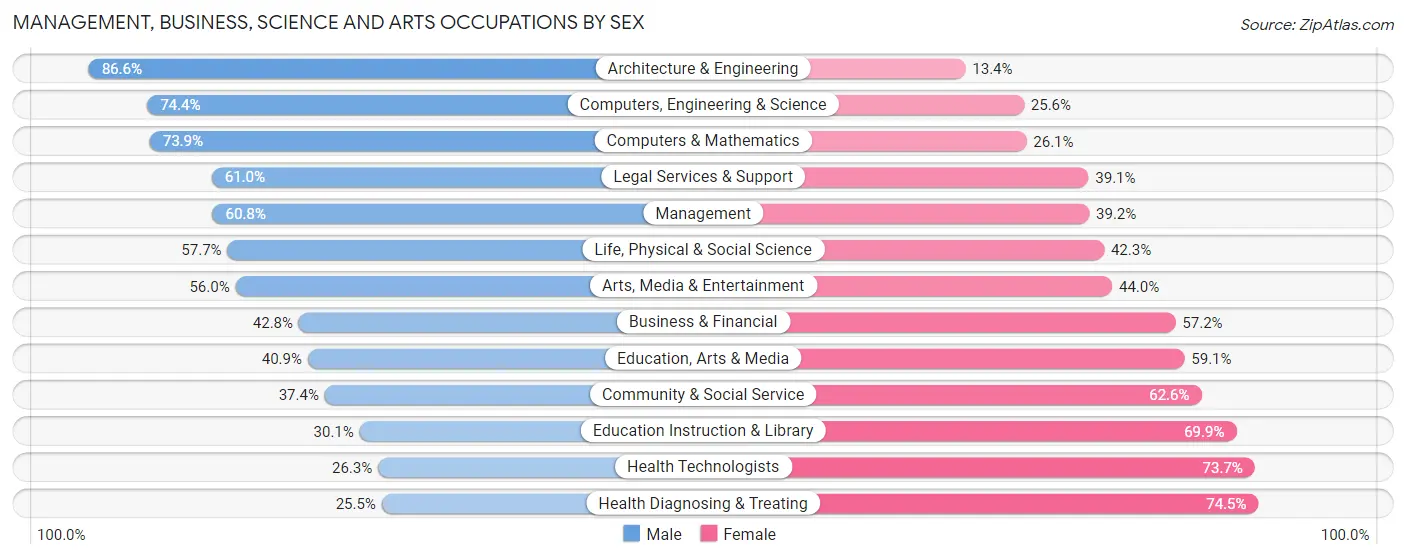
| Occupation | Male | Female |
| Management | 21,102 (60.8%) | 13,611 (39.2%) |
| Business & Financial | 4,082 (42.8%) | 5,457 (57.2%) |
| Computers, Engineering & Science | 10,136 (74.4%) | 3,485 (25.6%) |
| Computers & Mathematics | 3,074 (73.9%) | 1,087 (26.1%) |
| Architecture & Engineering | 4,805 (86.6%) | 743 (13.4%) |
| Life, Physical & Social Science | 2,257 (57.7%) | 1,655 (42.3%) |
| Community & Social Service | 12,485 (37.4%) | 20,910 (62.6%) |
| Education, Arts & Media | 2,079 (40.9%) | 3,000 (59.1%) |
| Legal Services & Support | 1,431 (61.0%) | 917 (39.1%) |
| Education Instruction & Library | 6,477 (30.1%) | 15,031 (69.9%) |
| Arts, Media & Entertainment | 2,498 (56.0%) | 1,962 (44.0%) |
| Health Diagnosing & Treating | 4,335 (25.5%) | 12,661 (74.5%) |
| Health Technologists | 3,145 (26.3%) | 8,827 (73.7%) |
| Total (Category) | 52,140 (48.2%) | 56,124 (51.8%) |
| Total (Overall) | 157,015 (54.5%) | 130,880 (45.5%) |
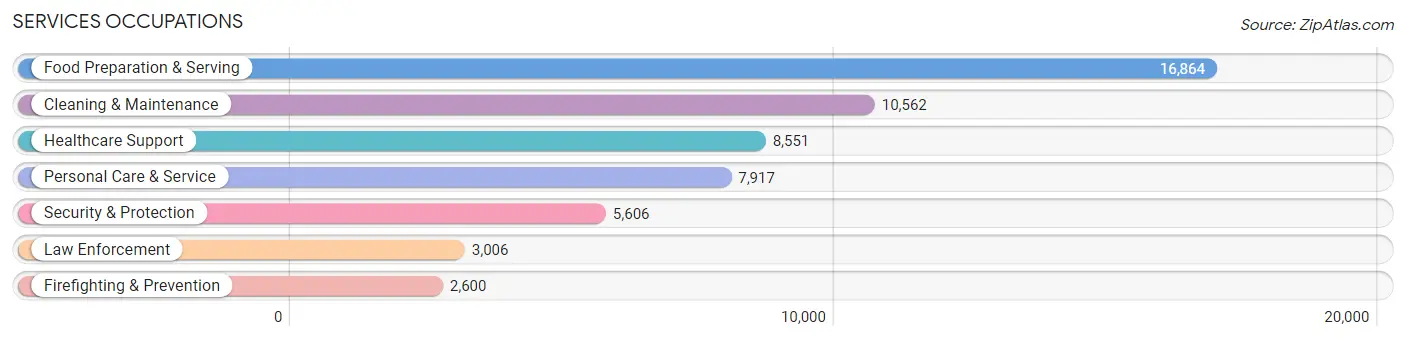
Services Occupations
The most common Services occupations in Wyoming are Food Preparation & Serving (16,864 | 5.9%), Cleaning & Maintenance (10,562 | 3.7%), Healthcare Support (8,551 | 3.0%), Personal Care & Service (7,917 | 2.8%), and Security & Protection (5,606 | 1.9%).
Services Occupations by Sex
Within the Services occupations in Wyoming, the most male-oriented occupations are Law Enforcement (81.9%), Security & Protection (76.9%), and Firefighting & Prevention (71.1%), while the most female-oriented occupations are Healthcare Support (92.0%), Personal Care & Service (75.5%), and Food Preparation & Serving (58.0%).
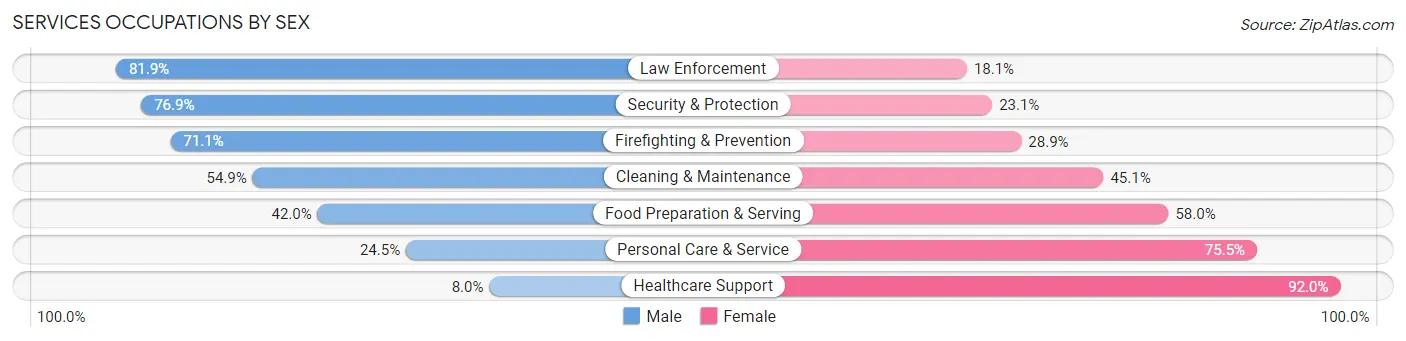
| Occupation | Male | Female |
| Healthcare Support | 682 (8.0%) | 7,869 (92.0%) |
| Security & Protection | 4,311 (76.9%) | 1,295 (23.1%) |
| Firefighting & Prevention | 1,849 (71.1%) | 751 (28.9%) |
| Law Enforcement | 2,462 (81.9%) | 544 (18.1%) |
| Food Preparation & Serving | 7,082 (42.0%) | 9,782 (58.0%) |
| Cleaning & Maintenance | 5,794 (54.9%) | 4,768 (45.1%) |
| Personal Care & Service | 1,938 (24.5%) | 5,979 (75.5%) |
| Total (Category) | 19,807 (40.0%) | 29,693 (60.0%) |
| Total (Overall) | 157,015 (54.5%) | 130,880 (45.5%) |
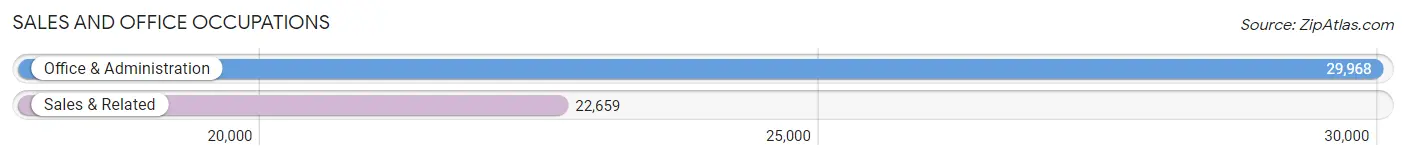
Sales and Office Occupations
The most common Sales and Office occupations in Wyoming are Office & Administration (29,968 | 10.4%), and Sales & Related (22,659 | 7.9%).
Sales and Office Occupations by Sex

| Occupation | Male | Female |
| Sales & Related | 10,680 (47.1%) | 11,979 (52.9%) |
| Office & Administration | 5,721 (19.1%) | 24,247 (80.9%) |
| Total (Category) | 16,401 (31.2%) | 36,226 (68.8%) |
| Total (Overall) | 157,015 (54.5%) | 130,880 (45.5%) |
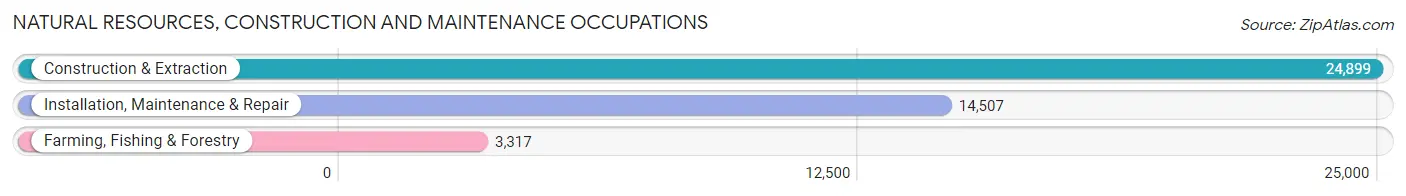
Natural Resources, Construction and Maintenance Occupations
The most common Natural Resources, Construction and Maintenance occupations in Wyoming are Construction & Extraction (24,899 | 8.6%), Installation, Maintenance & Repair (14,507 | 5.0%), and Farming, Fishing & Forestry (3,317 | 1.1%).
Natural Resources, Construction and Maintenance Occupations by Sex
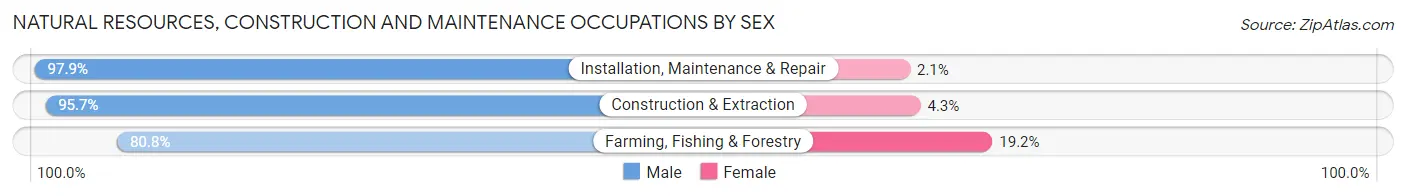
| Occupation | Male | Female |
| Farming, Fishing & Forestry | 2,679 (80.8%) | 638 (19.2%) |
| Construction & Extraction | 23,831 (95.7%) | 1,068 (4.3%) |
| Installation, Maintenance & Repair | 14,203 (97.9%) | 304 (2.1%) |
| Total (Category) | 40,713 (95.3%) | 2,010 (4.7%) |
| Total (Overall) | 157,015 (54.5%) | 130,880 (45.5%) |
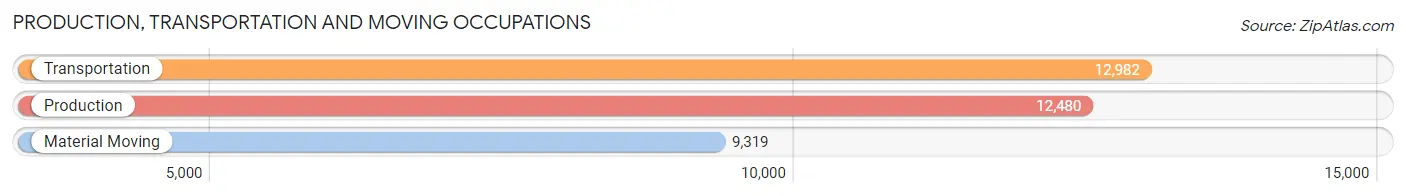
Production, Transportation and Moving Occupations
The most common Production, Transportation and Moving occupations in Wyoming are Transportation (12,982 | 4.5%), Production (12,480 | 4.3%), and Material Moving (9,319 | 3.2%).
Production, Transportation and Moving Occupations by Sex
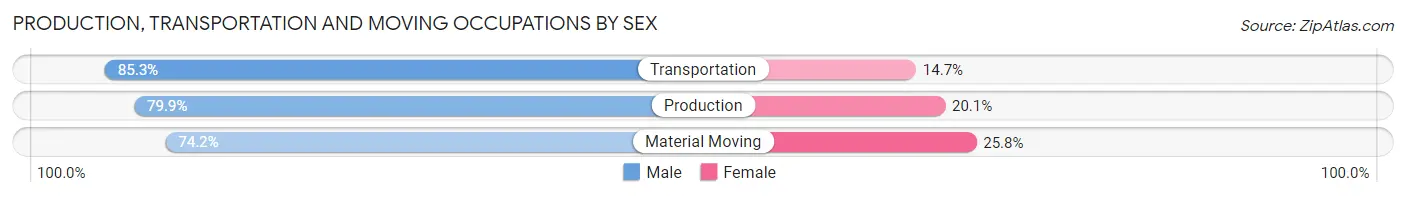
| Occupation | Male | Female |
| Production | 9,973 (79.9%) | 2,507 (20.1%) |
| Transportation | 11,069 (85.3%) | 1,913 (14.7%) |
| Material Moving | 6,912 (74.2%) | 2,407 (25.8%) |
| Total (Category) | 27,954 (80.4%) | 6,827 (19.6%) |
| Total (Overall) | 157,015 (54.5%) | 130,880 (45.5%) |
Employment Industries by Sex in Wyoming
Employment Industries in Wyoming
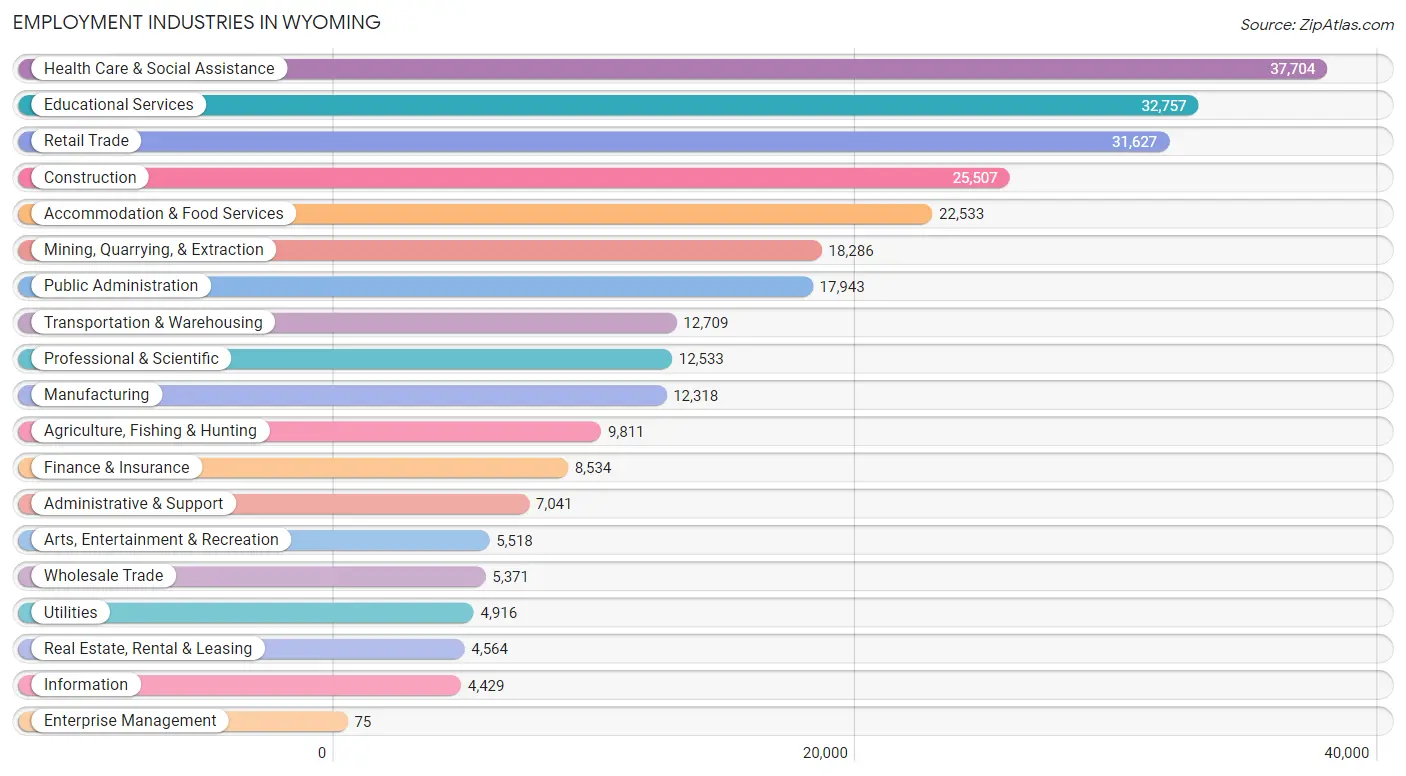
The major employment industries in Wyoming include Health Care & Social Assistance (37,704 | 13.1%), Educational Services (32,757 | 11.4%), Retail Trade (31,627 | 11.0%), Construction (25,507 | 8.9%), and Accommodation & Food Services (22,533 | 7.8%).
Employment Industries by Sex in Wyoming
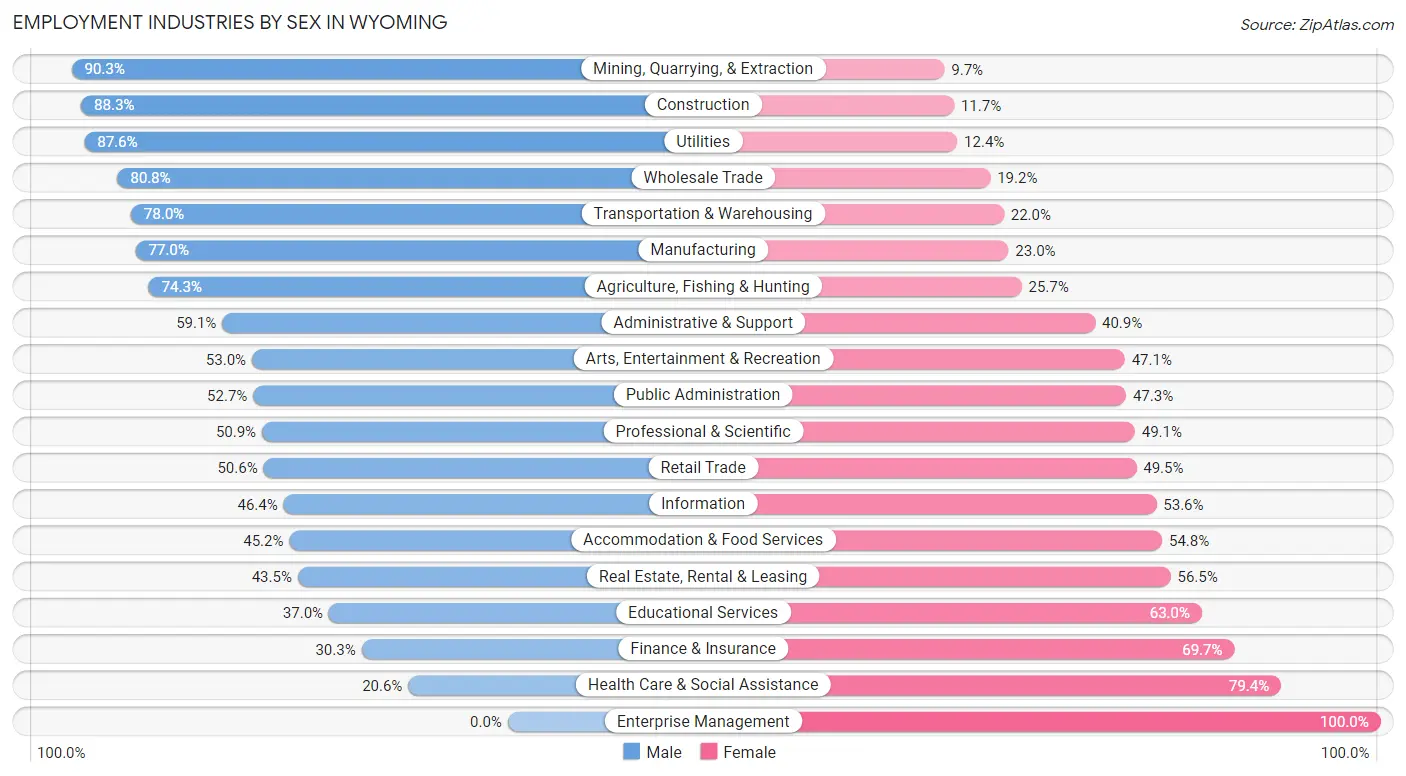
The Wyoming industries that see more men than women are Mining, Quarrying, & Extraction (90.3%), Construction (88.3%), and Utilities (87.6%), whereas the industries that tend to have a higher number of women are Enterprise Management (100.0%), Health Care & Social Assistance (79.4%), and Finance & Insurance (69.7%).
| Industry | Male | Female |
| Agriculture, Fishing & Hunting | 7,291 (74.3%) | 2,520 (25.7%) |
| Mining, Quarrying, & Extraction | 16,510 (90.3%) | 1,776 (9.7%) |
| Construction | 22,520 (88.3%) | 2,987 (11.7%) |
| Manufacturing | 9,489 (77.0%) | 2,829 (23.0%) |
| Wholesale Trade | 4,339 (80.8%) | 1,032 (19.2%) |
| Retail Trade | 15,986 (50.5%) | 15,641 (49.4%) |
| Transportation & Warehousing | 9,912 (78.0%) | 2,797 (22.0%) |
| Utilities | 4,308 (87.6%) | 608 (12.4%) |
| Information | 2,055 (46.4%) | 2,374 (53.6%) |
| Finance & Insurance | 2,583 (30.3%) | 5,951 (69.7%) |
| Real Estate, Rental & Leasing | 1,984 (43.5%) | 2,580 (56.5%) |
| Professional & Scientific | 6,375 (50.9%) | 6,158 (49.1%) |
| Enterprise Management | 0 (0.0%) | 75 (100.0%) |
| Administrative & Support | 4,161 (59.1%) | 2,880 (40.9%) |
| Educational Services | 12,122 (37.0%) | 20,635 (63.0%) |
| Health Care & Social Assistance | 7,768 (20.6%) | 29,936 (79.4%) |
| Arts, Entertainment & Recreation | 2,922 (52.9%) | 2,596 (47.0%) |
| Accommodation & Food Services | 10,189 (45.2%) | 12,344 (54.8%) |
| Public Administration | 9,455 (52.7%) | 8,488 (47.3%) |
| Total | 157,015 (54.5%) | 130,880 (45.5%) |
Education in Wyoming
School Enrollment in Wyoming
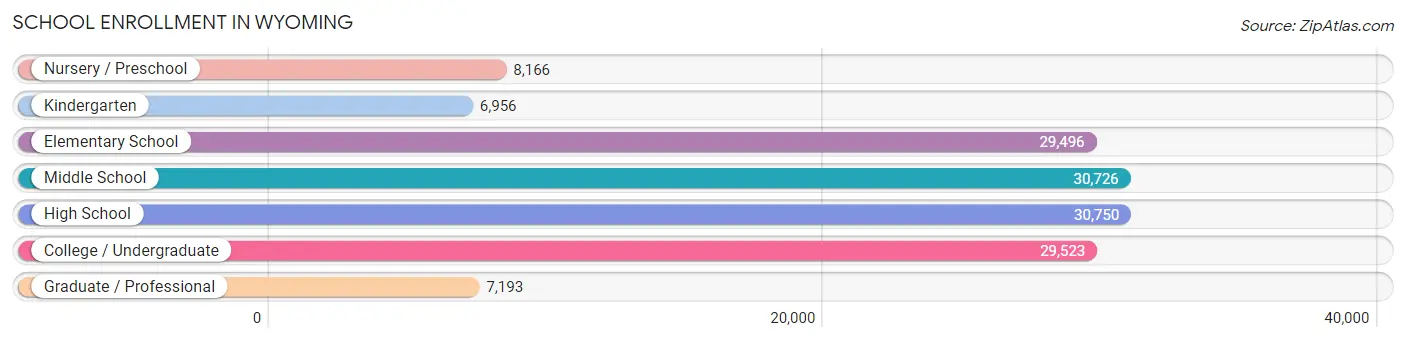
The most common levels of schooling among the 142,810 students in Wyoming are high school (30,750 | 21.5%), middle school (30,726 | 21.5%), and college / undergraduate (29,523 | 20.7%).
| School Level | # Students | % Students |
| Nursery / Preschool | 8,166 | 5.7% |
| Kindergarten | 6,956 | 4.9% |
| Elementary School | 29,496 | 20.6% |
| Middle School | 30,726 | 21.5% |
| High School | 30,750 | 21.5% |
| College / Undergraduate | 29,523 | 20.7% |
| Graduate / Professional | 7,193 | 5.0% |
| Total | 142,810 | 100.0% |
School Enrollment by Age by Funding Source in Wyoming
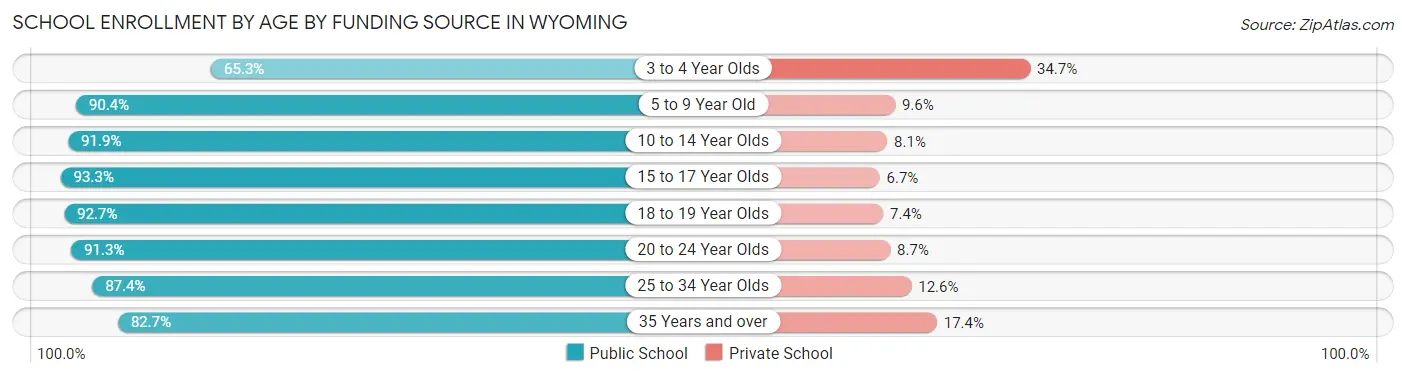
Out of a total of 142,810 students who are enrolled in schools in Wyoming, 14,424 (10.1%) attend a private institution, while the remaining 128,386 (89.9%) are enrolled in public schools. The age group of 3 to 4 year olds has the highest likelihood of being enrolled in private schools, with 1,986 (34.7% in the age bracket) enrolled. Conversely, the age group of 15 to 17 year olds has the lowest likelihood of being enrolled in a private school, with 20,768 (93.3% in the age bracket) attending a public institution.
| Age Bracket | Public School | Private School |
| 3 to 4 Year Olds | 3,736 (65.3%) | 1,986 (34.7%) |
| 5 to 9 Year Old | 31,396 (90.4%) | 3,320 (9.6%) |
| 10 to 14 Year Olds | 35,313 (91.9%) | 3,113 (8.1%) |
| 15 to 17 Year Olds | 20,768 (93.3%) | 1,490 (6.7%) |
| 18 to 19 Year Olds | 10,195 (92.6%) | 809 (7.3%) |
| 20 to 24 Year Olds | 12,715 (91.3%) | 1,205 (8.7%) |
| 25 to 34 Year Olds | 6,971 (87.4%) | 1,005 (12.6%) |
| 35 Years and over | 7,263 (82.7%) | 1,525 (17.3%) |
| Total | 128,386 (89.9%) | 14,424 (10.1%) |
Educational Attainment by Field of Study in Wyoming
Education (22,761 | 18.4%), business (16,646 | 13.5%), bio, nature & agricultural (14,124 | 11.4%), science & technology (13,223 | 10.7%), and arts & humanities (8,519 | 6.9%) are the most common fields of study among 123,411 individuals in Wyoming who have obtained a bachelor's degree or higher.
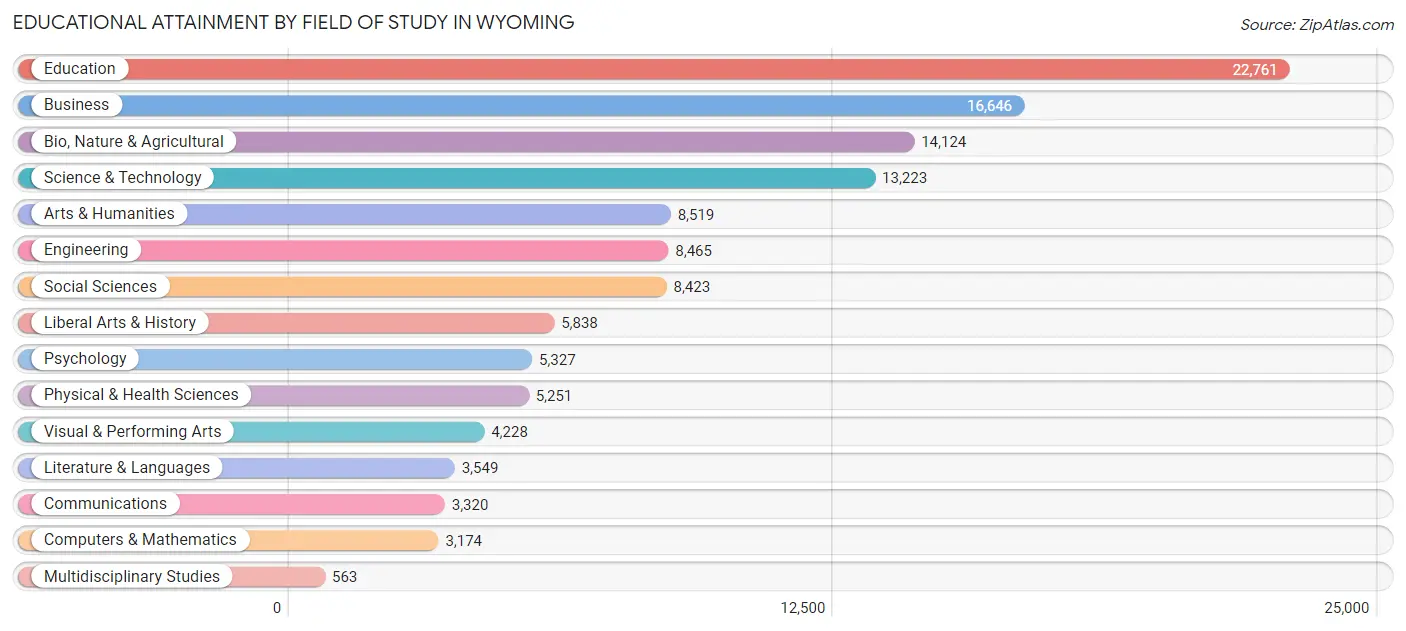
| Field of Study | # Graduates | % Graduates |
| Computers & Mathematics | 3,174 | 2.6% |
| Bio, Nature & Agricultural | 14,124 | 11.4% |
| Physical & Health Sciences | 5,251 | 4.3% |
| Psychology | 5,327 | 4.3% |
| Social Sciences | 8,423 | 6.8% |
| Engineering | 8,465 | 6.9% |
| Multidisciplinary Studies | 563 | 0.5% |
| Science & Technology | 13,223 | 10.7% |
| Business | 16,646 | 13.5% |
| Education | 22,761 | 18.4% |
| Literature & Languages | 3,549 | 2.9% |
| Liberal Arts & History | 5,838 | 4.7% |
| Visual & Performing Arts | 4,228 | 3.4% |
| Communications | 3,320 | 2.7% |
| Arts & Humanities | 8,519 | 6.9% |
| Total | 123,411 | 100.0% |
Transportation & Commute in Wyoming
Vehicle Availability by Sex in Wyoming
The most prevalent vehicle ownership categories in Wyoming are males with 2 vehicles (56,781, accounting for 36.8%) and females with 2 vehicles (45,290, making up 44.7%).
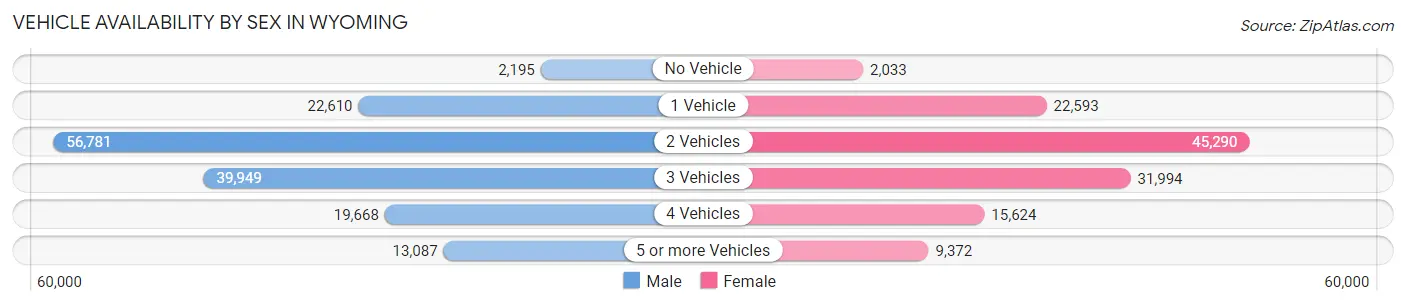
| Vehicles Available | Male | Female |
| No Vehicle | 2,195 (1.4%) | 2,033 (1.6%) |
| 1 Vehicle | 22,610 (14.6%) | 22,593 (17.8%) |
| 2 Vehicles | 56,781 (36.8%) | 45,290 (35.7%) |
| 3 Vehicles | 39,949 (25.9%) | 31,994 (25.2%) |
| 4 Vehicles | 19,668 (12.8%) | 15,624 (12.3%) |
| 5 or more Vehicles | 13,087 (8.5%) | 9,372 (7.4%) |
| Total | 154,290 (100.0%) | 126,906 (100.0%) |
Commute Time in Wyoming
The most frequently occuring commute durations in Wyoming are 5 to 9 minutes (62,542 commuters, 23.8%), 10 to 14 minutes (59,451 commuters, 22.6%), and 15 to 19 minutes (45,052 commuters, 17.2%).
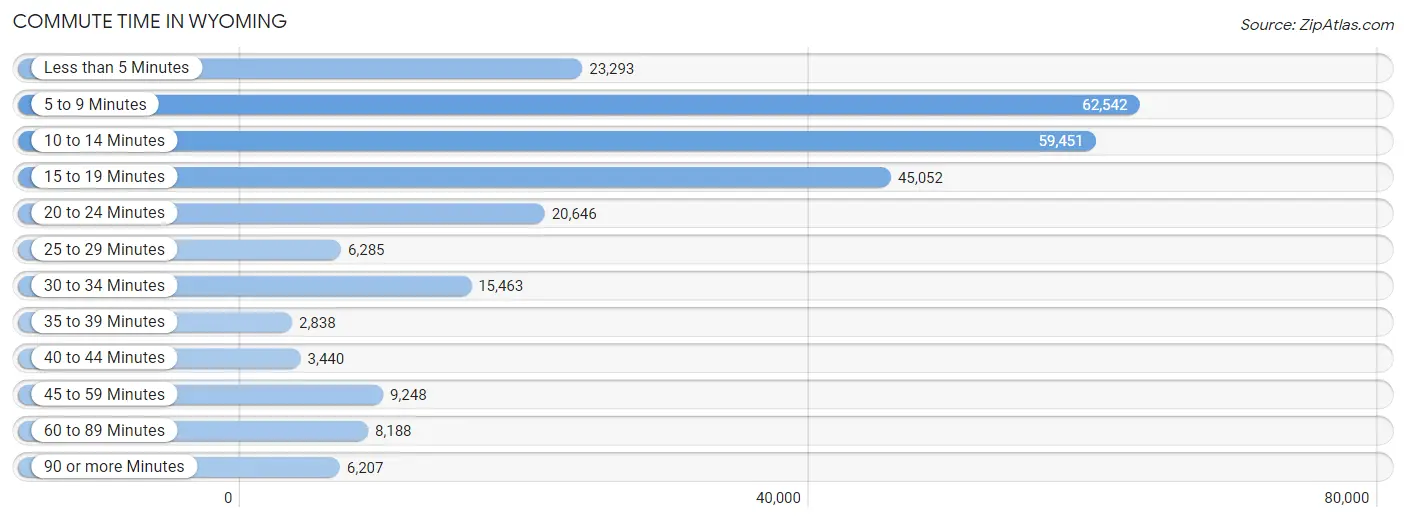
| Commute Time | # Commuters | % Commuters |
| Less than 5 Minutes | 23,293 | 8.9% |
| 5 to 9 Minutes | 62,542 | 23.8% |
| 10 to 14 Minutes | 59,451 | 22.6% |
| 15 to 19 Minutes | 45,052 | 17.2% |
| 20 to 24 Minutes | 20,646 | 7.9% |
| 25 to 29 Minutes | 6,285 | 2.4% |
| 30 to 34 Minutes | 15,463 | 5.9% |
| 35 to 39 Minutes | 2,838 | 1.1% |
| 40 to 44 Minutes | 3,440 | 1.3% |
| 45 to 59 Minutes | 9,248 | 3.5% |
| 60 to 89 Minutes | 8,188 | 3.1% |
| 90 or more Minutes | 6,207 | 2.4% |
Commute Time by Sex in Wyoming
The most common commute times in Wyoming are 5 to 9 minutes (31,044 commuters, 21.3%) for males and 5 to 9 minutes (31,498 commuters, 26.9%) for females.
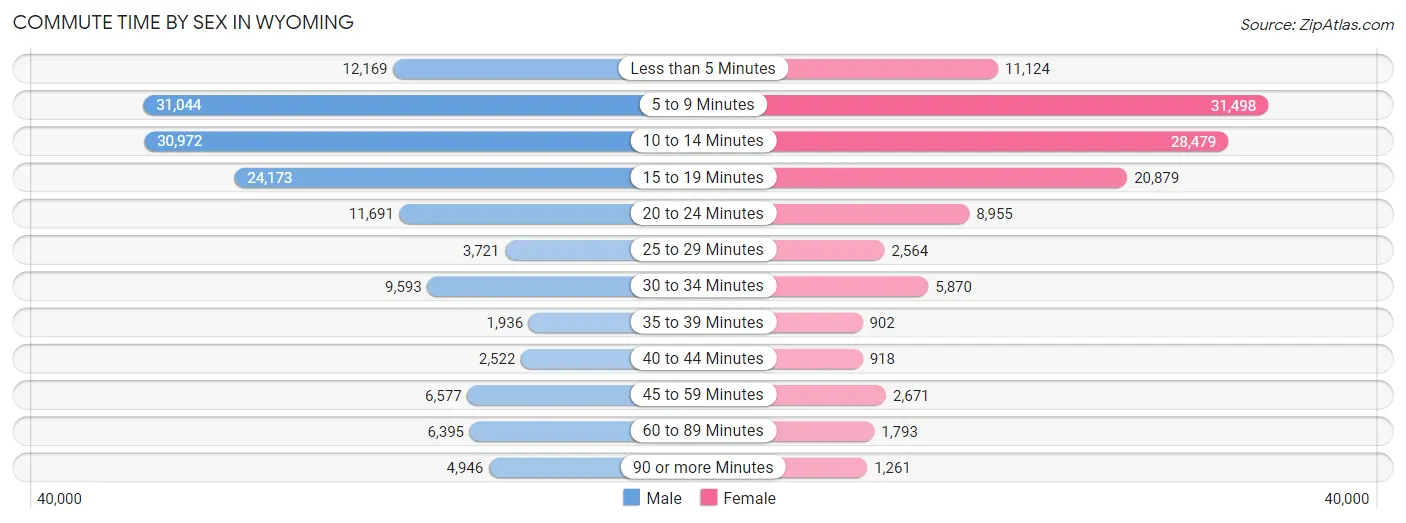
| Commute Time | Male | Female |
| Less than 5 Minutes | 12,169 (8.4%) | 11,124 (9.5%) |
| 5 to 9 Minutes | 31,044 (21.3%) | 31,498 (26.9%) |
| 10 to 14 Minutes | 30,972 (21.2%) | 28,479 (24.4%) |
| 15 to 19 Minutes | 24,173 (16.6%) | 20,879 (17.9%) |
| 20 to 24 Minutes | 11,691 (8.0%) | 8,955 (7.7%) |
| 25 to 29 Minutes | 3,721 (2.5%) | 2,564 (2.2%) |
| 30 to 34 Minutes | 9,593 (6.6%) | 5,870 (5.0%) |
| 35 to 39 Minutes | 1,936 (1.3%) | 902 (0.8%) |
| 40 to 44 Minutes | 2,522 (1.7%) | 918 (0.8%) |
| 45 to 59 Minutes | 6,577 (4.5%) | 2,671 (2.3%) |
| 60 to 89 Minutes | 6,395 (4.4%) | 1,793 (1.5%) |
| 90 or more Minutes | 4,946 (3.4%) | 1,261 (1.1%) |
Time of Departure to Work by Sex in Wyoming
The most frequent times of departure to work in Wyoming are 7:30 AM to 7:59 AM (21,160, 14.5%) for males and 7:30 AM to 7:59 AM (25,159, 21.5%) for females.
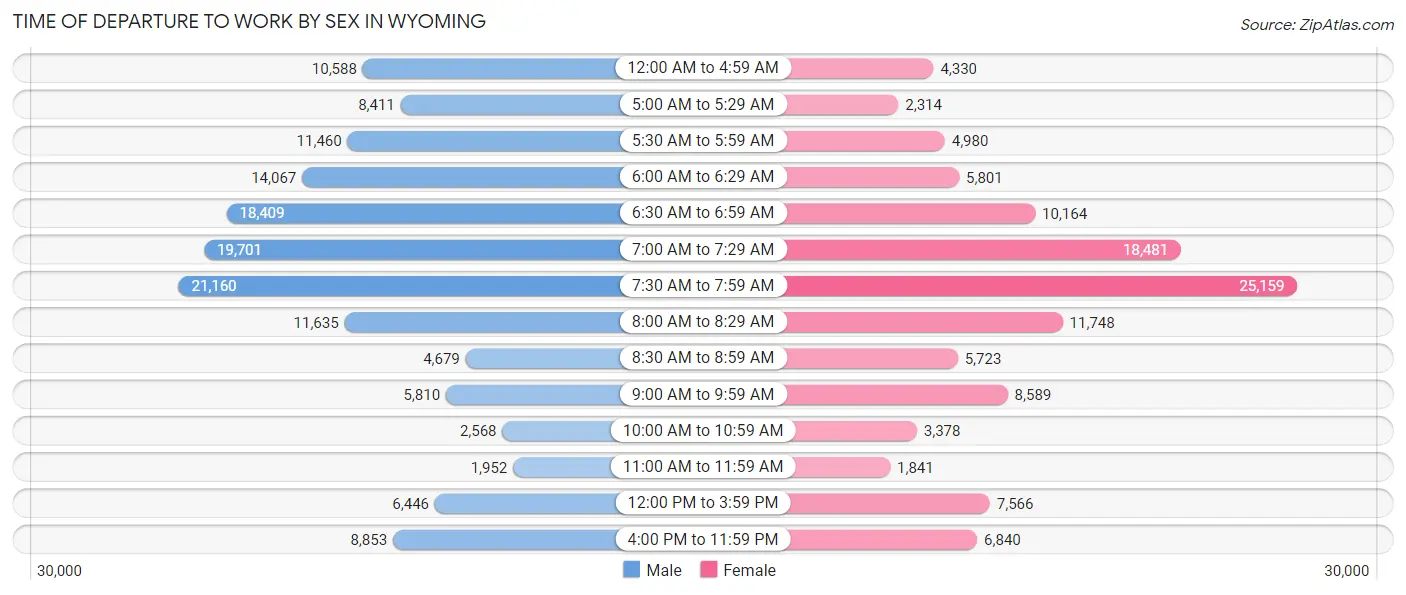
| Time of Departure | Male | Female |
| 12:00 AM to 4:59 AM | 10,588 (7.3%) | 4,330 (3.7%) |
| 5:00 AM to 5:29 AM | 8,411 (5.8%) | 2,314 (2.0%) |
| 5:30 AM to 5:59 AM | 11,460 (7.9%) | 4,980 (4.3%) |
| 6:00 AM to 6:29 AM | 14,067 (9.7%) | 5,801 (5.0%) |
| 6:30 AM to 6:59 AM | 18,409 (12.6%) | 10,164 (8.7%) |
| 7:00 AM to 7:29 AM | 19,701 (13.5%) | 18,481 (15.8%) |
| 7:30 AM to 7:59 AM | 21,160 (14.5%) | 25,159 (21.5%) |
| 8:00 AM to 8:29 AM | 11,635 (8.0%) | 11,748 (10.1%) |
| 8:30 AM to 8:59 AM | 4,679 (3.2%) | 5,723 (4.9%) |
| 9:00 AM to 9:59 AM | 5,810 (4.0%) | 8,589 (7.3%) |
| 10:00 AM to 10:59 AM | 2,568 (1.8%) | 3,378 (2.9%) |
| 11:00 AM to 11:59 AM | 1,952 (1.3%) | 1,841 (1.6%) |
| 12:00 PM to 3:59 PM | 6,446 (4.4%) | 7,566 (6.5%) |
| 4:00 PM to 11:59 PM | 8,853 (6.1%) | 6,840 (5.9%) |
| Total | 145,739 (100.0%) | 116,914 (100.0%) |
Housing Occupancy in Wyoming
Occupancy by Ownership in Wyoming
Of the total 234,156 dwellings in Wyoming, owner-occupied units account for 168,393 (71.9%), while renter-occupied units make up 65,763 (28.1%).
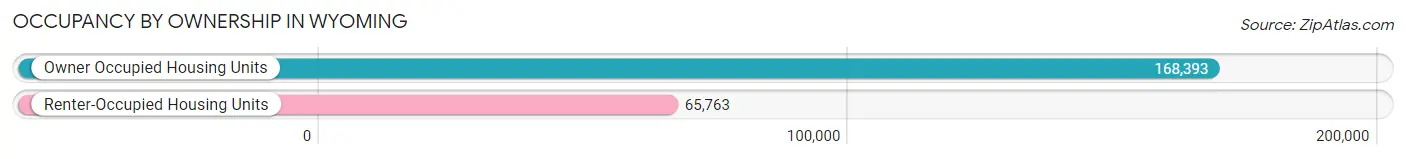
| Occupancy | # Housing Units | % Housing Units |
| Owner Occupied Housing Units | 168,393 | 71.9% |
| Renter-Occupied Housing Units | 65,763 | 28.1% |
| Total Occupied Housing Units | 234,156 | 100.0% |
Occupancy by Household Size in Wyoming
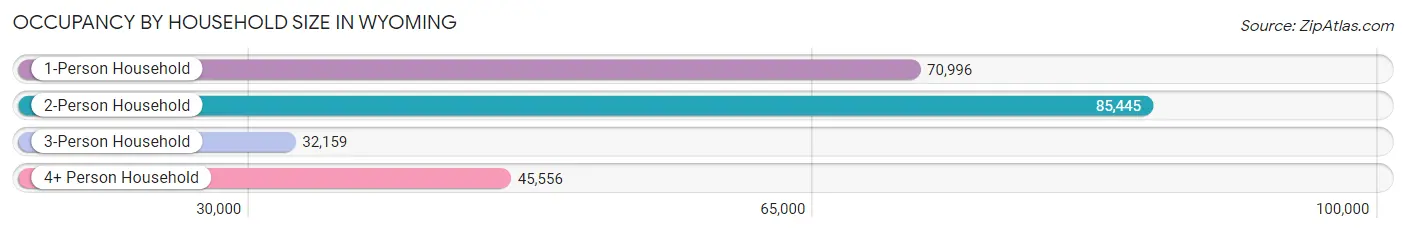
| Household Size | # Housing Units | % Housing Units |
| 1-Person Household | 70,996 | 30.3% |
| 2-Person Household | 85,445 | 36.5% |
| 3-Person Household | 32,159 | 13.7% |
| 4+ Person Household | 45,556 | 19.5% |
| Total Housing Units | 234,156 | 100.0% |
Occupancy by Ownership by Household Size in Wyoming
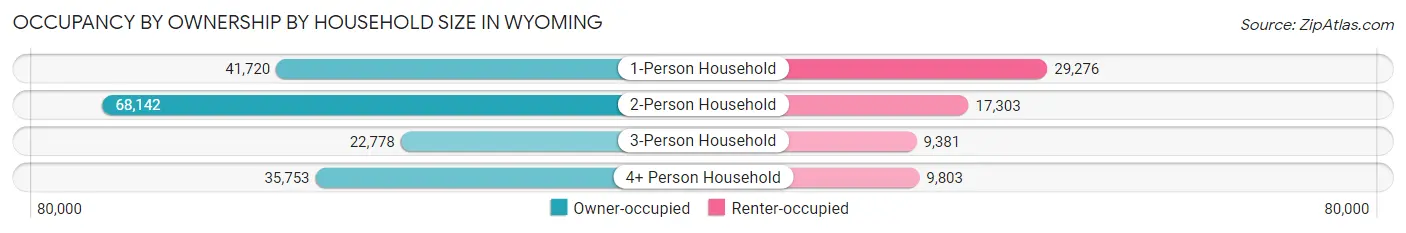
| Household Size | Owner-occupied | Renter-occupied |
| 1-Person Household | 41,720 (58.8%) | 29,276 (41.2%) |
| 2-Person Household | 68,142 (79.7%) | 17,303 (20.3%) |
| 3-Person Household | 22,778 (70.8%) | 9,381 (29.2%) |
| 4+ Person Household | 35,753 (78.5%) | 9,803 (21.5%) |
| Total Housing Units | 168,393 (71.9%) | 65,763 (28.1%) |
Occupancy by Educational Attainment in Wyoming
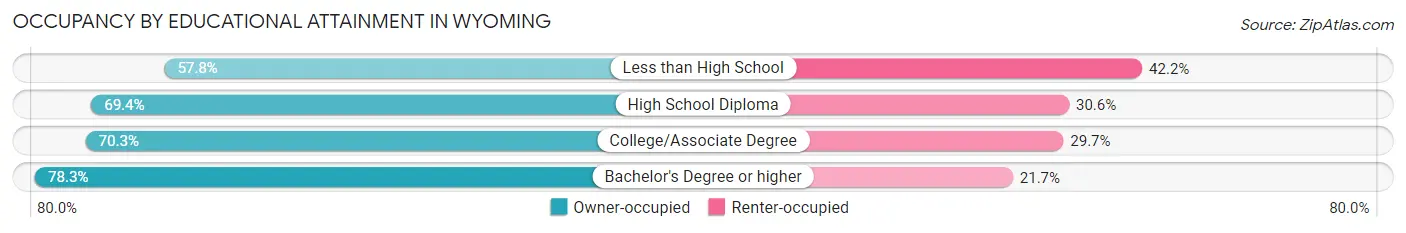
| Household Size | Owner-occupied | Renter-occupied |
| Less than High School | 6,627 (57.8%) | 4,837 (42.2%) |
| High School Diploma | 41,018 (69.4%) | 18,080 (30.6%) |
| College/Associate Degree | 64,788 (70.3%) | 27,357 (29.7%) |
| Bachelor's Degree or higher | 55,960 (78.3%) | 15,489 (21.7%) |
Occupancy by Age of Householder in Wyoming
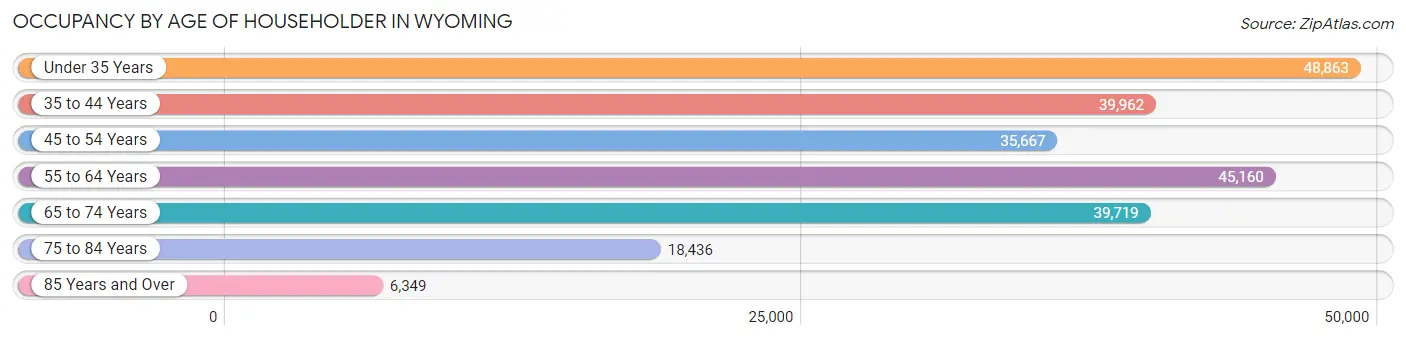
| Age Bracket | # Households | % Households |
| Under 35 Years | 48,863 | 20.9% |
| 35 to 44 Years | 39,962 | 17.1% |
| 45 to 54 Years | 35,667 | 15.2% |
| 55 to 64 Years | 45,160 | 19.3% |
| 65 to 74 Years | 39,719 | 17.0% |
| 75 to 84 Years | 18,436 | 7.9% |
| 85 Years and Over | 6,349 | 2.7% |
| Total | 234,156 | 100.0% |
Housing Finances in Wyoming
Median Income by Occupancy in Wyoming
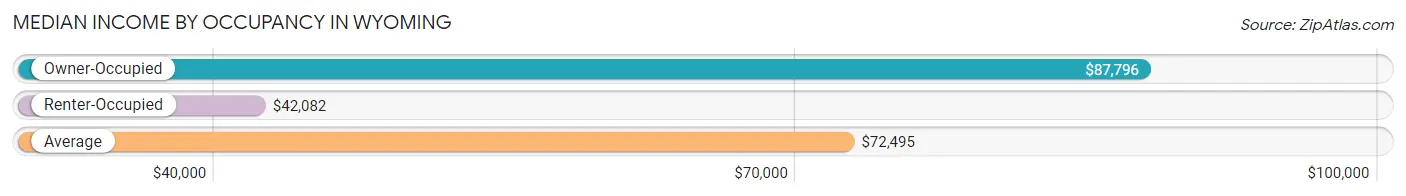
| Occupancy Type | # Households | Median Income |
| Owner-Occupied | 168,393 (71.9%) | $87,796 |
| Renter-Occupied | 65,763 (28.1%) | $42,082 |
| Average | 234,156 (100.0%) | $72,495 |
Occupancy by Householder Income Bracket in Wyoming
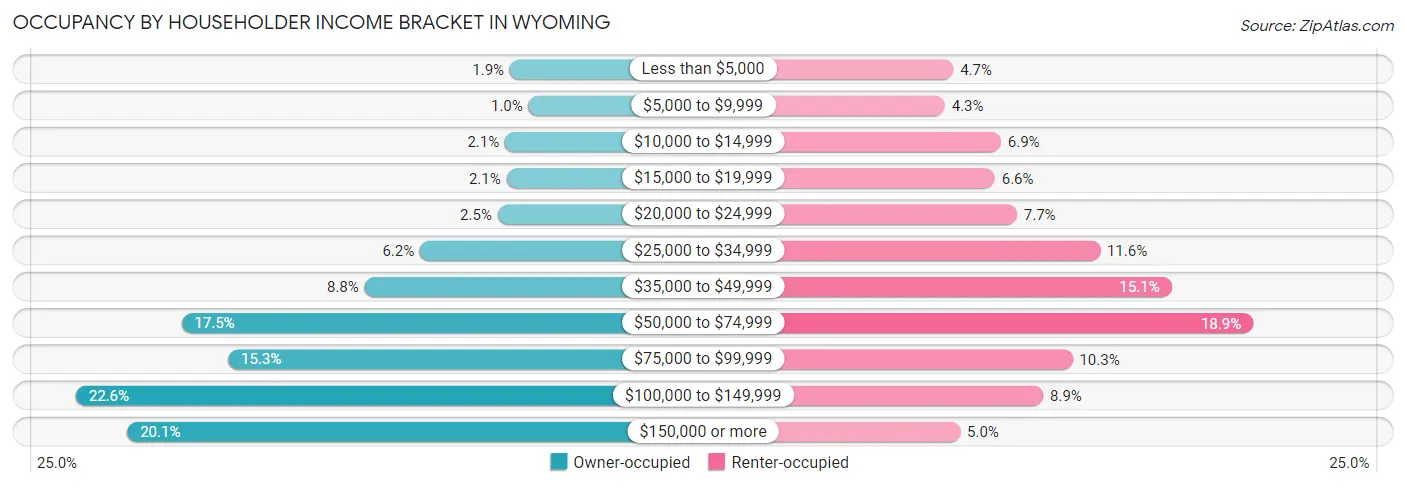
| Income Bracket | Owner-occupied | Renter-occupied |
| Less than $5,000 | 3,182 (1.9%) | 3,059 (4.6%) |
| $5,000 to $9,999 | 1,677 (1.0%) | 2,796 (4.3%) |
| $10,000 to $14,999 | 3,562 (2.1%) | 4,553 (6.9%) |
| $15,000 to $19,999 | 3,446 (2.1%) | 4,360 (6.6%) |
| $20,000 to $24,999 | 4,160 (2.5%) | 5,048 (7.7%) |
| $25,000 to $34,999 | 10,383 (6.2%) | 7,657 (11.6%) |
| $35,000 to $49,999 | 14,828 (8.8%) | 9,899 (15.0%) |
| $50,000 to $74,999 | 29,514 (17.5%) | 12,447 (18.9%) |
| $75,000 to $99,999 | 25,787 (15.3%) | 6,792 (10.3%) |
| $100,000 to $149,999 | 37,989 (22.6%) | 5,875 (8.9%) |
| $150,000 or more | 33,865 (20.1%) | 3,277 (5.0%) |
| Total | 168,393 (100.0%) | 65,763 (100.0%) |
Monthly Housing Cost Tiers in Wyoming
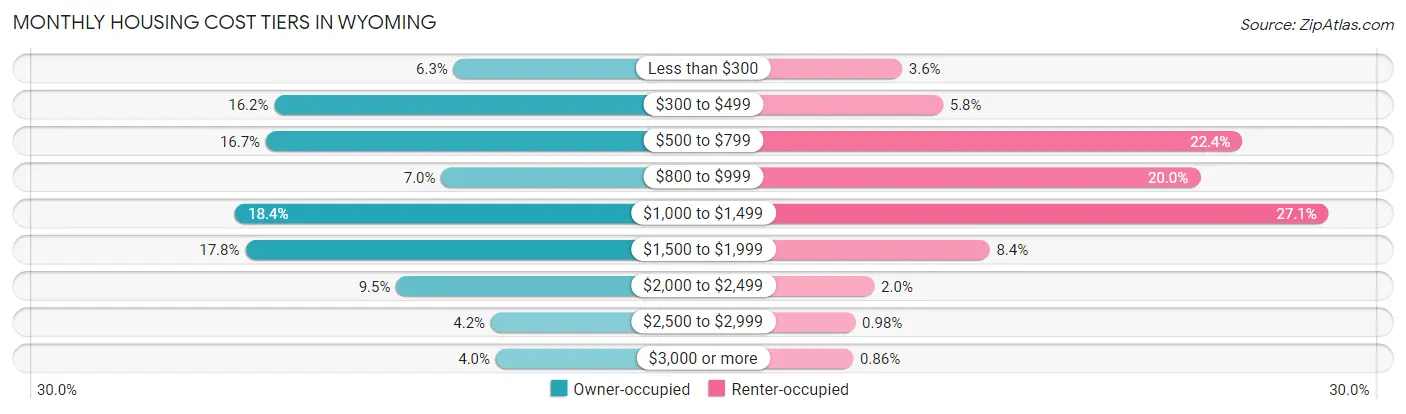
| Monthly Cost | Owner-occupied | Renter-occupied |
| Less than $300 | 10,601 (6.3%) | 2,339 (3.6%) |
| $300 to $499 | 27,290 (16.2%) | 3,827 (5.8%) |
| $500 to $799 | 28,068 (16.7%) | 14,705 (22.4%) |
| $800 to $999 | 11,748 (7.0%) | 13,173 (20.0%) |
| $1,000 to $1,499 | 30,938 (18.4%) | 17,841 (27.1%) |
| $1,500 to $1,999 | 29,986 (17.8%) | 5,526 (8.4%) |
| $2,000 to $2,499 | 15,950 (9.5%) | 1,337 (2.0%) |
| $2,500 to $2,999 | 7,135 (4.2%) | 642 (1.0%) |
| $3,000 or more | 6,677 (4.0%) | 567 (0.9%) |
| Total | 168,393 (100.0%) | 65,763 (100.0%) |
Physical Housing Characteristics in Wyoming
Housing Structures in Wyoming
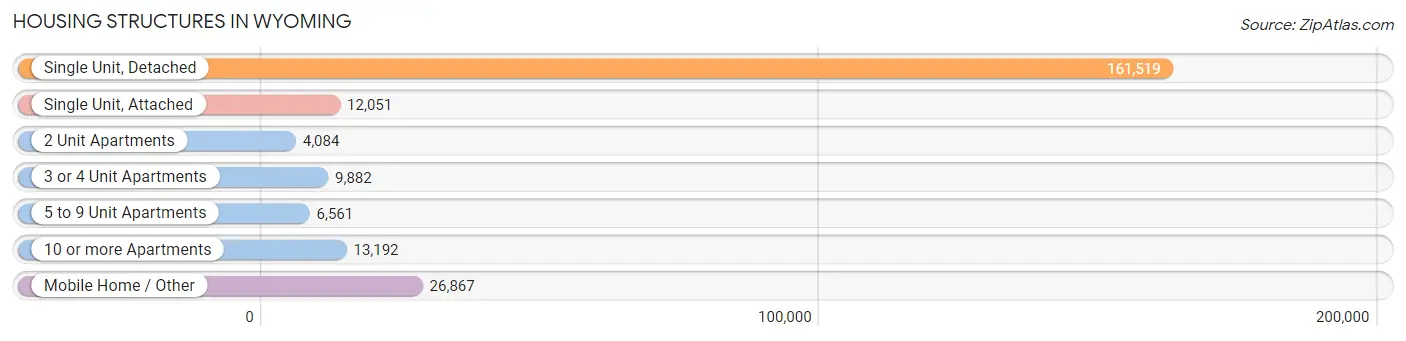
| Structure Type | # Housing Units | % Housing Units |
| Single Unit, Detached | 161,519 | 69.0% |
| Single Unit, Attached | 12,051 | 5.1% |
| 2 Unit Apartments | 4,084 | 1.7% |
| 3 or 4 Unit Apartments | 9,882 | 4.2% |
| 5 to 9 Unit Apartments | 6,561 | 2.8% |
| 10 or more Apartments | 13,192 | 5.6% |
| Mobile Home / Other | 26,867 | 11.5% |
| Total | 234,156 | 100.0% |
Housing Structures by Occupancy in Wyoming
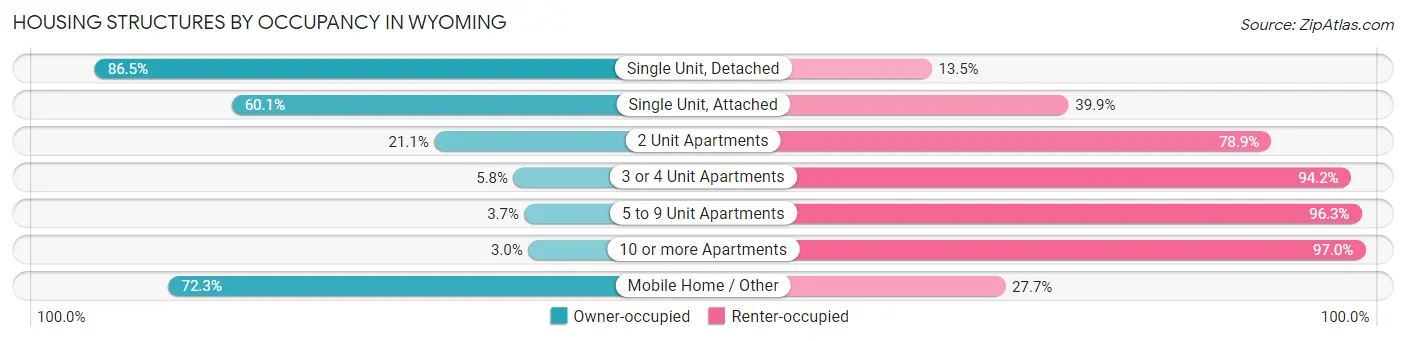
| Structure Type | Owner-occupied | Renter-occupied |
| Single Unit, Detached | 139,662 (86.5%) | 21,857 (13.5%) |
| Single Unit, Attached | 7,244 (60.1%) | 4,807 (39.9%) |
| 2 Unit Apartments | 860 (21.1%) | 3,224 (78.9%) |
| 3 or 4 Unit Apartments | 573 (5.8%) | 9,309 (94.2%) |
| 5 to 9 Unit Apartments | 243 (3.7%) | 6,318 (96.3%) |
| 10 or more Apartments | 392 (3.0%) | 12,800 (97.0%) |
| Mobile Home / Other | 19,419 (72.3%) | 7,448 (27.7%) |
| Total | 168,393 (71.9%) | 65,763 (28.1%) |
Housing Structures by Number of Rooms in Wyoming
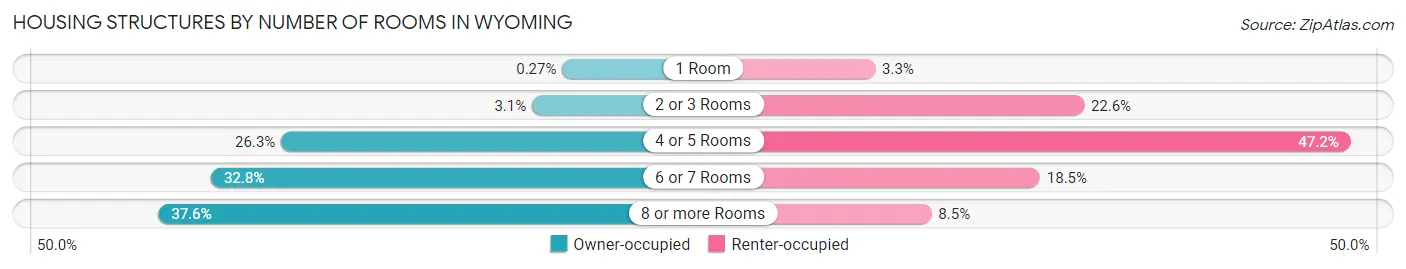
| Number of Rooms | Owner-occupied | Renter-occupied |
| 1 Room | 461 (0.3%) | 2,137 (3.3%) |
| 2 or 3 Rooms | 5,177 (3.1%) | 14,842 (22.6%) |
| 4 or 5 Rooms | 44,234 (26.3%) | 31,060 (47.2%) |
| 6 or 7 Rooms | 55,163 (32.8%) | 12,162 (18.5%) |
| 8 or more Rooms | 63,358 (37.6%) | 5,562 (8.5%) |
| Total | 168,393 (100.0%) | 65,763 (100.0%) |
Housing Structure by Heating Type in Wyoming
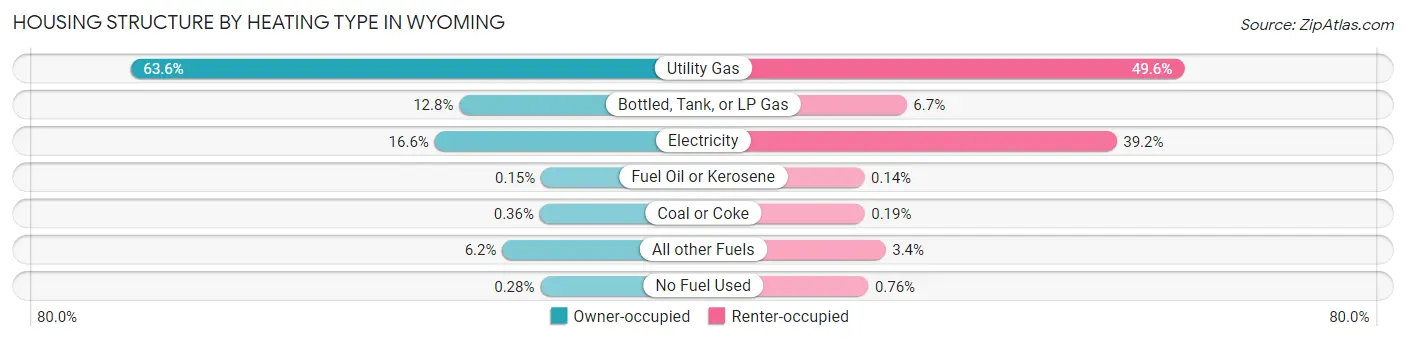
| Heating Type | Owner-occupied | Renter-occupied |
| Utility Gas | 107,170 (63.6%) | 32,629 (49.6%) |
| Bottled, Tank, or LP Gas | 21,568 (12.8%) | 4,408 (6.7%) |
| Electricity | 27,968 (16.6%) | 25,747 (39.2%) |
| Fuel Oil or Kerosene | 254 (0.2%) | 93 (0.1%) |
| Coal or Coke | 611 (0.4%) | 127 (0.2%) |
| All other Fuels | 10,355 (6.1%) | 2,259 (3.4%) |
| No Fuel Used | 467 (0.3%) | 500 (0.8%) |
| Total | 168,393 (100.0%) | 65,763 (100.0%) |
Household Vehicle Usage in Wyoming
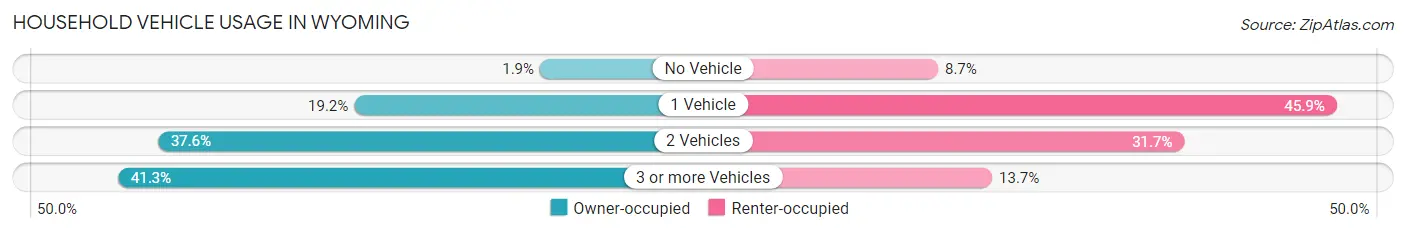
| Vehicles per Household | Owner-occupied | Renter-occupied |
| No Vehicle | 3,193 (1.9%) | 5,717 (8.7%) |
| 1 Vehicle | 32,397 (19.2%) | 30,184 (45.9%) |
| 2 Vehicles | 63,268 (37.6%) | 20,825 (31.7%) |
| 3 or more Vehicles | 69,535 (41.3%) | 9,037 (13.7%) |
| Total | 168,393 (100.0%) | 65,763 (100.0%) |
Real Estate & Mortgages in Wyoming
Real Estate and Mortgage Overview in Wyoming
| Characteristic | Without Mortgage | With Mortgage |
| Housing Units | 70,706 | 97,687 |
| Median Property Value | $244,600 | $283,600 |
| Median Household Income | $65,959 | $22,927 |
| Monthly Housing Costs | $489 | $6,337 |
| Real Estate Taxes | $1,446 | $2,265 |
Property Value by Mortgage Status in Wyoming
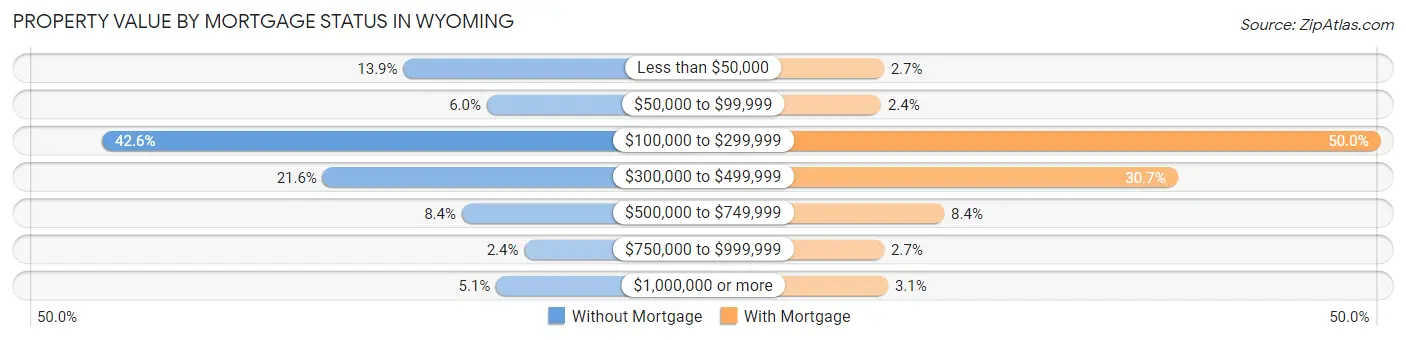
| Property Value | Without Mortgage | With Mortgage |
| Less than $50,000 | 9,851 (13.9%) | 2,615 (2.7%) |
| $50,000 to $99,999 | 4,225 (6.0%) | 2,360 (2.4%) |
| $100,000 to $299,999 | 30,138 (42.6%) | 48,838 (50.0%) |
| $300,000 to $499,999 | 15,278 (21.6%) | 29,955 (30.7%) |
| $500,000 to $749,999 | 5,913 (8.4%) | 8,246 (8.4%) |
| $750,000 to $999,999 | 1,702 (2.4%) | 2,657 (2.7%) |
| $1,000,000 or more | 3,599 (5.1%) | 3,016 (3.1%) |
| Total | 70,706 (100.0%) | 97,687 (100.0%) |
Household Income by Mortgage Status in Wyoming
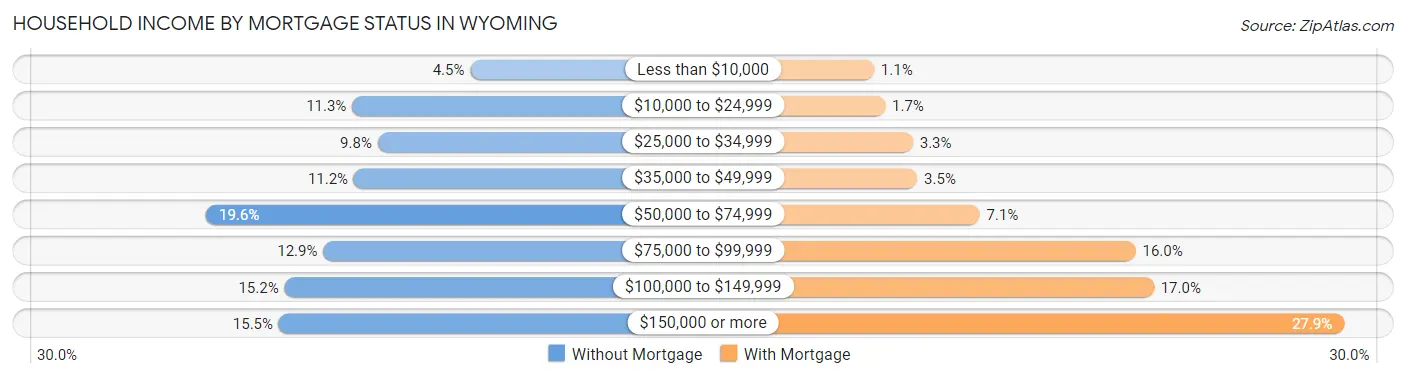
| Household Income | Without Mortgage | With Mortgage |
| Less than $10,000 | 3,205 (4.5%) | 1,028 (1.1%) |
| $10,000 to $24,999 | 7,978 (11.3%) | 1,654 (1.7%) |
| $25,000 to $34,999 | 6,946 (9.8%) | 3,190 (3.3%) |
| $35,000 to $49,999 | 7,906 (11.2%) | 3,437 (3.5%) |
| $50,000 to $74,999 | 13,883 (19.6%) | 6,922 (7.1%) |
| $75,000 to $99,999 | 9,140 (12.9%) | 15,631 (16.0%) |
| $100,000 to $149,999 | 10,710 (15.1%) | 16,647 (17.0%) |
| $150,000 or more | 10,938 (15.5%) | 27,279 (27.9%) |
| Total | 70,706 (100.0%) | 97,687 (100.0%) |
Property Value to Household Income Ratio in Wyoming

| Value-to-Income Ratio | Without Mortgage | With Mortgage |
| Less than 2.0x | 20,830 (29.5%) | 102,866 (105.3%) |
| 2.0x to 2.9x | 11,291 (16.0%) | 25,877 (26.5%) |
| 3.0x to 3.9x | 8,386 (11.9%) | 26,522 (27.2%) |
| 4.0x or more | 29,299 (41.4%) | 16,734 (17.1%) |
| Total | 70,706 (100.0%) | 97,687 (100.0%) |
Real Estate Taxes by Mortgage Status in Wyoming
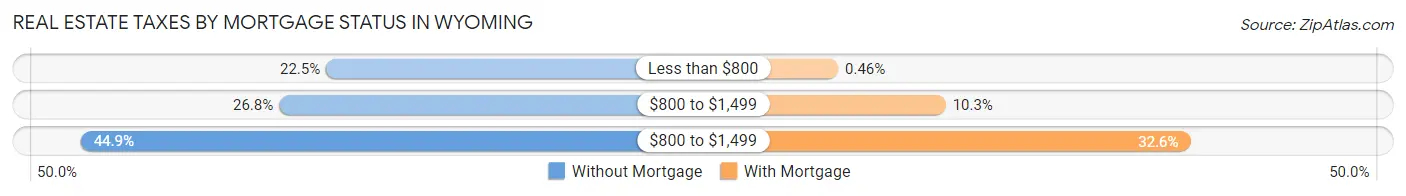
| Property Taxes | Without Mortgage | With Mortgage |
| Less than $800 | 15,888 (22.5%) | 449 (0.5%) |
| $800 to $1,499 | 18,921 (26.8%) | 10,048 (10.3%) |
| $800 to $1,499 | 31,723 (44.9%) | 31,877 (32.6%) |
| Total | 70,706 (100.0%) | 97,687 (100.0%) |
Health & Disability in Wyoming
Health Insurance Coverage by Age in Wyoming

| Age Bracket | With Coverage | Without Coverage |
| Under 6 Years | 36,400 (91.2%) | 3,501 (8.8%) |
| 6 to 18 Years | 91,166 (90.8%) | 9,261 (9.2%) |
| 19 to 25 Years | 40,222 (80.3%) | 9,857 (19.7%) |
| 26 to 34 Years | 51,374 (79.0%) | 13,634 (21.0%) |
| 35 to 44 Years | 62,721 (84.3%) | 11,697 (15.7%) |
| 45 to 54 Years | 55,170 (85.7%) | 9,203 (14.3%) |
| 55 to 64 Years | 66,954 (88.9%) | 8,335 (11.1%) |
| 65 to 74 Years | 61,784 (99.4%) | 368 (0.6%) |
| 75 Years and older | 36,168 (100.0%) | 11 (0.0%) |
| Total | 501,959 (88.4%) | 65,867 (11.6%) |
Health Insurance Coverage by Citizenship Status in Wyoming
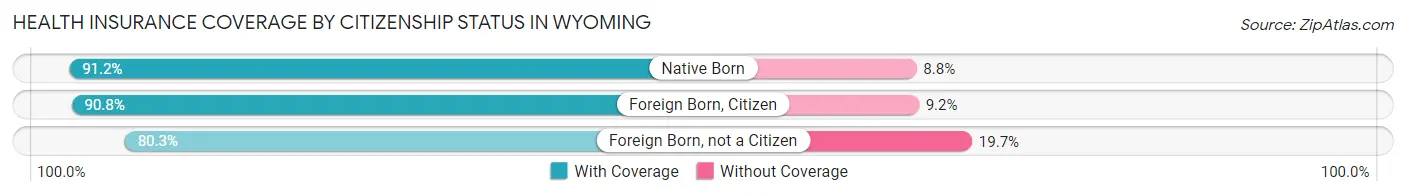
| Citizenship Status | With Coverage | Without Coverage |
| Native Born | 36,400 (91.2%) | 3,501 (8.8%) |
| Foreign Born, Citizen | 91,166 (90.8%) | 9,261 (9.2%) |
| Foreign Born, not a Citizen | 40,222 (80.3%) | 9,857 (19.7%) |
Health Insurance Coverage by Household Income in Wyoming
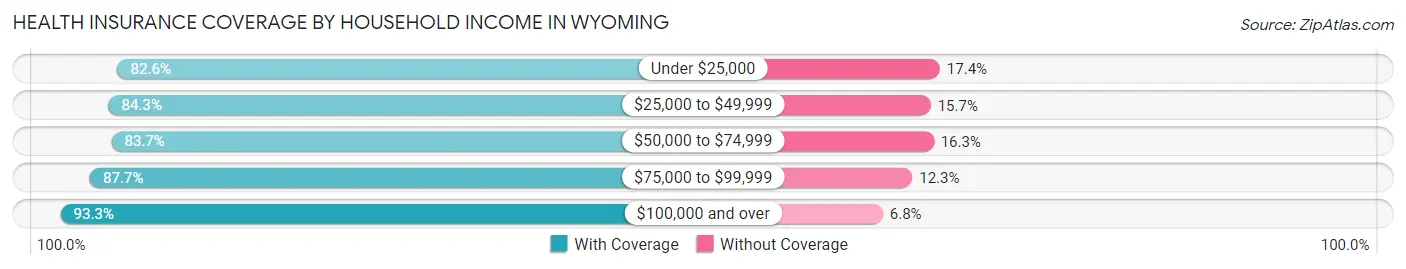
| Household Income | With Coverage | Without Coverage |
| Under $25,000 | 46,250 (82.6%) | 9,770 (17.4%) |
| $25,000 to $49,999 | 68,215 (84.3%) | 12,733 (15.7%) |
| $50,000 to $74,999 | 79,963 (83.7%) | 15,552 (16.3%) |
| $75,000 to $99,999 | 75,926 (87.7%) | 10,619 (12.3%) |
| $100,000 and over | 226,188 (93.2%) | 16,385 (6.8%) |
Public vs Private Health Insurance Coverage by Age in Wyoming
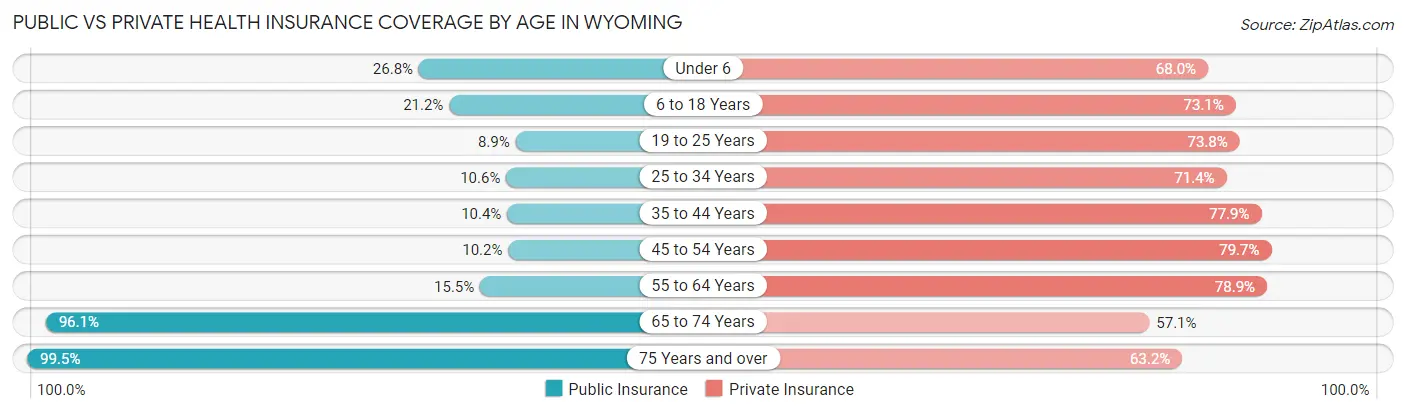
| Age Bracket | Public Insurance | Private Insurance |
| Under 6 | 10,698 (26.8%) | 27,112 (67.9%) |
| 6 to 18 Years | 21,281 (21.2%) | 73,407 (73.1%) |
| 19 to 25 Years | 4,443 (8.9%) | 36,971 (73.8%) |
| 25 to 34 Years | 6,889 (10.6%) | 46,406 (71.4%) |
| 35 to 44 Years | 7,757 (10.4%) | 57,941 (77.9%) |
| 45 to 54 Years | 6,582 (10.2%) | 51,317 (79.7%) |
| 55 to 64 Years | 11,633 (15.4%) | 59,405 (78.9%) |
| 65 to 74 Years | 59,717 (96.1%) | 35,483 (57.1%) |
| 75 Years and over | 36,013 (99.5%) | 22,853 (63.2%) |
| Total | 165,013 (29.1%) | 410,895 (72.4%) |
Disability Status by Sex by Age in Wyoming

| Age Bracket | Male | Female |
| Under 5 Years | 158 (0.9%) | 103 (0.6%) |
| 5 to 17 Years | 2,808 (5.5%) | 2,159 (4.5%) |
| 18 to 34 Years | 4,669 (7.3%) | 4,615 (7.7%) |
| 35 to 64 Years | 14,929 (13.7%) | 13,652 (13.0%) |
| 65 to 74 Years | 9,870 (31.3%) | 7,077 (23.1%) |
| 75 Years and over | 7,938 (48.4%) | 8,928 (45.1%) |
Disability Class by Sex by Age in Wyoming
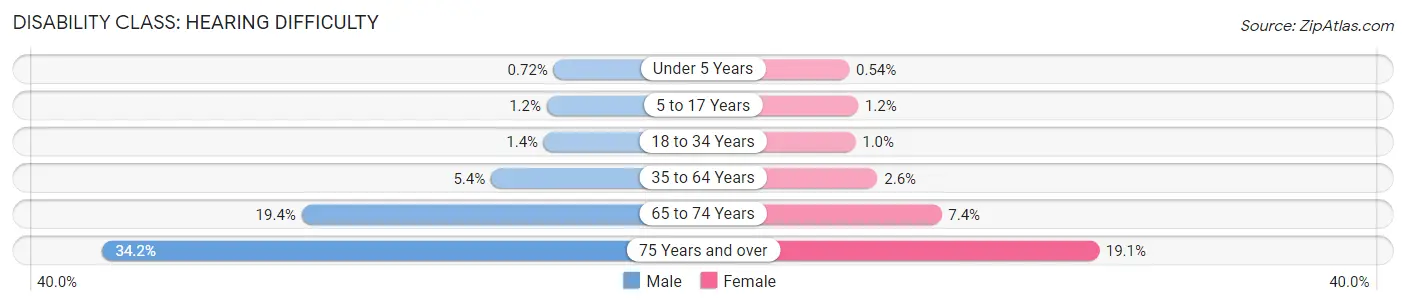
Disability Class: Hearing Difficulty
| Age Bracket | Male | Female |
| Under 5 Years | 121 (0.7%) | 87 (0.5%) |
| 5 to 17 Years | 627 (1.2%) | 578 (1.2%) |
| 18 to 34 Years | 924 (1.4%) | 595 (1.0%) |
| 35 to 64 Years | 5,864 (5.4%) | 2,770 (2.6%) |
| 65 to 74 Years | 6,133 (19.4%) | 2,262 (7.4%) |
| 75 Years and over | 5,609 (34.2%) | 3,775 (19.1%) |
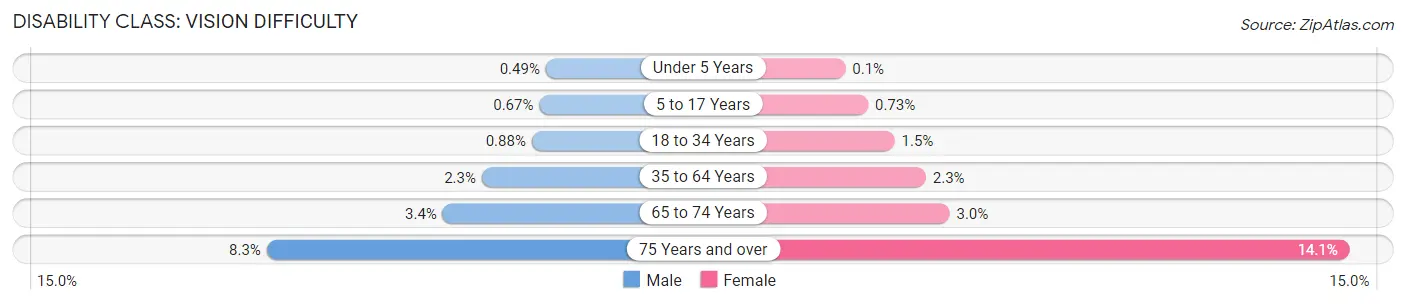
Disability Class: Vision Difficulty
| Age Bracket | Male | Female |
| Under 5 Years | 83 (0.5%) | 16 (0.1%) |
| 5 to 17 Years | 339 (0.7%) | 353 (0.7%) |
| 18 to 34 Years | 565 (0.9%) | 876 (1.5%) |
| 35 to 64 Years | 2,476 (2.3%) | 2,450 (2.3%) |
| 65 to 74 Years | 1,059 (3.4%) | 919 (3.0%) |
| 75 Years and over | 1,354 (8.3%) | 2,797 (14.1%) |
Disability Class: Cognitive Difficulty

| Age Bracket | Male | Female |
| 5 to 17 Years | 1,990 (3.9%) | 1,205 (2.5%) |
| 18 to 34 Years | 2,992 (4.7%) | 2,665 (4.5%) |
| 35 to 64 Years | 4,709 (4.3%) | 5,159 (4.9%) |
| 65 to 74 Years | 1,649 (5.2%) | 1,218 (4.0%) |
| 75 Years and over | 1,424 (8.7%) | 2,220 (11.2%) |
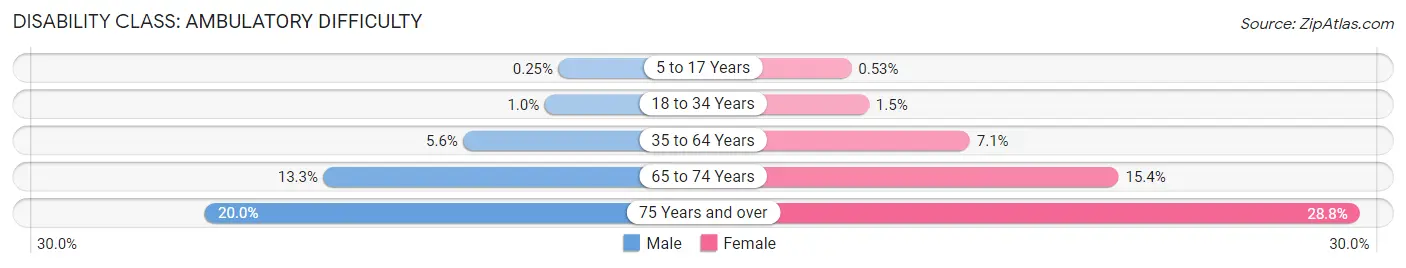
Disability Class: Ambulatory Difficulty
| Age Bracket | Male | Female |
| 5 to 17 Years | 126 (0.3%) | 257 (0.5%) |
| 18 to 34 Years | 650 (1.0%) | 901 (1.5%) |
| 35 to 64 Years | 6,070 (5.6%) | 7,468 (7.1%) |
| 65 to 74 Years | 4,210 (13.3%) | 4,715 (15.4%) |
| 75 Years and over | 3,271 (20.0%) | 5,705 (28.8%) |
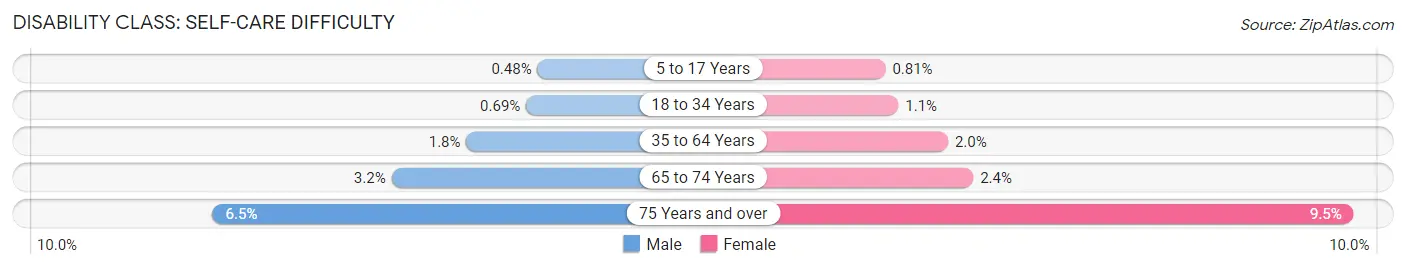
Disability Class: Self-Care Difficulty
| Age Bracket | Male | Female |
| 5 to 17 Years | 244 (0.5%) | 389 (0.8%) |
| 18 to 34 Years | 444 (0.7%) | 627 (1.1%) |
| 35 to 64 Years | 1,965 (1.8%) | 2,061 (2.0%) |
| 65 to 74 Years | 1,006 (3.2%) | 745 (2.4%) |
| 75 Years and over | 1,068 (6.5%) | 1,880 (9.5%) |
Technology Access in Wyoming
Computing Device Access in Wyoming
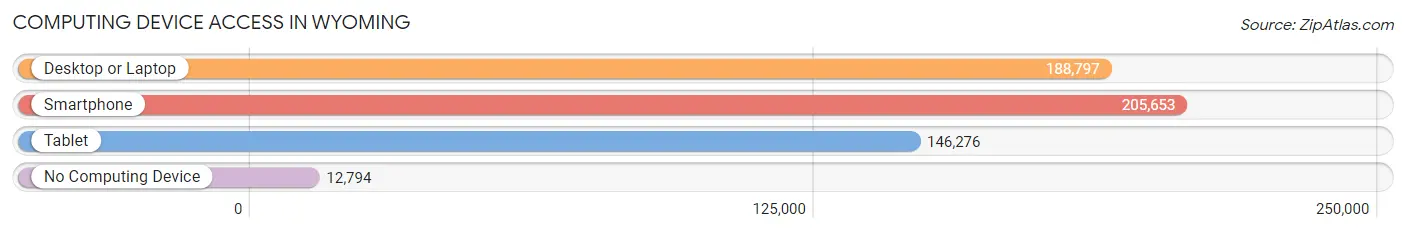
| Device Type | # Households | % Households |
| Desktop or Laptop | 188,797 | 80.6% |
| Smartphone | 205,653 | 87.8% |
| Tablet | 146,276 | 62.5% |
| No Computing Device | 12,794 | 5.5% |
| Total | 234,156 | 100.0% |
Internet Access in Wyoming
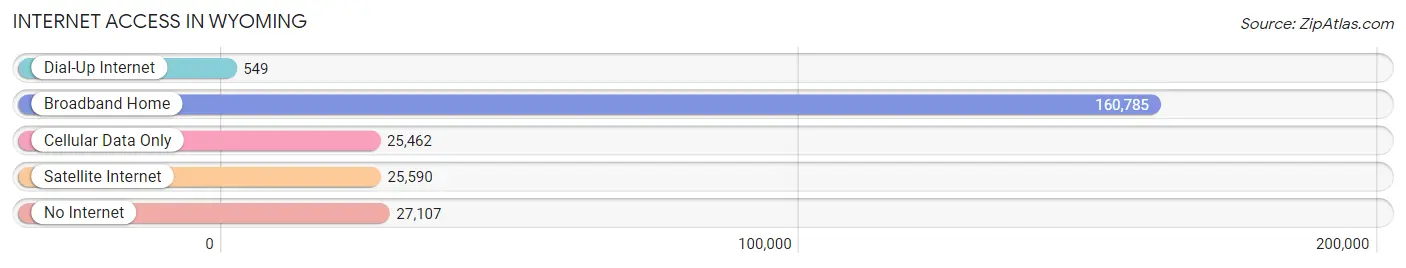
| Internet Type | # Households | % Households |
| Dial-Up Internet | 549 | 0.2% |
| Broadband Home | 160,785 | 68.7% |
| Cellular Data Only | 25,462 | 10.9% |
| Satellite Internet | 25,590 | 10.9% |
| No Internet | 27,107 | 11.6% |
| Total | 234,156 | 100.0% |
Wyoming Summary
Wyoming is a state located in the western United States. It is the tenth largest state in the country, with an area of 97,814 square miles. Wyoming is bordered by Montana to the north, South Dakota and Nebraska to the east, Colorado to the south, and Utah and Idaho to the west. The state capital is Cheyenne, and the largest city is Cheyenne.
History
The area that is now Wyoming was first inhabited by Native American tribes, including the Arapaho, Cheyenne, Crow, Shoshone, and Sioux. The first Europeans to explore the area were French fur trappers in the late 1700s. In 1803, the United States acquired the area as part of the Louisiana Purchase.
In 1868, the Wyoming Territory was created, and in 1890, Wyoming became the 44th state in the Union. During the late 1800s, Wyoming was a major center for the cattle industry, and the state was known as the "Cowboy State."
Geography
Wyoming is located in the western United States, and is bordered by Montana to the north, South Dakota and Nebraska to the east, Colorado to the south, and Utah and Idaho to the west. The state is divided into 23 counties.
The landscape of Wyoming is varied, with mountains, plains, and deserts. The Rocky Mountains run through the western part of the state, and the Great Plains cover the eastern part. The highest point in Wyoming is Gannett Peak, which is 13,809 feet above sea level.
Economy
Wyoming's economy is largely based on the extraction of natural resources, such as oil, natural gas, coal, and uranium. The state is also a major producer of beef, and tourism is an important industry.
The state's largest employers are the University of Wyoming, the State of Wyoming, and the Federal Government. Other major industries include agriculture, manufacturing, and construction.
Demographics
As of the 2010 census, Wyoming had a population of 563,626. The population is largely concentrated in the cities of Cheyenne, Casper, and Laramie.
The largest ancestry groups in Wyoming are German (25.2%), English (19.2%), Irish (14.2%), and American (13.2%). The state's population is largely white (91.3%), with small percentages of Native American (2.2%), African American (1.2%), Asian (1.1%), and Hispanic or Latino (4.2%).
The median household income in Wyoming is $56,845, and the median home value is $193,400. The state's unemployment rate is 4.2%.
Wyoming is a largely rural state, with a population density of 5.8 people per square mile. The state is largely Protestant (63.2%), with small percentages of Catholic (19.2%), Mormon (3.2%), and other religions (14.4%).
Common Questions
When was Wyoming Incorporated?
Wyoming was Incorporated into the Union on Jul 10, 1890.
What is the Total Area of Wyoming?
Total Area of Wyoming is 97,812 Square Miles.
What is the Total Land Area of Wyoming?
Total Land Area of Wyoming is 97,088 Square Miles.
What is the Total Water Area of Wyoming?
Total Water Area of Wyoming is 724 Square Miles.
What is the Average Elevation in Wyoming?
Average Elevation in Wyoming is 6,700 Feet.
What is the Highest Elevation in Wyoming?
Highest Elevation in Wyoming is 13,804 Feet.
What is the Lowest Elevation in Wyoming?
Lowest Elevation in Wyoming is 3099 Feet.
What is the Population Density in Wyoming?
Population Density in Wyoming is 6.0 People per Square Mile.
What is Per Capita Income in Wyoming?
Per Capita income in Wyoming is $39,547.
What is the Median Family Income in Wyoming?
Median Family Income in Wyoming is $92,028.
What is the Median Household income in Wyoming?
Median Household Income in Wyoming is $72,495.
What is Income or Wage Gap in Wyoming?
Income or Wage Gap in Wyoming is 40.6%.
Women in Wyoming earn 59.4 cents for every dollar earned by a man.
What is Family Income Deficit in Wyoming?
Family Income Deficit in Wyoming is $10,562.
Families that are below poverty line in Wyoming earn $10,562 less on average than the poverty threshold level.
What is Inequality or Gini Index in Wyoming?
Inequality or Gini Index in Wyoming is 0.45.
What is the Total Population of Wyoming?
Total Population of Wyoming is 577,929.
What is the Total Male Population of Wyoming?
Total Male Population of Wyoming is 295,835.
What is the Total Female Population of Wyoming?
Total Female Population of Wyoming is 282,094.
What is the Ratio of Males per 100 Females in Wyoming?
There are 104.87 Males per 100 Females in Wyoming.
What is the Ratio of Females per 100 Males in Wyoming?
There are 95.36 Females per 100 Males in Wyoming.
What is the Median Population Age in Wyoming?
Median Population Age in Wyoming is 38.5 Years.
What is the Average Family Size in Wyoming
Average Family Size in Wyoming is 3.0 People.
What is the Average Household Size in Wyoming
Average Household Size in Wyoming is 2.4 People.
How Large is the Labor Force in Wyoming?
There are 302,639 People in the Labor Forcein in Wyoming.
What is the Percentage of People in the Labor Force in Wyoming?
65.7% of People are in the Labor Force in Wyoming.
What is the Unemployment Rate in Wyoming?
Unemployment Rate in Wyoming is 3.8%.