Utah Map & Demographics
Utah Map
Utah Overview
Jan 4, 1896
INCORPORATED
84,897
TOTAL AREA [ SQ MI ]
82,191
LAND AREA [ SQ MI ]
2,706
WATER AREA [ SQ MI ]
6,100
ELEVATION AVG [ FT ]
13,528
ELEVATION HIGH [ FT ]
2,000
ELEVATION LOW [ FT ]
40.0
POP DENSITY [ PPL / SQ MI ]
$37,023
PER CAPITA INCOME
$100,001
AVG FAMILY INCOME
$86,833
AVG HOUSEHOLD INCOME
42.4%
WAGE / INCOME GAP [ % ]
57.6¢/ $1
WAGE / INCOME GAP [ $ ]
$10,899
FAMILY INCOME DEFICIT
0.43
INEQUALITY / GINI INDEX
84043
LARGEST ZIP CODE
Salt Lake City
LARGEST CITY
Salt Lake County
LARGEST COUNTY
3,283,809
TOTAL POPULATION
1,665,209
MALE POPULATION
1,618,600
FEMALE POPULATION
102.88
MALES / 100 FEMALES
97.20
FEMALES / 100 MALES
31.4
MEDIAN AGE
3.5
AVG FAMILY SIZE
3.0
AVG HOUSEHOLD SIZE
1,703,624
LABOR FORCE [ PEOPLE ]
69.4%
PERCENT IN LABOR FORCE
3.4%
UNEMPLOYMENT RATE
Income in Utah
Income Overview in Utah
Per Capita Income in Utah is $37,023, while median incomes of families and households are $100,001 and $86,833 respectively.
| Characteristic | Number | Measure |
| Per Capita Income | 3,283,809 | $37,023 |
| Median Family Income | 782,668 | $100,001 |
| Mean Family Income | 782,668 | $125,109 |
| Median Household Income | 1,062,819 | $86,833 |
| Mean Household Income | 1,062,819 | $111,416 |
| Income Deficit | 782,668 | $10,899 |
| Wage / Income Gap (%) | 3,283,809 | 42.36% |
| Wage / Income Gap ($) | 3,283,809 | 57.64¢ per $1 |
| Gini / Inequality Index | 3,283,809 | 0.43 |
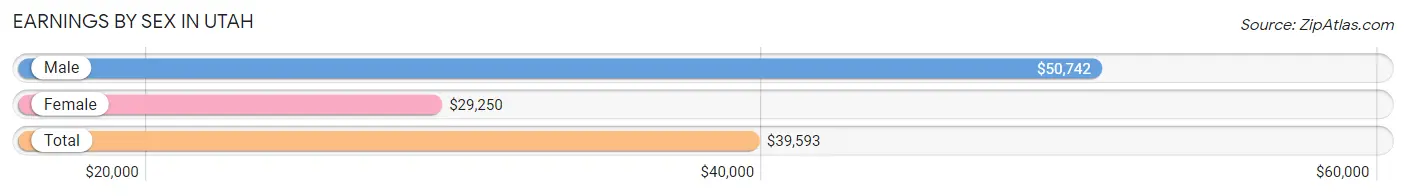
Earnings by Sex in Utah
Average Earnings in Utah are $39,593, $50,742 for men and $29,250 for women, a difference of 42.4%.
| Sex | Number | Average Earnings |
| Male | 991,177 (55.2%) | $50,742 |
| Female | 804,971 (44.8%) | $29,250 |
| Total | 1,796,148 (100.0%) | $39,593 |
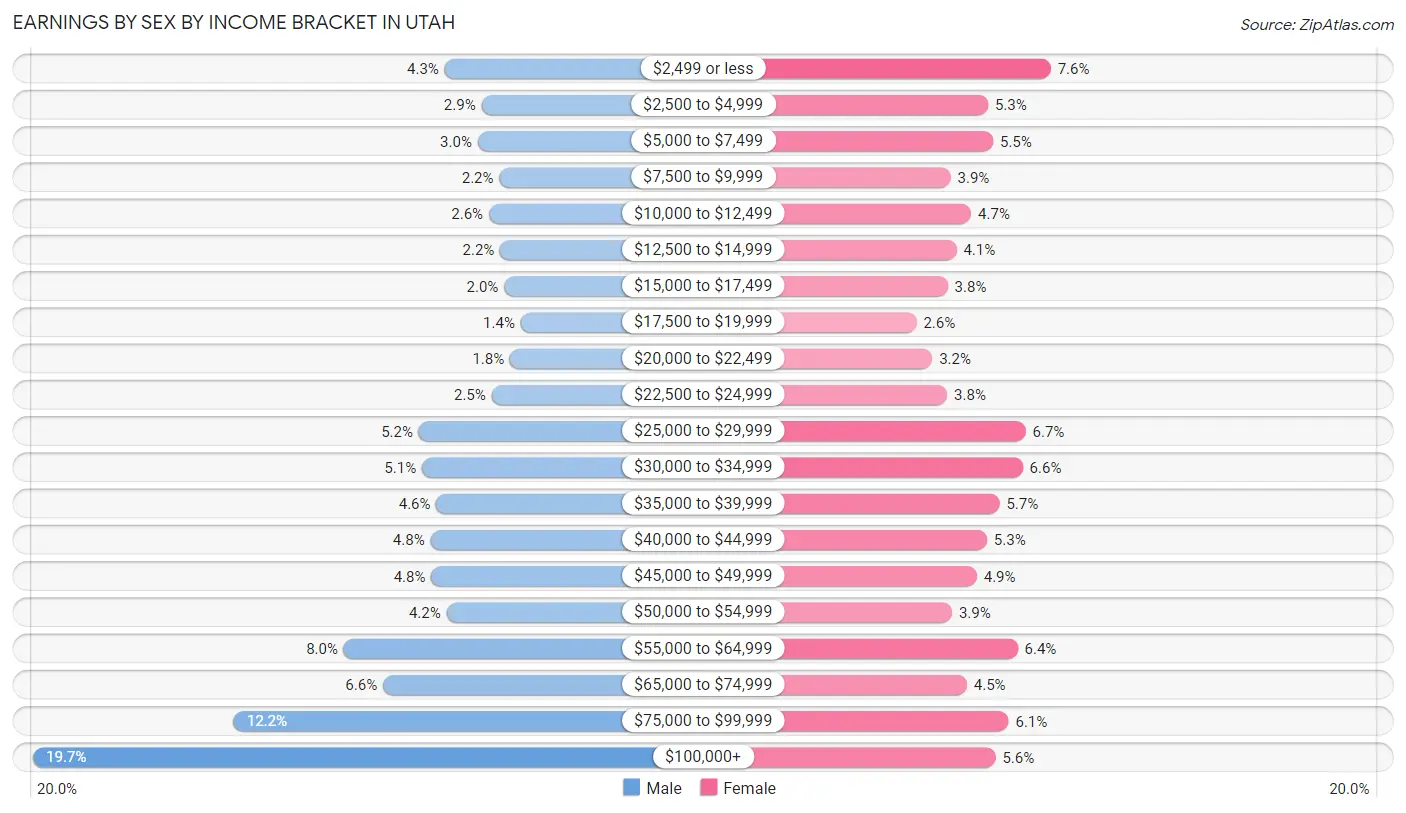
Earnings by Sex by Income Bracket in Utah
The most common earnings brackets in Utah are $100,000+ for men (195,105 | 19.7%) and $2,499 or less for women (61,485 | 7.6%).
| Income | Male | Female |
| $2,499 or less | 42,266 (4.3%) | 61,485 (7.6%) |
| $2,500 to $4,999 | 28,537 (2.9%) | 42,548 (5.3%) |
| $5,000 to $7,499 | 29,885 (3.0%) | 44,104 (5.5%) |
| $7,500 to $9,999 | 21,928 (2.2%) | 31,325 (3.9%) |
| $10,000 to $12,499 | 25,776 (2.6%) | 37,520 (4.7%) |
| $12,500 to $14,999 | 21,591 (2.2%) | 33,096 (4.1%) |
| $15,000 to $17,499 | 20,080 (2.0%) | 30,390 (3.8%) |
| $17,500 to $19,999 | 13,950 (1.4%) | 20,995 (2.6%) |
| $20,000 to $22,499 | 17,930 (1.8%) | 25,732 (3.2%) |
| $22,500 to $24,999 | 24,815 (2.5%) | 30,283 (3.8%) |
| $25,000 to $29,999 | 51,808 (5.2%) | 53,918 (6.7%) |
| $30,000 to $34,999 | 50,677 (5.1%) | 53,057 (6.6%) |
| $35,000 to $39,999 | 45,273 (4.6%) | 46,020 (5.7%) |
| $40,000 to $44,999 | 47,430 (4.8%) | 42,269 (5.2%) |
| $45,000 to $49,999 | 47,198 (4.8%) | 39,163 (4.9%) |
| $50,000 to $54,999 | 41,488 (4.2%) | 31,681 (3.9%) |
| $55,000 to $64,999 | 79,709 (8.0%) | 51,550 (6.4%) |
| $65,000 to $74,999 | 65,163 (6.6%) | 36,238 (4.5%) |
| $75,000 to $99,999 | 120,568 (12.2%) | 48,781 (6.1%) |
| $100,000+ | 195,105 (19.7%) | 44,816 (5.6%) |
| Total | 991,177 (100.0%) | 804,971 (100.0%) |
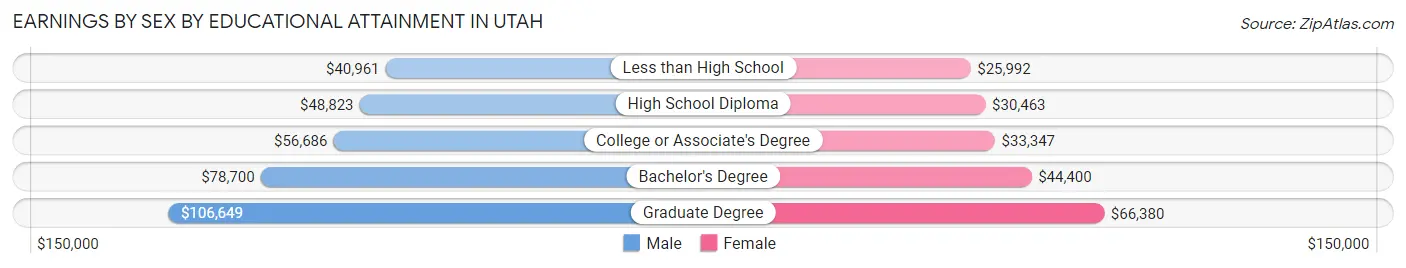
Earnings by Sex by Educational Attainment in Utah
Average earnings in Utah are $61,955 for men and $36,573 for women, a difference of 41.0%. Men with an educational attainment of graduate degree enjoy the highest average annual earnings of $106,649, while those with less than high school education earn the least with $40,961. Women with an educational attainment of graduate degree earn the most with the average annual earnings of $66,380, while those with less than high school education have the smallest earnings of $25,992.
| Educational Attainment | Male Income | Female Income |
| Less than High School | $40,961 | $25,992 |
| High School Diploma | $48,823 | $30,463 |
| College or Associate's Degree | $56,686 | $33,347 |
| Bachelor's Degree | $78,700 | $44,400 |
| Graduate Degree | $106,649 | $66,380 |
| Total | $61,955 | $36,573 |
Family Income in Utah
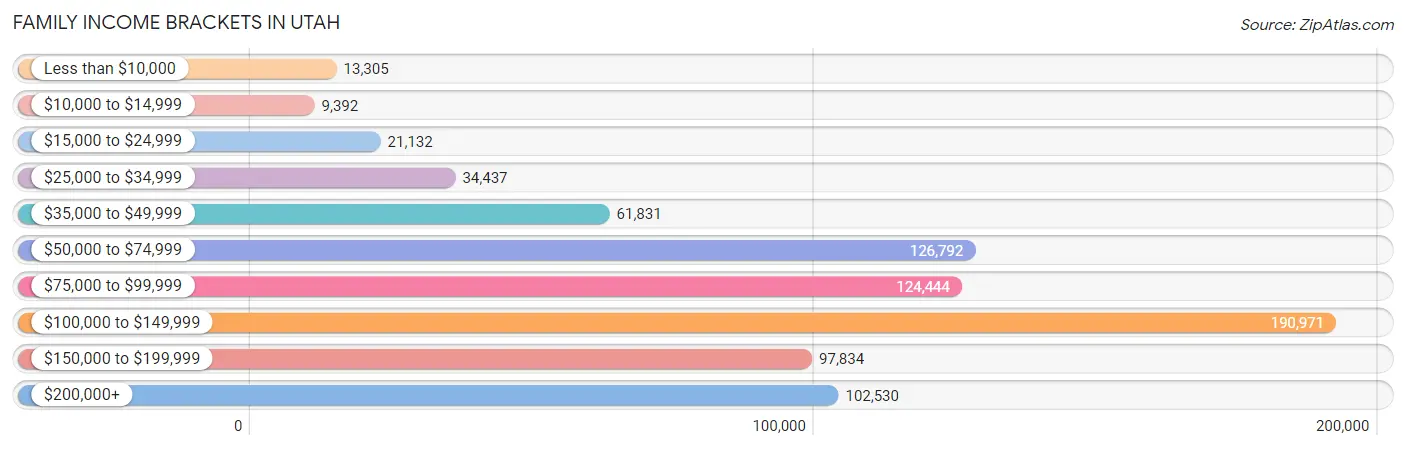
Family Income Brackets in Utah
According to the Utah family income data, there are 190,971 families falling into the $100,000 to $149,999 income range, which is the most common income bracket and makes up 24.4% of all families. Conversely, the $10,000 to $14,999 income bracket is the least frequent group with only 9,392 families (1.2%) belonging to this category.
| Income Bracket | # Families | % Families |
| Less than $10,000 | 13,305 | 1.7% |
| $10,000 to $14,999 | 9,392 | 1.2% |
| $15,000 to $24,999 | 21,132 | 2.7% |
| $25,000 to $34,999 | 34,437 | 4.4% |
| $35,000 to $49,999 | 61,831 | 7.9% |
| $50,000 to $74,999 | 126,792 | 16.2% |
| $75,000 to $99,999 | 124,444 | 15.9% |
| $100,000 to $149,999 | 190,971 | 24.4% |
| $150,000 to $199,999 | 97,834 | 12.5% |
| $200,000+ | 102,530 | 13.1% |
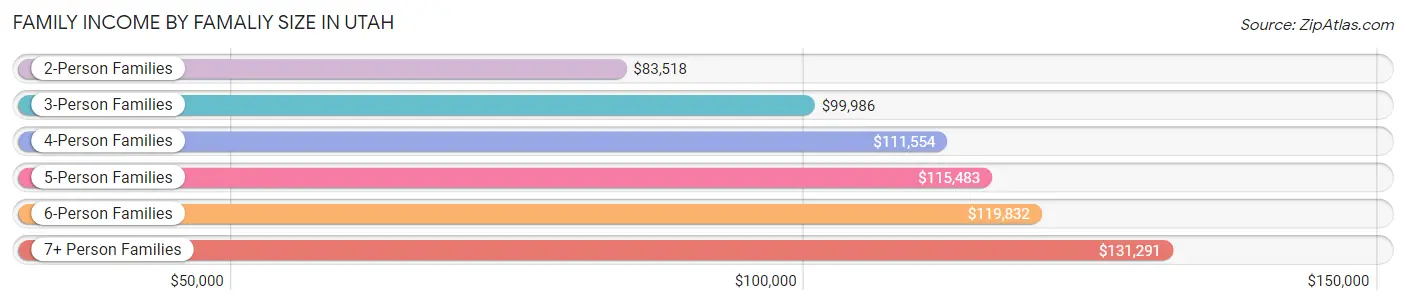
Family Income by Famaliy Size in Utah
7+ person families (36,549 | 4.7%) account for the highest median family income in Utah with $131,291 per family, while 2-person families (307,745 | 39.3%) have the highest median income of $41,759 per family member.
| Income Bracket | # Families | Median Income |
| 2-Person Families | 307,745 (39.3%) | $83,518 |
| 3-Person Families | 148,491 (19.0%) | $99,986 |
| 4-Person Families | 142,478 (18.2%) | $111,554 |
| 5-Person Families | 93,008 (11.9%) | $115,483 |
| 6-Person Families | 54,397 (7.0%) | $119,832 |
| 7+ Person Families | 36,549 (4.7%) | $131,291 |
| Total | 782,668 (100.0%) | $100,001 |
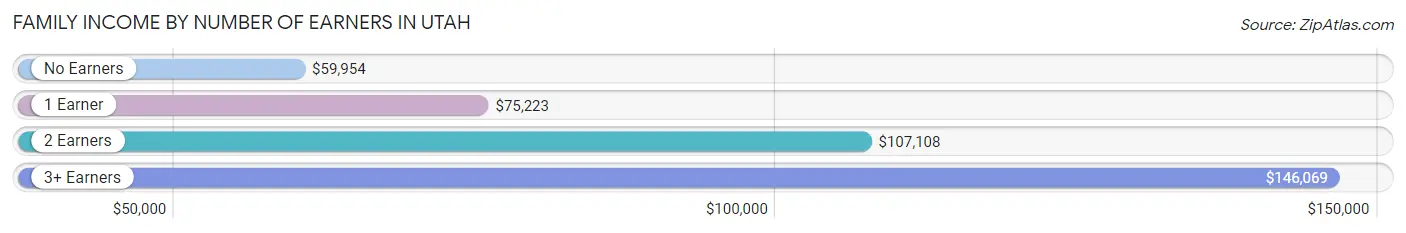
Family Income by Number of Earners in Utah
The median family income in Utah is $100,001, with families comprising 3+ earners (138,371) having the highest median family income of $146,069, while families with no earners (82,442) have the lowest median family income of $59,954, accounting for 17.7% and 10.5% of families, respectively.
| Number of Earners | # Families | Median Income |
| No Earners | 82,442 (10.5%) | $59,954 |
| 1 Earner | 216,411 (27.7%) | $75,223 |
| 2 Earners | 345,444 (44.1%) | $107,108 |
| 3+ Earners | 138,371 (17.7%) | $146,069 |
| Total | 782,668 (100.0%) | $100,001 |
Household Income in Utah
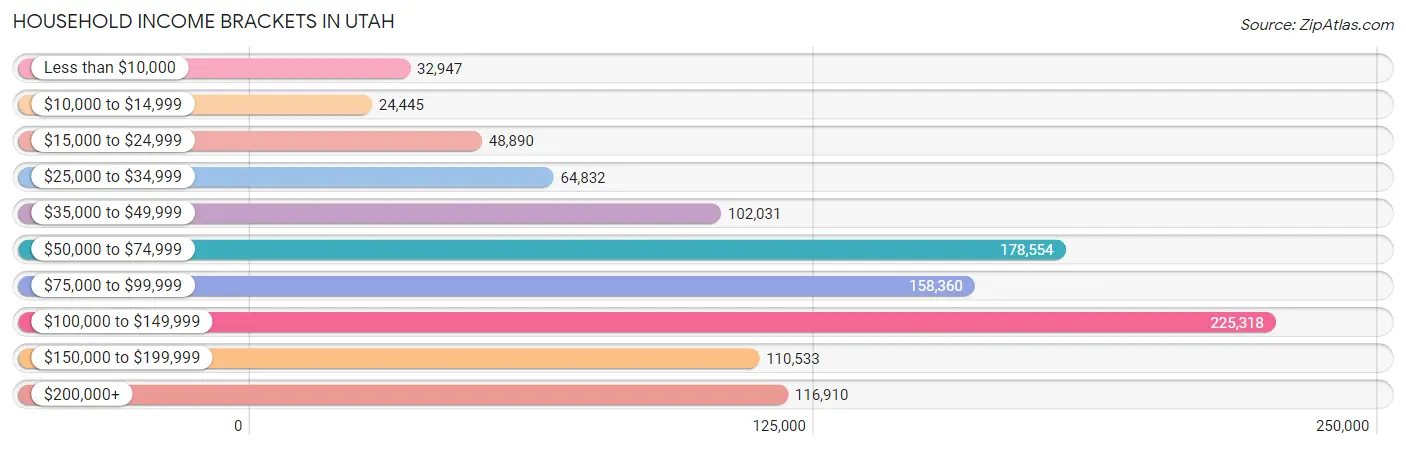
Household Income Brackets in Utah
With 225,318 households falling in the category, the $100,000 to $149,999 income range is the most frequent in Utah, accounting for 21.2% of all households. In contrast, only 24,445 households (2.3%) fall into the $10,000 to $14,999 income bracket, making it the least populous group.
| Income Bracket | # Households | % Households |
| Less than $10,000 | 32,947 | 3.1% |
| $10,000 to $14,999 | 24,445 | 2.3% |
| $15,000 to $24,999 | 48,890 | 4.6% |
| $25,000 to $34,999 | 64,832 | 6.1% |
| $35,000 to $49,999 | 102,031 | 9.6% |
| $50,000 to $74,999 | 178,554 | 16.8% |
| $75,000 to $99,999 | 158,360 | 14.9% |
| $100,000 to $149,999 | 225,318 | 21.2% |
| $150,000 to $199,999 | 110,533 | 10.4% |
| $200,000+ | 116,910 | 11.0% |
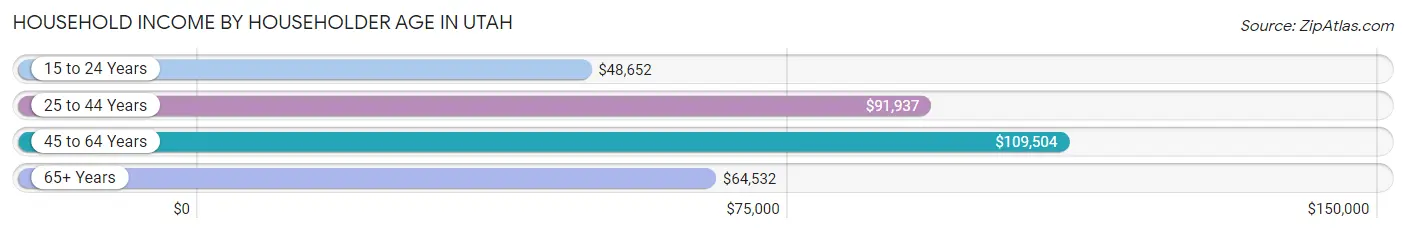
Household Income by Householder Age in Utah
The median household income in Utah is $86,833, with the highest median household income of $109,504 found in the 45 to 64 years age bracket for the primary householder. A total of 346,357 households (32.6%) fall into this category. Meanwhile, the 15 to 24 years age bracket for the primary householder has the lowest median household income of $48,652, with 68,725 households (6.5%) in this group.
| Income Bracket | # Households | Median Income |
| 15 to 24 Years | 68,725 (6.5%) | $48,652 |
| 25 to 44 Years | 423,089 (39.8%) | $91,937 |
| 45 to 64 Years | 346,357 (32.6%) | $109,504 |
| 65+ Years | 224,648 (21.1%) | $64,532 |
| Total | 1,062,819 (100.0%) | $86,833 |
Poverty in Utah
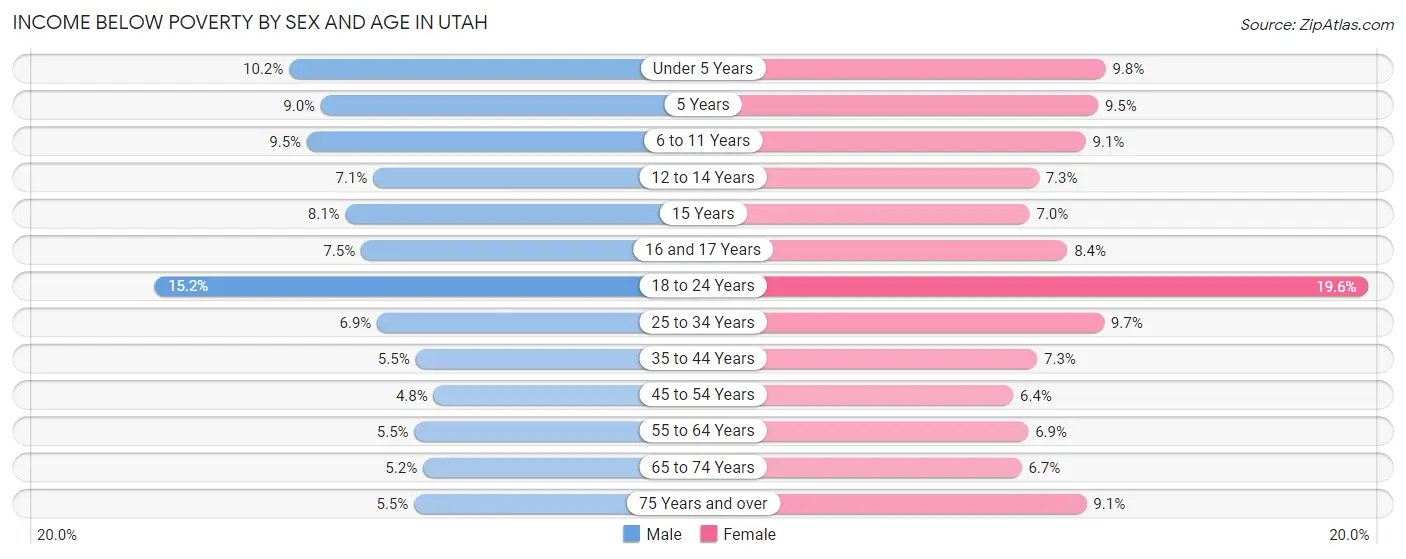
Income Below Poverty by Sex and Age in Utah
With 7.7% poverty level for males and 9.3% for females among the residents of Utah, 18 to 24 year old males and 18 to 24 year old females are the most vulnerable to poverty, with 28,317 males (15.2%) and 34,904 females (19.6%) in their respective age groups living below the poverty level.
| Age Bracket | Male | Female |
| Under 5 Years | 12,387 (10.2%) | 11,285 (9.8%) |
| 5 Years | 2,354 (9.0%) | 2,291 (9.5%) |
| 6 to 11 Years | 15,478 (9.5%) | 13,978 (9.0%) |
| 12 to 14 Years | 5,832 (7.1%) | 5,605 (7.3%) |
| 15 Years | 2,359 (8.1%) | 1,847 (7.0%) |
| 16 and 17 Years | 4,028 (7.5%) | 4,345 (8.4%) |
| 18 to 24 Years | 28,317 (15.2%) | 34,904 (19.6%) |
| 25 to 34 Years | 16,710 (6.9%) | 22,551 (9.7%) |
| 35 to 44 Years | 12,622 (5.5%) | 15,965 (7.2%) |
| 45 to 54 Years | 8,499 (4.8%) | 10,638 (6.4%) |
| 55 to 64 Years | 8,386 (5.5%) | 10,576 (6.9%) |
| 65 to 74 Years | 5,705 (5.2%) | 7,777 (6.7%) |
| 75 Years and over | 3,543 (5.5%) | 7,206 (9.1%) |
| Total | 126,220 (7.7%) | 148,968 (9.3%) |
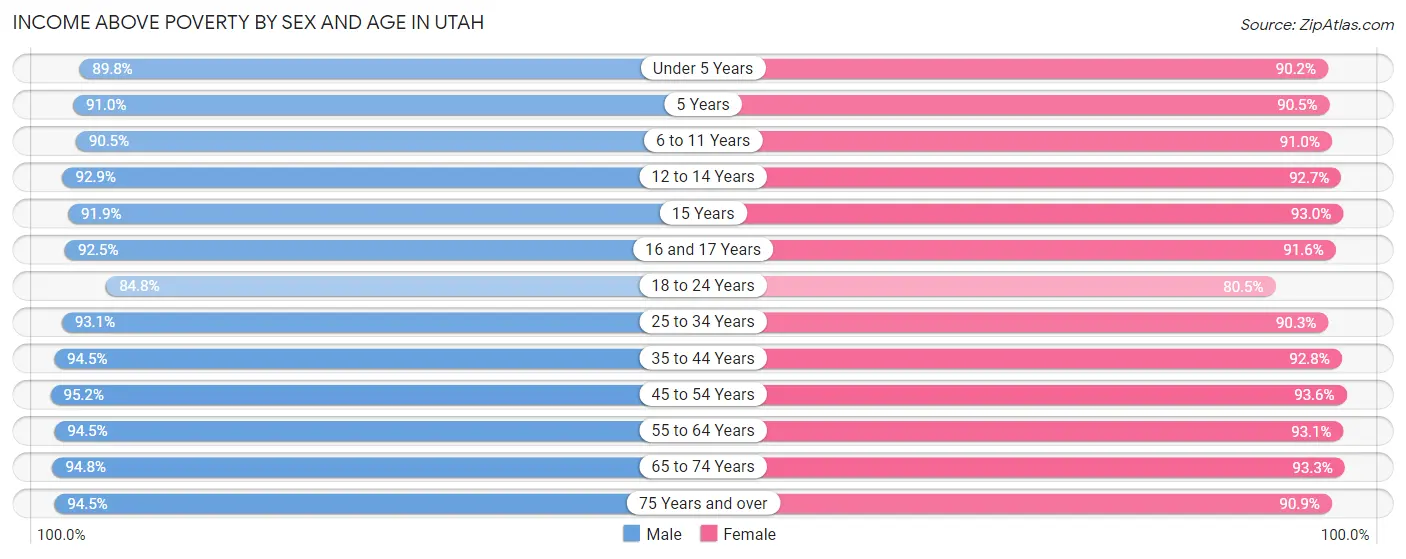
Income Above Poverty by Sex and Age in Utah
According to the poverty statistics in Utah, males aged 45 to 54 years and females aged 45 to 54 years are the age groups that are most secure financially, with 95.2% of males and 93.6% of females in these age groups living above the poverty line.
| Age Bracket | Male | Female |
| Under 5 Years | 109,285 (89.8%) | 104,040 (90.2%) |
| 5 Years | 23,810 (91.0%) | 21,802 (90.5%) |
| 6 to 11 Years | 147,186 (90.5%) | 140,460 (90.9%) |
| 12 to 14 Years | 76,777 (92.9%) | 71,110 (92.7%) |
| 15 Years | 26,787 (91.9%) | 24,637 (93.0%) |
| 16 and 17 Years | 49,637 (92.5%) | 47,572 (91.6%) |
| 18 to 24 Years | 158,525 (84.8%) | 143,671 (80.4%) |
| 25 to 34 Years | 225,207 (93.1%) | 209,175 (90.3%) |
| 35 to 44 Years | 217,298 (94.5%) | 204,219 (92.7%) |
| 45 to 54 Years | 167,941 (95.2%) | 156,671 (93.6%) |
| 55 to 64 Years | 143,274 (94.5%) | 142,197 (93.1%) |
| 65 to 74 Years | 103,761 (94.8%) | 108,816 (93.3%) |
| 75 Years and over | 60,402 (94.5%) | 72,182 (90.9%) |
| Total | 1,509,890 (92.3%) | 1,446,552 (90.7%) |
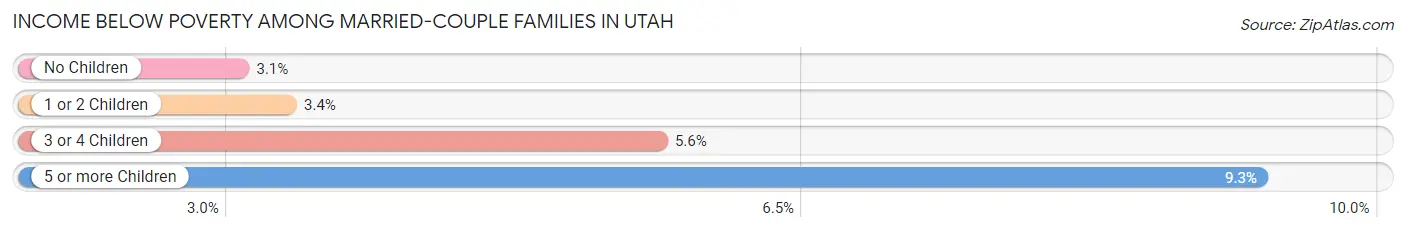
Income Below Poverty Among Married-Couple Families in Utah
The poverty statistics for married-couple families in Utah show that 3.7% or 23,997 of the total 639,567 families live below the poverty line. Families with 5 or more children have the highest poverty rate of 9.3%, comprising of 1,746 families. On the other hand, families with no children have the lowest poverty rate of 3.1%, which includes 9,603 families.
| Children | Above Poverty | Below Poverty |
| No Children | 303,632 (96.9%) | 9,603 (3.1%) |
| 1 or 2 Children | 198,492 (96.6%) | 6,907 (3.4%) |
| 3 or 4 Children | 96,371 (94.4%) | 5,741 (5.6%) |
| 5 or more Children | 17,075 (90.7%) | 1,746 (9.3%) |
| Total | 615,570 (96.3%) | 23,997 (3.7%) |
Income Below Poverty Among Single-Parent Households in Utah
According to the poverty data in Utah, 7.4% or 3,628 single-father households and 17.7% or 16,625 single-mother households are living below the poverty line. Among single-father households, those with 3 or 4 children have the highest poverty rate, with 707 households (15.0%) experiencing poverty. Likewise, among single-mother households, those with 5 or more children have the highest poverty rate, with 1,154 households (64.2%) falling below the poverty line.
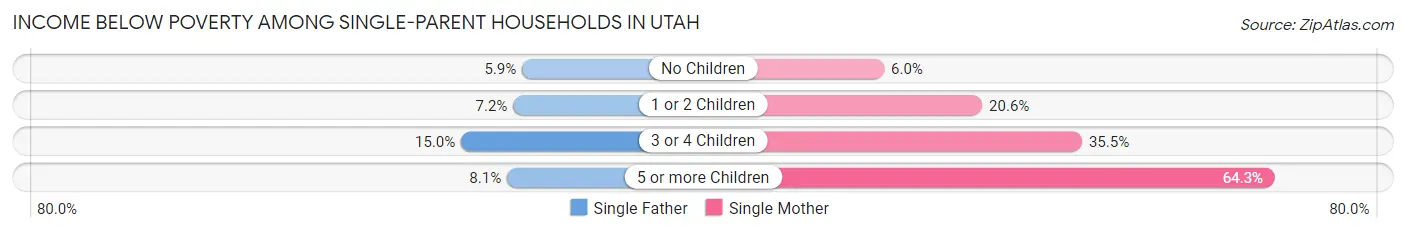
| Children | Single Father | Single Mother |
| No Children | 1,288 (5.9%) | 2,129 (6.0%) |
| 1 or 2 Children | 1,585 (7.2%) | 9,415 (20.6%) |
| 3 or 4 Children | 707 (15.0%) | 3,927 (35.5%) |
| 5 or more Children | 48 (8.1%) | 1,154 (64.2%) |
| Total | 3,628 (7.4%) | 16,625 (17.7%) |
Income Below Poverty Among Married-Couple vs Single-Parent Households in Utah
The poverty data for Utah shows that 23,997 of the married-couple family households (3.7%) and 20,253 of the single-parent households (14.1%) are living below the poverty level. Within the married-couple family households, those with 5 or more children have the highest poverty rate, with 1,746 households (9.3%) falling below the poverty line. Among the single-parent households, those with 5 or more children have the highest poverty rate, with 1,202 household (50.4%) living below poverty.
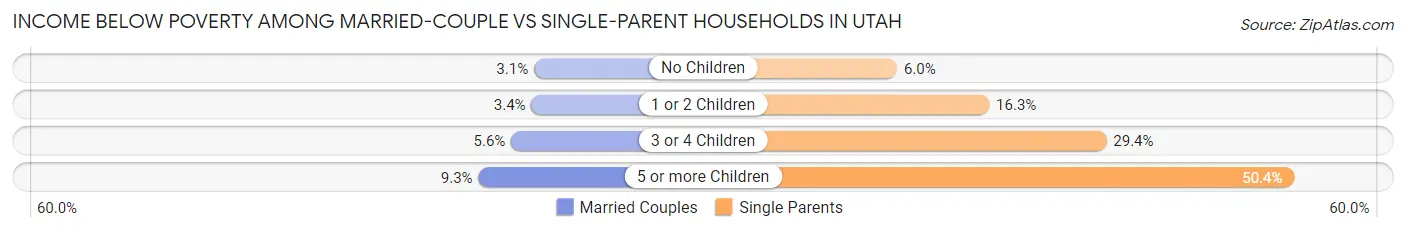
| Children | Married-Couple Families | Single-Parent Households |
| No Children | 9,603 (3.1%) | 3,417 (6.0%) |
| 1 or 2 Children | 6,907 (3.4%) | 11,000 (16.3%) |
| 3 or 4 Children | 5,741 (5.6%) | 4,634 (29.4%) |
| 5 or more Children | 1,746 (9.3%) | 1,202 (50.4%) |
| Total | 23,997 (3.7%) | 20,253 (14.1%) |
Largest Zip Codes by Population in Utah
The largest zip codes in Utah by population are 84043 (77,551), 84015 (69,772), 84096 (69,619), 84404 (65,940), and 84074 (55,917).
1.84043
77,551 (2.36%)
2.84015
69,772 (2.12%)
3.84096
69,619 (2.12%)
4.84404
65,940 (2.01%)
5.84074
55,917 (1.70%)
6.84041
55,009 (1.68%)
7.84003
53,731 (1.64%)
8.84081
52,180 (1.59%)
9.84790
51,773 (1.58%)
10.84120
51,391 (1.56%)
11.84119
51,180 (1.56%)
12.84020
50,635 (1.54%)
13.84321
49,434 (1.51%)
14.84065
48,759 (1.48%)
15.84062
47,430 (1.44%)
16.84770
47,207 (1.44%)
17.84010
47,030 (1.43%)
18.84660
46,229 (1.41%)
19.84005
45,638 (1.39%)
20.84401
45,346 (1.38%)
21.84604
44,575 (1.36%)
22.84118
41,387 (1.26%)
23.84045
40,053 (1.22%)
24.84009
39,891 (1.21%)
25.84121
39,759 (1.21%)
26.84037
39,342 (1.20%)
27.84067
38,952 (1.19%)
28.84088
38,785 (1.18%)
29.84095
38,239 (1.16%)
30.84057
38,222 (1.16%)
Largest Cities by Population in Utah
The largest cities in Utah by population are Salt Lake City (201,269), West Valley City (138,868), West Jordan (116,383), Provo (114,400), and Orem (97,100).
201,269 (6.13%)
138,868 (4.23%)
116,383 (3.54%)
4.Provo
114,400 (3.48%)
5.Orem
97,100 (2.96%)
96,174 (2.93%)
7.Sandy
95,635 (2.91%)
8.Ogden
86,754 (2.64%)
9.Layton
81,726 (2.49%)
10.South Jordan
78,118 (2.38%)
11.Lehi
77,110 (2.35%)
12.Millcreek
63,520 (1.93%)
13.Taylorsville
59,729 (1.82%)
14.Herriman
55,301 (1.68%)
15.Logan
53,246 (1.62%)
16.Draper
50,635 (1.54%)
17.Murray
50,041 (1.52%)
46,109 (1.40%)
19.Bountiful
45,353 (1.38%)
20.Riverton
44,864 (1.37%)
21.Spanish Fork
42,694 (1.30%)
40,391 (1.23%)
23.Roy
39,064 (1.19%)
37,453 (1.14%)
25.Kearns
36,862 (1.12%)
26.Tooele
36,315 (1.11%)
27.Cedar City
35,812 (1.09%)
28.Midvale
35,609 (1.08%)
29.Springville
35,195 (1.07%)
33,986 (1.03%)
Largest Counties by Population in Utah
The largest counties in Utah by population are Salt Lake County (1,180,643), Utah County (666,021), Davis County (363,032), Weber County (262,960), and Washington County (183,297).
1,180,643 (35.95%)
666,021 (20.28%)
363,032 (11.06%)
262,960 (8.01%)
183,297 (5.58%)
134,428 (4.09%)
74,032 (2.25%)
58,291 (1.78%)
58,068 (1.77%)
42,524 (1.29%)
35,951 (1.09%)
35,009 (1.07%)
28,816 (0.88%)
21,667 (0.66%)
20,338 (0.62%)
19,779 (0.60%)
14,524 (0.44%)
13,027 (0.40%)
12,367 (0.38%)
20.Juab County
11,943 (0.36%)
21.Emery County
9,898 (0.30%)
22.Grand County
9,680 (0.29%)
23.Kane County
7,814 (0.24%)
7,102 (0.22%)
5,121 (0.16%)
26.Rich County
2,543 (0.08%)
27.Wayne County
2,532 (0.08%)
28.Piute County
1,764 (0.05%)
638 (0.02%)
Race in Utah
The most populous races in Utah are White / Caucasian (2,705,194 | 82.4%), Hispanic or Latino (480,843 | 14.6%), and Two or more Races (224,725 | 6.8%).
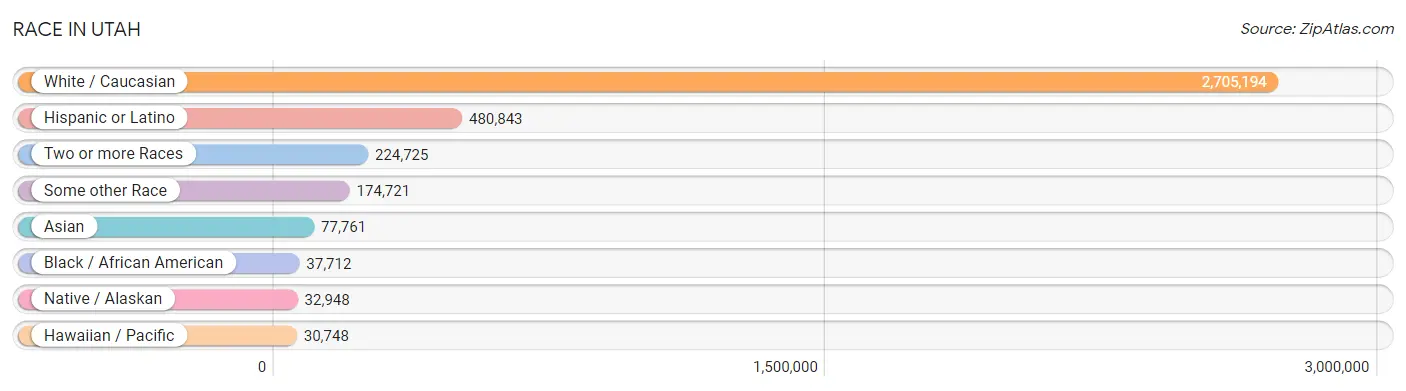
| Race | # Population | % Population |
| Asian | 77,761 | 2.4% |
| Black / African American | 37,712 | 1.1% |
| Hawaiian / Pacific | 30,748 | 0.9% |
| Hispanic or Latino | 480,843 | 14.6% |
| Native / Alaskan | 32,948 | 1.0% |
| White / Caucasian | 2,705,194 | 82.4% |
| Two or more Races | 224,725 | 6.8% |
| Some other Race | 174,721 | 5.3% |
| Total | 3,283,809 | 100.0% |
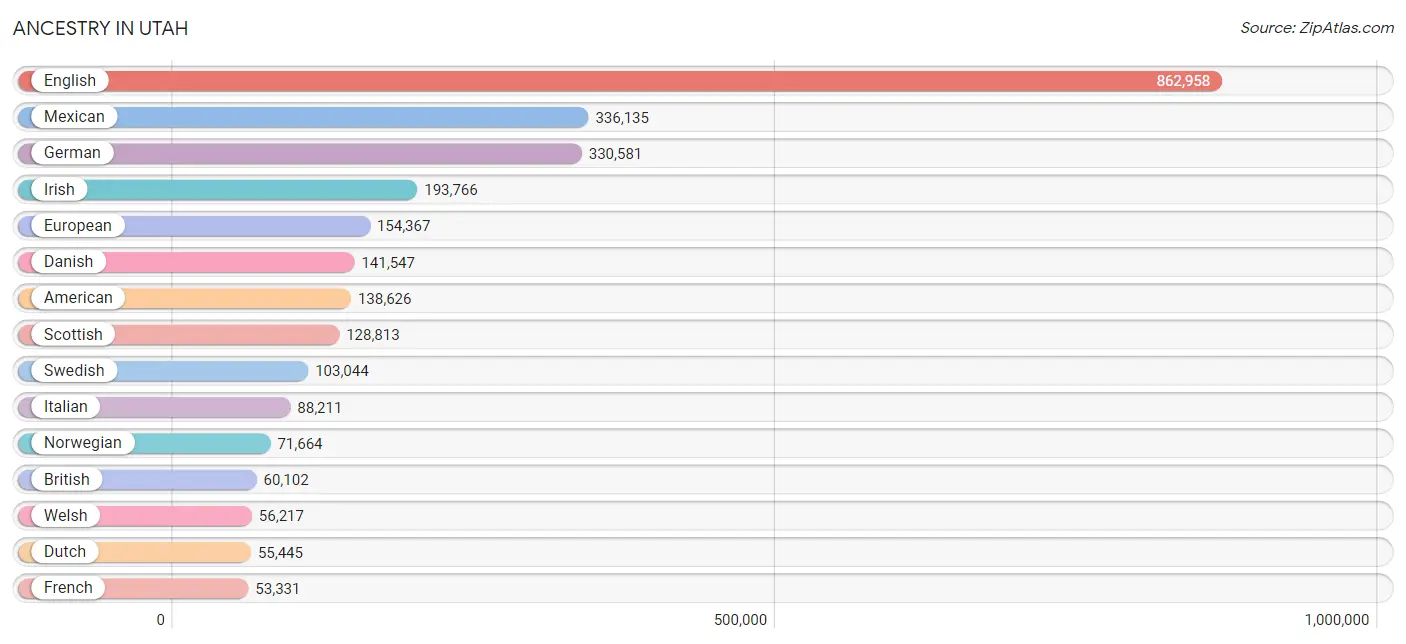
Ancestry in Utah
The most populous ancestries reported in Utah are English (862,958 | 26.3%), Mexican (336,135 | 10.2%), German (330,581 | 10.1%), Irish (193,766 | 5.9%), and European (154,367 | 4.7%), together accounting for 57.2% of all Utah residents.
| Ancestry | # Population | % Population |
| Afghan | 617 | 0.0% |
| African | 6,066 | 0.2% |
| Alaska Native | 226 | 0.0% |
| Alaskan Athabascan | 135 | 0.0% |
| Albanian | 436 | 0.0% |
| Aleut | 76 | 0.0% |
| Alsatian | 2 | 0.0% |
| American | 138,626 | 4.2% |
| Apache | 1,648 | 0.1% |
| Arab | 9,023 | 0.3% |
| Arapaho | 220 | 0.0% |
| Argentinean | 6,426 | 0.2% |
| Armenian | 2,652 | 0.1% |
| Assyrian / Chaldean / Syriac | 27 | 0.0% |
| Australian | 2,003 | 0.1% |
| Austrian | 3,959 | 0.1% |
| Bahamian | 35 | 0.0% |
| Bangladeshi | 824 | 0.0% |
| Barbadian | 17 | 0.0% |
| Basque | 1,731 | 0.1% |
| Belgian | 1,998 | 0.1% |
| Belizean | 162 | 0.0% |
| Bermudan | 27 | 0.0% |
| Bhutanese | 18,767 | 0.6% |
| Blackfeet | 1,901 | 0.1% |
| Bolivian | 1,644 | 0.1% |
| Brazilian | 7,476 | 0.2% |
| British | 60,102 | 1.8% |
| British West Indian | 95 | 0.0% |
| Bulgarian | 267 | 0.0% |
| Burmese | 11,469 | 0.4% |
| Cajun | 267 | 0.0% |
| Cambodian | 499 | 0.0% |
| Canadian | 8,659 | 0.3% |
| Cape Verdean | 318 | 0.0% |
| Carpatho Rusyn | 18 | 0.0% |
| Celtic | 394 | 0.0% |
| Central American | 30,960 | 0.9% |
| Central American Indian | 2,434 | 0.1% |
| Cherokee | 6,393 | 0.2% |
| Cheyenne | 266 | 0.0% |
| Chickasaw | 538 | 0.0% |
| Chilean | 5,740 | 0.2% |
| Chinese | 320 | 0.0% |
| Chippewa | 504 | 0.0% |
| Choctaw | 1,241 | 0.0% |
| Colombian | 7,337 | 0.2% |
| Comanche | 224 | 0.0% |
| Costa Rican | 1,299 | 0.0% |
| Cree | 63 | 0.0% |
| Creek | 434 | 0.0% |
| Croatian | 3,064 | 0.1% |
| Crow | 228 | 0.0% |
| Cuban | 3,487 | 0.1% |
| Cypriot | 47 | 0.0% |
| Czech | 5,206 | 0.2% |
| Czechoslovakian | 1,027 | 0.0% |
| Danish | 141,547 | 4.3% |
| Delaware | 152 | 0.0% |
| Dominican | 3,377 | 0.1% |
| Dutch | 55,445 | 1.7% |
| Dutch West Indian | 99 | 0.0% |
| Eastern European | 4,824 | 0.2% |
| Ecuadorian | 4,210 | 0.1% |
| Egyptian | 991 | 0.0% |
| English | 862,958 | 26.3% |
| Estonian | 186 | 0.0% |
| Ethiopian | 1,053 | 0.0% |
| European | 154,367 | 4.7% |
| Fijian | 1,217 | 0.0% |
| Filipino | 1,034 | 0.0% |
| Finnish | 6,260 | 0.2% |
| French | 53,331 | 1.6% |
| French American Indian | 213 | 0.0% |
| French Canadian | 6,700 | 0.2% |
| German | 330,581 | 10.1% |
| German Russian | 28 | 0.0% |
| Ghanaian | 564 | 0.0% |
| Greek | 12,864 | 0.4% |
| Guamanian / Chamorro | 1,432 | 0.0% |
| Guatemalan | 10,013 | 0.3% |
| Guyanese | 112 | 0.0% |
| Haitian | 739 | 0.0% |
| Honduran | 3,833 | 0.1% |
| Hopi | 615 | 0.0% |
| Hungarian | 5,472 | 0.2% |
| Icelander | 4,227 | 0.1% |
| Indian (Asian) | 25,420 | 0.8% |
| Indonesian | 2,121 | 0.1% |
| Inupiat | 420 | 0.0% |
| Iranian | 3,425 | 0.1% |
| Iraqi | 1,813 | 0.1% |
| Irish | 193,766 | 5.9% |
| Iroquois | 568 | 0.0% |
| Israeli | 519 | 0.0% |
| Italian | 88,211 | 2.7% |
| Jamaican | 1,017 | 0.0% |
| Japanese | 3,410 | 0.1% |
| Jordanian | 373 | 0.0% |
| Kenyan | 752 | 0.0% |
| Kiowa | 31 | 0.0% |
| Korean | 20,808 | 0.6% |
| Laotian | 1,284 | 0.0% |
| Latvian | 500 | 0.0% |
| Lebanese | 2,186 | 0.1% |
| Liberian | 198 | 0.0% |
| Lithuanian | 1,878 | 0.1% |
| Lumbee | 99 | 0.0% |
| Luxembourger | 99 | 0.0% |
| Macedonian | 107 | 0.0% |
| Malaysian | 2,659 | 0.1% |
| Maltese | 116 | 0.0% |
| Marshallese | 178 | 0.0% |
| Menominee | 22 | 0.0% |
| Mexican | 336,135 | 10.2% |
| Mexican American Indian | 5,763 | 0.2% |
| Mongolian | 426 | 0.0% |
| Moroccan | 484 | 0.0% |
| Native Hawaiian | 11,330 | 0.4% |
| Navajo | 18,735 | 0.6% |
| New Zealander | 590 | 0.0% |
| Nicaraguan | 1,039 | 0.0% |
| Nigerian | 1,435 | 0.0% |
| Northern European | 10,349 | 0.3% |
| Norwegian | 71,664 | 2.2% |
| Okinawan | 155 | 0.0% |
| Osage | 49 | 0.0% |
| Ottawa | 44 | 0.0% |
| Paiute | 818 | 0.0% |
| Pakistani | 3,853 | 0.1% |
| Palestinian | 392 | 0.0% |
| Panamanian | 614 | 0.0% |
| Paraguayan | 512 | 0.0% |
| Pennsylvania German | 248 | 0.0% |
| Peruvian | 13,056 | 0.4% |
| Pima | 296 | 0.0% |
| Polish | 25,131 | 0.8% |
| Portuguese | 6,015 | 0.2% |
| Potawatomi | 138 | 0.0% |
| Pueblo | 823 | 0.0% |
| Puerto Rican | 12,349 | 0.4% |
| Puget Sound Salish | 106 | 0.0% |
| Romanian | 1,879 | 0.1% |
| Russian | 10,640 | 0.3% |
| Salvadoran | 13,868 | 0.4% |
| Samoan | 18,322 | 0.6% |
| Scandinavian | 49,270 | 1.5% |
| Scotch-Irish | 26,093 | 0.8% |
| Scottish | 128,813 | 3.9% |
| Seminole | 23 | 0.0% |
| Senegalese | 6 | 0.0% |
| Serbian | 1,134 | 0.0% |
| Shoshone | 1,485 | 0.1% |
| Sierra Leonean | 150 | 0.0% |
| Sioux | 1,896 | 0.1% |
| Slavic | 858 | 0.0% |
| Slovak | 1,362 | 0.0% |
| Slovene | 871 | 0.0% |
| Somali | 2,542 | 0.1% |
| South African | 906 | 0.0% |
| South American | 51,630 | 1.6% |
| South American Indian | 1,878 | 0.1% |
| Spaniard | 13,469 | 0.4% |
| Spanish | 13,869 | 0.4% |
| Spanish American | 381 | 0.0% |
| Spanish American Indian | 425 | 0.0% |
| Sri Lankan | 12,332 | 0.4% |
| Subsaharan African | 18,845 | 0.6% |
| Sudanese | 2,204 | 0.1% |
| Swedish | 103,044 | 3.1% |
| Swiss | 34,705 | 1.1% |
| Syrian | 863 | 0.0% |
| Taiwanese | 18 | 0.0% |
| Thai | 14,718 | 0.4% |
| Tlingit-Haida | 280 | 0.0% |
| Tohono O'Odham | 21 | 0.0% |
| Tongan | 18,122 | 0.5% |
| Trinidadian and Tobagonian | 259 | 0.0% |
| Tsimshian | 21 | 0.0% |
| Turkish | 925 | 0.0% |
| Ugandan | 223 | 0.0% |
| Ukrainian | 3,359 | 0.1% |
| Uruguayan | 1,072 | 0.0% |
| Ute | 3,668 | 0.1% |
| Venezuelan | 11,264 | 0.3% |
| Vietnamese | 148 | 0.0% |
| Welsh | 56,217 | 1.7% |
| West Indian | 162 | 0.0% |
| Yakama | 110 | 0.0% |
| Yaqui | 208 | 0.0% |
| Yugoslavian | 4,397 | 0.1% |
| Yuman | 69 | 0.0% |
| Yup'ik | 82 | 0.0% |
| Zimbabwean | 109 | 0.0% | View All 194 Rows |
Immigrants in Utah
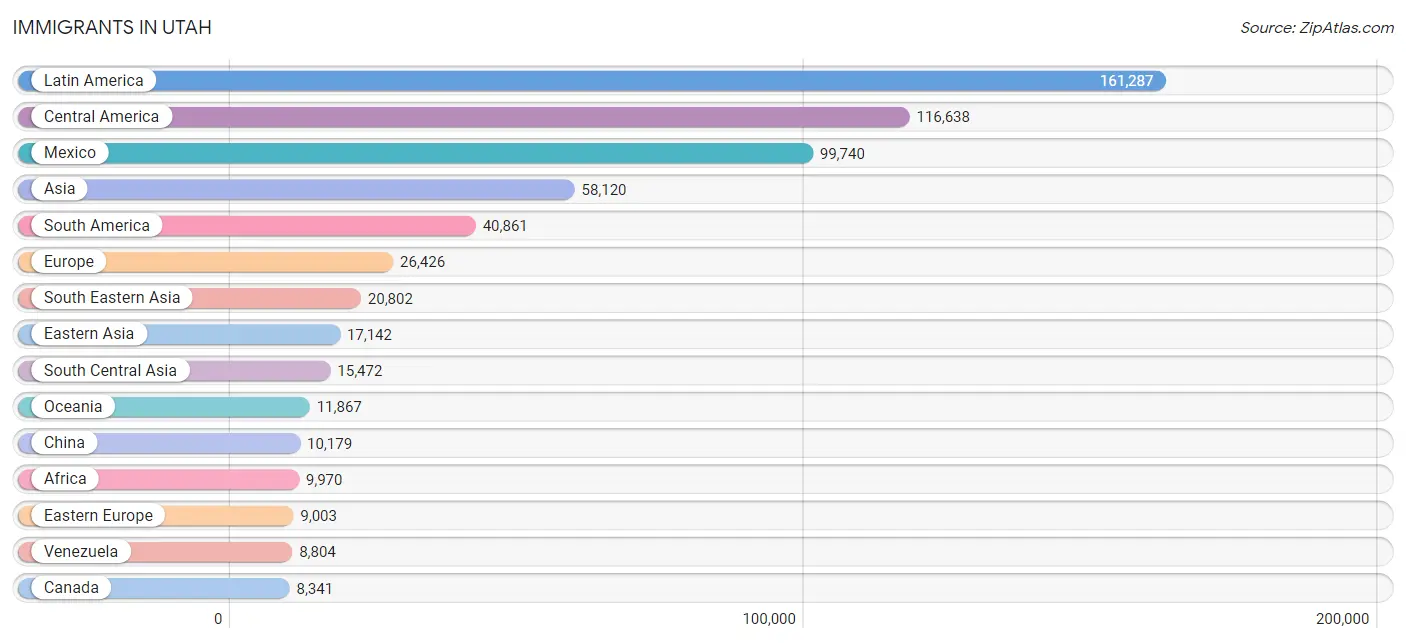
The most numerous immigrant groups reported in Utah came from Latin America (161,287 | 4.9%), Central America (116,638 | 3.5%), Mexico (99,740 | 3.0%), Asia (58,120 | 1.8%), and South America (40,861 | 1.2%), together accounting for 14.5% of all Utah residents.
| Immigration Origin | # Population | % Population |
| Afghanistan | 627 | 0.0% |
| Africa | 9,970 | 0.3% |
| Albania | 106 | 0.0% |
| Argentina | 3,570 | 0.1% |
| Armenia | 340 | 0.0% |
| Asia | 58,120 | 1.8% |
| Australia | 1,280 | 0.0% |
| Austria | 217 | 0.0% |
| Azores | 24 | 0.0% |
| Bahamas | 10 | 0.0% |
| Bangladesh | 189 | 0.0% |
| Barbados | 18 | 0.0% |
| Belarus | 227 | 0.0% |
| Belgium | 279 | 0.0% |
| Belize | 104 | 0.0% |
| Bolivia | 977 | 0.0% |
| Bosnia and Herzegovina | 1,743 | 0.1% |
| Brazil | 7,644 | 0.2% |
| Bulgaria | 286 | 0.0% |
| Cabo Verde | 257 | 0.0% |
| Cambodia | 1,529 | 0.1% |
| Cameroon | 36 | 0.0% |
| Canada | 8,341 | 0.3% |
| Caribbean | 3,788 | 0.1% |
| Central America | 116,638 | 3.5% |
| Chile | 3,479 | 0.1% |
| China | 10,179 | 0.3% |
| Colombia | 5,555 | 0.2% |
| Congo | 541 | 0.0% |
| Costa Rica | 497 | 0.0% |
| Croatia | 166 | 0.0% |
| Cuba | 836 | 0.0% |
| Czechoslovakia | 489 | 0.0% |
| Denmark | 570 | 0.0% |
| Dominican Republic | 1,814 | 0.1% |
| Eastern Africa | 3,956 | 0.1% |
| Eastern Asia | 17,142 | 0.5% |
| Eastern Europe | 9,003 | 0.3% |
| Ecuador | 1,957 | 0.1% |
| Egypt | 547 | 0.0% |
| El Salvador | 7,062 | 0.2% |
| England | 2,900 | 0.1% |
| Eritrea | 195 | 0.0% |
| Ethiopia | 692 | 0.0% |
| Europe | 26,426 | 0.8% |
| Fiji | 353 | 0.0% |
| France | 996 | 0.0% |
| Germany | 4,247 | 0.1% |
| Ghana | 415 | 0.0% |
| Greece | 400 | 0.0% |
| Guatemala | 5,902 | 0.2% |
| Guyana | 54 | 0.0% |
| Haiti | 389 | 0.0% |
| Honduras | 2,365 | 0.1% |
| Hong Kong | 1,269 | 0.0% |
| Hungary | 444 | 0.0% |
| India | 8,294 | 0.3% |
| Indonesia | 291 | 0.0% |
| Iran | 2,137 | 0.1% |
| Iraq | 1,700 | 0.1% |
| Ireland | 217 | 0.0% |
| Israel | 196 | 0.0% |
| Italy | 685 | 0.0% |
| Jamaica | 527 | 0.0% |
| Japan | 2,014 | 0.1% |
| Jordan | 202 | 0.0% |
| Kazakhstan | 193 | 0.0% |
| Kenya | 297 | 0.0% |
| Korea | 4,524 | 0.1% |
| Kuwait | 317 | 0.0% |
| Laos | 1,228 | 0.0% |
| Latin America | 161,287 | 4.9% |
| Latvia | 13 | 0.0% |
| Lebanon | 203 | 0.0% |
| Liberia | 242 | 0.0% |
| Lithuania | 111 | 0.0% |
| Malaysia | 528 | 0.0% |
| Mexico | 99,740 | 3.0% |
| Micronesia | 917 | 0.0% |
| Middle Africa | 995 | 0.0% |
| Moldova | 263 | 0.0% |
| Morocco | 156 | 0.0% |
| Nepal | 988 | 0.0% |
| Netherlands | 1,545 | 0.1% |
| Nicaragua | 640 | 0.0% |
| Nigeria | 498 | 0.0% |
| North Macedonia | 14 | 0.0% |
| Northern Africa | 1,638 | 0.1% |
| Northern Europe | 7,056 | 0.2% |
| Norway | 281 | 0.0% |
| Oceania | 11,867 | 0.4% |
| Pakistan | 2,160 | 0.1% |
| Panama | 307 | 0.0% |
| Peru | 7,901 | 0.2% |
| Philippines | 6,468 | 0.2% |
| Poland | 865 | 0.0% |
| Portugal | 139 | 0.0% |
| Romania | 634 | 0.0% |
| Russia | 1,555 | 0.1% |
| Saudi Arabia | 455 | 0.0% |
| Scotland | 415 | 0.0% |
| Senegal | 6 | 0.0% |
| Serbia | 136 | 0.0% |
| Sierra Leone | 162 | 0.0% |
| Singapore | 351 | 0.0% |
| Somalia | 782 | 0.0% |
| South Africa | 896 | 0.0% |
| South America | 40,861 | 1.2% |
| South Central Asia | 15,472 | 0.5% |
| South Eastern Asia | 20,802 | 0.6% |
| Southern Europe | 2,555 | 0.1% |
| Spain | 1,315 | 0.0% |
| Sri Lanka | 198 | 0.0% |
| Sudan | 903 | 0.0% |
| Sweden | 483 | 0.0% |
| Switzerland | 373 | 0.0% |
| Syria | 330 | 0.0% |
| Taiwan | 893 | 0.0% |
| Thailand | 2,087 | 0.1% |
| Trinidad and Tobago | 150 | 0.0% |
| Turkey | 483 | 0.0% |
| Uganda | 140 | 0.0% |
| Ukraine | 808 | 0.0% |
| Uruguay | 642 | 0.0% |
| Uzbekistan | 124 | 0.0% |
| Venezuela | 8,804 | 0.3% |
| Vietnam | 7,211 | 0.2% |
| Western Africa | 2,074 | 0.1% |
| Western Asia | 4,594 | 0.1% |
| Western Europe | 7,671 | 0.2% |
| Yemen | 12 | 0.0% |
| Zaire | 386 | 0.0% |
| Zimbabwe | 274 | 0.0% | View All 133 Rows |
Sex and Age in Utah
Sex and Age in Utah
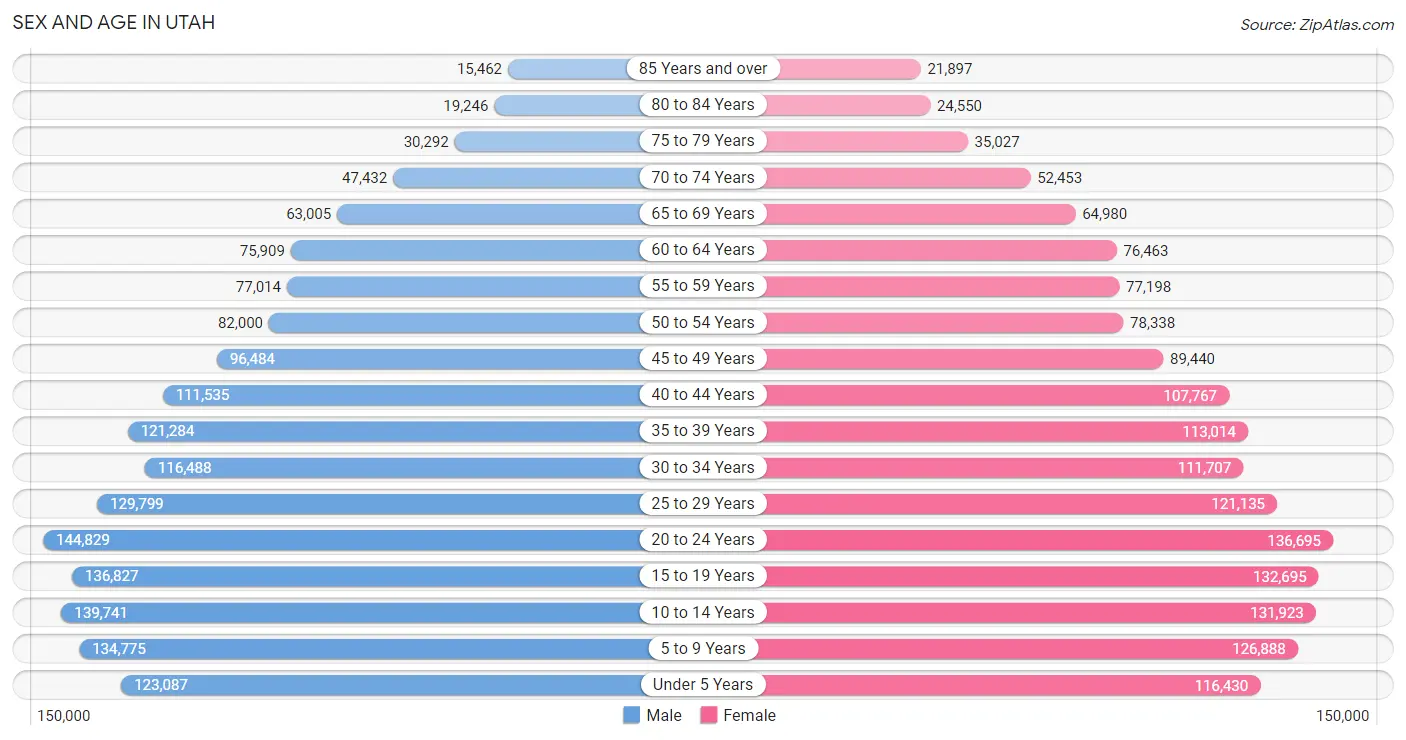
The most populous age groups in Utah are 20 to 24 Years (144,829 | 8.7%) for men and 20 to 24 Years (136,695 | 8.5%) for women.
| Age Bracket | Male | Female |
| Under 5 Years | 123,087 (7.4%) | 116,430 (7.2%) |
| 5 to 9 Years | 134,775 (8.1%) | 126,888 (7.8%) |
| 10 to 14 Years | 139,741 (8.4%) | 131,923 (8.2%) |
| 15 to 19 Years | 136,827 (8.2%) | 132,695 (8.2%) |
| 20 to 24 Years | 144,829 (8.7%) | 136,695 (8.5%) |
| 25 to 29 Years | 129,799 (7.8%) | 121,135 (7.5%) |
| 30 to 34 Years | 116,488 (7.0%) | 111,707 (6.9%) |
| 35 to 39 Years | 121,284 (7.3%) | 113,014 (7.0%) |
| 40 to 44 Years | 111,535 (6.7%) | 107,767 (6.7%) |
| 45 to 49 Years | 96,484 (5.8%) | 89,440 (5.5%) |
| 50 to 54 Years | 82,000 (4.9%) | 78,338 (4.8%) |
| 55 to 59 Years | 77,014 (4.6%) | 77,198 (4.8%) |
| 60 to 64 Years | 75,909 (4.6%) | 76,463 (4.7%) |
| 65 to 69 Years | 63,005 (3.8%) | 64,980 (4.0%) |
| 70 to 74 Years | 47,432 (2.9%) | 52,453 (3.2%) |
| 75 to 79 Years | 30,292 (1.8%) | 35,027 (2.2%) |
| 80 to 84 Years | 19,246 (1.2%) | 24,550 (1.5%) |
| 85 Years and over | 15,462 (0.9%) | 21,897 (1.3%) |
| Total | 1,665,209 (100.0%) | 1,618,600 (100.0%) |
Families and Households in Utah
Median Family Size in Utah
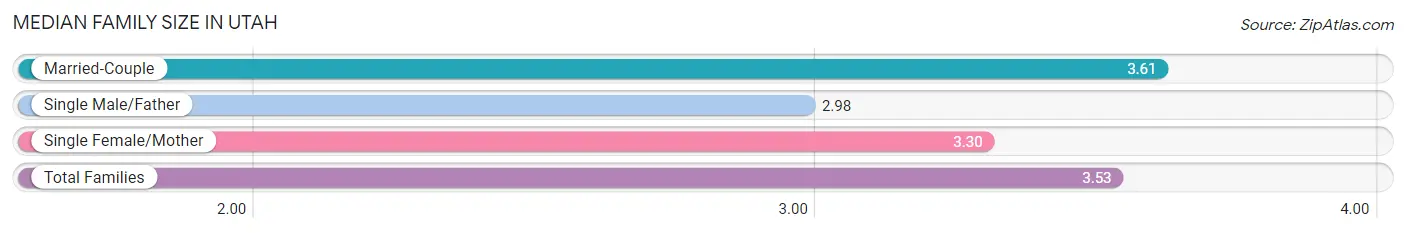
The median family size in Utah is 3.53 persons per family, with married-couple families (639,567 | 81.7%) accounting for the largest median family size of 3.61 persons per family. On the other hand, single male/father families (49,243 | 6.3%) represent the smallest median family size with 2.98 persons per family.
| Family Type | # Families | Family Size |
| Married-Couple | 639,567 (81.7%) | 3.61 |
| Single Male/Father | 49,243 (6.3%) | 2.98 |
| Single Female/Mother | 93,858 (12.0%) | 3.30 |
| Total Families | 782,668 (100.0%) | 3.53 |
Median Household Size in Utah
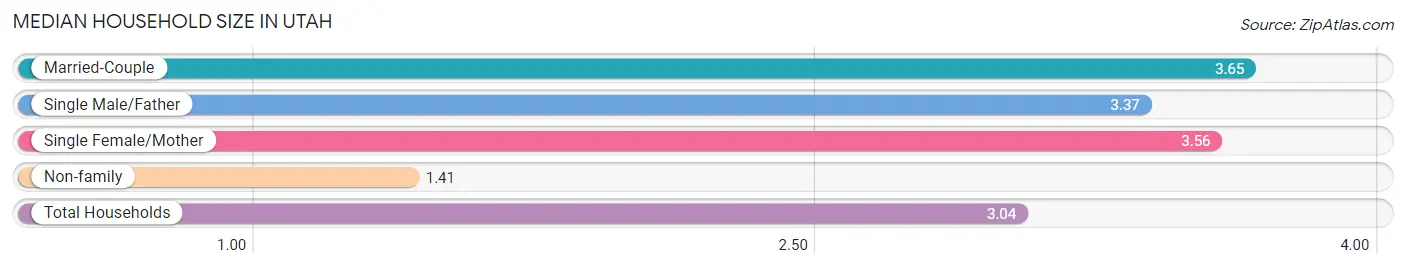
The median household size in Utah is 3.04 persons per household, with married-couple households (639,567 | 60.2%) accounting for the largest median household size of 3.65 persons per household. non-family households (280,151 | 26.4%) represent the smallest median household size with 1.41 persons per household.
| Household Type | # Households | Household Size |
| Married-Couple | 639,567 (60.2%) | 3.65 |
| Single Male/Father | 49,243 (4.6%) | 3.37 |
| Single Female/Mother | 93,858 (8.8%) | 3.56 |
| Non-family | 280,151 (26.4%) | 1.41 |
| Total Households | 1,062,819 (100.0%) | 3.04 |
Household Size by Marriage Status in Utah
Out of a total of 1,062,819 households in Utah, 782,668 (73.6%) are family households, while 280,151 (26.4%) are nonfamily households. The most numerous type of family households are 2-person households, comprising 287,580, and the most common type of nonfamily households are 1-person households, comprising 211,477.
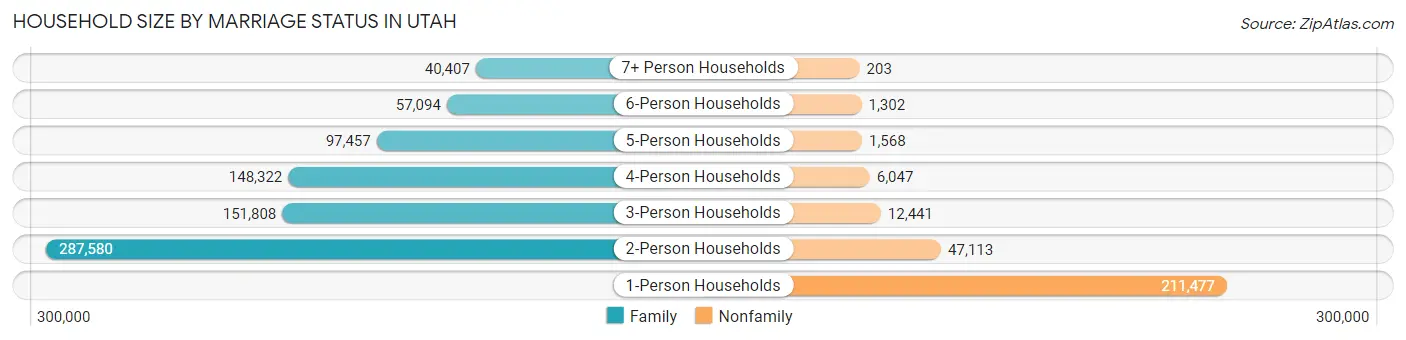
| Household Size | Family Households | Nonfamily Households |
| 1-Person Households | - | 211,477 (19.9%) |
| 2-Person Households | 287,580 (27.1%) | 47,113 (4.4%) |
| 3-Person Households | 151,808 (14.3%) | 12,441 (1.2%) |
| 4-Person Households | 148,322 (14.0%) | 6,047 (0.6%) |
| 5-Person Households | 97,457 (9.2%) | 1,568 (0.2%) |
| 6-Person Households | 57,094 (5.4%) | 1,302 (0.1%) |
| 7+ Person Households | 40,407 (3.8%) | 203 (0.0%) |
| Total | 782,668 (73.6%) | 280,151 (26.4%) |
Female Fertility in Utah
Fertility by Age in Utah
Average fertility rate in Utah is 59.0 births per 1,000 women. Women in the age bracket of 20 to 34 years have the highest fertility rate with 104.0 births per 1,000 women. Women in the age bracket of 20 to 34 years acount for 78.5% of all women with births.
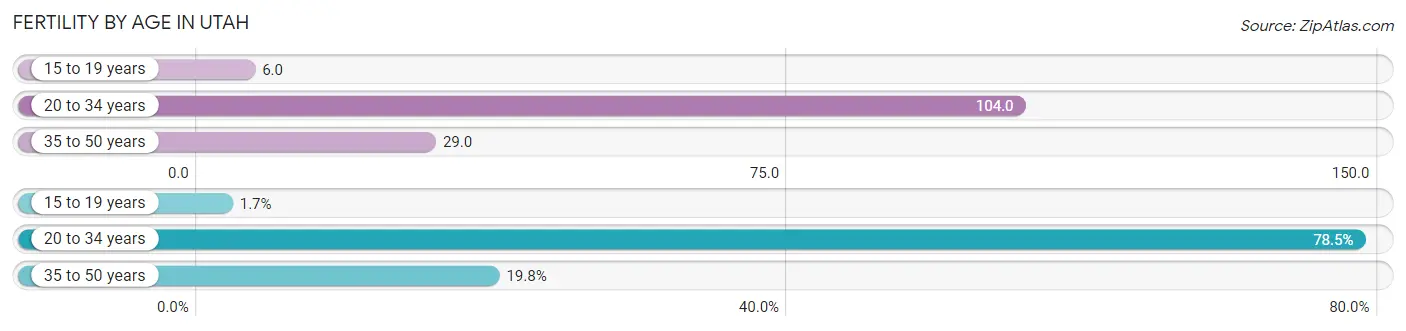
| Age Bracket | Women with Births | Births / 1,000 Women |
| 15 to 19 years | 823 (1.7%) | 6.0 |
| 20 to 34 years | 38,407 (78.5%) | 104.0 |
| 35 to 50 years | 9,676 (19.8%) | 29.0 |
| Total | 48,906 (100.0%) | 59.0 |
Fertility by Age by Marriage Status in Utah
85.6% of women with births (48,906) in Utah are married. The highest percentage of unmarried women with births falls into 15 to 19 years age bracket with 71.3% of them unmarried at the time of birth, while the lowest percentage of unmarried women with births belong to 35 to 50 years age bracket with 11.4% of them unmarried.
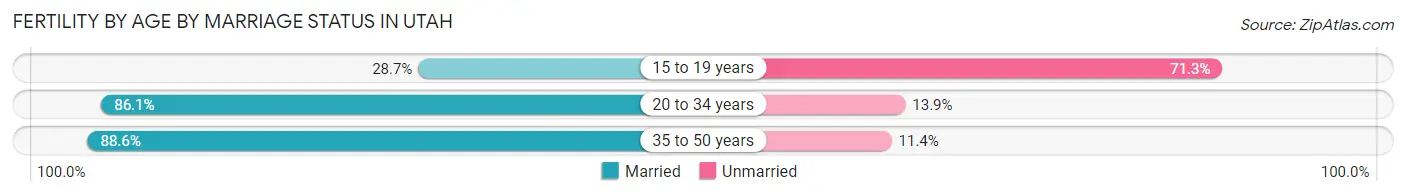
| Age Bracket | Married | Unmarried |
| 15 to 19 years | 236 (28.7%) | 587 (71.3%) |
| 20 to 34 years | 33,068 (86.1%) | 5,339 (13.9%) |
| 35 to 50 years | 8,573 (88.6%) | 1,103 (11.4%) |
| Total | 41,864 (85.6%) | 7,042 (14.4%) |
Fertility by Education in Utah
Average fertility rate in Utah is 59.0 births per 1,000 women. Women with the education attainment of bachelor's degree have the highest fertility rate of 84.0 births per 1,000 women, while women with the education attainment of less than high school have the lowest fertility at 26.0 births per 1,000 women. Women with the education attainment of college or associate's degree represent 33.6% of all women with births.
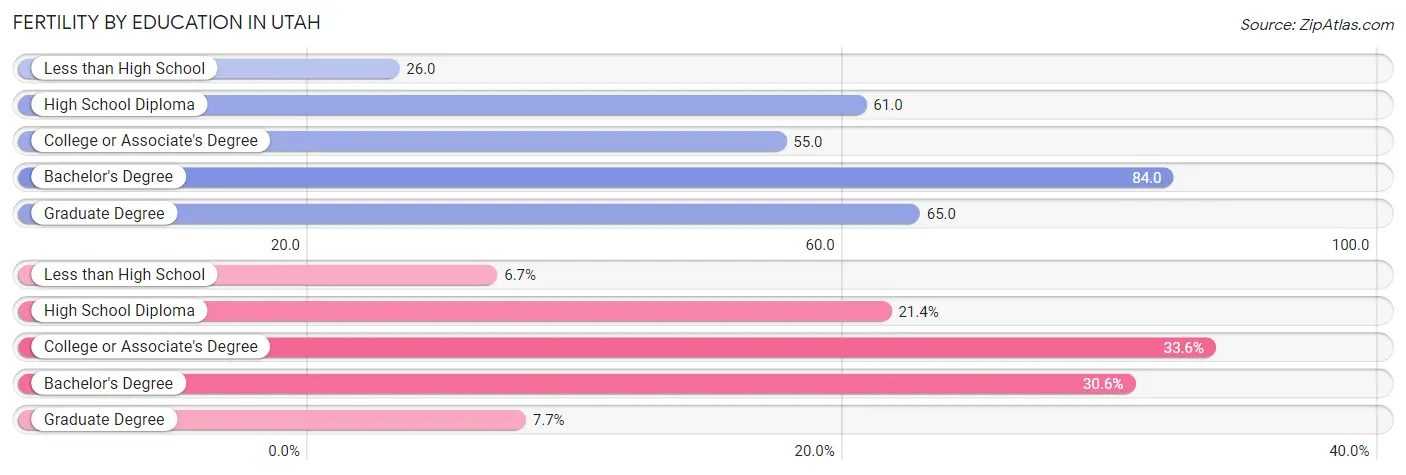
| Educational Attainment | Women with Births | Births / 1,000 Women |
| Less than High School | 3,263 (6.7%) | 26.0 |
| High School Diploma | 10,484 (21.4%) | 61.0 |
| College or Associate's Degree | 16,426 (33.6%) | 55.0 |
| Bachelor's Degree | 14,950 (30.6%) | 84.0 |
| Graduate Degree | 3,783 (7.7%) | 65.0 |
| Total | 48,906 (100.0%) | 59.0 |
Fertility by Education by Marriage Status in Utah
14.4% of women with births in Utah are unmarried. Women with the educational attainment of graduate degree are most likely to be married with 98.8% of them married at childbirth, while women with the educational attainment of less than high school are least likely to be married with 32.9% of them unmarried at childbirth.
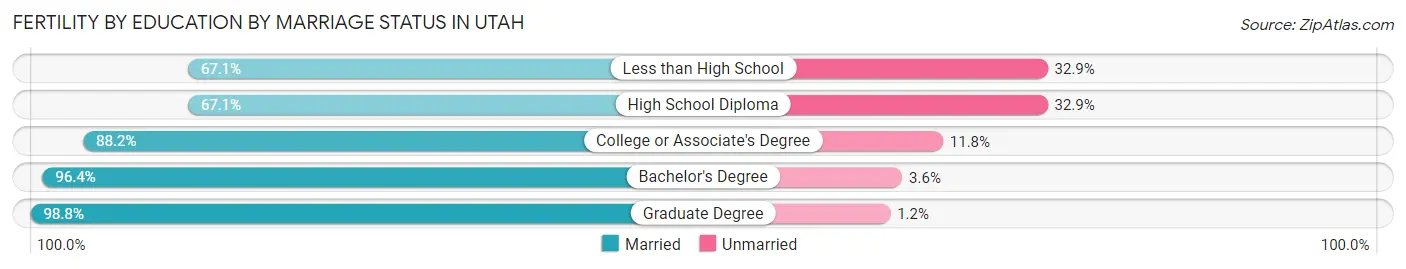
| Educational Attainment | Married | Unmarried |
| Less than High School | 2,189 (67.1%) | 1,074 (32.9%) |
| High School Diploma | 7,035 (67.1%) | 3,449 (32.9%) |
| College or Associate's Degree | 14,488 (88.2%) | 1,938 (11.8%) |
| Bachelor's Degree | 14,412 (96.4%) | 538 (3.6%) |
| Graduate Degree | 3,738 (98.8%) | 45 (1.2%) |
| Total | 41,864 (85.6%) | 7,042 (14.4%) |
Employment Characteristics in Utah
Employment by Class of Employer in Utah
Among the 1,617,201 employed individuals in Utah, private company employees (1,106,617 | 68.4%), not-for-profit organizations (113,064 | 7.0%), and local government employees (105,617 | 6.5%) make up the most common classes of employment.
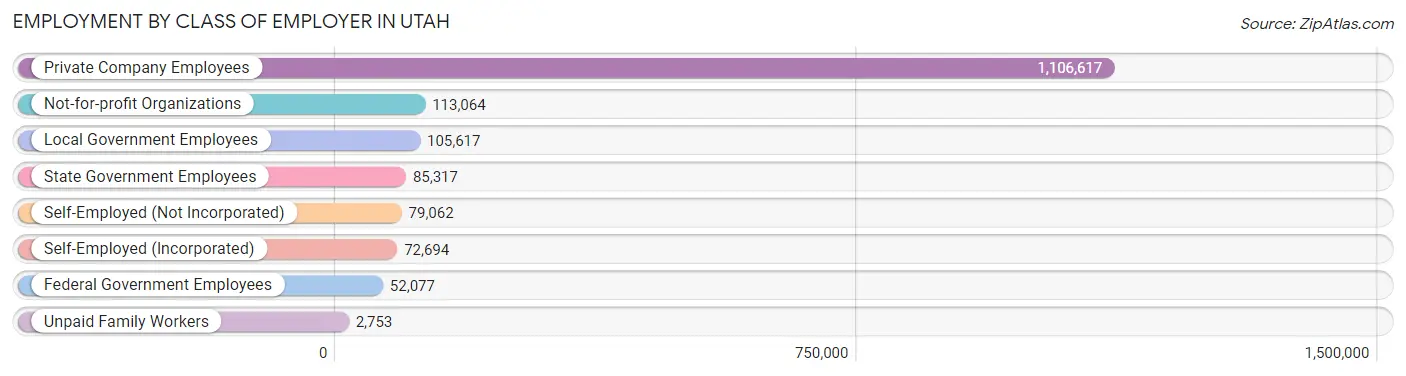
| Employer Class | # Employees | % Employees |
| Private Company Employees | 1,106,617 | 68.4% |
| Self-Employed (Incorporated) | 72,694 | 4.5% |
| Self-Employed (Not Incorporated) | 79,062 | 4.9% |
| Not-for-profit Organizations | 113,064 | 7.0% |
| Local Government Employees | 105,617 | 6.5% |
| State Government Employees | 85,317 | 5.3% |
| Federal Government Employees | 52,077 | 3.2% |
| Unpaid Family Workers | 2,753 | 0.2% |
| Total | 1,617,201 | 100.0% |
Employment Status by Age in Utah
According to the labor force statistics for Utah, out of the total population over 16 years of age (2,454,789), 69.4% or 1,703,624 individuals are in the labor force, with 3.4% or 57,923 of them unemployed. The age group with the highest labor force participation rate is 25 to 29 years, with 84.2% or 211,286 individuals in the labor force. Within the labor force, the 16 to 19 years age range has the highest percentage of unemployed individuals, with 9.7% or 11,548 of them being unemployed.
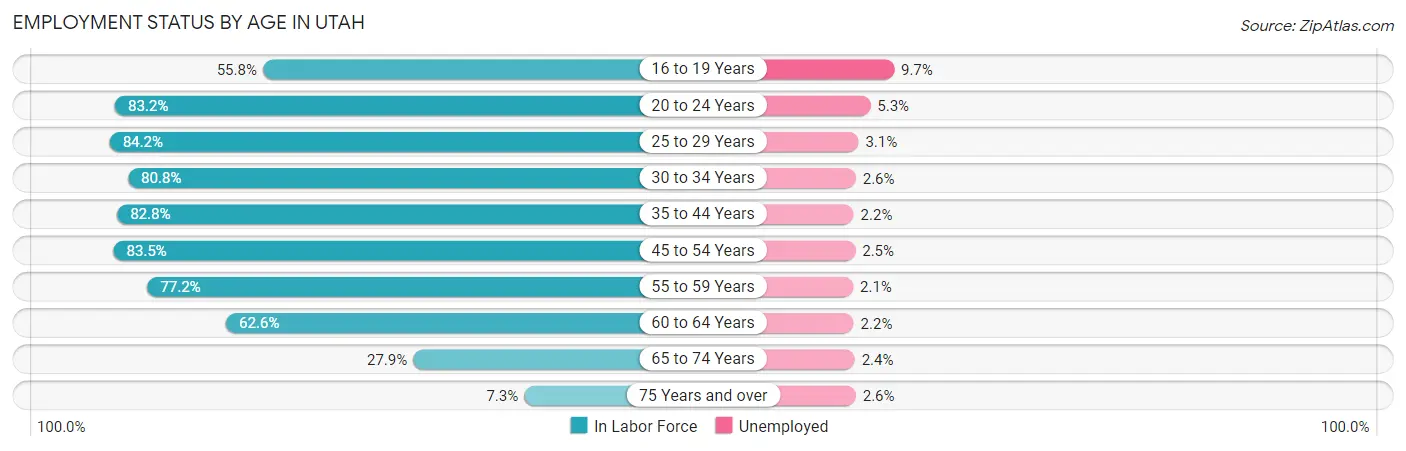
| Age Bracket | In Labor Force | Unemployed |
| 16 to 19 Years | 119,047 (55.8%) | 11,548 (9.7%) |
| 20 to 24 Years | 234,228 (83.2%) | 12,414 (5.3%) |
| 25 to 29 Years | 211,286 (84.2%) | 6,550 (3.1%) |
| 30 to 34 Years | 184,382 (80.8%) | 4,794 (2.6%) |
| 35 to 44 Years | 375,581 (82.8%) | 8,263 (2.2%) |
| 45 to 54 Years | 289,129 (83.5%) | 7,228 (2.5%) |
| 55 to 59 Years | 119,052 (77.2%) | 2,500 (2.1%) |
| 60 to 64 Years | 95,385 (62.6%) | 2,098 (2.2%) |
| 65 to 74 Years | 63,576 (27.9%) | 1,526 (2.4%) |
| 75 Years and over | 10,693 (7.3%) | 278 (2.6%) |
| Total | 1,703,624 (69.4%) | 57,923 (3.4%) |
Employment Status by Educational Attainment in Utah
According to labor force statistics for Utah, 80.4% of individuals (1,274,802) out of the total population between 25 and 64 years of age (1,585,575) are in the labor force, with 2.4% or 30,595 of them being unemployed. The group with the highest labor force participation rate are those with the educational attainment of bachelor's degree or higher, with 85.2% or 494,114 individuals in the labor force. Within the labor force, individuals with less than high school education have the highest percentage of unemployment, with 4.2% or 3,160 of them being unemployed.
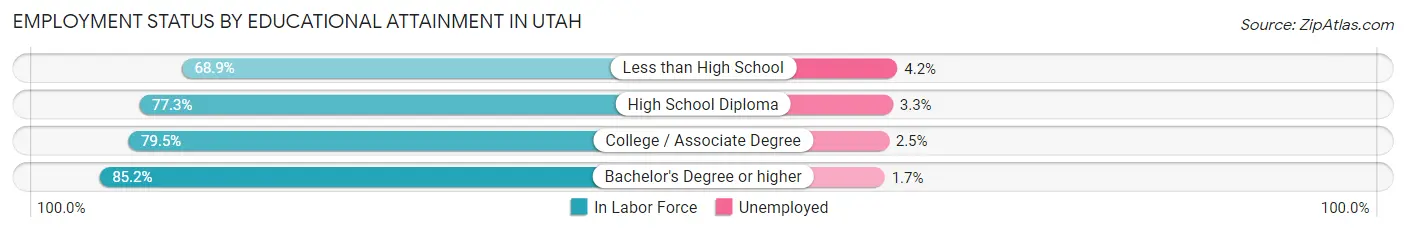
| Educational Attainment | In Labor Force | Unemployed |
| Less than High School | 75,227 (68.9%) | 4,586 (4.2%) |
| High School Diploma | 271,756 (77.3%) | 11,601 (3.3%) |
| College / Associate Degree | 433,184 (79.5%) | 13,622 (2.5%) |
| Bachelor's Degree or higher | 494,114 (85.2%) | 9,859 (1.7%) |
| Total | 1,274,802 (80.4%) | 38,054 (2.4%) |
Employment Occupations by Sex in Utah
Management, Business, Science and Arts Occupations
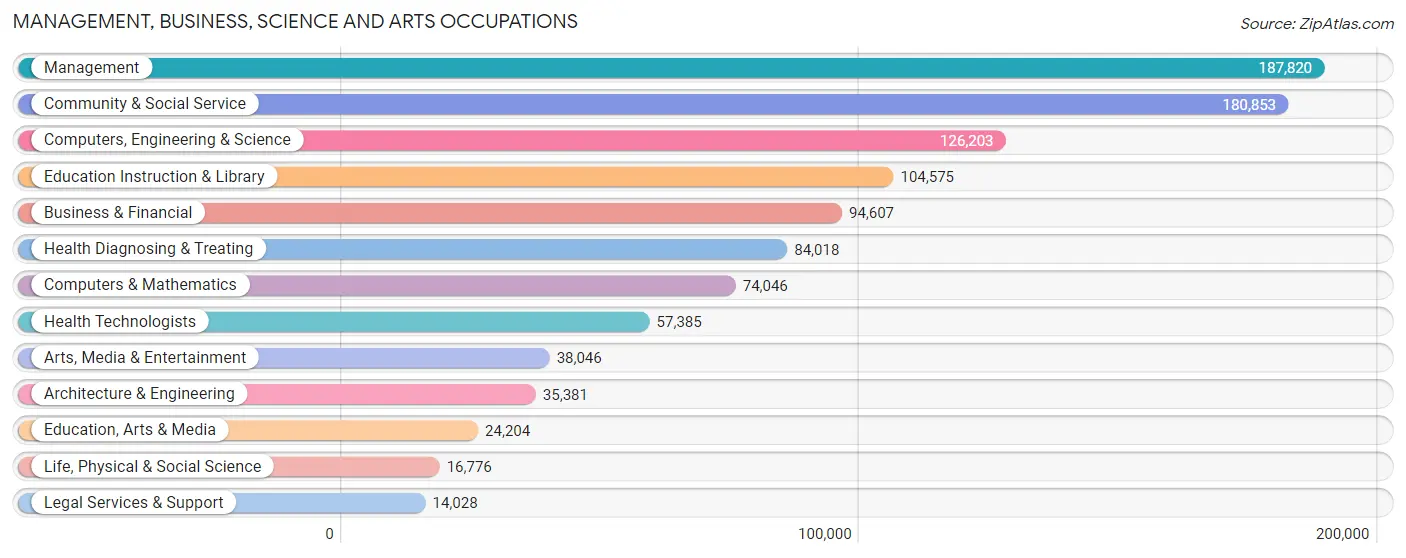
The most common Management, Business, Science and Arts occupations in Utah are Management (187,820 | 11.5%), Community & Social Service (180,853 | 11.0%), Computers, Engineering & Science (126,203 | 7.7%), Education Instruction & Library (104,575 | 6.4%), and Business & Financial (94,607 | 5.8%).
Management, Business, Science and Arts Occupations by Sex
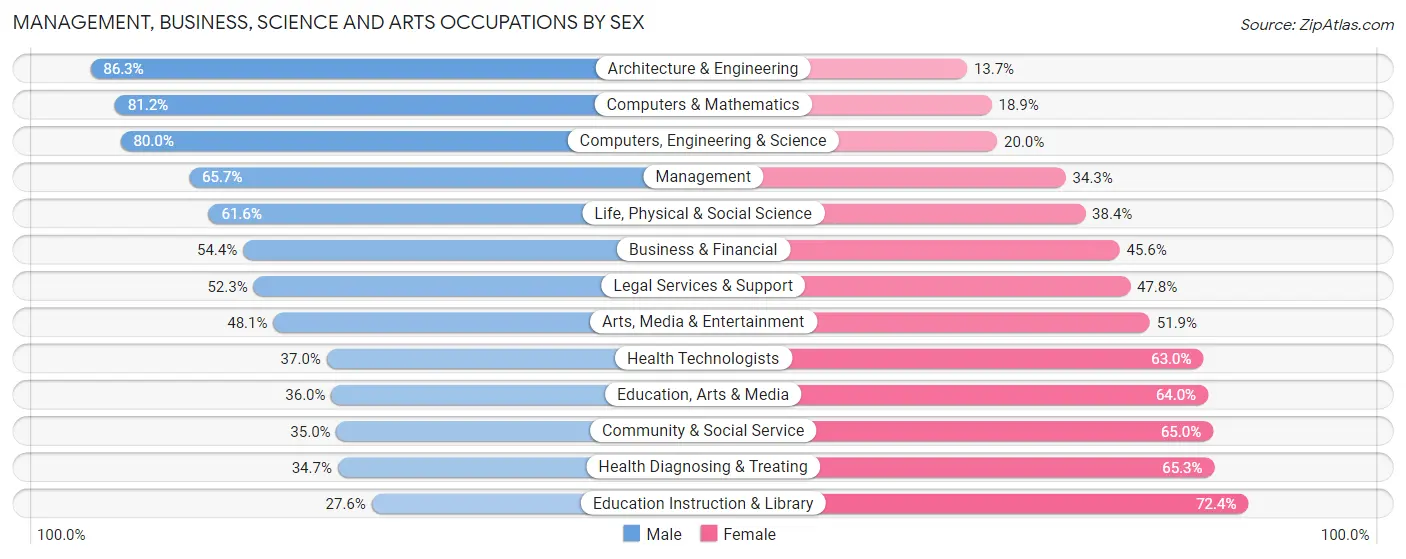
Within the Management, Business, Science and Arts occupations in Utah, the most male-oriented occupations are Architecture & Engineering (86.3%), Computers & Mathematics (81.1%), and Computers, Engineering & Science (80.0%), while the most female-oriented occupations are Education Instruction & Library (72.4%), Health Diagnosing & Treating (65.3%), and Community & Social Service (65.0%).
| Occupation | Male | Female |
| Management | 123,405 (65.7%) | 64,415 (34.3%) |
| Business & Financial | 51,493 (54.4%) | 43,114 (45.6%) |
| Computers, Engineering & Science | 100,951 (80.0%) | 25,252 (20.0%) |
| Computers & Mathematics | 60,086 (81.1%) | 13,960 (18.9%) |
| Architecture & Engineering | 30,527 (86.3%) | 4,854 (13.7%) |
| Life, Physical & Social Science | 10,338 (61.6%) | 6,438 (38.4%) |
| Community & Social Service | 63,225 (35.0%) | 117,628 (65.0%) |
| Education, Arts & Media | 8,715 (36.0%) | 15,489 (64.0%) |
| Legal Services & Support | 7,329 (52.2%) | 6,699 (47.7%) |
| Education Instruction & Library | 28,875 (27.6%) | 75,700 (72.4%) |
| Arts, Media & Entertainment | 18,306 (48.1%) | 19,740 (51.9%) |
| Health Diagnosing & Treating | 29,135 (34.7%) | 54,883 (65.3%) |
| Health Technologists | 21,227 (37.0%) | 36,158 (63.0%) |
| Total (Category) | 368,209 (54.7%) | 305,292 (45.3%) |
| Total (Overall) | 913,739 (55.7%) | 725,659 (44.3%) |
Services Occupations
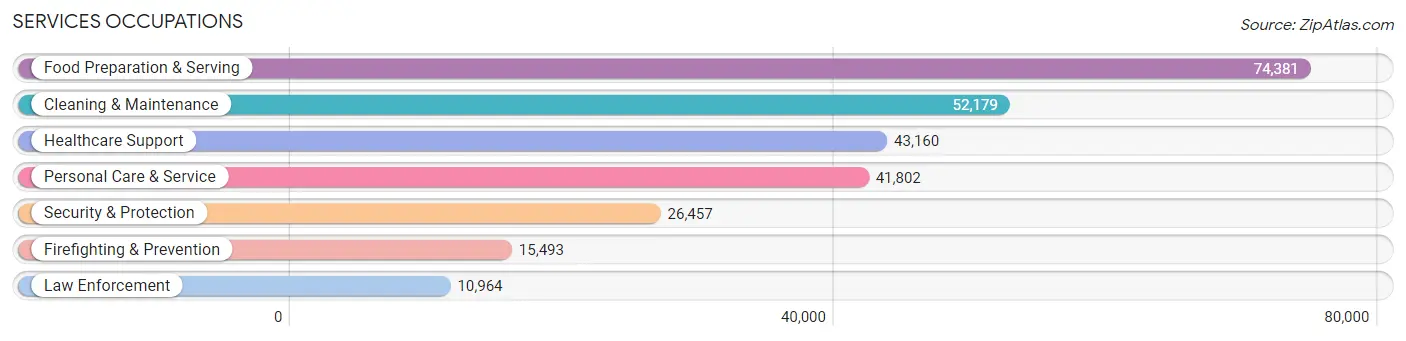
The most common Services occupations in Utah are Food Preparation & Serving (74,381 | 4.5%), Cleaning & Maintenance (52,179 | 3.2%), Healthcare Support (43,160 | 2.6%), Personal Care & Service (41,802 | 2.5%), and Security & Protection (26,457 | 1.6%).
Services Occupations by Sex
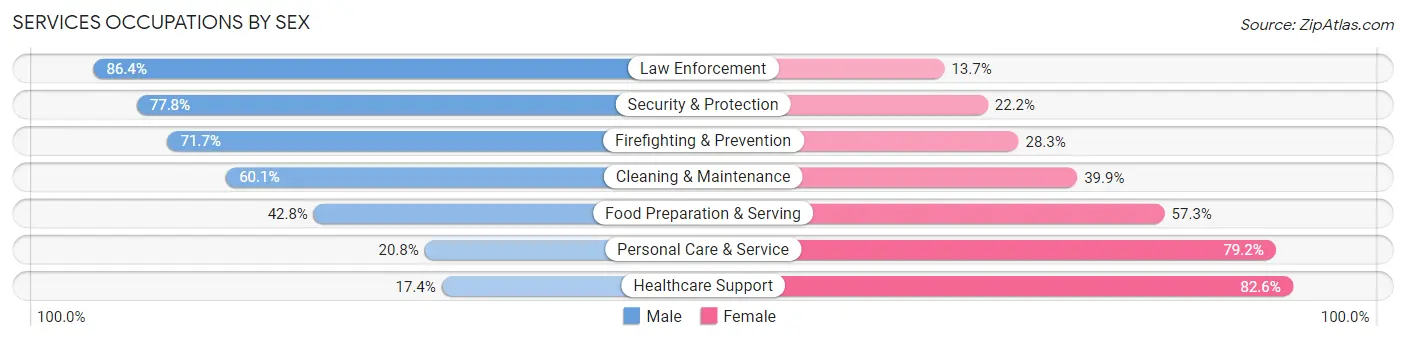
Within the Services occupations in Utah, the most male-oriented occupations are Law Enforcement (86.4%), Security & Protection (77.8%), and Firefighting & Prevention (71.7%), while the most female-oriented occupations are Healthcare Support (82.6%), Personal Care & Service (79.2%), and Food Preparation & Serving (57.3%).
| Occupation | Male | Female |
| Healthcare Support | 7,521 (17.4%) | 35,639 (82.6%) |
| Security & Protection | 20,573 (77.8%) | 5,884 (22.2%) |
| Firefighting & Prevention | 11,106 (71.7%) | 4,387 (28.3%) |
| Law Enforcement | 9,467 (86.4%) | 1,497 (13.7%) |
| Food Preparation & Serving | 31,796 (42.7%) | 42,585 (57.3%) |
| Cleaning & Maintenance | 31,339 (60.1%) | 20,840 (39.9%) |
| Personal Care & Service | 8,698 (20.8%) | 33,104 (79.2%) |
| Total (Category) | 99,927 (42.0%) | 138,052 (58.0%) |
| Total (Overall) | 913,739 (55.7%) | 725,659 (44.3%) |
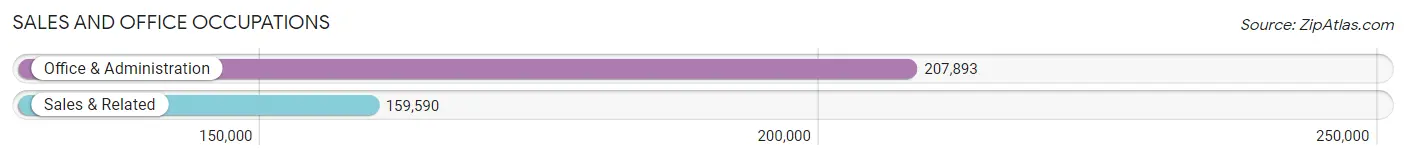
Sales and Office Occupations
The most common Sales and Office occupations in Utah are Office & Administration (207,893 | 12.7%), and Sales & Related (159,590 | 9.7%).
Sales and Office Occupations by Sex
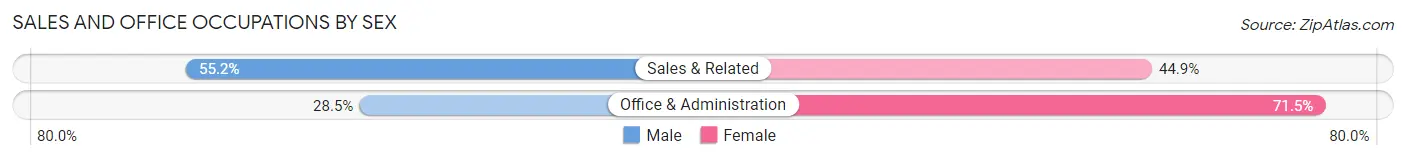
| Occupation | Male | Female |
| Sales & Related | 88,019 (55.1%) | 71,571 (44.9%) |
| Office & Administration | 59,302 (28.5%) | 148,591 (71.5%) |
| Total (Category) | 147,321 (40.1%) | 220,162 (59.9%) |
| Total (Overall) | 913,739 (55.7%) | 725,659 (44.3%) |
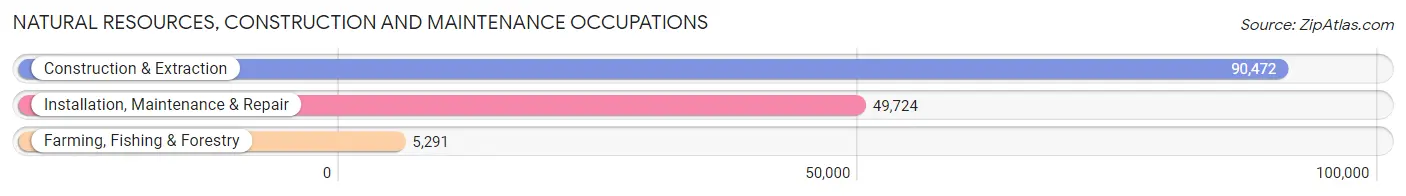
Natural Resources, Construction and Maintenance Occupations
The most common Natural Resources, Construction and Maintenance occupations in Utah are Construction & Extraction (90,472 | 5.5%), Installation, Maintenance & Repair (49,724 | 3.0%), and Farming, Fishing & Forestry (5,291 | 0.3%).
Natural Resources, Construction and Maintenance Occupations by Sex
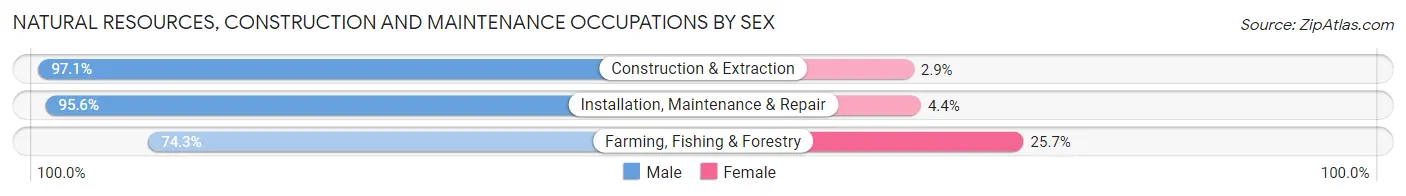
| Occupation | Male | Female |
| Farming, Fishing & Forestry | 3,929 (74.3%) | 1,362 (25.7%) |
| Construction & Extraction | 87,846 (97.1%) | 2,626 (2.9%) |
| Installation, Maintenance & Repair | 47,548 (95.6%) | 2,176 (4.4%) |
| Total (Category) | 139,323 (95.8%) | 6,164 (4.2%) |
| Total (Overall) | 913,739 (55.7%) | 725,659 (44.3%) |
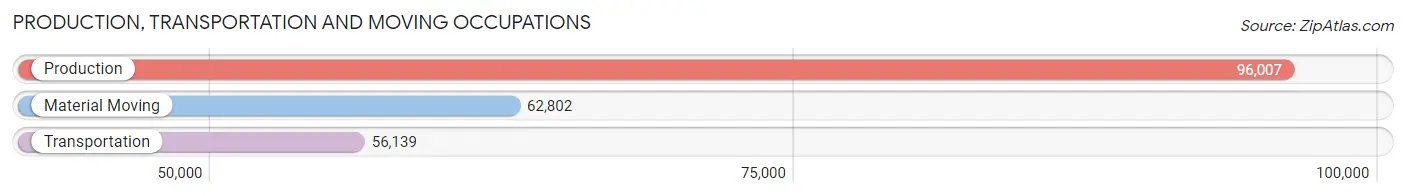
Production, Transportation and Moving Occupations
The most common Production, Transportation and Moving occupations in Utah are Production (96,007 | 5.9%), Material Moving (62,802 | 3.8%), and Transportation (56,139 | 3.4%).
Production, Transportation and Moving Occupations by Sex
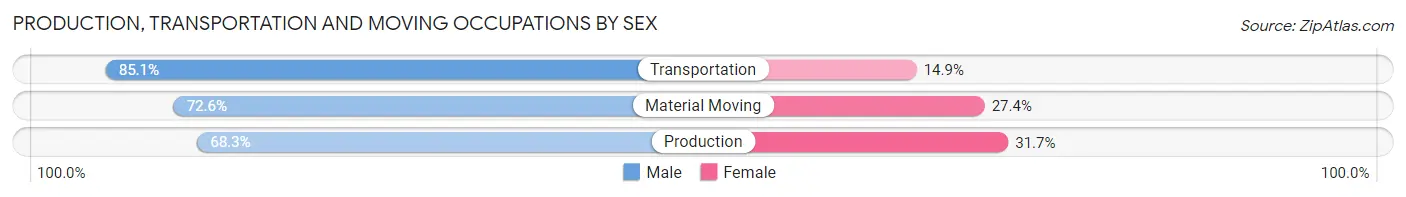
| Occupation | Male | Female |
| Production | 65,576 (68.3%) | 30,431 (31.7%) |
| Transportation | 47,773 (85.1%) | 8,366 (14.9%) |
| Material Moving | 45,610 (72.6%) | 17,192 (27.4%) |
| Total (Category) | 158,959 (74.0%) | 55,989 (26.1%) |
| Total (Overall) | 913,739 (55.7%) | 725,659 (44.3%) |
Employment Industries by Sex in Utah
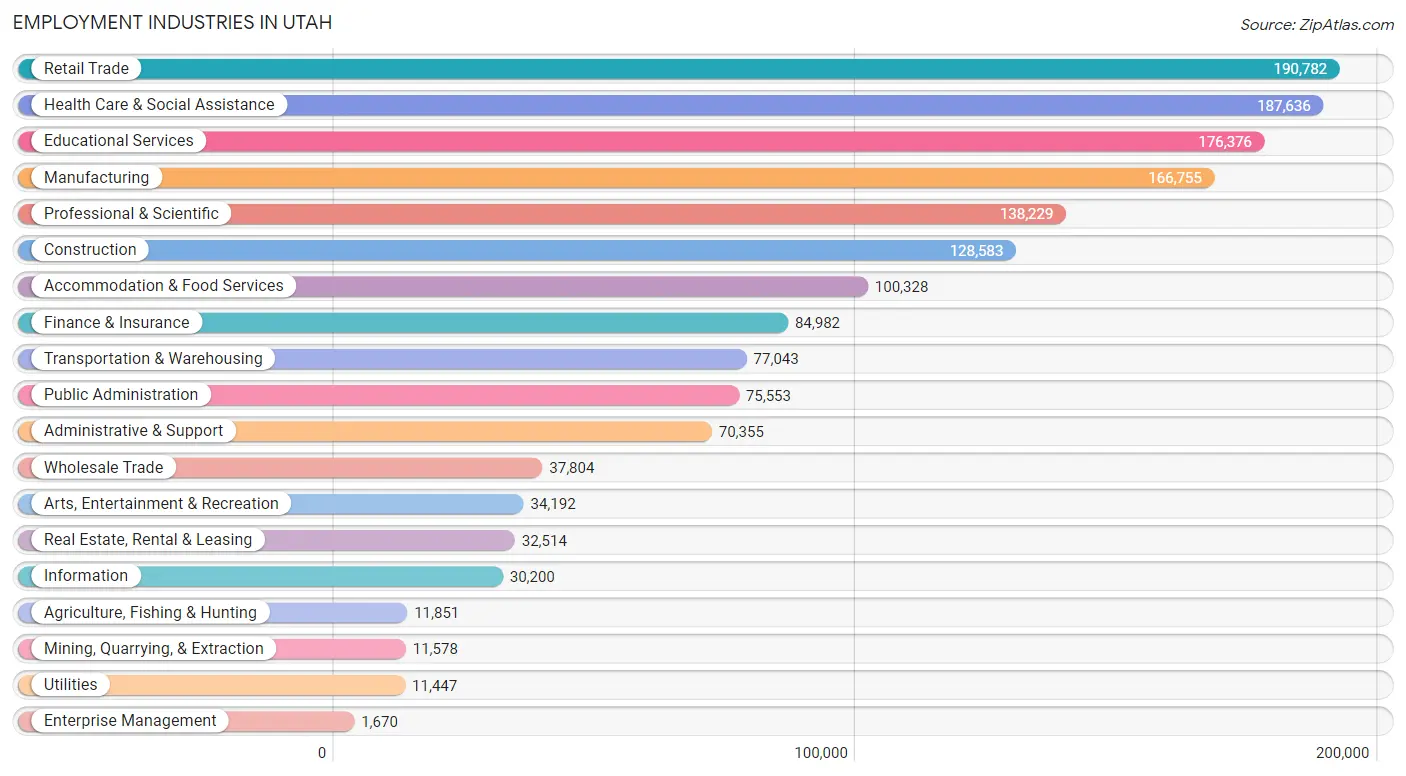
Employment Industries in Utah
The major employment industries in Utah include Retail Trade (190,782 | 11.6%), Health Care & Social Assistance (187,636 | 11.5%), Educational Services (176,376 | 10.8%), Manufacturing (166,755 | 10.2%), and Professional & Scientific (138,229 | 8.4%).
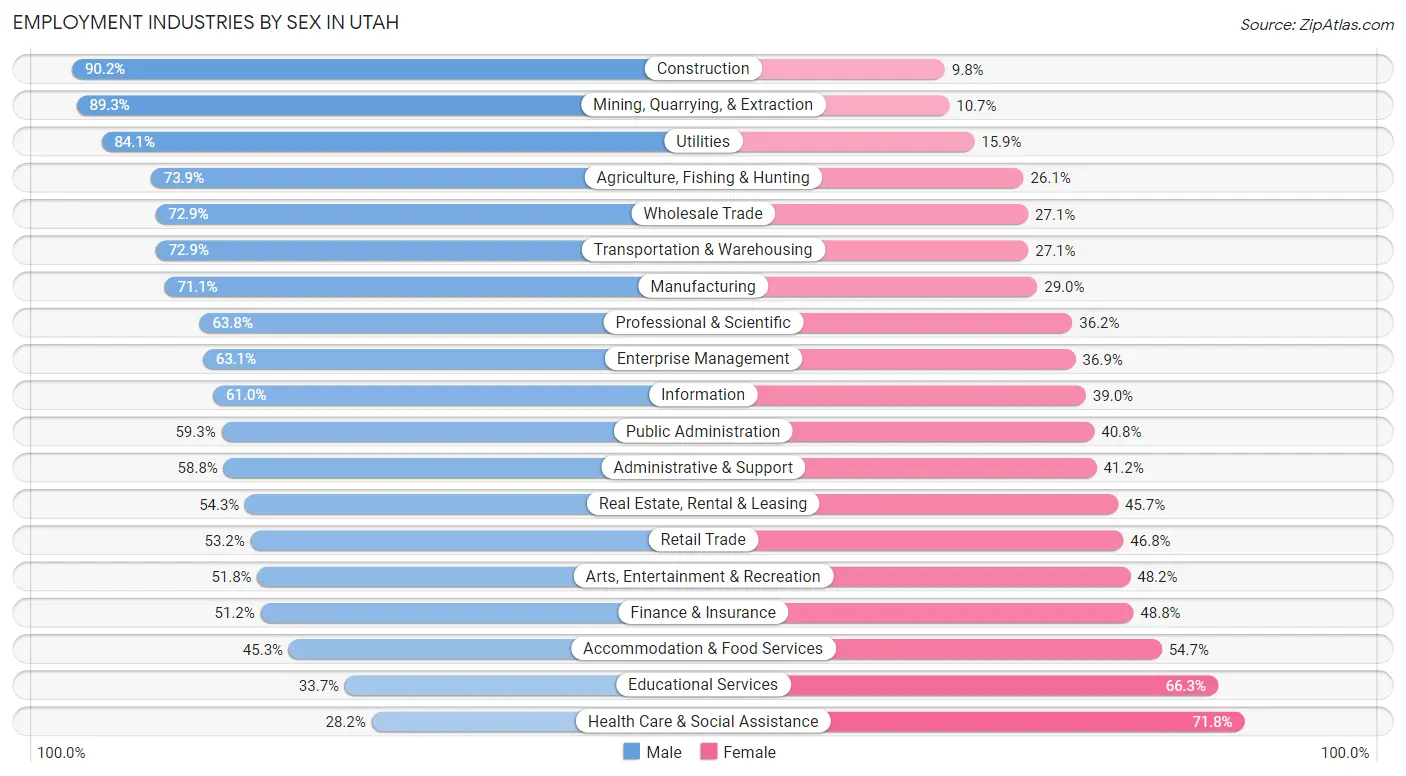
Employment Industries by Sex in Utah
The Utah industries that see more men than women are Construction (90.2%), Mining, Quarrying, & Extraction (89.3%), and Utilities (84.1%), whereas the industries that tend to have a higher number of women are Health Care & Social Assistance (71.8%), Educational Services (66.3%), and Accommodation & Food Services (54.7%).
| Industry | Male | Female |
| Agriculture, Fishing & Hunting | 8,754 (73.9%) | 3,097 (26.1%) |
| Mining, Quarrying, & Extraction | 10,335 (89.3%) | 1,243 (10.7%) |
| Construction | 115,972 (90.2%) | 12,611 (9.8%) |
| Manufacturing | 118,479 (71.1%) | 48,276 (28.9%) |
| Wholesale Trade | 27,573 (72.9%) | 10,231 (27.1%) |
| Retail Trade | 101,540 (53.2%) | 89,242 (46.8%) |
| Transportation & Warehousing | 56,163 (72.9%) | 20,880 (27.1%) |
| Utilities | 9,625 (84.1%) | 1,822 (15.9%) |
| Information | 18,415 (61.0%) | 11,785 (39.0%) |
| Finance & Insurance | 43,480 (51.2%) | 41,502 (48.8%) |
| Real Estate, Rental & Leasing | 17,667 (54.3%) | 14,847 (45.7%) |
| Professional & Scientific | 88,180 (63.8%) | 50,049 (36.2%) |
| Enterprise Management | 1,054 (63.1%) | 616 (36.9%) |
| Administrative & Support | 41,366 (58.8%) | 28,989 (41.2%) |
| Educational Services | 59,436 (33.7%) | 116,940 (66.3%) |
| Health Care & Social Assistance | 52,868 (28.2%) | 134,768 (71.8%) |
| Arts, Entertainment & Recreation | 17,711 (51.8%) | 16,481 (48.2%) |
| Accommodation & Food Services | 45,437 (45.3%) | 54,891 (54.7%) |
| Public Administration | 44,766 (59.3%) | 30,787 (40.7%) |
| Total | 913,739 (55.7%) | 725,659 (44.3%) |
Education in Utah
School Enrollment in Utah
The most common levels of schooling among the 1,019,162 students in Utah are college / undergraduate (230,703 | 22.6%), high school (221,946 | 21.8%), and middle school (212,310 | 20.8%).
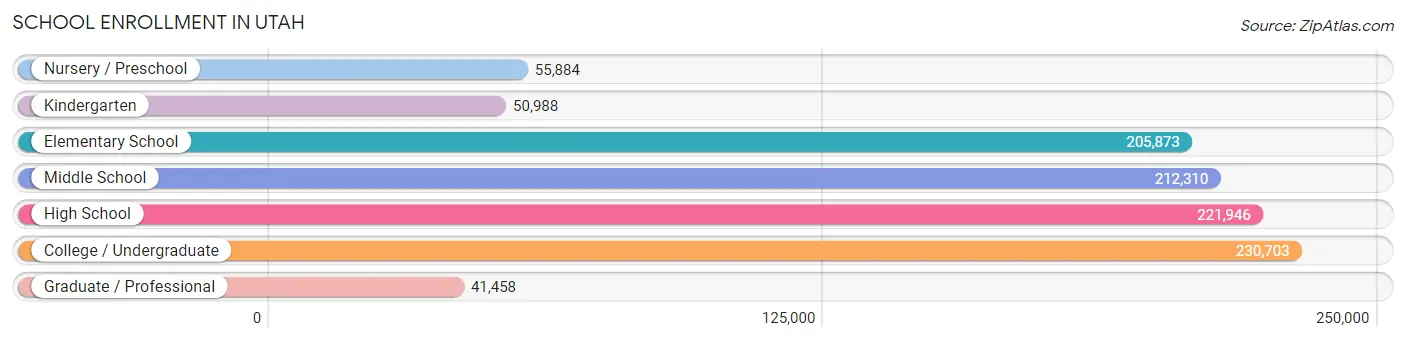
| School Level | # Students | % Students |
| Nursery / Preschool | 55,884 | 5.5% |
| Kindergarten | 50,988 | 5.0% |
| Elementary School | 205,873 | 20.2% |
| Middle School | 212,310 | 20.8% |
| High School | 221,946 | 21.8% |
| College / Undergraduate | 230,703 | 22.6% |
| Graduate / Professional | 41,458 | 4.1% |
| Total | 1,019,162 | 100.0% |
School Enrollment by Age by Funding Source in Utah
Out of a total of 1,019,162 students who are enrolled in schools in Utah, 148,798 (14.6%) attend a private institution, while the remaining 870,364 (85.4%) are enrolled in public schools. The age group of 3 to 4 year olds has the highest likelihood of being enrolled in private schools, with 17,524 (42.9% in the age bracket) enrolled. Conversely, the age group of 15 to 17 year olds has the lowest likelihood of being enrolled in a private school, with 149,457 (94.6% in the age bracket) attending a public institution.
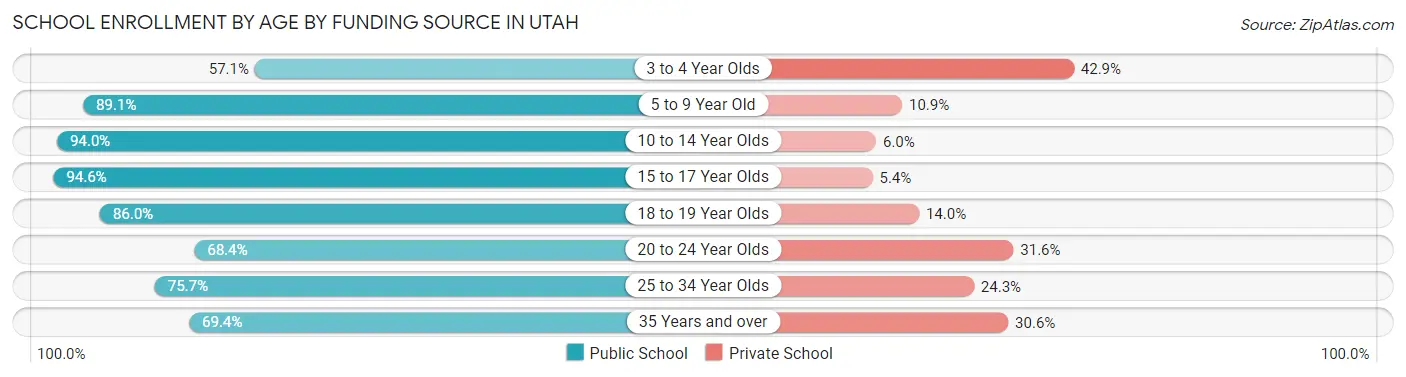
| Age Bracket | Public School | Private School |
| 3 to 4 Year Olds | 23,349 (57.1%) | 17,524 (42.9%) |
| 5 to 9 Year Old | 219,562 (89.1%) | 26,810 (10.9%) |
| 10 to 14 Year Olds | 249,660 (94.0%) | 16,018 (6.0%) |
| 15 to 17 Year Olds | 149,457 (94.6%) | 8,480 (5.4%) |
| 18 to 19 Year Olds | 60,130 (86.0%) | 9,814 (14.0%) |
| 20 to 24 Year Olds | 84,408 (68.4%) | 39,019 (31.6%) |
| 25 to 34 Year Olds | 51,433 (75.7%) | 16,476 (24.3%) |
| 35 Years and over | 32,614 (69.4%) | 14,408 (30.6%) |
| Total | 870,364 (85.4%) | 148,798 (14.6%) |
Educational Attainment by Field of Study in Utah
Business (142,274 | 18.6%), education (93,861 | 12.2%), science & technology (79,457 | 10.4%), arts & humanities (60,422 | 7.9%), and social sciences (56,950 | 7.4%) are the most common fields of study among 766,459 individuals in Utah who have obtained a bachelor's degree or higher.
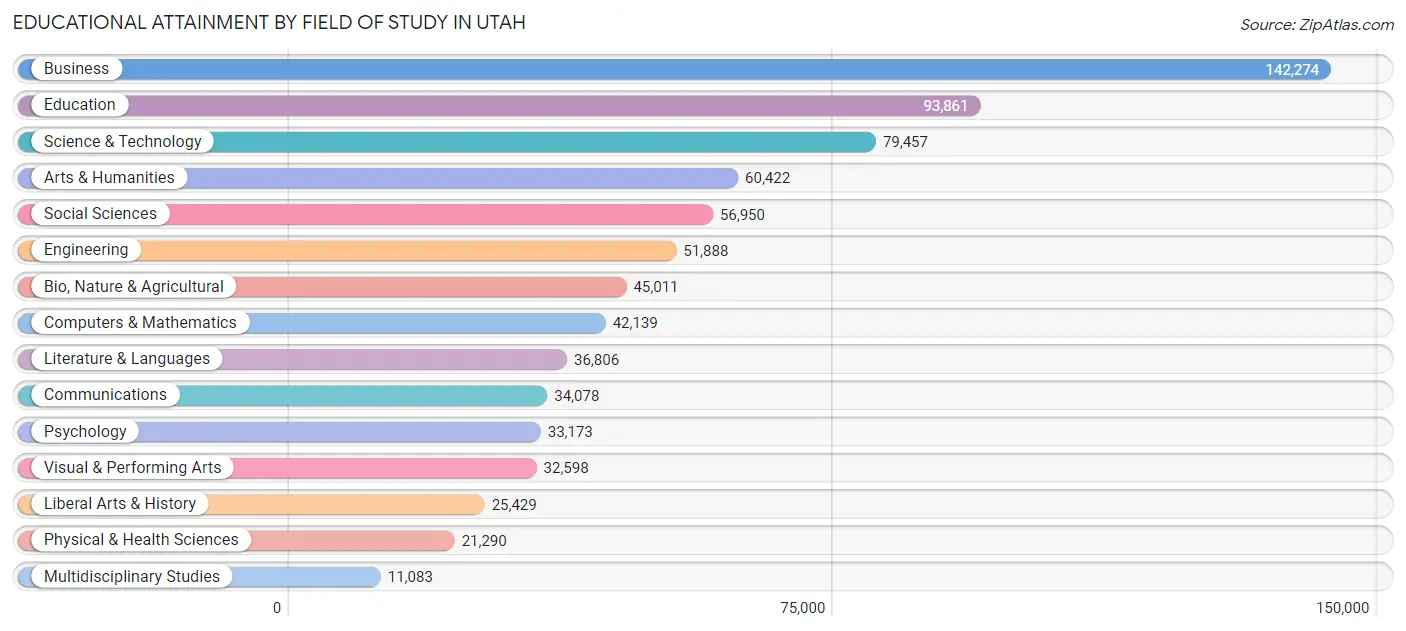
| Field of Study | # Graduates | % Graduates |
| Computers & Mathematics | 42,139 | 5.5% |
| Bio, Nature & Agricultural | 45,011 | 5.9% |
| Physical & Health Sciences | 21,290 | 2.8% |
| Psychology | 33,173 | 4.3% |
| Social Sciences | 56,950 | 7.4% |
| Engineering | 51,888 | 6.8% |
| Multidisciplinary Studies | 11,083 | 1.5% |
| Science & Technology | 79,457 | 10.4% |
| Business | 142,274 | 18.6% |
| Education | 93,861 | 12.2% |
| Literature & Languages | 36,806 | 4.8% |
| Liberal Arts & History | 25,429 | 3.3% |
| Visual & Performing Arts | 32,598 | 4.3% |
| Communications | 34,078 | 4.4% |
| Arts & Humanities | 60,422 | 7.9% |
| Total | 766,459 | 100.0% |
Transportation & Commute in Utah
Vehicle Availability by Sex in Utah
The most prevalent vehicle ownership categories in Utah are males with 2 vehicles (338,705, accounting for 37.8%) and females with 2 vehicles (255,476, making up 48.2%).
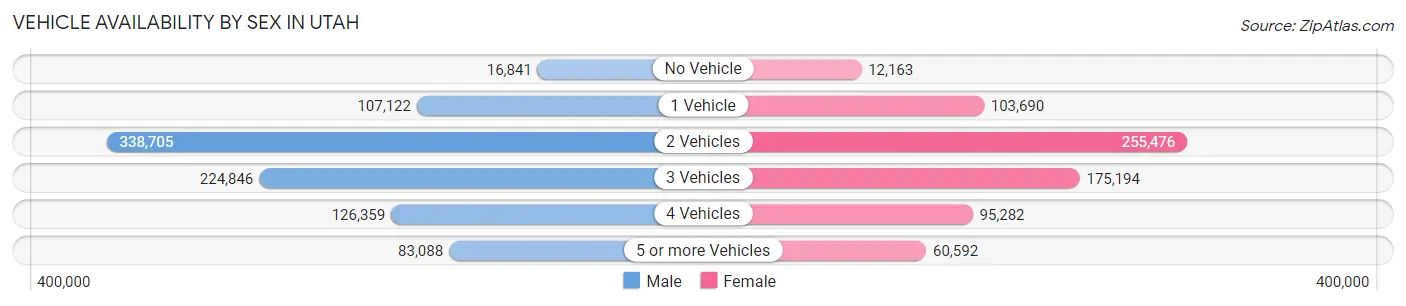
| Vehicles Available | Male | Female |
| No Vehicle | 16,841 (1.9%) | 12,163 (1.7%) |
| 1 Vehicle | 107,122 (11.9%) | 103,690 (14.8%) |
| 2 Vehicles | 338,705 (37.8%) | 255,476 (36.4%) |
| 3 Vehicles | 224,846 (25.1%) | 175,194 (24.9%) |
| 4 Vehicles | 126,359 (14.1%) | 95,282 (13.6%) |
| 5 or more Vehicles | 83,088 (9.3%) | 60,592 (8.6%) |
| Total | 896,961 (100.0%) | 702,397 (100.0%) |
Commute Time in Utah
The most frequently occuring commute durations in Utah are 15 to 19 minutes (247,951 commuters, 17.8%), 10 to 14 minutes (230,354 commuters, 16.6%), and 20 to 24 minutes (217,075 commuters, 15.6%).
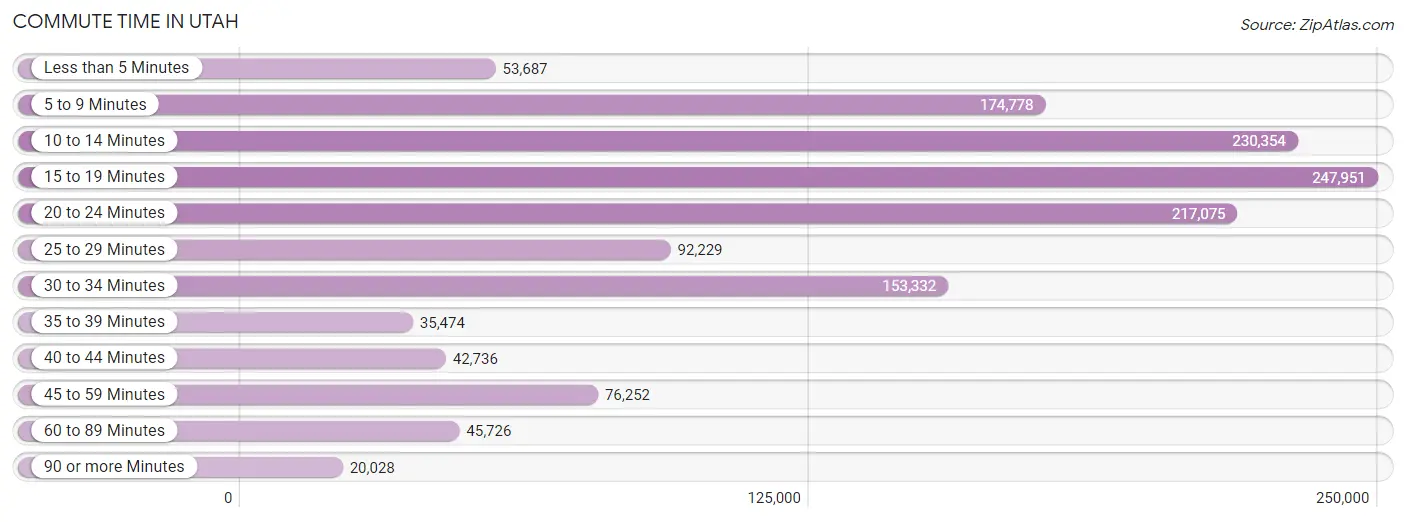
| Commute Time | # Commuters | % Commuters |
| Less than 5 Minutes | 53,687 | 3.9% |
| 5 to 9 Minutes | 174,778 | 12.6% |
| 10 to 14 Minutes | 230,354 | 16.6% |
| 15 to 19 Minutes | 247,951 | 17.8% |
| 20 to 24 Minutes | 217,075 | 15.6% |
| 25 to 29 Minutes | 92,229 | 6.6% |
| 30 to 34 Minutes | 153,332 | 11.0% |
| 35 to 39 Minutes | 35,474 | 2.5% |
| 40 to 44 Minutes | 42,736 | 3.1% |
| 45 to 59 Minutes | 76,252 | 5.5% |
| 60 to 89 Minutes | 45,726 | 3.3% |
| 90 or more Minutes | 20,028 | 1.4% |
Commute Time by Sex in Utah
The most common commute times in Utah are 15 to 19 minutes (138,329 commuters, 17.5%) for males and 15 to 19 minutes (109,622 commuters, 18.3%) for females.
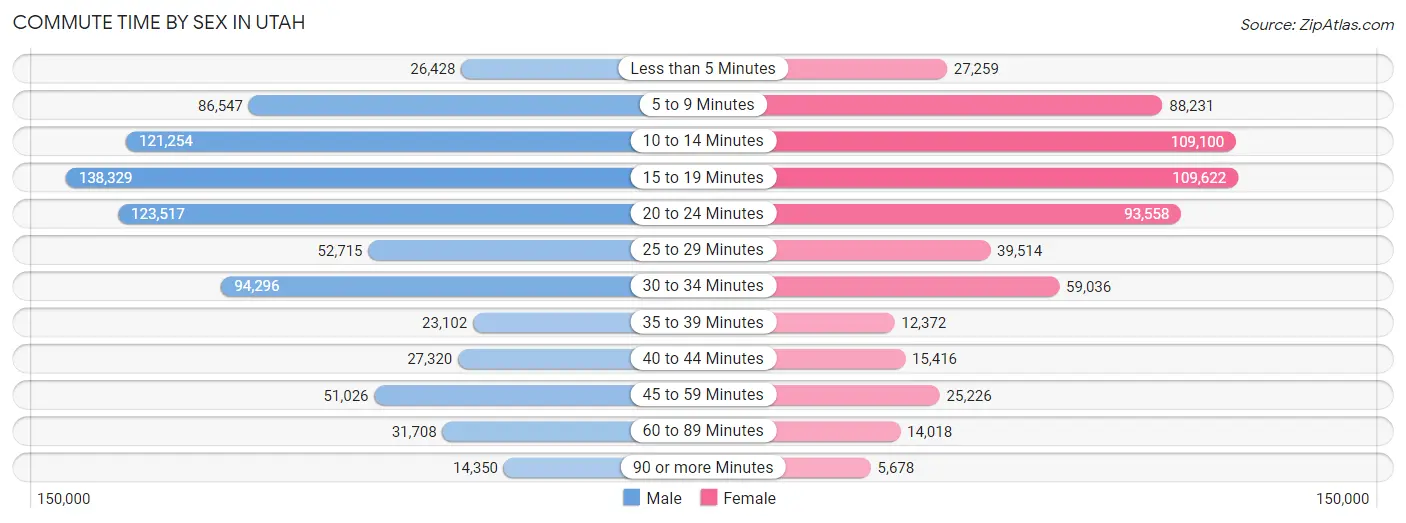
| Commute Time | Male | Female |
| Less than 5 Minutes | 26,428 (3.3%) | 27,259 (4.5%) |
| 5 to 9 Minutes | 86,547 (11.0%) | 88,231 (14.7%) |
| 10 to 14 Minutes | 121,254 (15.3%) | 109,100 (18.2%) |
| 15 to 19 Minutes | 138,329 (17.5%) | 109,622 (18.3%) |
| 20 to 24 Minutes | 123,517 (15.6%) | 93,558 (15.6%) |
| 25 to 29 Minutes | 52,715 (6.7%) | 39,514 (6.6%) |
| 30 to 34 Minutes | 94,296 (11.9%) | 59,036 (9.9%) |
| 35 to 39 Minutes | 23,102 (2.9%) | 12,372 (2.1%) |
| 40 to 44 Minutes | 27,320 (3.5%) | 15,416 (2.6%) |
| 45 to 59 Minutes | 51,026 (6.5%) | 25,226 (4.2%) |
| 60 to 89 Minutes | 31,708 (4.0%) | 14,018 (2.3%) |
| 90 or more Minutes | 14,350 (1.8%) | 5,678 (0.9%) |
Time of Departure to Work by Sex in Utah
The most frequent times of departure to work in Utah are 7:00 AM to 7:29 AM (100,236, 12.7%) for males and 7:30 AM to 7:59 AM (80,255, 13.4%) for females.
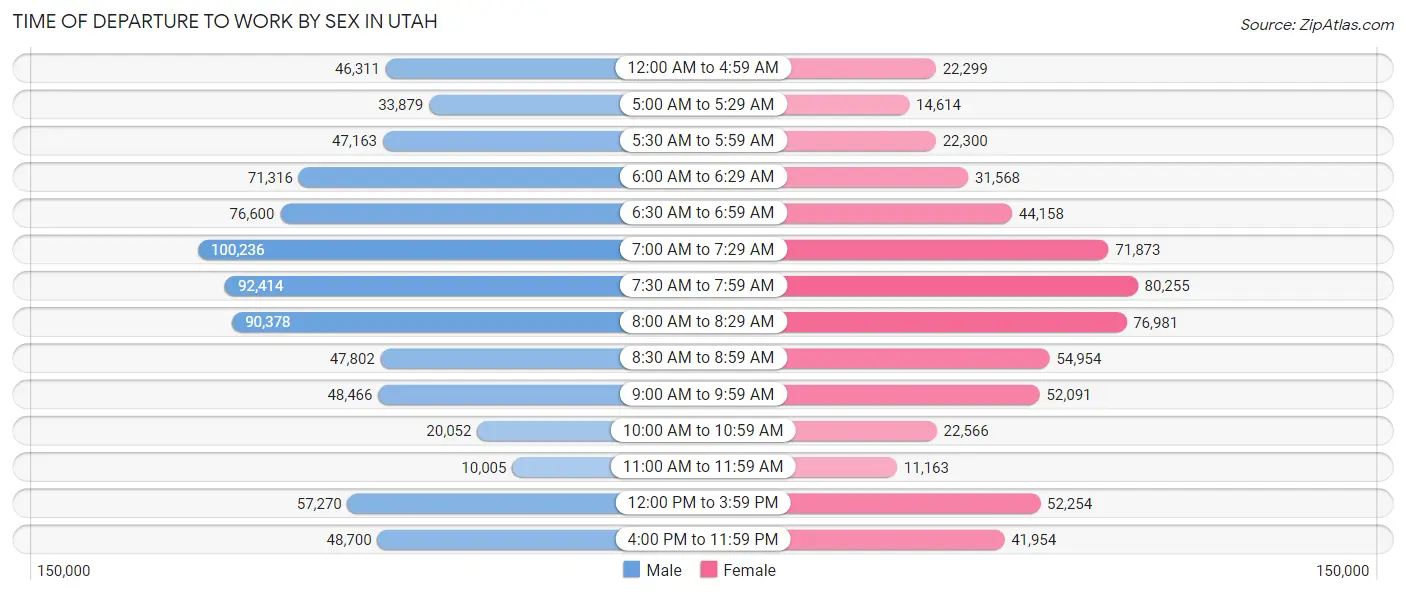
| Time of Departure | Male | Female |
| 12:00 AM to 4:59 AM | 46,311 (5.9%) | 22,299 (3.7%) |
| 5:00 AM to 5:29 AM | 33,879 (4.3%) | 14,614 (2.4%) |
| 5:30 AM to 5:59 AM | 47,163 (6.0%) | 22,300 (3.7%) |
| 6:00 AM to 6:29 AM | 71,316 (9.0%) | 31,568 (5.3%) |
| 6:30 AM to 6:59 AM | 76,600 (9.7%) | 44,158 (7.4%) |
| 7:00 AM to 7:29 AM | 100,236 (12.7%) | 71,873 (12.0%) |
| 7:30 AM to 7:59 AM | 92,414 (11.7%) | 80,255 (13.4%) |
| 8:00 AM to 8:29 AM | 90,378 (11.4%) | 76,981 (12.9%) |
| 8:30 AM to 8:59 AM | 47,802 (6.0%) | 54,954 (9.2%) |
| 9:00 AM to 9:59 AM | 48,466 (6.1%) | 52,091 (8.7%) |
| 10:00 AM to 10:59 AM | 20,052 (2.5%) | 22,566 (3.8%) |
| 11:00 AM to 11:59 AM | 10,005 (1.3%) | 11,163 (1.9%) |
| 12:00 PM to 3:59 PM | 57,270 (7.2%) | 52,254 (8.7%) |
| 4:00 PM to 11:59 PM | 48,700 (6.2%) | 41,954 (7.0%) |
| Total | 790,592 (100.0%) | 599,030 (100.0%) |
Housing Occupancy in Utah
Occupancy by Ownership in Utah
Of the total 1,062,819 dwellings in Utah, owner-occupied units account for 751,652 (70.7%), while renter-occupied units make up 311,167 (29.3%).
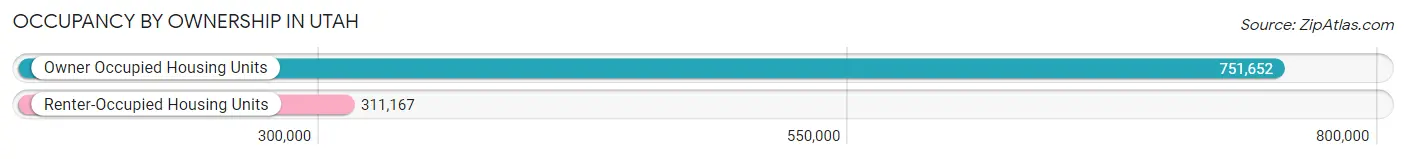
| Occupancy | # Housing Units | % Housing Units |
| Owner Occupied Housing Units | 751,652 | 70.7% |
| Renter-Occupied Housing Units | 311,167 | 29.3% |
| Total Occupied Housing Units | 1,062,819 | 100.0% |
Occupancy by Household Size in Utah
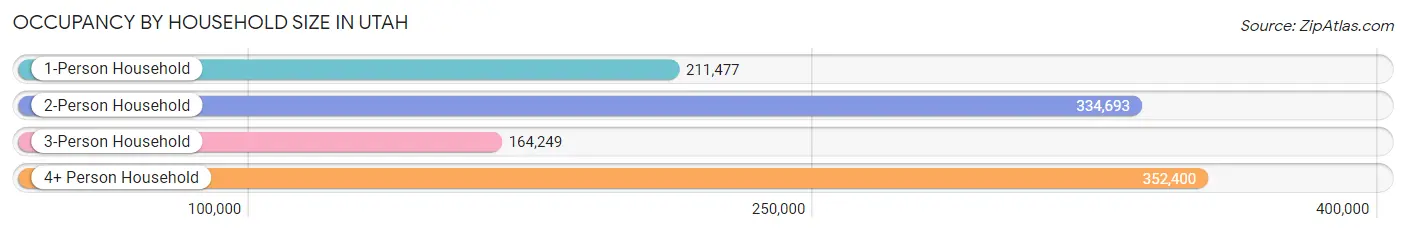
| Household Size | # Housing Units | % Housing Units |
| 1-Person Household | 211,477 | 19.9% |
| 2-Person Household | 334,693 | 31.5% |
| 3-Person Household | 164,249 | 15.4% |
| 4+ Person Household | 352,400 | 33.2% |
| Total Housing Units | 1,062,819 | 100.0% |
Occupancy by Ownership by Household Size in Utah
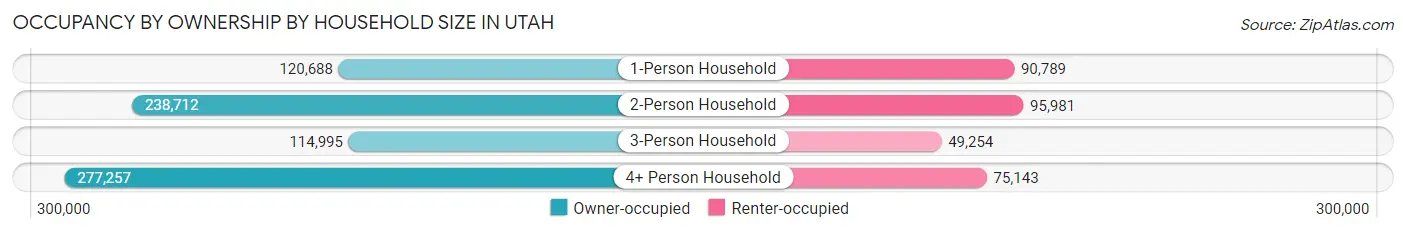
| Household Size | Owner-occupied | Renter-occupied |
| 1-Person Household | 120,688 (57.1%) | 90,789 (42.9%) |
| 2-Person Household | 238,712 (71.3%) | 95,981 (28.7%) |
| 3-Person Household | 114,995 (70.0%) | 49,254 (30.0%) |
| 4+ Person Household | 277,257 (78.7%) | 75,143 (21.3%) |
| Total Housing Units | 751,652 (70.7%) | 311,167 (29.3%) |
Occupancy by Educational Attainment in Utah
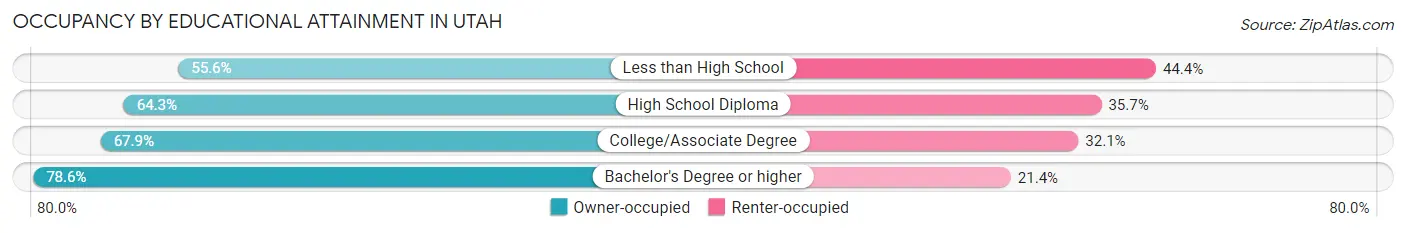
| Household Size | Owner-occupied | Renter-occupied |
| Less than High School | 31,147 (55.6%) | 24,863 (44.4%) |
| High School Diploma | 132,824 (64.3%) | 73,878 (35.7%) |
| College/Associate Degree | 262,738 (67.9%) | 124,111 (32.1%) |
| Bachelor's Degree or higher | 324,943 (78.6%) | 88,315 (21.4%) |
Occupancy by Age of Householder in Utah
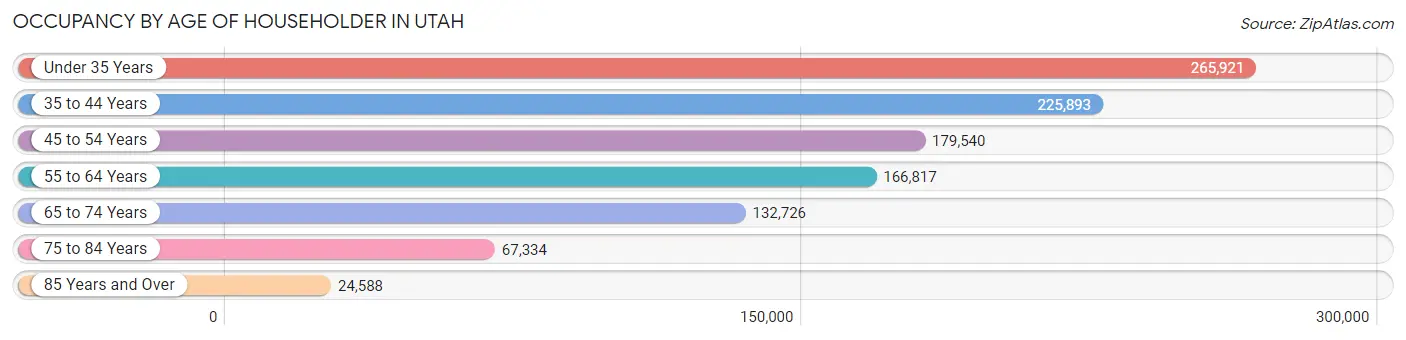
| Age Bracket | # Households | % Households |
| Under 35 Years | 265,921 | 25.0% |
| 35 to 44 Years | 225,893 | 21.2% |
| 45 to 54 Years | 179,540 | 16.9% |
| 55 to 64 Years | 166,817 | 15.7% |
| 65 to 74 Years | 132,726 | 12.5% |
| 75 to 84 Years | 67,334 | 6.3% |
| 85 Years and Over | 24,588 | 2.3% |
| Total | 1,062,819 | 100.0% |
Housing Finances in Utah
Median Income by Occupancy in Utah
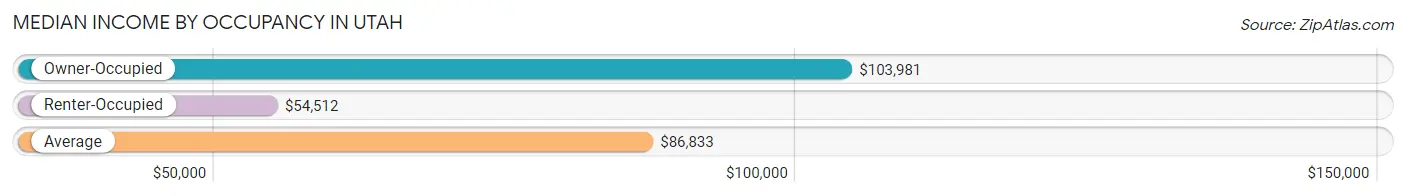
| Occupancy Type | # Households | Median Income |
| Owner-Occupied | 751,652 (70.7%) | $103,981 |
| Renter-Occupied | 311,167 (29.3%) | $54,512 |
| Average | 1,062,819 (100.0%) | $86,833 |
Occupancy by Householder Income Bracket in Utah
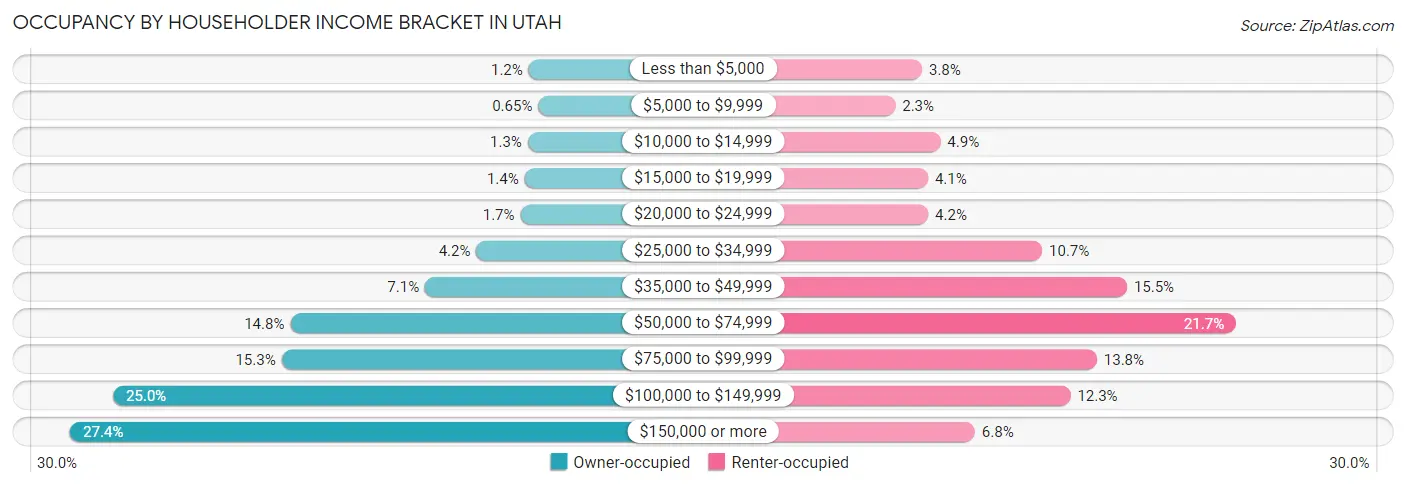
| Income Bracket | Owner-occupied | Renter-occupied |
| Less than $5,000 | 9,019 (1.2%) | 11,837 (3.8%) |
| $5,000 to $9,999 | 4,903 (0.6%) | 7,065 (2.3%) |
| $10,000 to $14,999 | 9,432 (1.3%) | 15,079 (4.9%) |
| $15,000 to $19,999 | 10,776 (1.4%) | 12,876 (4.1%) |
| $20,000 to $24,999 | 12,519 (1.7%) | 12,923 (4.2%) |
| $25,000 to $34,999 | 31,476 (4.2%) | 33,166 (10.7%) |
| $35,000 to $49,999 | 53,487 (7.1%) | 48,253 (15.5%) |
| $50,000 to $74,999 | 111,358 (14.8%) | 67,635 (21.7%) |
| $75,000 to $99,999 | 115,186 (15.3%) | 42,907 (13.8%) |
| $100,000 to $149,999 | 187,561 (24.9%) | 38,202 (12.3%) |
| $150,000 or more | 205,935 (27.4%) | 21,224 (6.8%) |
| Total | 751,652 (100.0%) | 311,167 (100.0%) |
Monthly Housing Cost Tiers in Utah
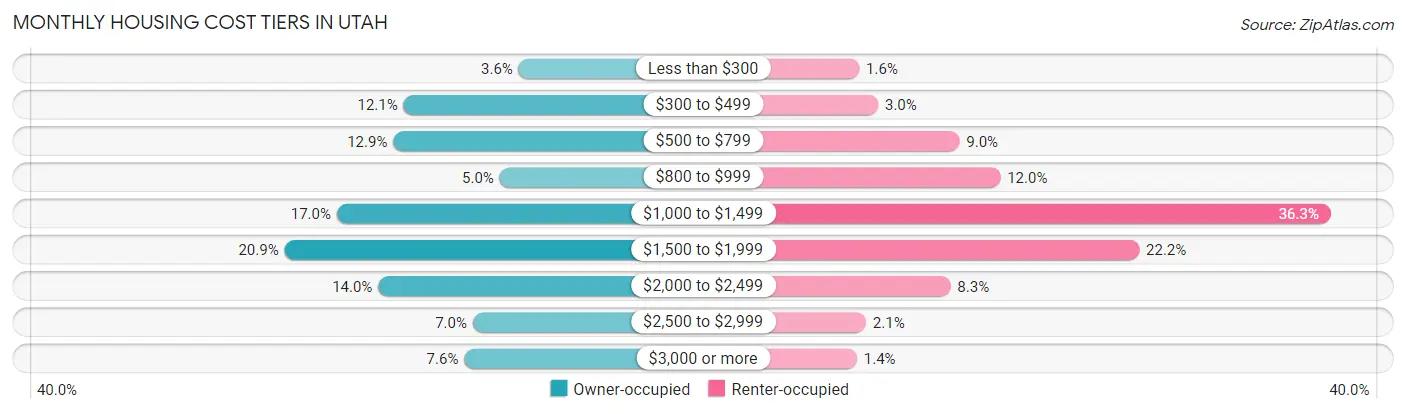
| Monthly Cost | Owner-occupied | Renter-occupied |
| Less than $300 | 27,118 (3.6%) | 4,986 (1.6%) |
| $300 to $499 | 90,877 (12.1%) | 9,295 (3.0%) |
| $500 to $799 | 96,583 (12.9%) | 27,943 (9.0%) |
| $800 to $999 | 37,658 (5.0%) | 37,316 (12.0%) |
| $1,000 to $1,499 | 127,880 (17.0%) | 113,052 (36.3%) |
| $1,500 to $1,999 | 156,824 (20.9%) | 69,154 (22.2%) |
| $2,000 to $2,499 | 104,898 (14.0%) | 25,885 (8.3%) |
| $2,500 to $2,999 | 52,564 (7.0%) | 6,528 (2.1%) |
| $3,000 or more | 57,250 (7.6%) | 4,435 (1.4%) |
| Total | 751,652 (100.0%) | 311,167 (100.0%) |
Physical Housing Characteristics in Utah
Housing Structures in Utah
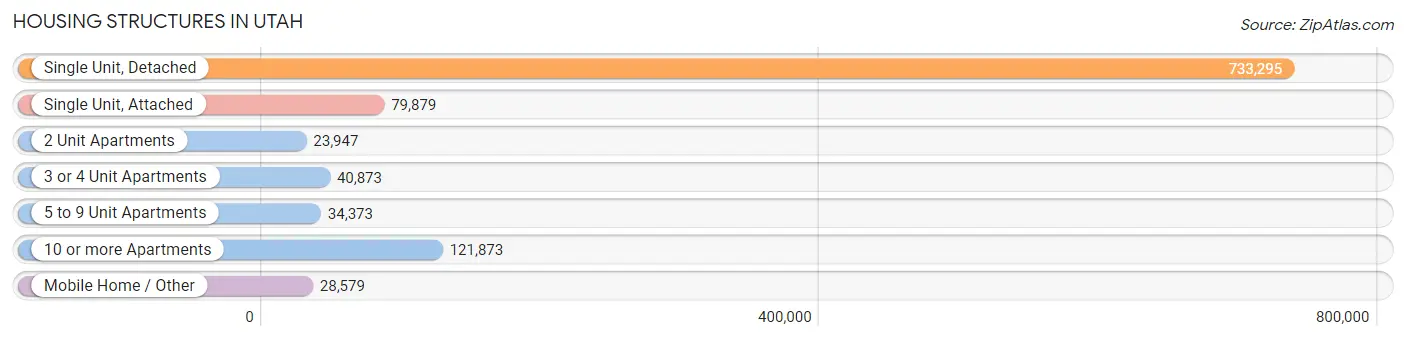
| Structure Type | # Housing Units | % Housing Units |
| Single Unit, Detached | 733,295 | 69.0% |
| Single Unit, Attached | 79,879 | 7.5% |
| 2 Unit Apartments | 23,947 | 2.2% |
| 3 or 4 Unit Apartments | 40,873 | 3.8% |
| 5 to 9 Unit Apartments | 34,373 | 3.2% |
| 10 or more Apartments | 121,873 | 11.5% |
| Mobile Home / Other | 28,579 | 2.7% |
| Total | 1,062,819 | 100.0% |
Housing Structures by Occupancy in Utah
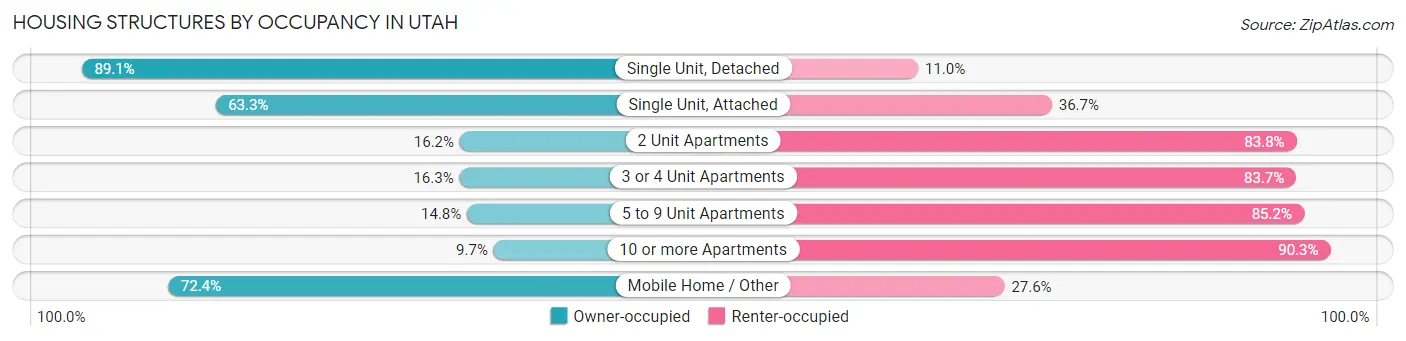
| Structure Type | Owner-occupied | Renter-occupied |
| Single Unit, Detached | 652,995 (89.0%) | 80,300 (11.0%) |
| Single Unit, Attached | 50,565 (63.3%) | 29,314 (36.7%) |
| 2 Unit Apartments | 3,879 (16.2%) | 20,068 (83.8%) |
| 3 or 4 Unit Apartments | 6,650 (16.3%) | 34,223 (83.7%) |
| 5 to 9 Unit Apartments | 5,087 (14.8%) | 29,286 (85.2%) |
| 10 or more Apartments | 11,782 (9.7%) | 110,091 (90.3%) |
| Mobile Home / Other | 20,694 (72.4%) | 7,885 (27.6%) |
| Total | 751,652 (70.7%) | 311,167 (29.3%) |
Housing Structures by Number of Rooms in Utah
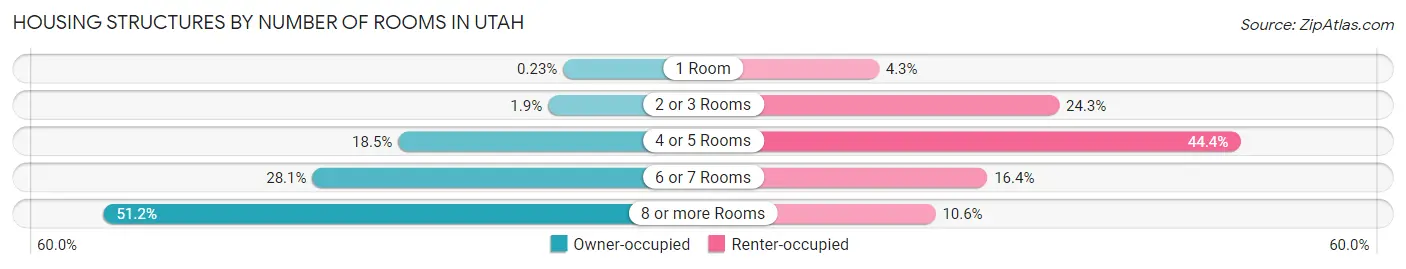
| Number of Rooms | Owner-occupied | Renter-occupied |
| 1 Room | 1,747 (0.2%) | 13,409 (4.3%) |
| 2 or 3 Rooms | 14,394 (1.9%) | 75,689 (24.3%) |
| 4 or 5 Rooms | 139,363 (18.5%) | 138,204 (44.4%) |
| 6 or 7 Rooms | 210,973 (28.1%) | 50,869 (16.4%) |
| 8 or more Rooms | 385,175 (51.2%) | 32,996 (10.6%) |
| Total | 751,652 (100.0%) | 311,167 (100.0%) |
Housing Structure by Heating Type in Utah
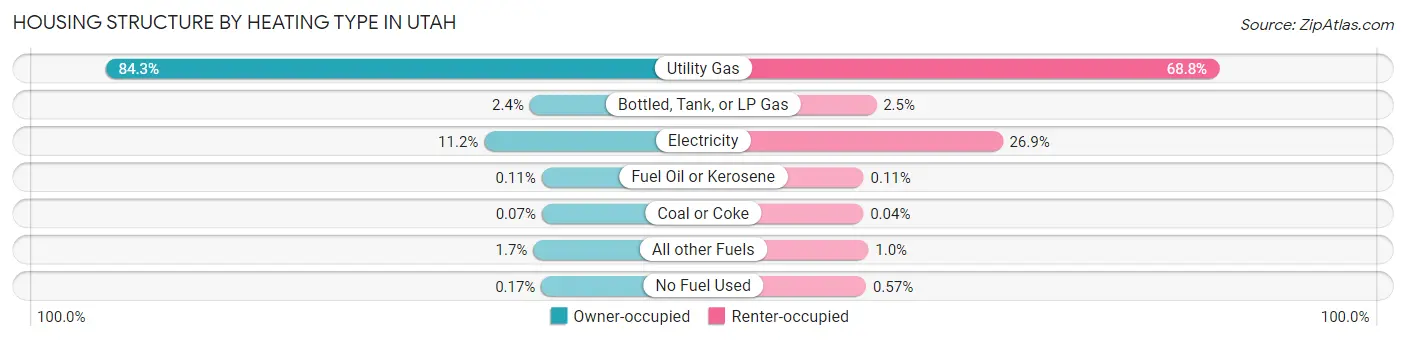
| Heating Type | Owner-occupied | Renter-occupied |
| Utility Gas | 633,938 (84.3%) | 213,968 (68.8%) |
| Bottled, Tank, or LP Gas | 17,966 (2.4%) | 7,890 (2.5%) |
| Electricity | 84,199 (11.2%) | 83,840 (26.9%) |
| Fuel Oil or Kerosene | 843 (0.1%) | 351 (0.1%) |
| Coal or Coke | 519 (0.1%) | 123 (0.0%) |
| All other Fuels | 12,935 (1.7%) | 3,206 (1.0%) |
| No Fuel Used | 1,252 (0.2%) | 1,789 (0.6%) |
| Total | 751,652 (100.0%) | 311,167 (100.0%) |
Household Vehicle Usage in Utah
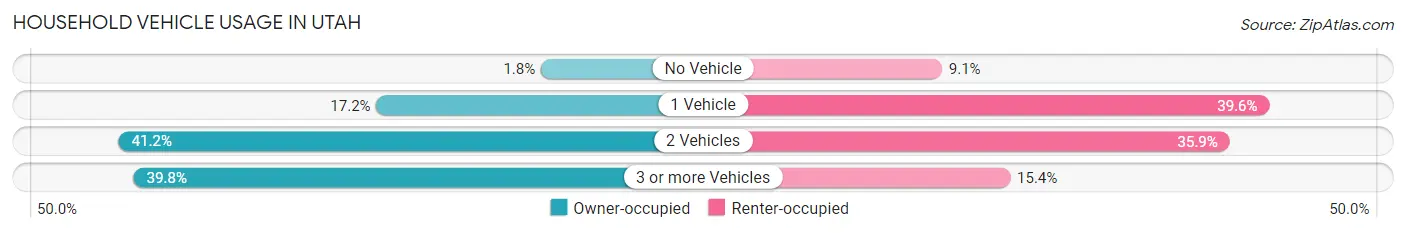
| Vehicles per Household | Owner-occupied | Renter-occupied |
| No Vehicle | 13,468 (1.8%) | 28,172 (9.0%) |
| 1 Vehicle | 128,966 (17.2%) | 123,289 (39.6%) |
| 2 Vehicles | 309,832 (41.2%) | 111,733 (35.9%) |
| 3 or more Vehicles | 299,386 (39.8%) | 47,973 (15.4%) |
| Total | 751,652 (100.0%) | 311,167 (100.0%) |
Real Estate & Mortgages in Utah
Real Estate and Mortgage Overview in Utah
| Characteristic | Without Mortgage | With Mortgage |
| Housing Units | 227,989 | 523,663 |
| Median Property Value | $388,800 | $416,200 |
| Median Household Income | $80,347 | $158,546 |
| Monthly Housing Costs | $501 | $56,477 |
| Real Estate Taxes | $2,226 | $12,121 |
Property Value by Mortgage Status in Utah
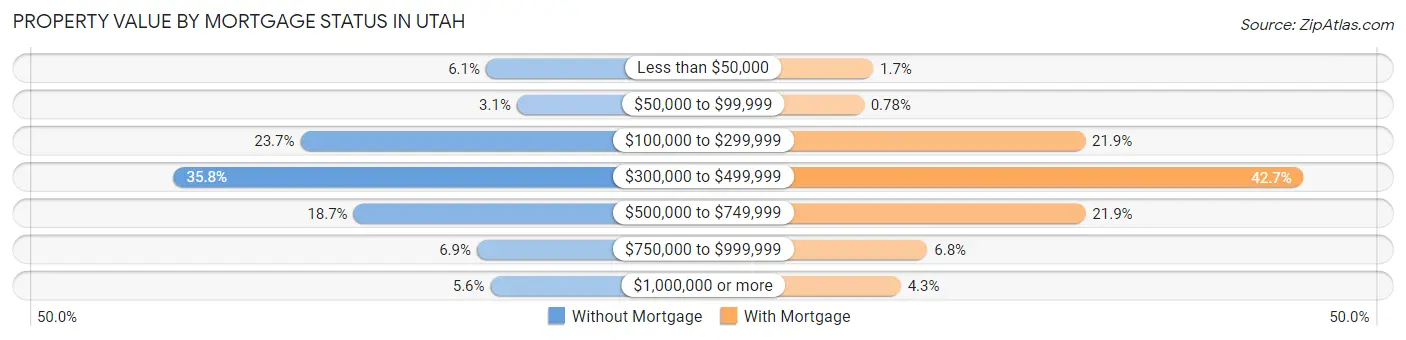
| Property Value | Without Mortgage | With Mortgage |
| Less than $50,000 | 13,861 (6.1%) | 8,751 (1.7%) |
| $50,000 to $99,999 | 7,140 (3.1%) | 4,096 (0.8%) |
| $100,000 to $299,999 | 54,132 (23.7%) | 114,469 (21.9%) |
| $300,000 to $499,999 | 81,616 (35.8%) | 223,426 (42.7%) |
| $500,000 to $749,999 | 42,582 (18.7%) | 114,615 (21.9%) |
| $750,000 to $999,999 | 15,793 (6.9%) | 35,809 (6.8%) |
| $1,000,000 or more | 12,865 (5.6%) | 22,497 (4.3%) |
| Total | 227,989 (100.0%) | 523,663 (100.0%) |
Household Income by Mortgage Status in Utah
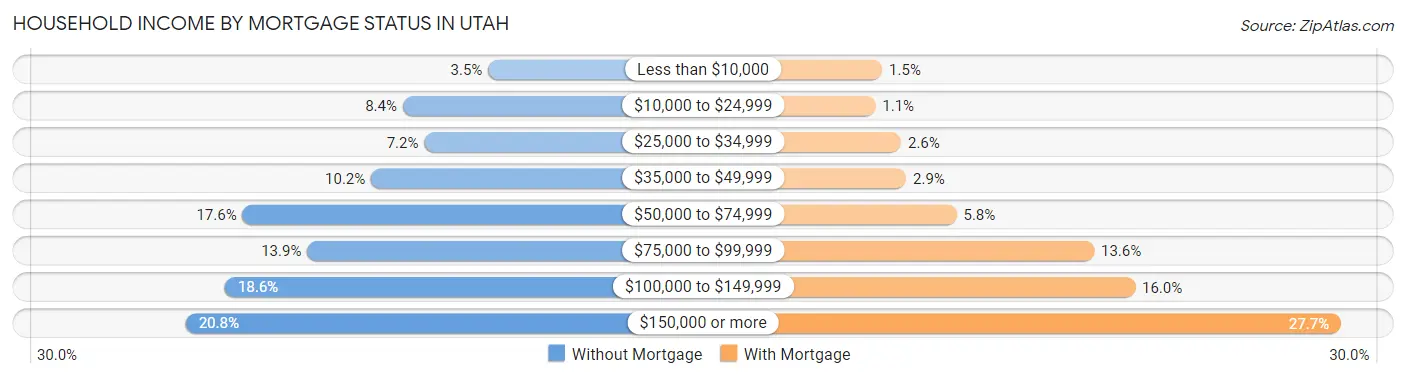
| Household Income | Without Mortgage | With Mortgage |
| Less than $10,000 | 8,005 (3.5%) | 7,938 (1.5%) |
| $10,000 to $24,999 | 19,130 (8.4%) | 5,917 (1.1%) |
| $25,000 to $34,999 | 16,318 (7.2%) | 13,597 (2.6%) |
| $35,000 to $49,999 | 23,265 (10.2%) | 15,158 (2.9%) |
| $50,000 to $74,999 | 40,007 (17.5%) | 30,222 (5.8%) |
| $75,000 to $99,999 | 31,583 (13.9%) | 71,351 (13.6%) |
| $100,000 to $149,999 | 42,292 (18.5%) | 83,603 (16.0%) |
| $150,000 or more | 47,389 (20.8%) | 145,269 (27.7%) |
| Total | 227,989 (100.0%) | 523,663 (100.0%) |
Property Value to Household Income Ratio in Utah
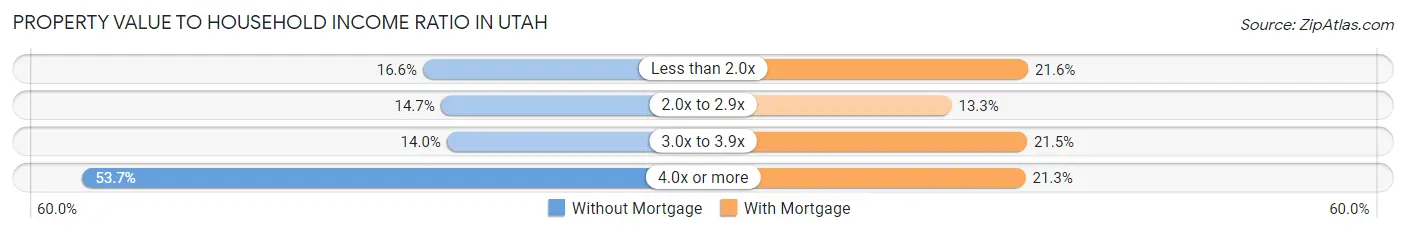
| Value-to-Income Ratio | Without Mortgage | With Mortgage |
| Less than 2.0x | 37,873 (16.6%) | 113,097 (21.6%) |
| 2.0x to 2.9x | 33,476 (14.7%) | 69,408 (13.3%) |
| 3.0x to 3.9x | 31,939 (14.0%) | 112,412 (21.5%) |
| 4.0x or more | 122,432 (53.7%) | 111,619 (21.3%) |
| Total | 227,989 (100.0%) | 523,663 (100.0%) |
Real Estate Taxes by Mortgage Status in Utah
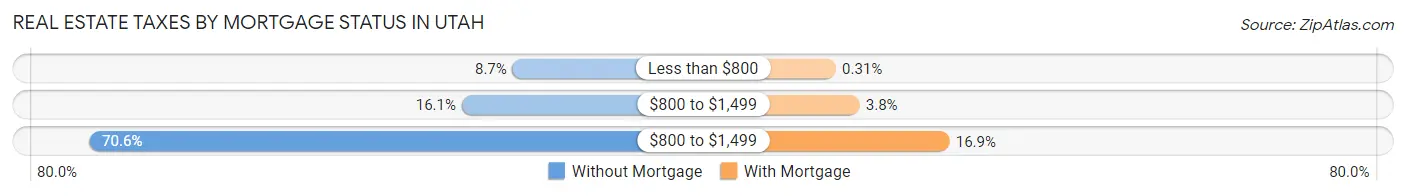
| Property Taxes | Without Mortgage | With Mortgage |
| Less than $800 | 19,823 (8.7%) | 1,602 (0.3%) |
| $800 to $1,499 | 36,744 (16.1%) | 19,765 (3.8%) |
| $800 to $1,499 | 160,877 (70.6%) | 88,534 (16.9%) |
| Total | 227,989 (100.0%) | 523,663 (100.0%) |
Health & Disability in Utah
Health Insurance Coverage by Age in Utah
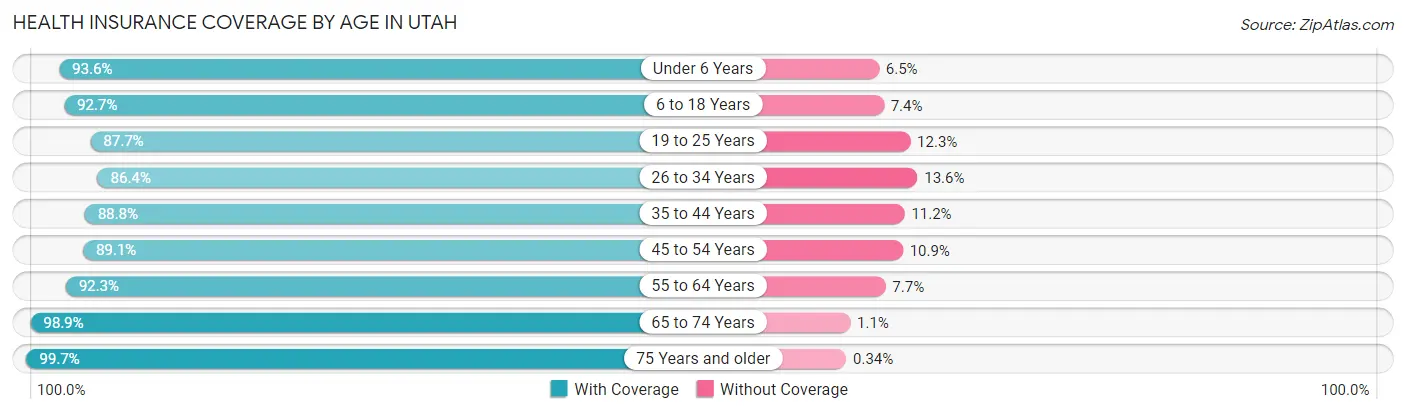
| Age Bracket | With Coverage | Without Coverage |
| Under 6 Years | 271,485 (93.5%) | 18,727 (6.5%) |
| 6 to 18 Years | 650,927 (92.6%) | 51,653 (7.3%) |
| 19 to 25 Years | 330,620 (87.7%) | 46,284 (12.3%) |
| 26 to 34 Years | 364,521 (86.4%) | 57,472 (13.6%) |
| 35 to 44 Years | 398,528 (88.8%) | 50,358 (11.2%) |
| 45 to 54 Years | 305,995 (89.1%) | 37,412 (10.9%) |
| 55 to 64 Years | 281,070 (92.3%) | 23,345 (7.7%) |
| 65 to 74 Years | 223,626 (98.9%) | 2,442 (1.1%) |
| 75 Years and older | 142,843 (99.7%) | 490 (0.3%) |
| Total | 2,969,615 (91.1%) | 288,183 (8.8%) |
Health Insurance Coverage by Citizenship Status in Utah
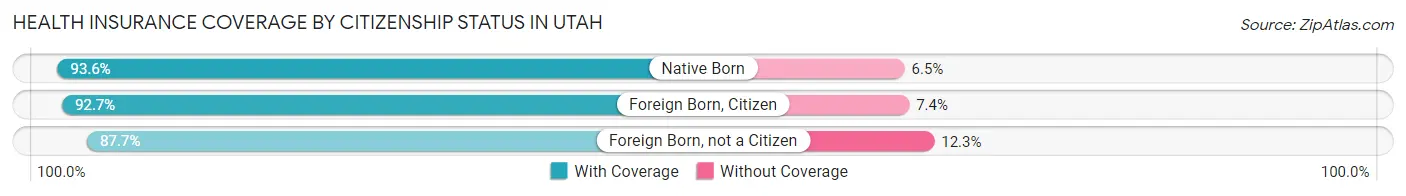
| Citizenship Status | With Coverage | Without Coverage |
| Native Born | 271,485 (93.5%) | 18,727 (6.5%) |
| Foreign Born, Citizen | 650,927 (92.6%) | 51,653 (7.3%) |
| Foreign Born, not a Citizen | 330,620 (87.7%) | 46,284 (12.3%) |
Health Insurance Coverage by Household Income in Utah
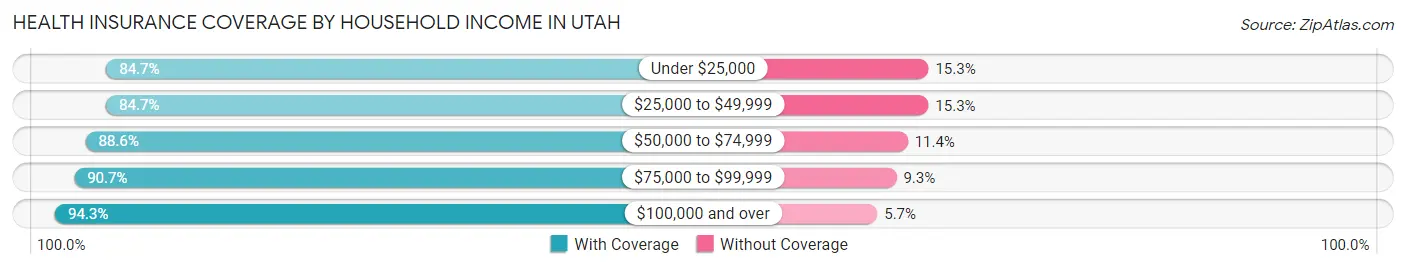
| Household Income | With Coverage | Without Coverage |
| Under $25,000 | 167,241 (84.7%) | 30,223 (15.3%) |
| $25,000 to $49,999 | 322,274 (84.7%) | 58,155 (15.3%) |
| $50,000 to $74,999 | 431,159 (88.6%) | 55,556 (11.4%) |
| $75,000 to $99,999 | 442,393 (90.7%) | 45,379 (9.3%) |
| $100,000 and over | 1,576,843 (94.3%) | 95,551 (5.7%) |
Public vs Private Health Insurance Coverage by Age in Utah
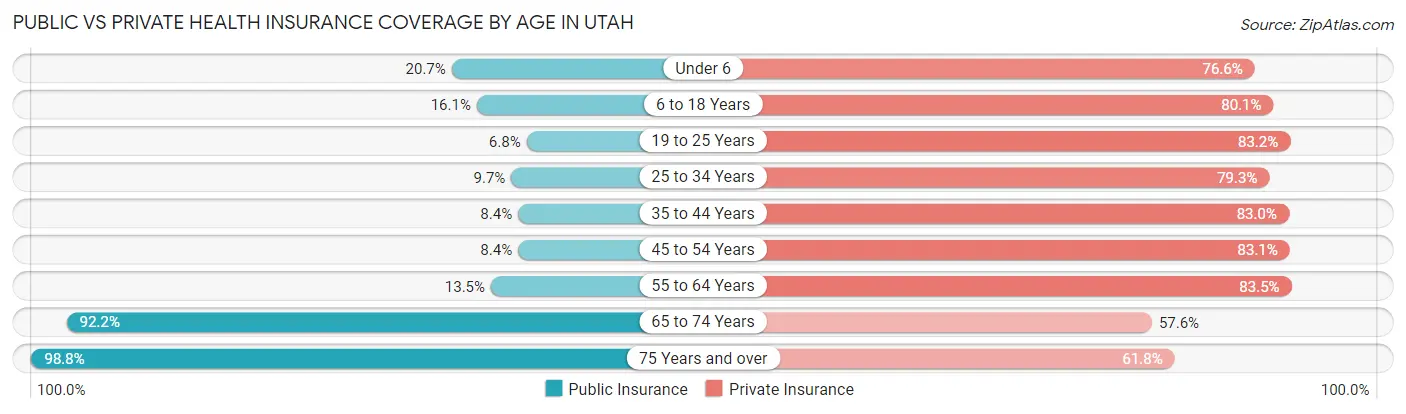
| Age Bracket | Public Insurance | Private Insurance |
| Under 6 | 60,181 (20.7%) | 222,375 (76.6%) |
| 6 to 18 Years | 112,973 (16.1%) | 562,784 (80.1%) |
| 19 to 25 Years | 25,785 (6.8%) | 313,579 (83.2%) |
| 25 to 34 Years | 40,899 (9.7%) | 334,784 (79.3%) |
| 35 to 44 Years | 37,810 (8.4%) | 372,350 (83.0%) |
| 45 to 54 Years | 28,929 (8.4%) | 285,456 (83.1%) |
| 55 to 64 Years | 40,936 (13.5%) | 254,020 (83.5%) |
| 65 to 74 Years | 208,450 (92.2%) | 130,142 (57.6%) |
| 75 Years and over | 141,548 (98.8%) | 88,509 (61.8%) |
| Total | 697,511 (21.4%) | 2,563,999 (78.7%) |
Disability Status by Sex by Age in Utah
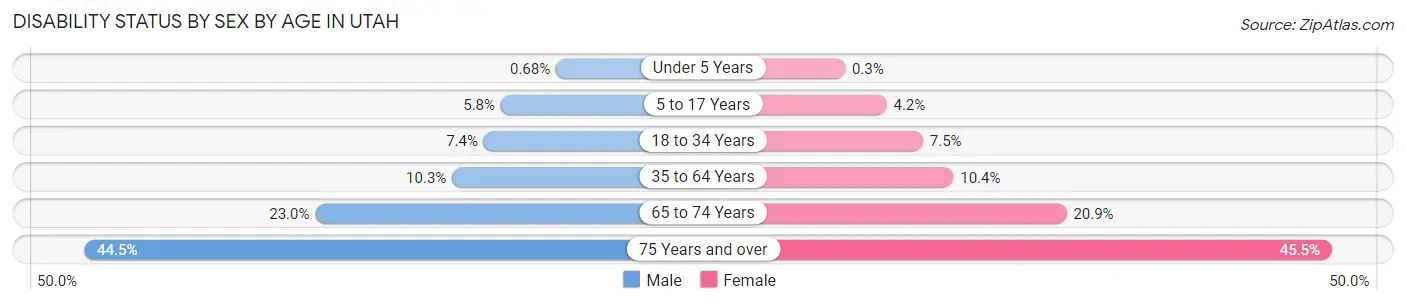
| Age Bracket | Male | Female |
| Under 5 Years | 834 (0.7%) | 352 (0.3%) |
| 5 to 17 Years | 20,691 (5.8%) | 13,989 (4.2%) |
| 18 to 34 Years | 32,215 (7.4%) | 31,697 (7.5%) |
| 35 to 64 Years | 57,429 (10.3%) | 55,918 (10.3%) |
| 65 to 74 Years | 25,199 (23.0%) | 24,309 (20.8%) |
| 75 Years and over | 28,438 (44.5%) | 36,107 (45.5%) |
Disability Class by Sex by Age in Utah
Disability Class: Hearing Difficulty
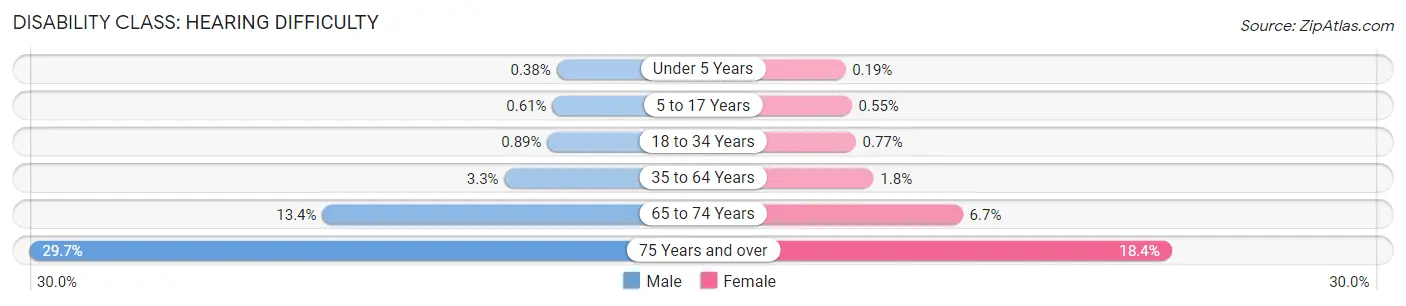
| Age Bracket | Male | Female |
| Under 5 Years | 473 (0.4%) | 219 (0.2%) |
| 5 to 17 Years | 2,162 (0.6%) | 1,844 (0.5%) |
| 18 to 34 Years | 3,869 (0.9%) | 3,263 (0.8%) |
| 35 to 64 Years | 18,256 (3.3%) | 9,521 (1.8%) |
| 65 to 74 Years | 14,688 (13.4%) | 7,841 (6.7%) |
| 75 Years and over | 19,012 (29.7%) | 14,574 (18.4%) |
Disability Class: Vision Difficulty
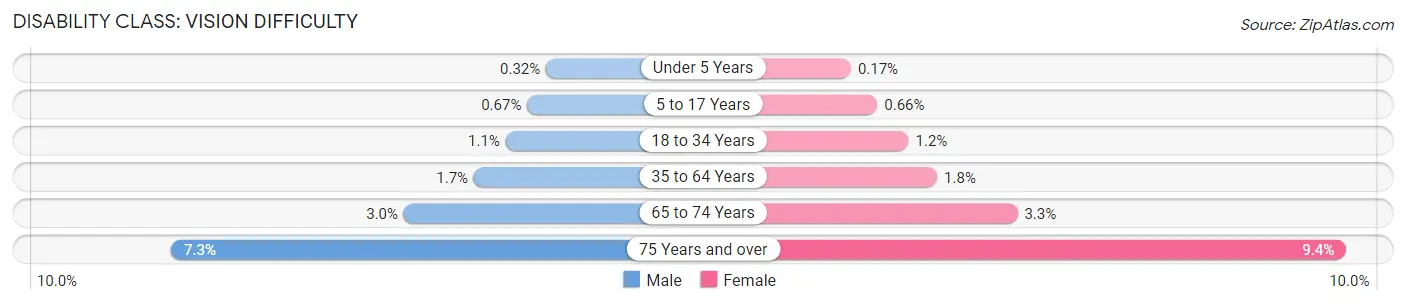
| Age Bracket | Male | Female |
| Under 5 Years | 395 (0.3%) | 194 (0.2%) |
| 5 to 17 Years | 2,388 (0.7%) | 2,235 (0.7%) |
| 18 to 34 Years | 4,649 (1.1%) | 5,222 (1.2%) |
| 35 to 64 Years | 9,231 (1.7%) | 9,561 (1.8%) |
| 65 to 74 Years | 3,245 (3.0%) | 3,796 (3.3%) |
| 75 Years and over | 4,652 (7.3%) | 7,428 (9.4%) |
Disability Class: Cognitive Difficulty
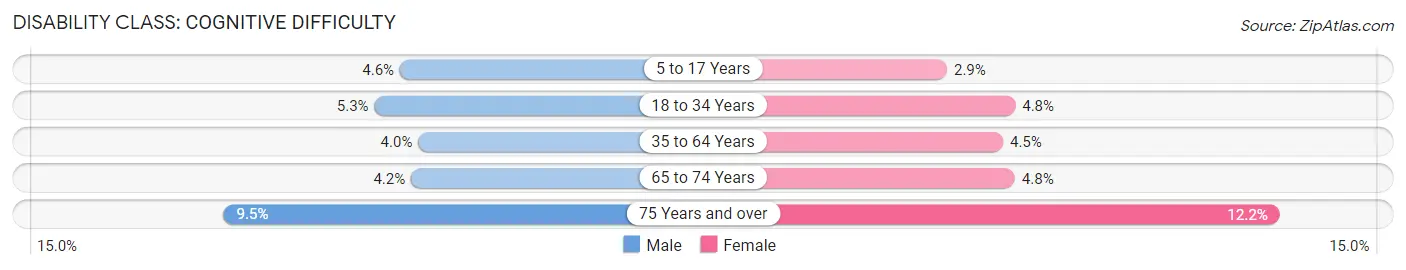
| Age Bracket | Male | Female |
| 5 to 17 Years | 16,227 (4.5%) | 9,895 (2.9%) |
| 18 to 34 Years | 22,981 (5.3%) | 20,346 (4.8%) |
| 35 to 64 Years | 22,461 (4.0%) | 24,237 (4.5%) |
| 65 to 74 Years | 4,643 (4.2%) | 5,616 (4.8%) |
| 75 Years and over | 6,049 (9.5%) | 9,675 (12.2%) |
Disability Class: Ambulatory Difficulty
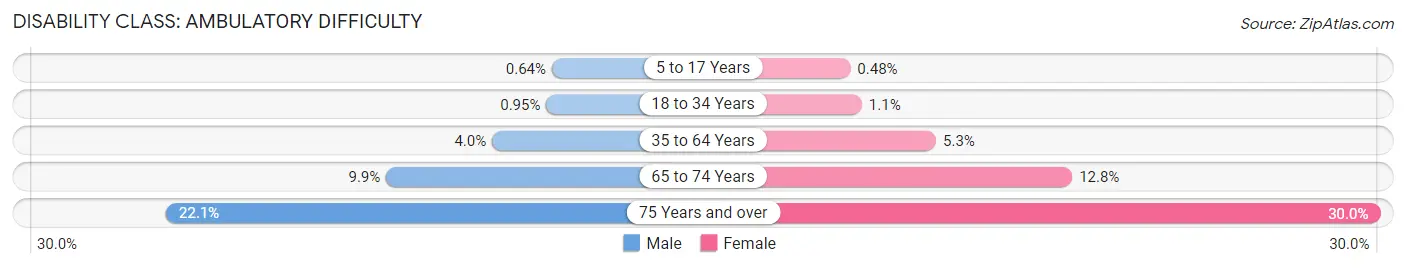
| Age Bracket | Male | Female |
| 5 to 17 Years | 2,279 (0.6%) | 1,620 (0.5%) |
| 18 to 34 Years | 4,164 (0.9%) | 4,729 (1.1%) |
| 35 to 64 Years | 22,107 (4.0%) | 28,354 (5.2%) |
| 65 to 74 Years | 10,807 (9.9%) | 14,956 (12.8%) |
| 75 Years and over | 14,154 (22.1%) | 23,803 (30.0%) |
Disability Class: Self-Care Difficulty
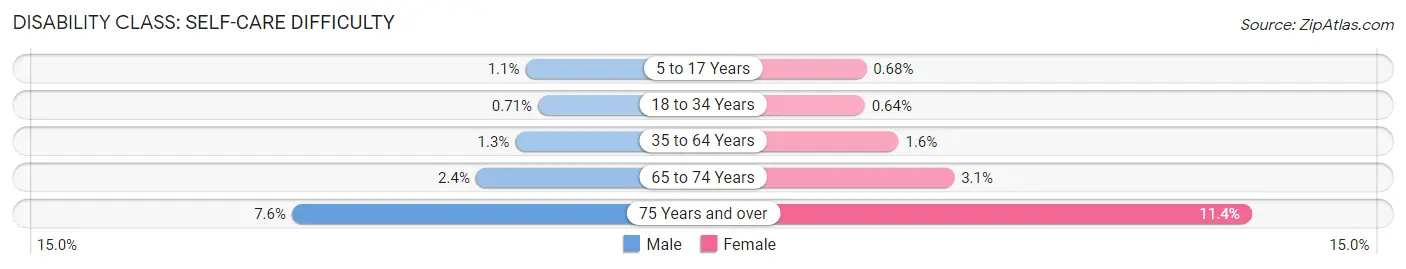
| Age Bracket | Male | Female |
| 5 to 17 Years | 3,772 (1.1%) | 2,279 (0.7%) |
| 18 to 34 Years | 3,100 (0.7%) | 2,684 (0.6%) |
| 35 to 64 Years | 7,471 (1.3%) | 8,529 (1.6%) |
| 65 to 74 Years | 2,676 (2.4%) | 3,655 (3.1%) |
| 75 Years and over | 4,835 (7.6%) | 9,059 (11.4%) |
Technology Access in Utah
Computing Device Access in Utah
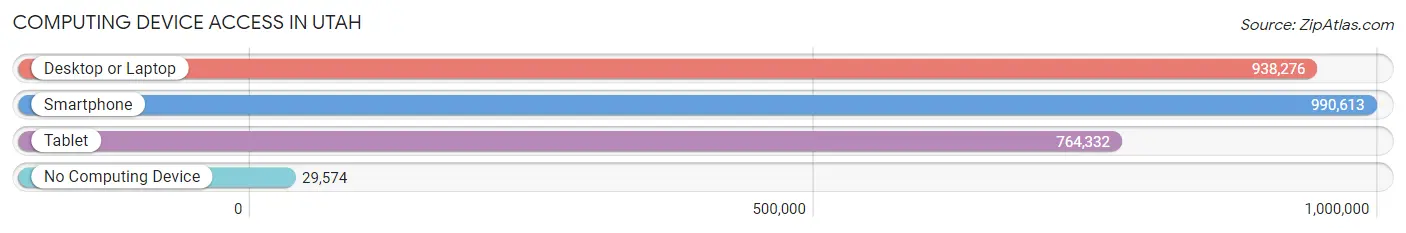
| Device Type | # Households | % Households |
| Desktop or Laptop | 938,276 | 88.3% |
| Smartphone | 990,613 | 93.2% |
| Tablet | 764,332 | 71.9% |
| No Computing Device | 29,574 | 2.8% |
| Total | 1,062,819 | 100.0% |
Internet Access in Utah
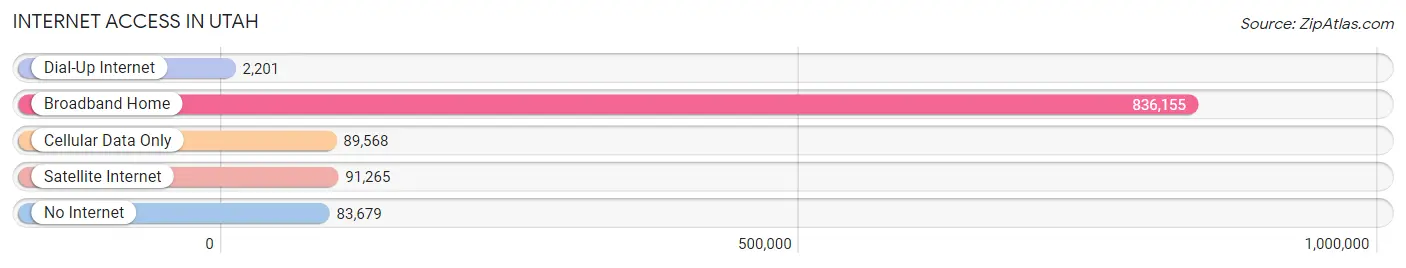
| Internet Type | # Households | % Households |
| Dial-Up Internet | 2,201 | 0.2% |
| Broadband Home | 836,155 | 78.7% |
| Cellular Data Only | 89,568 | 8.4% |
| Satellite Internet | 91,265 | 8.6% |
| No Internet | 83,679 | 7.9% |
| Total | 1,062,819 | 100.0% |
Utah Summary
State History
Utah is a state located in the western United States. It was admitted to the Union on January 4, 1896, as the 45th state. Utah was originally inhabited by Native American tribes, including the Ute, Paiute, Goshute, and Navajo. The first Europeans to explore the area were Spanish explorers in the late 1700s. In 1847, the first Mormon settlers arrived in the Salt Lake Valley, led by Brigham Young. The settlers established the State of Deseret, which was later renamed Utah after the Ute tribe.
The Utah Territory was created in 1850 and was admitted to the Union as the 45th state in 1896. During the late 1800s and early 1900s, Utah experienced a period of rapid growth and development. The population increased significantly due to the arrival of Mormon settlers and the discovery of valuable minerals, such as copper, silver, and gold.
In the early 20th century, Utah was a major producer of copper, silver, and gold. The state also experienced a period of economic growth due to the development of the railroad and the growth of the tourism industry. During World War II, Utah was home to several military bases and was a major supplier of uranium for the Manhattan Project.
Geography
Utah is located in the western United States and is bordered by Idaho to the north, Wyoming to the northeast, Colorado to the east, Arizona to the south, and Nevada to the west. The state has an area of 84,899 square miles, making it the 13th largest state in the country.
Utah is known for its diverse geography, which includes mountains, deserts, canyons, and plateaus. The highest point in the state is Kings Peak, which has an elevation of 13,528 feet. The lowest point is the Beaver Dam Wash, which has an elevation of 2,000 feet.
The majority of Utah is located in the Great Basin, a large area of desert and semi-arid land. The Great Salt Lake is located in the northern part of the state and is the largest saltwater lake in the western hemisphere. The Colorado River forms the western border of the state.
Economy
Utah has a diverse economy that is driven by a variety of industries, including mining, manufacturing, tourism, and agriculture. The state is home to several major companies, including the Church of Jesus Christ of Latter-day Saints, the Huntsman Corporation, and the Kennecott Utah Copper Corporation.
The state’s largest industry is mining, which accounts for approximately 10% of the state’s total economic output. The mining industry is primarily focused on the extraction of copper, gold, silver, and uranium.
Manufacturing is another major industry in Utah, accounting for approximately 8% of the state’s total economic output. The manufacturing sector is primarily focused on the production of electronics, chemicals, and food products.
Tourism is also an important part of the state’s economy, accounting for approximately 5% of the state’s total economic output. The state is home to several popular tourist destinations, including Zion National Park, Bryce Canyon National Park, and Arches National Park.
Demographics
As of 2019, the population of Utah was estimated to be 3.2 million. The state has a population density of 33.7 people per square mile, making it the 34th most densely populated state in the country.
The largest city in Utah is Salt Lake City, which has a population of 200,000. Other major cities in the state include West Valley City, Provo, and Ogden.
The majority of Utah’s population is white (78.2%), followed by Hispanic or Latino (13.2%), and Asian (2.7%). The state also has a significant Native American population (1.2%). The median household income in Utah is $63,837, which is slightly higher than the national median of $61,937.
Common Questions
When was Utah Incorporated?
Utah was Incorporated into the Union on Jan 4, 1896.
What is the Total Area of Utah?
Total Area of Utah is 84,897 Square Miles.
What is the Total Land Area of Utah?
Total Land Area of Utah is 82,191 Square Miles.
What is the Total Water Area of Utah?
Total Water Area of Utah is 2,706 Square Miles.
What is the Average Elevation in Utah?
Average Elevation in Utah is 6,100 Feet.
What is the Highest Elevation in Utah?
Highest Elevation in Utah is 13,528 Feet.
What is the Lowest Elevation in Utah?
Lowest Elevation in Utah is 2000 Feet.
What is the Population Density in Utah?
Population Density in Utah is 40.0 People per Square Mile.
What is Per Capita Income in Utah?
Per Capita income in Utah is $37,023.
What is the Median Family Income in Utah?
Median Family Income in Utah is $100,001.
What is the Median Household income in Utah?
Median Household Income in Utah is $86,833.
What is Income or Wage Gap in Utah?
Income or Wage Gap in Utah is 42.4%.
Women in Utah earn 57.6 cents for every dollar earned by a man.
What is Family Income Deficit in Utah?
Family Income Deficit in Utah is $10,899.
Families that are below poverty line in Utah earn $10,899 less on average than the poverty threshold level.
What is Inequality or Gini Index in Utah?
Inequality or Gini Index in Utah is 0.43.
What is the Total Population of Utah?
Total Population of Utah is 3,283,809.
What is the Total Male Population of Utah?
Total Male Population of Utah is 1,665,209.
What is the Total Female Population of Utah?
Total Female Population of Utah is 1,618,600.
What is the Ratio of Males per 100 Females in Utah?
There are 102.88 Males per 100 Females in Utah.
What is the Ratio of Females per 100 Males in Utah?
There are 97.20 Females per 100 Males in Utah.
What is the Median Population Age in Utah?
Median Population Age in Utah is 31.4 Years.
What is the Average Family Size in Utah
Average Family Size in Utah is 3.5 People.
What is the Average Household Size in Utah
Average Household Size in Utah is 3.0 People.
How Large is the Labor Force in Utah?
There are 1,703,624 People in the Labor Forcein in Utah.
What is the Percentage of People in the Labor Force in Utah?
69.4% of People are in the Labor Force in Utah.
What is the Unemployment Rate in Utah?
Unemployment Rate in Utah is 3.4%.