Cities with the Highest Percentage of Families with Income Below $10,000 in the United States
RELATED REPORTS & OPTIONS
Family Income | $0-10k
United States
Compare Cities
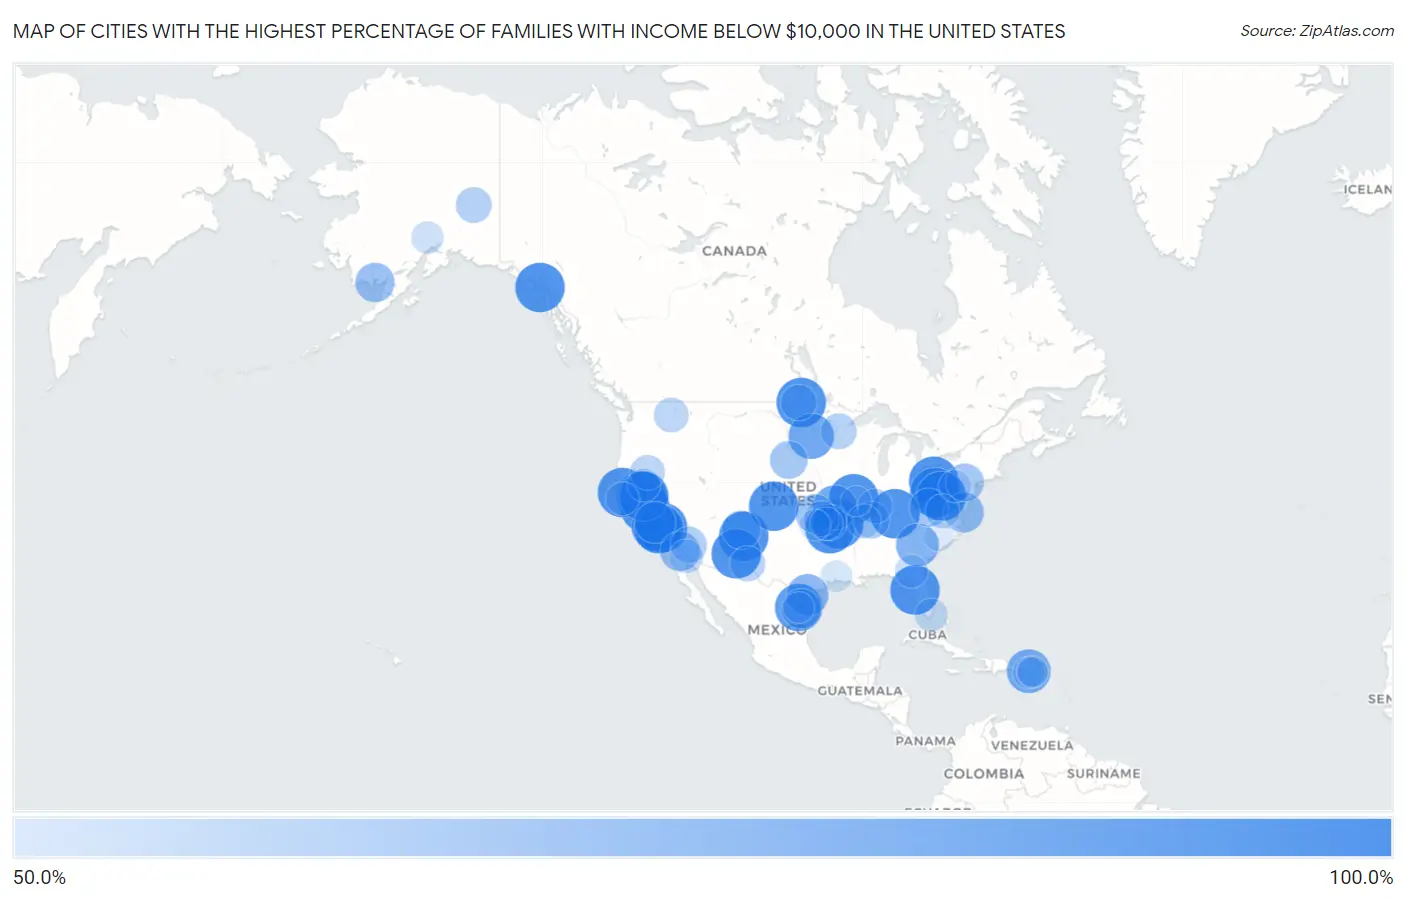
Map of Cities with the Highest Percentage of Families with Income Below $10,000 in the United States
0.0%
100.0%
Cities with the Highest Percentage of Families with Income Below $10,000 in the United States
| City | Families with Income < $10k | vs State | vs National | |
| 1. | Slippery Rock University | 100.0% | 2.9%(+97.1)#1 | 3.1%(+96.9)#1 |
| 2. | Homer C Jones | 100.0% | 4.6%(+95.4)#1 | 3.1%(+96.9)#2 |
| 3. | Clipper Mills | 100.0% | 2.9%(+97.1)#1 | 3.1%(+96.9)#3 |
| 4. | Pajarito Mesa | 100.0% | 4.6%(+95.4)#2 | 3.1%(+96.9)#4 |
| 5. | Millville | 100.0% | 3.1%(+96.9)#1 | 3.1%(+96.9)#5 |
| 6. | Lake Arrowhead | 100.0% | 2.8%(+97.2)#1 | 3.1%(+96.9)#6 |
| 7. | Pence | 100.0% | 3.1%(+96.9)#2 | 3.1%(+96.9)#7 |
| 8. | Kamaili | 100.0% | 2.5%(+97.5)#1 | 3.1%(+96.9)#8 |
| 9. | Buffington | 100.0% | 2.9%(+97.1)#2 | 3.1%(+96.9)#9 |
| 10. | Bayport | 100.0% | 3.2%(+96.8)#1 | 3.1%(+96.9)#10 |
| 11. | Ferrer | 100.0% | 17.6%(+82.4)#1 | 3.1%(+96.9)#11 |
| 12. | Detmold | 100.0% | 2.4%(+97.6)#1 | 3.1%(+96.9)#12 |
| 13. | Kennedy Meadows | 100.0% | 2.9%(+97.1)#2 | 3.1%(+96.9)#14 |
| 14. | Kingston | 100.0% | 4.6%(+95.4)#3 | 3.1%(+96.9)#15 |
| 15. | Dales | 100.0% | 2.9%(+97.1)#3 | 3.1%(+96.9)#16 |
| 16. | Rail Road Flat | 100.0% | 2.9%(+97.1)#4 | 3.1%(+96.9)#17 |
| 17. | Encantado | 100.0% | 4.6%(+95.4)#4 | 3.1%(+96.9)#18 |
| 18. | Lake View | 100.0% | 3.1%(+96.9)#3 | 3.1%(+96.9)#19 |
| 19. | Excursion Inlet | 100.0% | 2.3%(+97.7)#1 | 3.1%(+96.9)#20 |
| 20. | El Rancho | 100.0% | 2.9%(+97.1)#5 | 3.1%(+96.9)#21 |
| 21. | Mayfield Colony | 100.0% | 2.6%(+97.4)#1 | 3.1%(+96.9)#22 |
| 22. | Shamrock Colony | 100.0% | 2.6%(+97.4)#2 | 3.1%(+96.9)#23 |
| 23. | Lopeno | 100.0% | 3.5%(+96.5)#1 | 3.1%(+96.9)#24 |
| 24. | Leggett | 100.0% | 2.9%(+97.1)#6 | 3.1%(+96.9)#25 |
| 25. | Silverdale | 100.0% | 2.6%(+97.4)#1 | 3.1%(+96.9)#26 |
| 26. | Villa Sin Miedo | 100.0% | 17.6%(+82.4)#2 | 3.1%(+96.9)#27 |
| 27. | Ashley | 100.0% | 2.8%(+97.2)#2 | 3.1%(+96.9)#28 |
| 28. | New Hope | 100.0% | 4.2%(+95.8)#1 | 3.1%(+96.9)#29 |
| 29. | Blue Eye | 100.0% | 3.7%(+96.3)#1 | 3.1%(+96.9)#30 |
| 30. | Burney | 100.0% | 3.1%(+96.9)#4 | 3.1%(+96.9)#31 |
| 31. | Brandon | 100.0% | 2.2%(+97.8)#1 | 3.1%(+96.9)#32 |
| 32. | Symonds | 100.0% | 5.0%(+95.0)#1 | 3.1%(+96.9)#33 |
| 33. | Piney | 100.0% | 3.8%(+96.2)#1 | 3.1%(+96.9)#34 |
| 34. | Mcclenney Tract | 100.0% | 2.9%(+97.1)#7 | 3.1%(+96.9)#35 |
| 35. | Beaver | 100.0% | 2.6%(+97.4)#2 | 3.1%(+96.9)#36 |
| 36. | Graniteville | 100.0% | 2.9%(+97.1)#8 | 3.1%(+96.9)#37 |
| 37. | Hannah | 100.0% | 2.0%(+98.0)#1 | 3.1%(+96.9)#38 |
| 38. | Surprise Creek Colony | 100.0% | 2.5%(+97.5)#1 | 3.1%(+96.9)#39 |
| 39. | Los Alvarez | 95.1% | 3.5%(+91.6)#2 | 3.1%(+92.0)#40 |
| 40. | Warthen | 95.1% | 3.6%(+91.5)#1 | 3.1%(+92.0)#41 |
| 41. | Lewis | 93.0% | 3.1%(+89.9)#5 | 3.1%(+89.9)#42 |
| 42. | Long Hollow | 89.9% | 2.6%(+87.3)#3 | 3.1%(+86.8)#43 |
| 43. | La Due | 87.5% | 2.8%(+84.7)#3 | 3.1%(+84.4)#44 |
| 44. | Cerrillos Hoyos | 86.1% | 17.6%(+68.5)#3 | 3.1%(+83.0)#45 |
| 45. | Bradley | 83.9% | 3.7%(+80.2)#1 | 3.1%(+80.8)#46 |
| 46. | Riverview Colony | 83.8% | 2.5%(+81.3)#2 | 3.1%(+80.7)#47 |
| 47. | Moccasin | 81.3% | 2.5%(+78.8)#3 | 3.1%(+78.2)#48 |
| 48. | Sandy Hollow Escondidas | 81.1% | 3.5%(+77.6)#3 | 3.1%(+78.0)#49 |
| 49. | East Orosi | 80.0% | 2.9%(+77.1)#9 | 3.1%(+76.9)#50 |
| 50. | Eagle Creek Colony | 78.9% | 2.5%(+76.4)#4 | 3.1%(+75.8)#51 |
| 51. | Serena | 78.3% | 3.0%(+75.3)#1 | 3.1%(+75.2)#52 |
| 52. | Lee Mont | 77.4% | 2.5%(+74.9)#1 | 3.1%(+74.3)#53 |
| 53. | Piñas | 77.2% | 17.6%(+59.6)#4 | 3.1%(+74.1)#54 |
| 54. | El Socio | 76.2% | 3.5%(+72.7)#4 | 3.1%(+73.1)#55 |
| 55. | Bombay Beach | 75.9% | 2.9%(+73.0)#10 | 3.1%(+72.8)#56 |
| 56. | Baxter | 75.6% | 4.2%(+71.4)#1 | 3.1%(+72.5)#57 |
| 57. | Clark S Point | 75.0% | 2.3%(+72.7)#2 | 3.1%(+71.9)#58 |
| 58. | Latham | 74.8% | 2.6%(+72.2)#3 | 3.1%(+71.7)#59 |
| 59. | San Luis | 73.3% | 4.6%(+68.7)#5 | 3.1%(+70.2)#60 |
| 60. | Nettie | 73.0% | 4.2%(+68.8)#2 | 3.1%(+69.9)#61 |
| 61. | Albrightsville | 71.9% | 2.9%(+69.0)#3 | 3.1%(+68.8)#62 |
| 62. | Okreek | 71.4% | 2.6%(+68.8)#4 | 3.1%(+68.3)#63 |
| 63. | White Oak | 71.4% | 2.8%(+68.6)#4 | 3.1%(+68.3)#64 |
| 64. | Villa Esperanza | 71.2% | 17.6%(+53.6)#5 | 3.1%(+68.1)#65 |
| 65. | Lowes | 68.9% | 4.2%(+64.7)#2 | 3.1%(+65.8)#66 |
| 66. | Poston | 67.9% | 3.4%(+64.5)#1 | 3.1%(+64.8)#67 |
| 67. | Butler | 66.7% | 3.8%(+62.9)#2 | 3.1%(+63.6)#68 |
| 68. | Healy Lake | 66.7% | 2.3%(+64.4)#3 | 3.1%(+63.6)#69 |
| 69. | Mcgrath | 66.7% | 1.8%(+64.9)#1 | 3.1%(+63.6)#70 |
| 70. | Sarles | 66.7% | 2.0%(+64.7)#2 | 3.1%(+63.6)#71 |
| 71. | Butterfield | 65.6% | 3.5%(+62.1)#5 | 3.1%(+62.5)#72 |
| 72. | Tyro | 65.3% | 2.6%(+62.7)#4 | 3.1%(+62.2)#73 |
| 73. | New Pine Creek | 64.7% | 2.9%(+61.8)#11 | 3.1%(+61.6)#74 |
| 74. | Juliette | 64.3% | 3.6%(+60.7)#2 | 3.1%(+61.2)#75 |
| 75. | Huetter | 64.3% | 2.2%(+62.1)#1 | 3.1%(+61.2)#76 |
| 76. | Golden Gate | 64.3% | 3.0%(+61.3)#2 | 3.1%(+61.2)#77 |
| 77. | Schuyler | 62.7% | 2.5%(+60.2)#2 | 3.1%(+59.6)#78 |
| 78. | Villa Quintero | 62.5% | 17.6%(+44.9)#6 | 3.1%(+59.4)#79 |
| 79. | Penermon | 62.5% | 2.8%(+59.7)#5 | 3.1%(+59.4)#80 |
| 80. | Centerton | 61.8% | 3.1%(+58.7)#6 | 3.1%(+58.7)#81 |
| 81. | Drysdale | 61.7% | 3.4%(+58.3)#2 | 3.1%(+58.6)#82 |
| 82. | Spaulding | 60.4% | 2.9%(+57.5)#12 | 3.1%(+57.3)#83 |
| 83. | Moody Afb | 60.3% | 3.6%(+56.7)#3 | 3.1%(+57.2)#84 |
| 84. | Little River | 60.3% | 2.9%(+57.4)#13 | 3.1%(+57.2)#85 |
| 85. | Homestead Base | 60.0% | 3.2%(+56.8)#2 | 3.1%(+56.9)#86 |
| 86. | Grand Lake Towne | 59.6% | 3.8%(+55.8)#3 | 3.1%(+56.5)#87 |
| 87. | Lenkerville | 58.5% | 2.9%(+55.6)#4 | 3.1%(+55.4)#88 |
| 88. | Skwentna | 58.3% | 2.3%(+56.0)#4 | 3.1%(+55.2)#89 |
| 89. | Vayas | 57.1% | 17.6%(+39.5)#7 | 3.1%(+54.0)#90 |
| 90. | Starks | 56.4% | 4.9%(+51.5)#1 | 3.1%(+53.3)#91 |
| 91. | Sicangu | 56.0% | 2.6%(+53.4)#5 | 3.1%(+52.9)#92 |
| 92. | Santa Clara | 55.8% | 17.6%(+38.2)#8 | 3.1%(+52.7)#93 |
| 93. | East Altoona | 55.8% | 2.9%(+52.9)#5 | 3.1%(+52.7)#94 |
| 94. | Lassalle | 55.6% | 17.6%(+38.0)#9 | 3.1%(+52.5)#95 |
| 95. | New Miami Colony | 55.6% | 2.5%(+53.1)#5 | 3.1%(+52.5)#96 |
| 96. | Skedee | 55.6% | 3.8%(+51.8)#4 | 3.1%(+52.5)#97 |
| 97. | North Escobares | 55.1% | 3.5%(+51.6)#6 | 3.1%(+52.0)#98 |
| 98. | Pueblito Del Carmen | 54.5% | 17.6%(+36.9)#10 | 3.1%(+51.4)#99 |
| 99. | Fountain N Lakes | 54.0% | 2.8%(+51.2)#6 | 3.1%(+50.9)#100 |
| 100. | Silver City | 53.8% | 3.3%(+50.5)#1 | 3.1%(+50.7)#101 |
Common Questions
What are the Top 10 Cities with the Highest Percentage of Families with Income Below $10,000 in the United States?
Top 10 Cities with the Highest Percentage of Families with Income Below $10,000 in the United States are:
#1
100.0%
#2
100.0%
#3
100.0%
#4
100.0%
#5
100.0%
#6
100.0%
#7
100.0%
#8
100.0%
#9
100.0%
#10
100.0%
What city has the Highest Percentage of Families with Income Below $10,000 in the United States?
Slippery Rock University has the Highest Percentage of Families with Income Below $10,000 in the United States with 100.0%.
What is the Percentage of Families with Income Below $10,000 in the United States?
Percentage of Families with Income Below $10,000 in the United States is 3.1%.