Cities with the Most Immigrants from Romania in the United States
RELATED REPORTS & OPTIONS
Romania
United States
Compare Cities
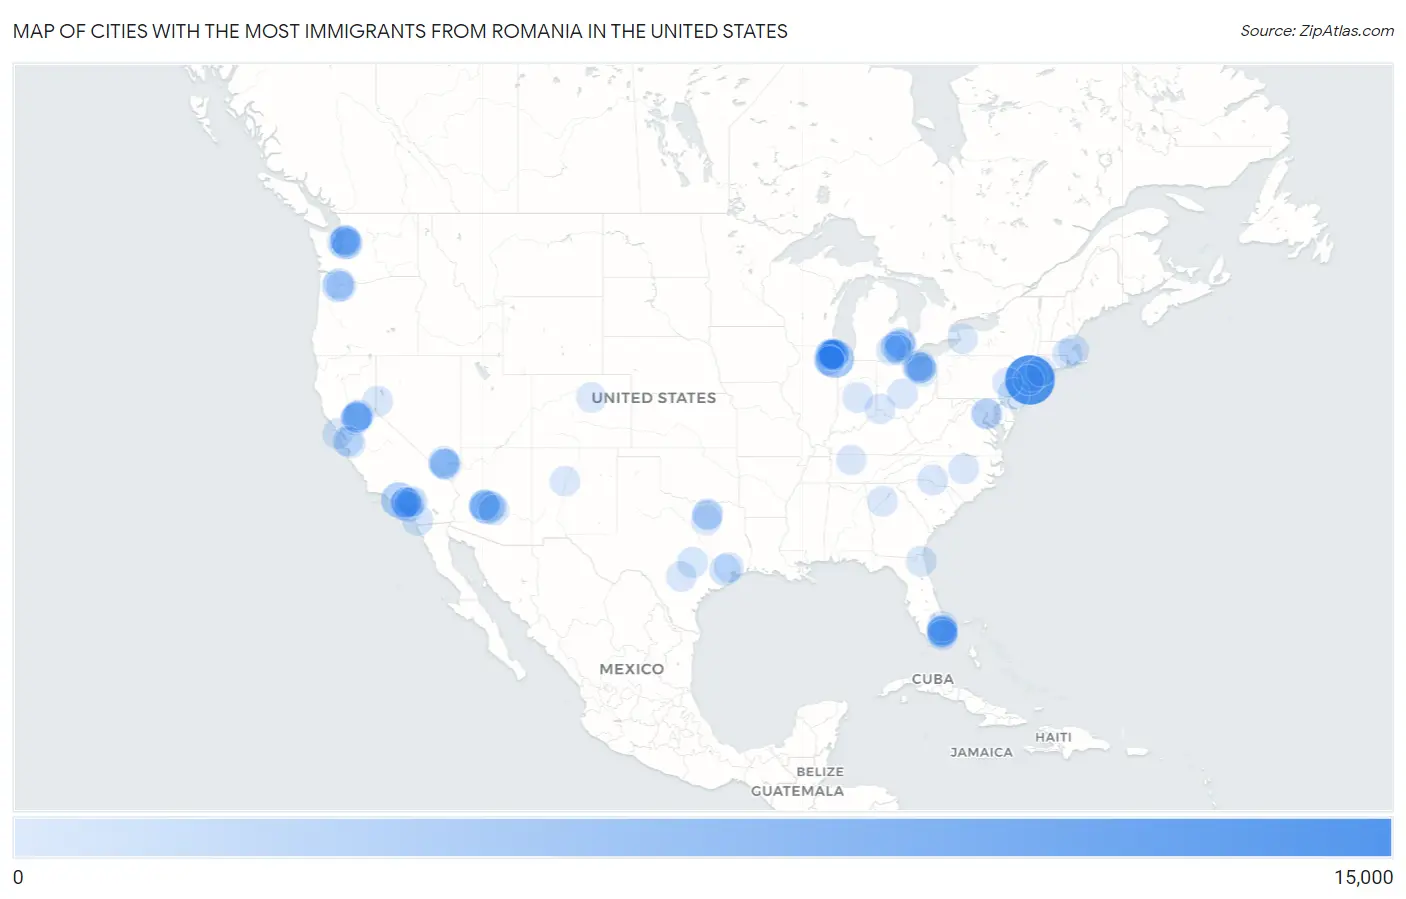
Map of Cities with the Most Immigrants from Romania in the United States
0
15,000
Cities with the Most Immigrants from Romania in the United States
| City | Romania | vs State | vs National | |
| 1. | New York | 12,802 | 19,252(66.50%)#1 | 164,406(7.79%)#1 |
| 2. | Chicago | 5,216 | 14,736(35.40%)#1 | 164,406(3.17%)#2 |
| 3. | Los Angeles | 3,365 | 23,058(14.59%)#1 | 164,406(2.05%)#3 |
| 4. | Phoenix | 2,254 | 5,792(38.92%)#1 | 164,406(1.37%)#4 |
| 5. | Portland | 976 | 4,043(24.14%)#1 | 164,406(0.59%)#5 |
| 6. | Glendale | 958 | 5,792(16.54%)#2 | 164,406(0.58%)#6 |
| 7. | Bellevue | 857 | 7,568(11.32%)#1 | 164,406(0.52%)#7 |
| 8. | Hallandale Beach | 826 | 14,943(5.53%)#1 | 164,406(0.50%)#8 |
| 9. | Philadelphia | 822 | 5,598(14.68%)#1 | 164,406(0.50%)#9 |
| 10. | Anaheim | 819 | 23,058(3.55%)#2 | 164,406(0.50%)#10 |
| 11. | San Diego | 805 | 23,058(3.49%)#3 | 164,406(0.49%)#11 |
| 12. | Hollywood | 788 | 14,943(5.27%)#2 | 164,406(0.48%)#12 |
| 13. | Houston | 775 | 6,849(11.32%)#1 | 164,406(0.47%)#13 |
| 14. | Seattle | 738 | 7,568(9.75%)#2 | 164,406(0.45%)#14 |
| 15. | Sterling Heights | 686 | 8,563(8.01%)#1 | 164,406(0.42%)#15 |
| 16. | Peoria | 672 | 5,792(11.60%)#3 | 164,406(0.41%)#16 |
| 17. | Skokie | 592 | 14,736(4.02%)#2 | 164,406(0.36%)#17 |
| 18. | Fullerton | 571 | 23,058(2.48%)#4 | 164,406(0.35%)#18 |
| 19. | San Jose | 549 | 23,058(2.38%)#5 | 164,406(0.33%)#19 |
| 20. | Austin | 548 | 6,849(8.00%)#2 | 164,406(0.33%)#20 |
| 21. | Vancouver | 546 | 7,568(7.21%)#3 | 164,406(0.33%)#21 |
| 22. | Niles | 541 | 14,736(3.67%)#3 | 164,406(0.33%)#22 |
| 23. | Kirkland | 526 | 7,568(6.95%)#4 | 164,406(0.32%)#23 |
| 24. | Cleveland | 519 | 6,346(8.18%)#1 | 164,406(0.32%)#24 |
| 25. | Henderson | 495 | 2,686(18.43%)#1 | 164,406(0.30%)#25 |
| 26. | Parma | 483 | 6,346(7.61%)#2 | 164,406(0.29%)#26 |
| 27. | Morton Grove | 472 | 14,736(3.20%)#4 | 164,406(0.29%)#27 |
| 28. | Reno | 469 | 2,686(17.46%)#2 | 164,406(0.29%)#28 |
| 29. | Jacksonville | 454 | 14,943(3.04%)#3 | 164,406(0.28%)#29 |
| 30. | Boston | 453 | 3,351(13.52%)#1 | 164,406(0.28%)#30 |
| 31. | Las Vegas | 442 | 2,686(16.46%)#3 | 164,406(0.27%)#31 |
| 32. | San Francisco | 438 | 23,058(1.90%)#6 | 164,406(0.27%)#32 |
| 33. | Charlotte | 431 | 3,093(13.93%)#1 | 164,406(0.26%)#33 |
| 34. | Redmond | 428 | 7,568(5.66%)#5 | 164,406(0.26%)#34 |
| 35. | Sacramento | 404 | 23,058(1.75%)#7 | 164,406(0.25%)#35 |
| 36. | Mount Prospect | 401 | 14,736(2.72%)#5 | 164,406(0.24%)#36 |
| 37. | Sammamish | 393 | 7,568(5.19%)#6 | 164,406(0.24%)#37 |
| 38. | Des Plaines | 385 | 14,736(2.61%)#6 | 164,406(0.23%)#38 |
| 39. | North Highlands | 366 | 23,058(1.59%)#8 | 164,406(0.22%)#39 |
| 40. | Washington | 361 | 361(100.00%)#1 | 164,406(0.22%)#40 |
| 41. | San Antonio | 357 | 6,849(5.21%)#3 | 164,406(0.22%)#41 |
| 42. | Franklin Town | 356 | 3,351(10.62%)#2 | 164,406(0.22%)#42 |
| 43. | Mckinney | 350 | 6,849(5.11%)#4 | 164,406(0.21%)#43 |
| 44. | Livonia | 350 | 8,563(4.09%)#2 | 164,406(0.21%)#44 |
| 45. | Troy | 350 | 8,563(4.09%)#3 | 164,406(0.21%)#45 |
| 46. | Davie | 347 | 14,943(2.32%)#4 | 164,406(0.21%)#46 |
| 47. | Indianapolis | 346 | 1,537(22.51%)#1 | 164,406(0.21%)#47 |
| 48. | Scottsdale | 341 | 5,792(5.89%)#4 | 164,406(0.21%)#48 |
| 49. | Roseville | 341 | 23,058(1.48%)#9 | 164,406(0.21%)#49 |
| 50. | Spring Valley | 339 | 2,686(12.62%)#4 | 164,406(0.21%)#50 |
| 51. | Rochester Hills | 339 | 8,563(3.96%)#4 | 164,406(0.21%)#51 |
| 52. | Irvine | 330 | 23,058(1.43%)#10 | 164,406(0.20%)#52 |
| 53. | Raleigh | 327 | 3,093(10.57%)#2 | 164,406(0.20%)#53 |
| 54. | Lincolnwood | 326 | 14,736(2.21%)#7 | 164,406(0.20%)#54 |
| 55. | Yonkers | 322 | 19,252(1.67%)#2 | 164,406(0.20%)#55 |
| 56. | Farmington Hills | 321 | 8,563(3.75%)#5 | 164,406(0.20%)#56 |
| 57. | Strongsville | 318 | 6,346(5.01%)#3 | 164,406(0.19%)#57 |
| 58. | Dania Beach | 311 | 14,943(2.08%)#5 | 164,406(0.19%)#58 |
| 59. | Sandy Springs | 309 | 6,388(4.84%)#1 | 164,406(0.19%)#59 |
| 60. | Mission Viejo | 309 | 23,058(1.34%)#11 | 164,406(0.19%)#60 |
| 61. | Dallas | 307 | 6,849(4.48%)#5 | 164,406(0.19%)#61 |
| 62. | Ann Arbor | 306 | 8,563(3.57%)#6 | 164,406(0.19%)#62 |
| 63. | Aventura | 306 | 14,943(2.05%)#6 | 164,406(0.19%)#63 |
| 64. | Arlington Heights | 304 | 14,736(2.06%)#8 | 164,406(0.18%)#64 |
| 65. | Huntington Beach | 302 | 23,058(1.31%)#12 | 164,406(0.18%)#65 |
| 66. | Boca Raton | 290 | 14,943(1.94%)#7 | 164,406(0.18%)#66 |
| 67. | Columbus | 283 | 6,346(4.46%)#4 | 164,406(0.17%)#67 |
| 68. | Citrus Heights | 283 | 23,058(1.23%)#13 | 164,406(0.17%)#68 |
| 69. | Fort Lauderdale | 282 | 14,943(1.89%)#8 | 164,406(0.17%)#69 |
| 70. | Surprise | 280 | 5,792(4.83%)#5 | 164,406(0.17%)#70 |
| 71. | Cincinnati | 270 | 6,346(4.25%)#5 | 164,406(0.16%)#71 |
| 72. | Antelope | 267 | 23,058(1.16%)#14 | 164,406(0.16%)#72 |
| 73. | Denver | 265 | 1,615(16.41%)#1 | 164,406(0.16%)#73 |
| 74. | Miami Beach | 262 | 14,943(1.75%)#9 | 164,406(0.16%)#74 |
| 75. | Gresham | 256 | 4,043(6.33%)#2 | 164,406(0.16%)#75 |
| 76. | Cuyahoga Falls | 256 | 6,346(4.03%)#6 | 164,406(0.16%)#76 |
| 77. | Arlington | 255 | 2,805(9.09%)#1 | 164,406(0.16%)#77 |
| 78. | North Olmsted | 254 | 6,346(4.00%)#7 | 164,406(0.15%)#78 |
| 79. | Seven Hills | 251 | 6,346(3.96%)#8 | 164,406(0.15%)#79 |
| 80. | Cheektowaga | 248 | 19,252(1.29%)#3 | 164,406(0.15%)#80 |
| 81. | Glenview | 246 | 14,736(1.67%)#9 | 164,406(0.15%)#81 |
| 82. | Paradise | 240 | 2,686(8.94%)#5 | 164,406(0.15%)#82 |
| 83. | Bridgeport | 240 | 2,255(10.64%)#1 | 164,406(0.15%)#83 |
| 84. | Bothell | 240 | 7,568(3.17%)#7 | 164,406(0.15%)#84 |
| 85. | Allen | 234 | 6,849(3.42%)#6 | 164,406(0.14%)#85 |
| 86. | Schaumburg | 232 | 14,736(1.57%)#10 | 164,406(0.14%)#86 |
| 87. | Hendersonville | 232 | 1,593(14.56%)#1 | 164,406(0.14%)#87 |
| 88. | Trexlertown | 228 | 5,598(4.07%)#2 | 164,406(0.14%)#88 |
| 89. | Riverside | 227 | 23,058(0.98%)#15 | 164,406(0.14%)#89 |
| 90. | Corona | 227 | 23,058(0.98%)#16 | 164,406(0.14%)#90 |
| 91. | Placentia | 227 | 23,058(0.98%)#17 | 164,406(0.14%)#91 |
| 92. | Albuquerque | 221 | 383(57.70%)#1 | 164,406(0.13%)#92 |
| 93. | Mesa | 221 | 5,792(3.82%)#6 | 164,406(0.13%)#93 |
| 94. | Rocklin | 219 | 23,058(0.95%)#18 | 164,406(0.13%)#94 |
| 95. | Naperville | 218 | 14,736(1.48%)#11 | 164,406(0.13%)#95 |
| 96. | Jersey City | 216 | 6,033(3.58%)#1 | 164,406(0.13%)#96 |
| 97. | Bolingbrook | 213 | 14,736(1.45%)#12 | 164,406(0.13%)#97 |
| 98. | Dearborn Heights | 213 | 8,563(2.49%)#7 | 164,406(0.13%)#98 |
| 99. | Atascocita | 211 | 6,849(3.08%)#7 | 164,406(0.13%)#99 |
| 100. | Sunnyvale | 207 | 23,058(0.90%)#19 | 164,406(0.13%)#100 |
Common Questions
What are the Top 10 Cities with the Most Immigrants from Romania in the United States?
Top 10 Cities with the Most Immigrants from Romania in the United States are:
What city has the Most Immigrants from Romania in the United States?
New York has the Most Immigrants from Romania in the United States with 12,802.
What is the Total Immigrants from Romania in the United States?
Total Immigrants from Romania in the United States is 164,406.