Richland County, SC Map & Demographics
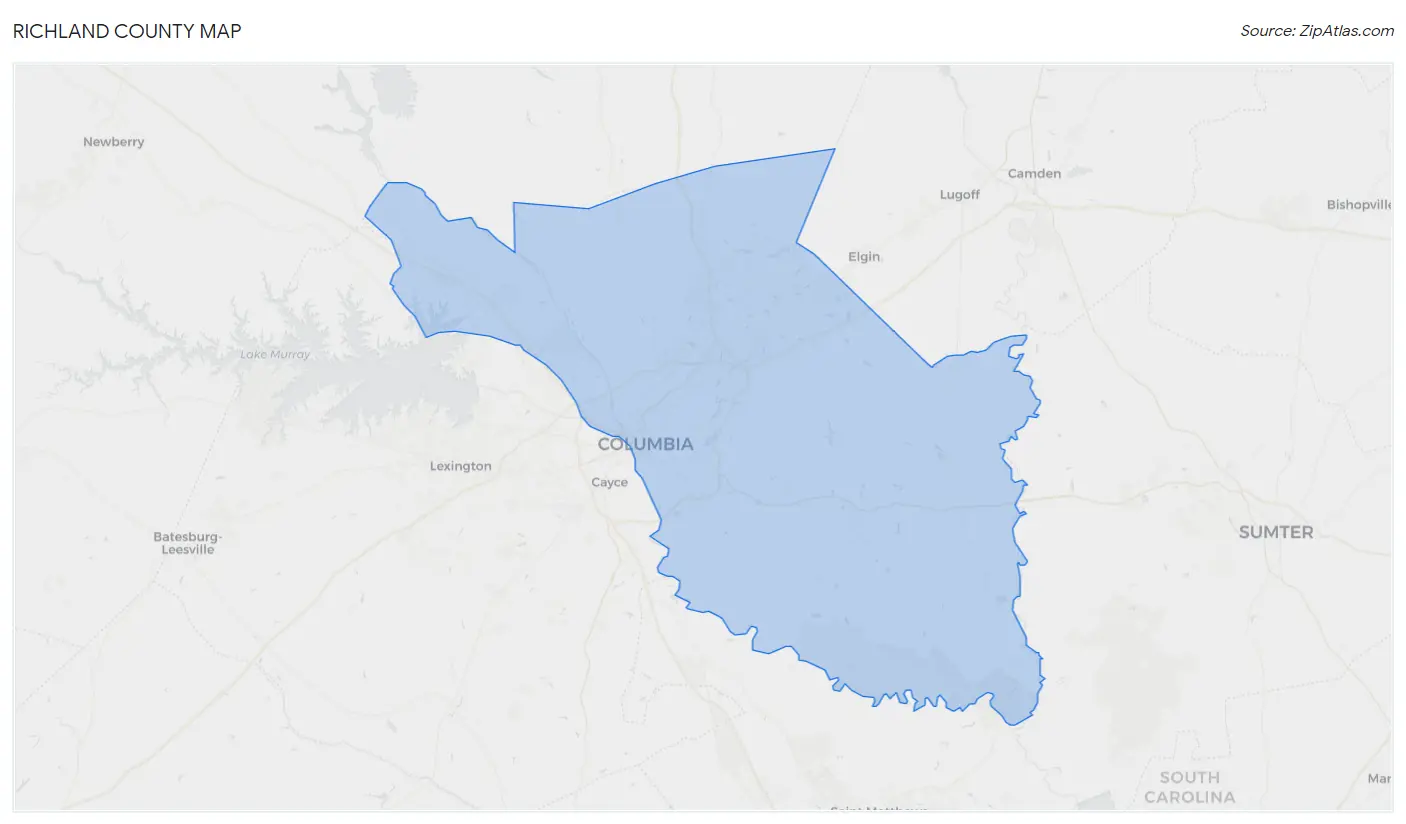
Richland County Map
Richland County Overview
$35,720
PER CAPITA INCOME
$81,801
AVG FAMILY INCOME
$59,850
AVG HOUSEHOLD INCOME
17.0%
WAGE / INCOME GAP [ % ]
83.0¢/ $1
WAGE / INCOME GAP [ $ ]
$12,293
FAMILY INCOME DEFICIT
0.49
INEQUALITY / GINI INDEX
416,161
TOTAL POPULATION
200,680
MALE POPULATION
215,481
FEMALE POPULATION
93.13
MALES / 100 FEMALES
107.38
FEMALES / 100 MALES
33.9
MEDIAN AGE
3.1
AVG FAMILY SIZE
2.4
AVG HOUSEHOLD SIZE
221,068
LABOR FORCE [ PEOPLE ]
65.5%
PERCENT IN LABOR FORCE
6.8%
UNEMPLOYMENT RATE
Richland County Area Codes
Income in Richland County
Income Overview in Richland County
Per Capita Income in Richland County is $35,720, while median incomes of families and households are $81,801 and $59,850 respectively.
| Characteristic | Number | Measure |
| Per Capita Income | 416,161 | $35,720 |
| Median Family Income | 95,593 | $81,801 |
| Mean Family Income | 95,593 | $109,620 |
| Median Household Income | 162,726 | $59,850 |
| Mean Household Income | 162,726 | $86,621 |
| Income Deficit | 95,593 | $12,293 |
| Wage / Income Gap (%) | 416,161 | 17.05% |
| Wage / Income Gap ($) | 416,161 | 82.95¢ per $1 |
| Gini / Inequality Index | 416,161 | 0.49 |
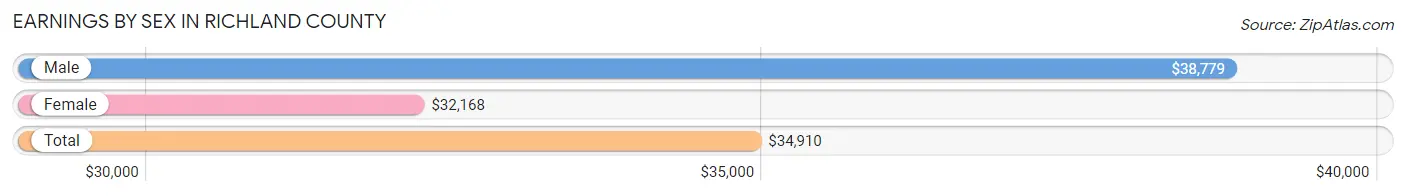
Earnings by Sex in Richland County
Average Earnings in Richland County are $34,910, $38,779 for men and $32,168 for women, a difference of 17.1%.
| Sex | Number | Average Earnings |
| Male | 114,137 (49.1%) | $38,779 |
| Female | 118,357 (50.9%) | $32,168 |
| Total | 232,494 (100.0%) | $34,910 |
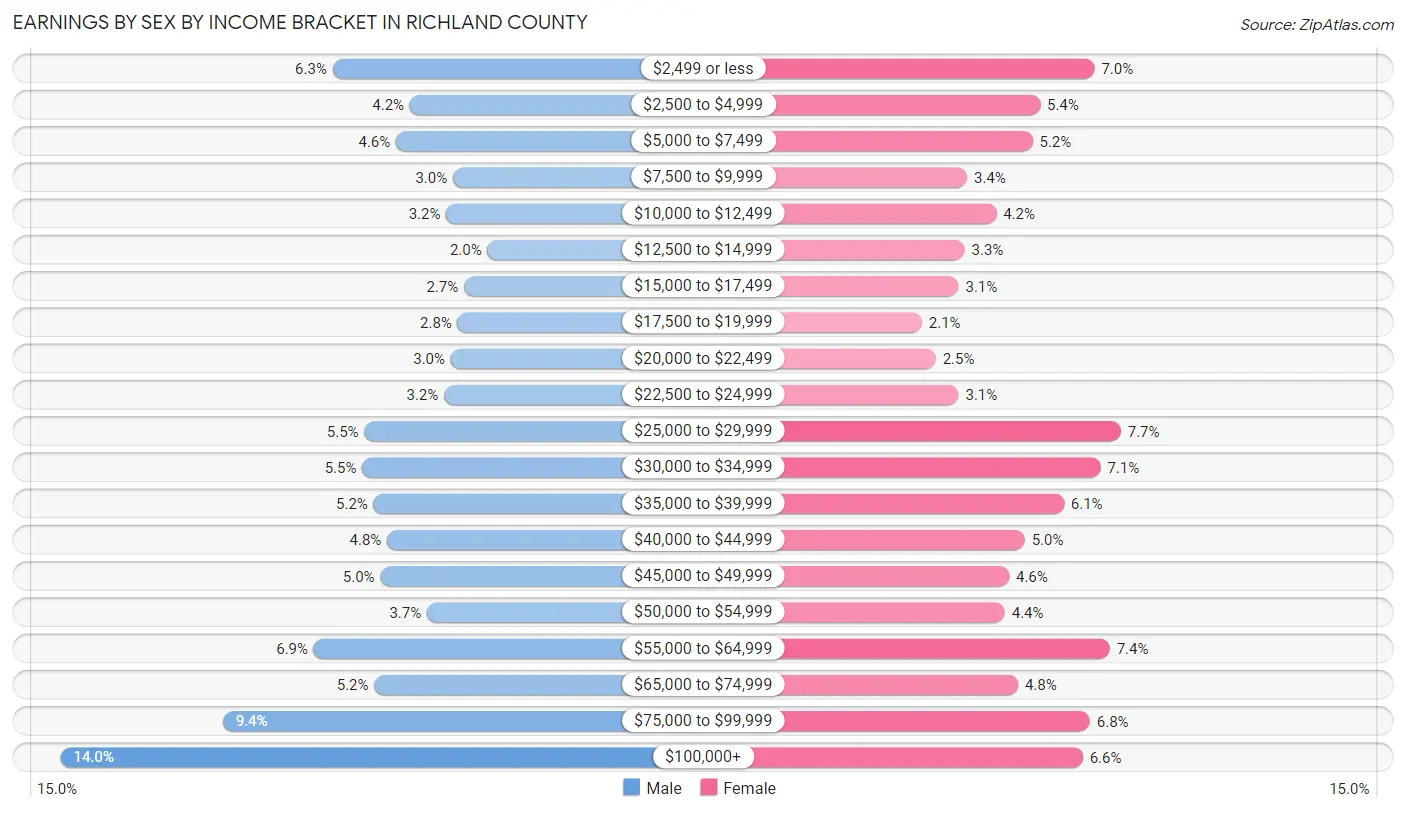
Earnings by Sex by Income Bracket in Richland County
The most common earnings brackets in Richland County are $100,000+ for men (15,966 | 14.0%) and $25,000 to $29,999 for women (9,119 | 7.7%).
| Income | Male | Female |
| $2,499 or less | 7,236 (6.3%) | 8,235 (7.0%) |
| $2,500 to $4,999 | 4,763 (4.2%) | 6,432 (5.4%) |
| $5,000 to $7,499 | 5,210 (4.6%) | 6,178 (5.2%) |
| $7,500 to $9,999 | 3,384 (3.0%) | 4,002 (3.4%) |
| $10,000 to $12,499 | 3,601 (3.2%) | 4,970 (4.2%) |
| $12,500 to $14,999 | 2,273 (2.0%) | 3,921 (3.3%) |
| $15,000 to $17,499 | 3,026 (2.6%) | 3,719 (3.1%) |
| $17,500 to $19,999 | 3,225 (2.8%) | 2,500 (2.1%) |
| $20,000 to $22,499 | 3,444 (3.0%) | 2,962 (2.5%) |
| $22,500 to $24,999 | 3,661 (3.2%) | 3,720 (3.1%) |
| $25,000 to $29,999 | 6,226 (5.4%) | 9,119 (7.7%) |
| $30,000 to $34,999 | 6,288 (5.5%) | 8,439 (7.1%) |
| $35,000 to $39,999 | 5,923 (5.2%) | 7,214 (6.1%) |
| $40,000 to $44,999 | 5,487 (4.8%) | 5,922 (5.0%) |
| $45,000 to $49,999 | 5,711 (5.0%) | 5,401 (4.6%) |
| $50,000 to $54,999 | 4,208 (3.7%) | 5,255 (4.4%) |
| $55,000 to $64,999 | 7,841 (6.9%) | 8,741 (7.4%) |
| $65,000 to $74,999 | 5,906 (5.2%) | 5,696 (4.8%) |
| $75,000 to $99,999 | 10,758 (9.4%) | 8,086 (6.8%) |
| $100,000+ | 15,966 (14.0%) | 7,845 (6.6%) |
| Total | 114,137 (100.0%) | 118,357 (100.0%) |
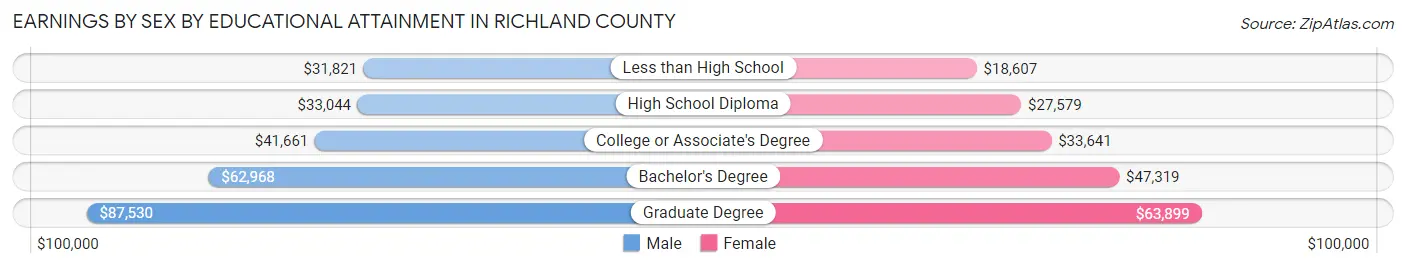
Earnings by Sex by Educational Attainment in Richland County
Average earnings in Richland County are $49,396 for men and $39,879 for women, a difference of 19.3%. Men with an educational attainment of graduate degree enjoy the highest average annual earnings of $87,530, while those with less than high school education earn the least with $31,821. Women with an educational attainment of graduate degree earn the most with the average annual earnings of $63,899, while those with less than high school education have the smallest earnings of $18,607.
| Educational Attainment | Male Income | Female Income |
| Less than High School | $31,821 | $18,607 |
| High School Diploma | $33,044 | $27,579 |
| College or Associate's Degree | $41,661 | $33,641 |
| Bachelor's Degree | $62,968 | $47,319 |
| Graduate Degree | $87,530 | $63,899 |
| Total | $49,396 | $39,879 |
Family Income in Richland County
Family Income Brackets in Richland County
According to the Richland County family income data, there are 17,302 families falling into the $100,000 to $149,999 income range, which is the most common income bracket and makes up 18.1% of all families. Conversely, the $10,000 to $14,999 income bracket is the least frequent group with only 2,007 families (2.1%) belonging to this category.
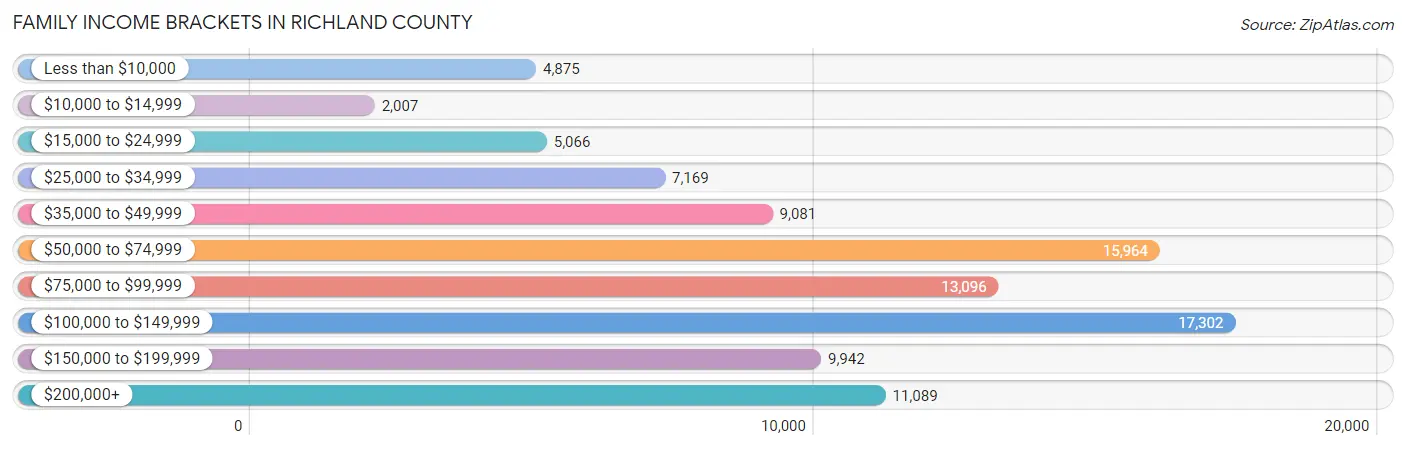
| Income Bracket | # Families | % Families |
| Less than $10,000 | 4,875 | 5.1% |
| $10,000 to $14,999 | 2,007 | 2.1% |
| $15,000 to $24,999 | 5,066 | 5.3% |
| $25,000 to $34,999 | 7,169 | 7.5% |
| $35,000 to $49,999 | 9,081 | 9.5% |
| $50,000 to $74,999 | 15,964 | 16.7% |
| $75,000 to $99,999 | 13,096 | 13.7% |
| $100,000 to $149,999 | 17,302 | 18.1% |
| $150,000 to $199,999 | 9,942 | 10.4% |
| $200,000+ | 11,089 | 11.6% |
Family Income by Famaliy Size in Richland County
4-person families (16,363 | 17.1%) account for the highest median family income in Richland County with $96,292 per family, while 2-person families (45,907 | 48.0%) have the highest median income of $37,316 per family member.
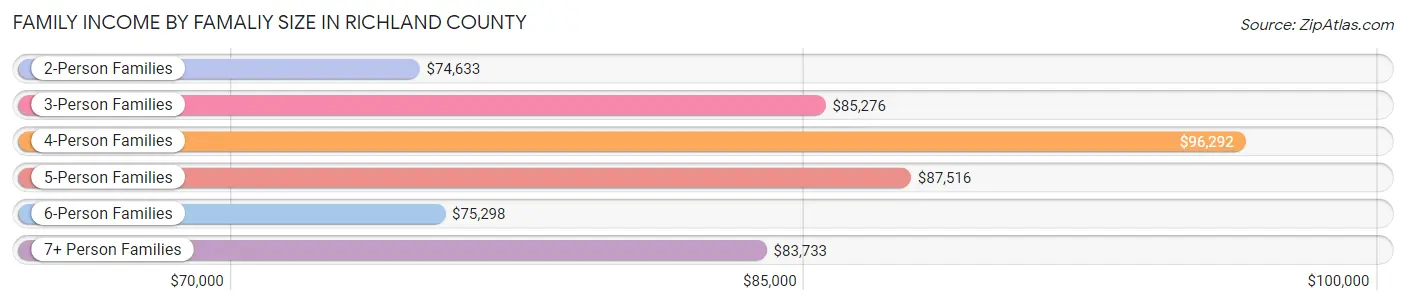
| Income Bracket | # Families | Median Income |
| 2-Person Families | 45,907 (48.0%) | $74,633 |
| 3-Person Families | 22,591 (23.6%) | $85,276 |
| 4-Person Families | 16,363 (17.1%) | $96,292 |
| 5-Person Families | 7,314 (7.6%) | $87,516 |
| 6-Person Families | 2,180 (2.3%) | $75,298 |
| 7+ Person Families | 1,238 (1.3%) | $83,733 |
| Total | 95,593 (100.0%) | $81,801 |
Family Income by Number of Earners in Richland County
The median family income in Richland County is $81,801, with families comprising 3+ earners (8,243) having the highest median family income of $144,158, while families with no earners (12,705) have the lowest median family income of $47,043, accounting for 8.6% and 13.3% of families, respectively.
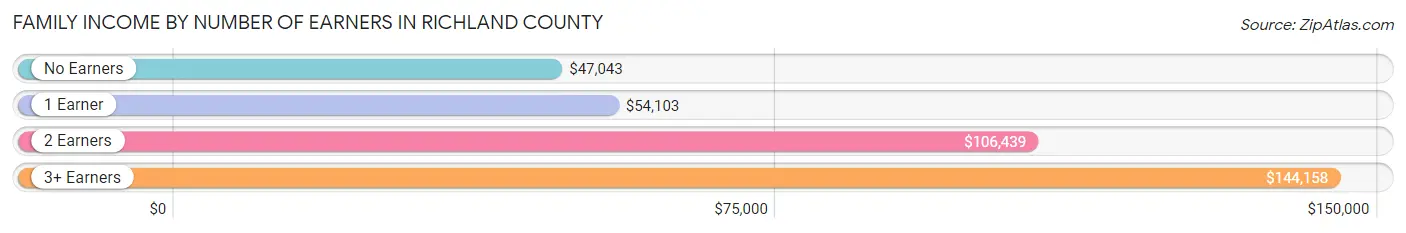
| Number of Earners | # Families | Median Income |
| No Earners | 12,705 (13.3%) | $47,043 |
| 1 Earner | 34,489 (36.1%) | $54,103 |
| 2 Earners | 40,156 (42.0%) | $106,439 |
| 3+ Earners | 8,243 (8.6%) | $144,158 |
| Total | 95,593 (100.0%) | $81,801 |
Household Income in Richland County
Household Income Brackets in Richland County
With 28,965 households falling in the category, the $50,000 to $74,999 income range is the most frequent in Richland County, accounting for 17.8% of all households. In contrast, only 6,509 households (4.0%) fall into the $10,000 to $14,999 income bracket, making it the least populous group.

| Income Bracket | # Households | % Households |
| Less than $10,000 | 13,344 | 8.2% |
| $10,000 to $14,999 | 6,509 | 4.0% |
| $15,000 to $24,999 | 12,367 | 7.6% |
| $25,000 to $34,999 | 14,808 | 9.1% |
| $35,000 to $49,999 | 20,829 | 12.8% |
| $50,000 to $74,999 | 28,965 | 17.8% |
| $75,000 to $99,999 | 20,178 | 12.4% |
| $100,000 to $149,999 | 22,131 | 13.6% |
| $150,000 to $199,999 | 11,391 | 7.0% |
| $200,000+ | 12,367 | 7.6% |
Household Income by Householder Age in Richland County
The median household income in Richland County is $59,850, with the highest median household income of $77,246 found in the 45 to 64 years age bracket for the primary householder. A total of 56,324 households (34.6%) fall into this category. Meanwhile, the 15 to 24 years age bracket for the primary householder has the lowest median household income of $24,222, with 12,199 households (7.5%) in this group.
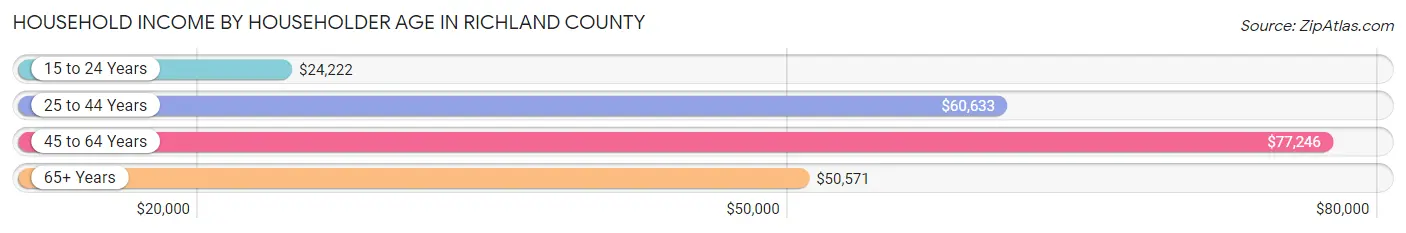
| Income Bracket | # Households | Median Income |
| 15 to 24 Years | 12,199 (7.5%) | $24,222 |
| 25 to 44 Years | 57,321 (35.2%) | $60,633 |
| 45 to 64 Years | 56,324 (34.6%) | $77,246 |
| 65+ Years | 36,882 (22.7%) | $50,571 |
| Total | 162,726 (100.0%) | $59,850 |
Poverty in Richland County
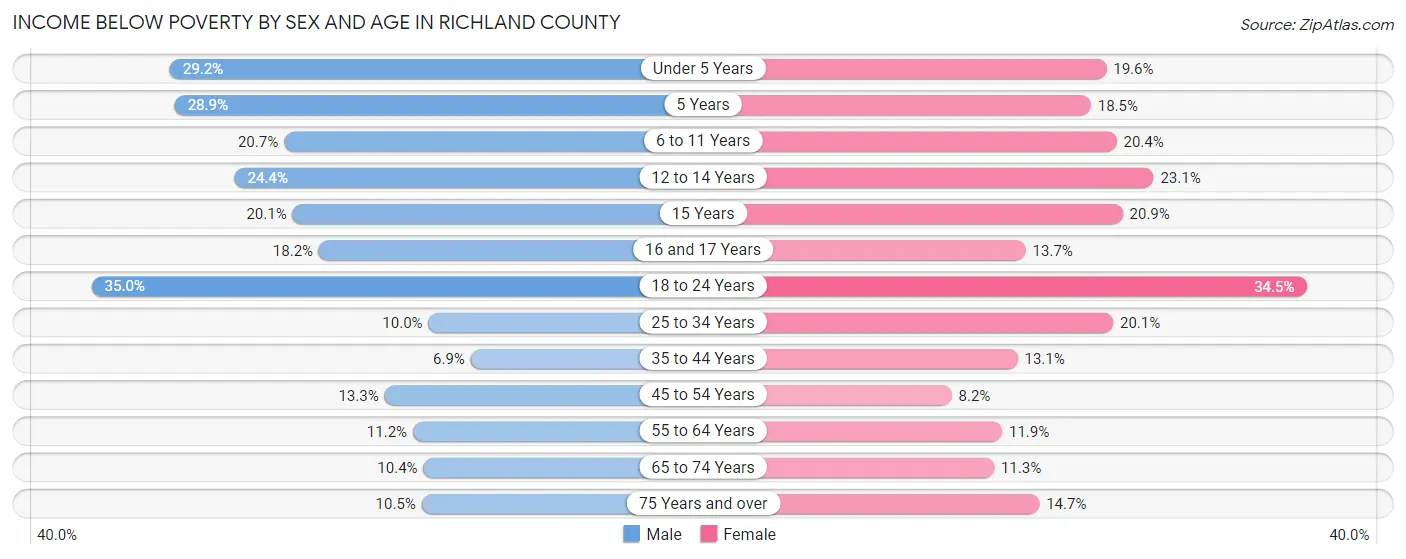
Income Below Poverty by Sex and Age in Richland County
With 16.6% poverty level for males and 17.1% for females among the residents of Richland County, 18 to 24 year old males and 18 to 24 year old females are the most vulnerable to poverty, with 7,884 males (35.0%) and 7,681 females (34.5%) in their respective age groups living below the poverty level.
| Age Bracket | Male | Female |
| Under 5 Years | 3,462 (29.2%) | 2,231 (19.6%) |
| 5 Years | 482 (28.8%) | 369 (18.5%) |
| 6 to 11 Years | 3,092 (20.7%) | 2,956 (20.4%) |
| 12 to 14 Years | 2,021 (24.4%) | 1,766 (23.1%) |
| 15 Years | 491 (20.1%) | 558 (20.8%) |
| 16 and 17 Years | 953 (18.1%) | 674 (13.7%) |
| 18 to 24 Years | 7,884 (35.0%) | 7,681 (34.5%) |
| 25 to 34 Years | 2,710 (10.0%) | 6,080 (20.1%) |
| 35 to 44 Years | 1,611 (6.9%) | 3,490 (13.1%) |
| 45 to 54 Years | 2,906 (13.3%) | 2,019 (8.2%) |
| 55 to 64 Years | 2,422 (11.2%) | 3,005 (11.9%) |
| 65 to 74 Years | 1,582 (10.4%) | 2,164 (11.3%) |
| 75 Years and over | 808 (10.5%) | 1,798 (14.7%) |
| Total | 30,424 (16.6%) | 34,791 (17.1%) |
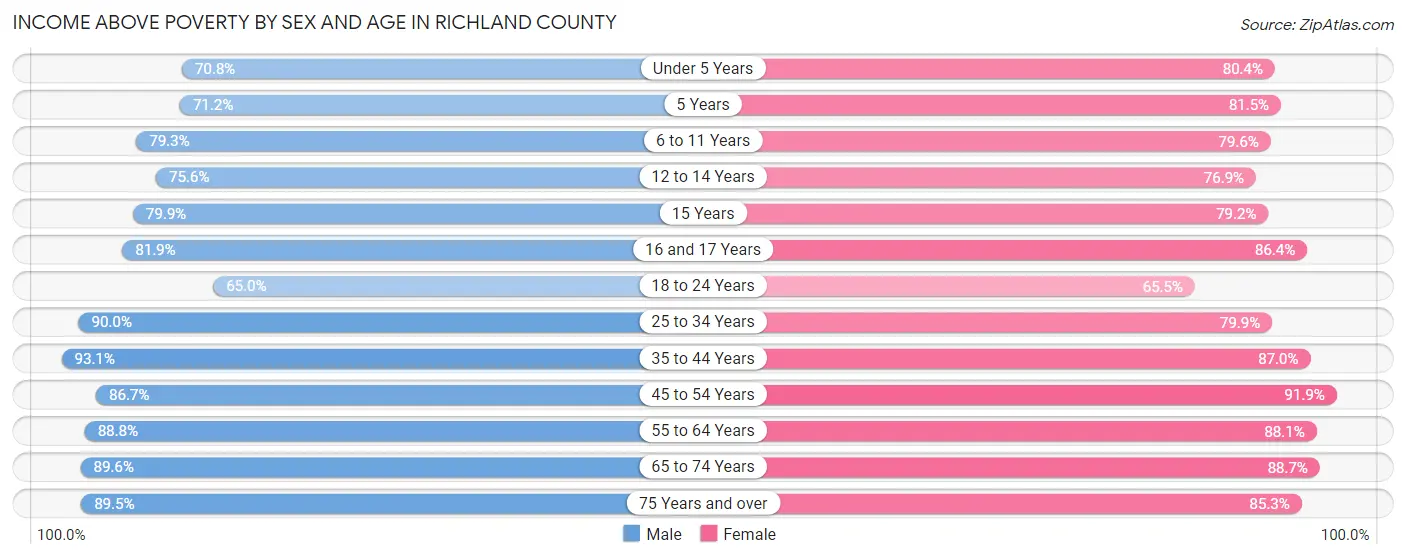
Income Above Poverty by Sex and Age in Richland County
According to the poverty statistics in Richland County, males aged 35 to 44 years and females aged 45 to 54 years are the age groups that are most secure financially, with 93.1% of males and 91.8% of females in these age groups living above the poverty line.
| Age Bracket | Male | Female |
| Under 5 Years | 8,389 (70.8%) | 9,126 (80.4%) |
| 5 Years | 1,189 (71.2%) | 1,627 (81.5%) |
| 6 to 11 Years | 11,814 (79.3%) | 11,533 (79.6%) |
| 12 to 14 Years | 6,258 (75.6%) | 5,866 (76.9%) |
| 15 Years | 1,951 (79.9%) | 2,118 (79.1%) |
| 16 and 17 Years | 4,298 (81.9%) | 4,262 (86.4%) |
| 18 to 24 Years | 14,632 (65.0%) | 14,593 (65.5%) |
| 25 to 34 Years | 24,329 (90.0%) | 24,116 (79.9%) |
| 35 to 44 Years | 21,800 (93.1%) | 23,251 (87.0%) |
| 45 to 54 Years | 18,971 (86.7%) | 22,754 (91.8%) |
| 55 to 64 Years | 19,258 (88.8%) | 22,246 (88.1%) |
| 65 to 74 Years | 13,647 (89.6%) | 16,984 (88.7%) |
| 75 Years and over | 6,871 (89.5%) | 10,466 (85.3%) |
| Total | 153,407 (83.5%) | 168,942 (82.9%) |
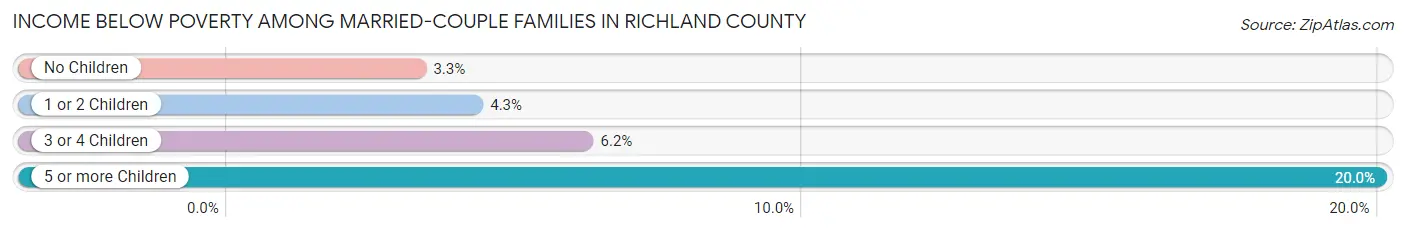
Income Below Poverty Among Married-Couple Families in Richland County
The poverty statistics for married-couple families in Richland County show that 3.9% or 2,404 of the total 61,426 families live below the poverty line. Families with 5 or more children have the highest poverty rate of 20.0%, comprising of 54 families. On the other hand, families with no children have the lowest poverty rate of 3.3%, which includes 1,178 families.
| Children | Above Poverty | Below Poverty |
| No Children | 34,754 (96.7%) | 1,178 (3.3%) |
| 1 or 2 Children | 19,402 (95.7%) | 865 (4.3%) |
| 3 or 4 Children | 4,650 (93.8%) | 307 (6.2%) |
| 5 or more Children | 216 (80.0%) | 54 (20.0%) |
| Total | 59,022 (96.1%) | 2,404 (3.9%) |
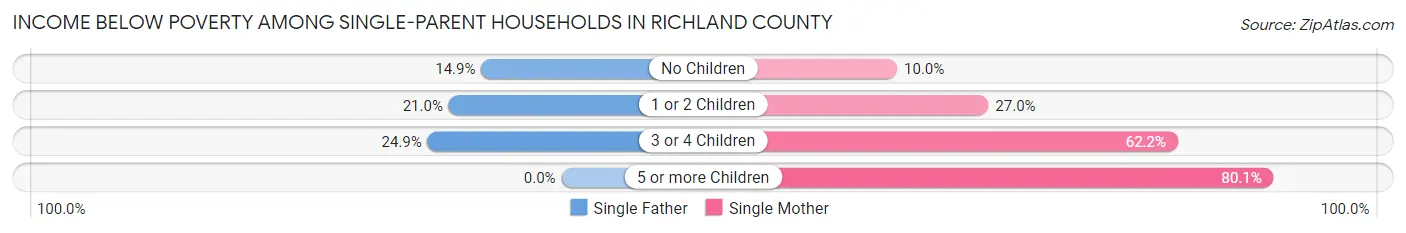
Income Below Poverty Among Single-Parent Households in Richland County
According to the poverty data in Richland County, 18.1% or 1,214 single-father households and 26.9% or 7,375 single-mother households are living below the poverty line. Among single-father households, those with 3 or 4 children have the highest poverty rate, with 105 households (24.9%) experiencing poverty. Likewise, among single-mother households, those with 5 or more children have the highest poverty rate, with 410 households (80.1%) falling below the poverty line.
| Children | Single Father | Single Mother |
| No Children | 502 (14.9%) | 885 (10.0%) |
| 1 or 2 Children | 607 (21.0%) | 3,948 (27.0%) |
| 3 or 4 Children | 105 (24.9%) | 2,132 (62.2%) |
| 5 or more Children | 0 (0.0%) | 410 (80.1%) |
| Total | 1,214 (18.1%) | 7,375 (26.9%) |
Income Below Poverty Among Married-Couple vs Single-Parent Households in Richland County
The poverty data for Richland County shows that 2,404 of the married-couple family households (3.9%) and 8,589 of the single-parent households (25.1%) are living below the poverty level. Within the married-couple family households, those with 5 or more children have the highest poverty rate, with 54 households (20.0%) falling below the poverty line. Among the single-parent households, those with 5 or more children have the highest poverty rate, with 410 household (76.9%) living below poverty.
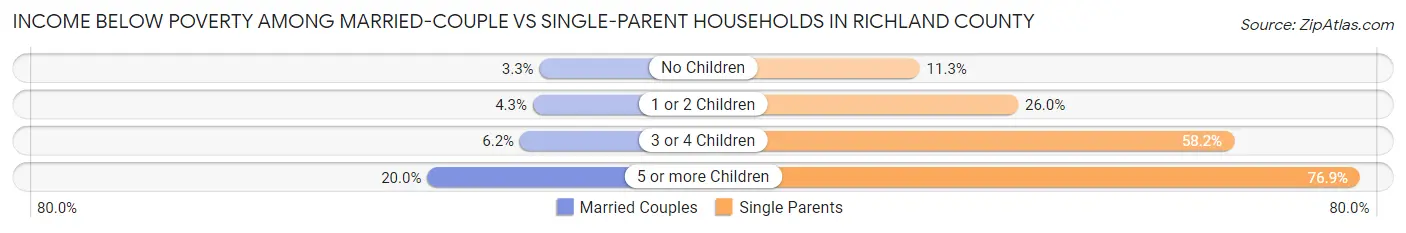
| Children | Married-Couple Families | Single-Parent Households |
| No Children | 1,178 (3.3%) | 1,387 (11.3%) |
| 1 or 2 Children | 865 (4.3%) | 4,555 (26.0%) |
| 3 or 4 Children | 307 (6.2%) | 2,237 (58.2%) |
| 5 or more Children | 54 (20.0%) | 410 (76.9%) |
| Total | 2,404 (3.9%) | 8,589 (25.1%) |
Race in Richland County
The most populous races in Richland County are Black / African American (196,789 | 47.3%), White / Caucasian (176,478 | 42.4%), and Hispanic or Latino (22,616 | 5.4%).
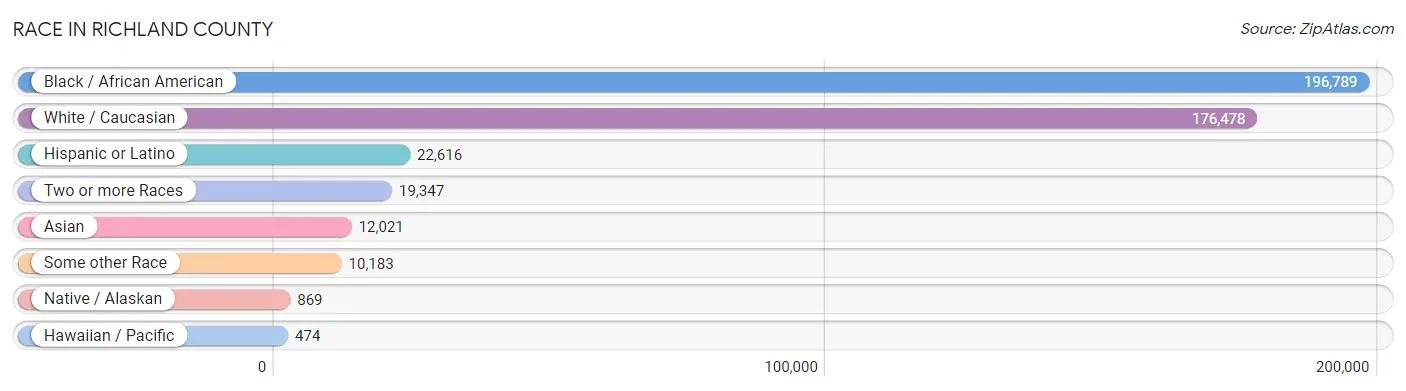
| Race | # Population | % Population |
| Asian | 12,021 | 2.9% |
| Black / African American | 196,789 | 47.3% |
| Hawaiian / Pacific | 474 | 0.1% |
| Hispanic or Latino | 22,616 | 5.4% |
| Native / Alaskan | 869 | 0.2% |
| White / Caucasian | 176,478 | 42.4% |
| Two or more Races | 19,347 | 4.6% |
| Some other Race | 10,183 | 2.5% |
| Total | 416,161 | 100.0% |
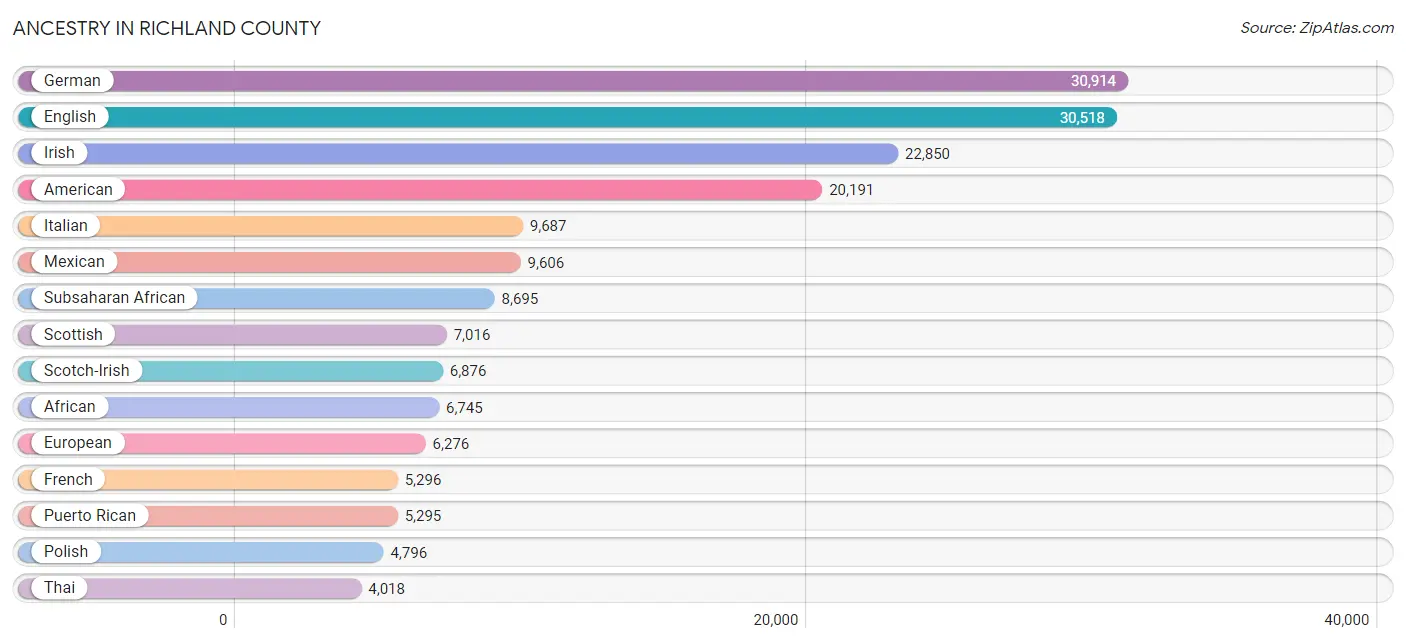
Ancestry in Richland County
The most populous ancestries reported in Richland County are German (30,914 | 7.4%), English (30,518 | 7.3%), Irish (22,850 | 5.5%), American (20,191 | 4.9%), and Italian (9,687 | 2.3%), together accounting for 27.4% of all Richland County residents.
| Ancestry | # Population | % Population |
| African | 6,745 | 1.6% |
| Albanian | 29 | 0.0% |
| American | 20,191 | 4.9% |
| Apache | 24 | 0.0% |
| Arab | 2,269 | 0.5% |
| Argentinean | 57 | 0.0% |
| Armenian | 333 | 0.1% |
| Assyrian / Chaldean / Syriac | 1 | 0.0% |
| Australian | 32 | 0.0% |
| Austrian | 171 | 0.0% |
| Bahamian | 144 | 0.0% |
| Bangladeshi | 125 | 0.0% |
| Barbadian | 49 | 0.0% |
| Basque | 63 | 0.0% |
| Belgian | 115 | 0.0% |
| Belizean | 32 | 0.0% |
| Bhutanese | 897 | 0.2% |
| Blackfeet | 192 | 0.1% |
| Bolivian | 43 | 0.0% |
| Brazilian | 49 | 0.0% |
| British | 1,772 | 0.4% |
| British West Indian | 378 | 0.1% |
| Bulgarian | 15 | 0.0% |
| Burmese | 2,020 | 0.5% |
| Cajun | 40 | 0.0% |
| Cambodian | 13 | 0.0% |
| Canadian | 505 | 0.1% |
| Cape Verdean | 77 | 0.0% |
| Celtic | 106 | 0.0% |
| Central American | 2,555 | 0.6% |
| Central American Indian | 182 | 0.0% |
| Cherokee | 1,303 | 0.3% |
| Chickasaw | 16 | 0.0% |
| Chilean | 39 | 0.0% |
| Chippewa | 30 | 0.0% |
| Choctaw | 99 | 0.0% |
| Colombian | 871 | 0.2% |
| Costa Rican | 152 | 0.0% |
| Creek | 10 | 0.0% |
| Croatian | 233 | 0.1% |
| Cuban | 633 | 0.2% |
| Czech | 841 | 0.2% |
| Czechoslovakian | 145 | 0.0% |
| Danish | 517 | 0.1% |
| Dominican | 664 | 0.2% |
| Dutch | 1,548 | 0.4% |
| Eastern European | 634 | 0.2% |
| Ecuadorian | 189 | 0.1% |
| Egyptian | 66 | 0.0% |
| English | 30,518 | 7.3% |
| Ethiopian | 56 | 0.0% |
| European | 6,276 | 1.5% |
| Filipino | 156 | 0.0% |
| Finnish | 399 | 0.1% |
| French | 5,296 | 1.3% |
| French American Indian | 47 | 0.0% |
| French Canadian | 807 | 0.2% |
| German | 30,914 | 7.4% |
| Ghanaian | 271 | 0.1% |
| Greek | 846 | 0.2% |
| Guamanian / Chamorro | 626 | 0.2% |
| Guatemalan | 343 | 0.1% |
| Guyanese | 46 | 0.0% |
| Haitian | 309 | 0.1% |
| Honduran | 1,168 | 0.3% |
| Hungarian | 530 | 0.1% |
| Indian (Asian) | 2,794 | 0.7% |
| Indonesian | 337 | 0.1% |
| Iranian | 442 | 0.1% |
| Iraqi | 224 | 0.1% |
| Irish | 22,850 | 5.5% |
| Israeli | 38 | 0.0% |
| Italian | 9,687 | 2.3% |
| Jamaican | 2,279 | 0.5% |
| Japanese | 76 | 0.0% |
| Kenyan | 165 | 0.0% |
| Kiowa | 6 | 0.0% |
| Korean | 2,797 | 0.7% |
| Laotian | 289 | 0.1% |
| Latvian | 54 | 0.0% |
| Lebanese | 614 | 0.2% |
| Lithuanian | 275 | 0.1% |
| Lumbee | 378 | 0.1% |
| Luxembourger | 38 | 0.0% |
| Malaysian | 133 | 0.0% |
| Maltese | 13 | 0.0% |
| Mexican | 9,606 | 2.3% |
| Mexican American Indian | 194 | 0.1% |
| Moroccan | 330 | 0.1% |
| Native Hawaiian | 701 | 0.2% |
| Navajo | 36 | 0.0% |
| Nicaraguan | 267 | 0.1% |
| Nigerian | 592 | 0.1% |
| Northern European | 738 | 0.2% |
| Norwegian | 1,353 | 0.3% |
| Ottawa | 8 | 0.0% |
| Pakistani | 107 | 0.0% |
| Palestinian | 102 | 0.0% |
| Panamanian | 357 | 0.1% |
| Pennsylvania German | 82 | 0.0% |
| Peruvian | 220 | 0.1% |
| Polish | 4,796 | 1.1% |
| Portuguese | 384 | 0.1% |
| Pueblo | 15 | 0.0% |
| Puerto Rican | 5,295 | 1.3% |
| Romanian | 205 | 0.1% |
| Russian | 1,386 | 0.3% |
| Salvadoran | 239 | 0.1% |
| Samoan | 319 | 0.1% |
| Scandinavian | 523 | 0.1% |
| Scotch-Irish | 6,876 | 1.7% |
| Scottish | 7,016 | 1.7% |
| Seminole | 50 | 0.0% |
| Senegalese | 246 | 0.1% |
| Serbian | 106 | 0.0% |
| Shoshone | 33 | 0.0% |
| Sioux | 57 | 0.0% |
| Slavic | 164 | 0.0% |
| Slovak | 161 | 0.0% |
| Slovene | 109 | 0.0% |
| South African | 82 | 0.0% |
| South American | 1,756 | 0.4% |
| South American Indian | 3 | 0.0% |
| Spaniard | 867 | 0.2% |
| Spanish | 602 | 0.1% |
| Sri Lankan | 1,129 | 0.3% |
| Subsaharan African | 8,695 | 2.1% |
| Sudanese | 33 | 0.0% |
| Swedish | 1,167 | 0.3% |
| Swiss | 661 | 0.2% |
| Syrian | 128 | 0.0% |
| Thai | 4,018 | 1.0% |
| Trinidadian and Tobagonian | 322 | 0.1% |
| Turkish | 74 | 0.0% |
| U.S. Virgin Islander | 8 | 0.0% |
| Ugandan | 72 | 0.0% |
| Ukrainian | 507 | 0.1% |
| Uruguayan | 17 | 0.0% |
| Ute | 16 | 0.0% |
| Venezuelan | 320 | 0.1% |
| Vietnamese | 200 | 0.1% |
| Welsh | 1,203 | 0.3% |
| West Indian | 934 | 0.2% |
| Yugoslavian | 189 | 0.1% | View All 144 Rows |
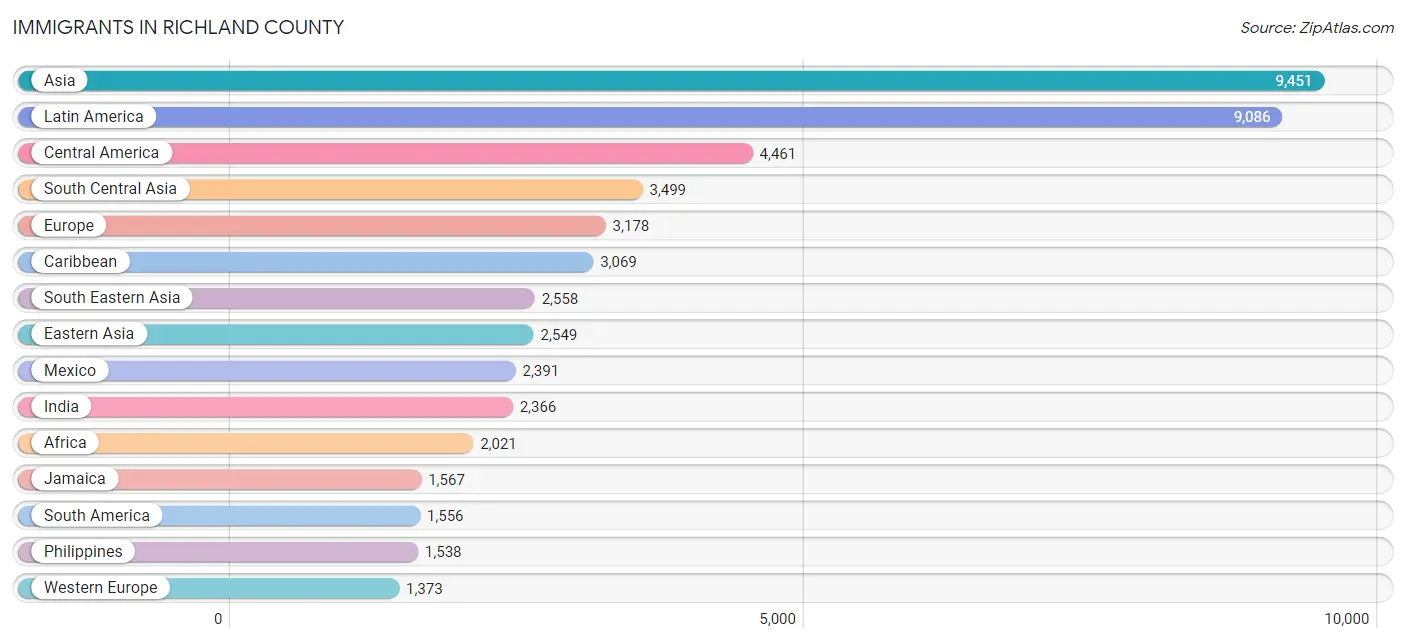
Immigrants in Richland County
The most numerous immigrant groups reported in Richland County came from Asia (9,451 | 2.3%), Latin America (9,086 | 2.2%), Central America (4,461 | 1.1%), South Central Asia (3,499 | 0.8%), and Europe (3,178 | 0.8%), together accounting for 7.1% of all Richland County residents.
| Immigration Origin | # Population | % Population |
| Africa | 2,021 | 0.5% |
| Albania | 17 | 0.0% |
| Argentina | 37 | 0.0% |
| Armenia | 25 | 0.0% |
| Asia | 9,451 | 2.3% |
| Australia | 10 | 0.0% |
| Bahamas | 106 | 0.0% |
| Bangladesh | 178 | 0.0% |
| Barbados | 129 | 0.0% |
| Belarus | 27 | 0.0% |
| Belgium | 7 | 0.0% |
| Belize | 51 | 0.0% |
| Bolivia | 28 | 0.0% |
| Bosnia and Herzegovina | 75 | 0.0% |
| Brazil | 146 | 0.0% |
| Bulgaria | 15 | 0.0% |
| Cabo Verde | 16 | 0.0% |
| Cambodia | 39 | 0.0% |
| Cameroon | 2 | 0.0% |
| Canada | 435 | 0.1% |
| Caribbean | 3,069 | 0.7% |
| Central America | 4,461 | 1.1% |
| Chile | 22 | 0.0% |
| China | 1,353 | 0.3% |
| Colombia | 617 | 0.2% |
| Congo | 57 | 0.0% |
| Costa Rica | 158 | 0.0% |
| Cuba | 101 | 0.0% |
| Denmark | 11 | 0.0% |
| Dominica | 66 | 0.0% |
| Dominican Republic | 317 | 0.1% |
| Eastern Africa | 806 | 0.2% |
| Eastern Asia | 2,549 | 0.6% |
| Eastern Europe | 876 | 0.2% |
| Ecuador | 171 | 0.0% |
| Egypt | 34 | 0.0% |
| El Salvador | 73 | 0.0% |
| England | 225 | 0.1% |
| Ethiopia | 136 | 0.0% |
| Europe | 3,178 | 0.8% |
| France | 62 | 0.0% |
| Germany | 1,175 | 0.3% |
| Ghana | 164 | 0.0% |
| Greece | 37 | 0.0% |
| Grenada | 80 | 0.0% |
| Guatemala | 371 | 0.1% |
| Haiti | 8 | 0.0% |
| Honduras | 758 | 0.2% |
| Hong Kong | 59 | 0.0% |
| Hungary | 5 | 0.0% |
| India | 2,366 | 0.6% |
| Indonesia | 43 | 0.0% |
| Iran | 369 | 0.1% |
| Iraq | 259 | 0.1% |
| Ireland | 62 | 0.0% |
| Italy | 162 | 0.0% |
| Jamaica | 1,567 | 0.4% |
| Japan | 110 | 0.0% |
| Kazakhstan | 86 | 0.0% |
| Kenya | 369 | 0.1% |
| Korea | 1,086 | 0.3% |
| Kuwait | 97 | 0.0% |
| Laos | 53 | 0.0% |
| Latin America | 9,086 | 2.2% |
| Lebanon | 85 | 0.0% |
| Liberia | 14 | 0.0% |
| Mexico | 2,391 | 0.6% |
| Middle Africa | 80 | 0.0% |
| Moldova | 12 | 0.0% |
| Morocco | 60 | 0.0% |
| Nepal | 31 | 0.0% |
| Netherlands | 63 | 0.0% |
| Nicaragua | 255 | 0.1% |
| Nigeria | 253 | 0.1% |
| Northern Africa | 341 | 0.1% |
| Northern Europe | 597 | 0.1% |
| Norway | 22 | 0.0% |
| Oceania | 24 | 0.0% |
| Pakistan | 352 | 0.1% |
| Panama | 381 | 0.1% |
| Peru | 197 | 0.1% |
| Philippines | 1,538 | 0.4% |
| Poland | 171 | 0.0% |
| Romania | 95 | 0.0% |
| Russia | 295 | 0.1% |
| Saudi Arabia | 41 | 0.0% |
| Scotland | 2 | 0.0% |
| Senegal | 139 | 0.0% |
| Serbia | 38 | 0.0% |
| Singapore | 51 | 0.0% |
| Somalia | 27 | 0.0% |
| South Africa | 50 | 0.0% |
| South America | 1,556 | 0.4% |
| South Central Asia | 3,499 | 0.8% |
| South Eastern Asia | 2,558 | 0.6% |
| Southern Europe | 332 | 0.1% |
| Spain | 133 | 0.0% |
| Sri Lanka | 29 | 0.0% |
| Sudan | 33 | 0.0% |
| Sweden | 42 | 0.0% |
| Switzerland | 66 | 0.0% |
| Syria | 129 | 0.0% |
| Taiwan | 49 | 0.0% |
| Thailand | 77 | 0.0% |
| Trinidad and Tobago | 131 | 0.0% |
| Turkey | 18 | 0.0% |
| Uganda | 21 | 0.0% |
| Ukraine | 82 | 0.0% |
| Uruguay | 17 | 0.0% |
| Uzbekistan | 88 | 0.0% |
| Venezuela | 206 | 0.1% |
| Vietnam | 585 | 0.1% |
| West Indies | 13 | 0.0% |
| Western Africa | 686 | 0.2% |
| Western Asia | 781 | 0.2% |
| Western Europe | 1,373 | 0.3% |
| Yemen | 30 | 0.0% |
| Zaire | 21 | 0.0% |
| Zimbabwe | 12 | 0.0% | View All 119 Rows |
Sex and Age in Richland County
Sex and Age in Richland County
The most populous age groups in Richland County are 20 to 24 Years (21,661 | 10.8%) for men and 20 to 24 Years (21,378 | 9.9%) for women.
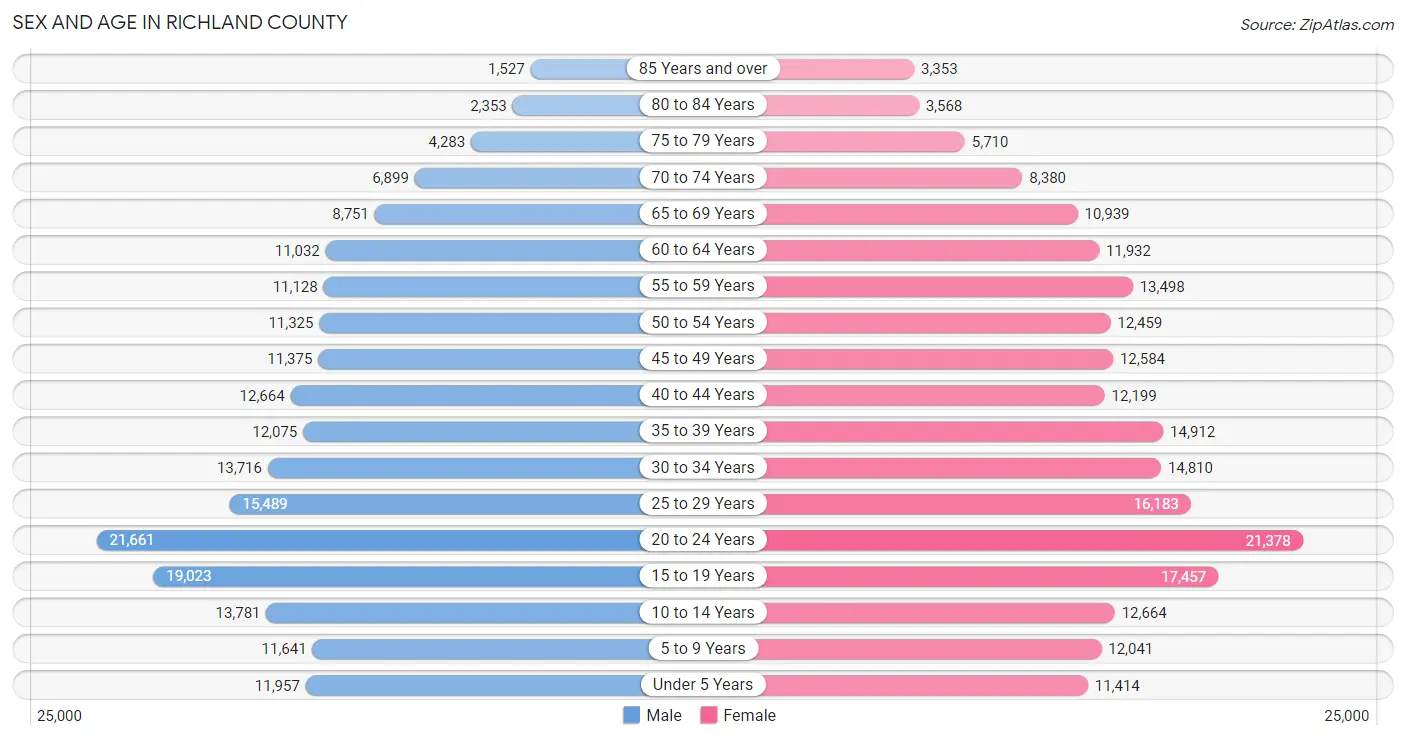
| Age Bracket | Male | Female |
| Under 5 Years | 11,957 (6.0%) | 11,414 (5.3%) |
| 5 to 9 Years | 11,641 (5.8%) | 12,041 (5.6%) |
| 10 to 14 Years | 13,781 (6.9%) | 12,664 (5.9%) |
| 15 to 19 Years | 19,023 (9.5%) | 17,457 (8.1%) |
| 20 to 24 Years | 21,661 (10.8%) | 21,378 (9.9%) |
| 25 to 29 Years | 15,489 (7.7%) | 16,183 (7.5%) |
| 30 to 34 Years | 13,716 (6.8%) | 14,810 (6.9%) |
| 35 to 39 Years | 12,075 (6.0%) | 14,912 (6.9%) |
| 40 to 44 Years | 12,664 (6.3%) | 12,199 (5.7%) |
| 45 to 49 Years | 11,375 (5.7%) | 12,584 (5.8%) |
| 50 to 54 Years | 11,325 (5.6%) | 12,459 (5.8%) |
| 55 to 59 Years | 11,128 (5.6%) | 13,498 (6.3%) |
| 60 to 64 Years | 11,032 (5.5%) | 11,932 (5.5%) |
| 65 to 69 Years | 8,751 (4.4%) | 10,939 (5.1%) |
| 70 to 74 Years | 6,899 (3.4%) | 8,380 (3.9%) |
| 75 to 79 Years | 4,283 (2.1%) | 5,710 (2.6%) |
| 80 to 84 Years | 2,353 (1.2%) | 3,568 (1.7%) |
| 85 Years and over | 1,527 (0.8%) | 3,353 (1.6%) |
| Total | 200,680 (100.0%) | 215,481 (100.0%) |
Families and Households in Richland County
Median Family Size in Richland County
The median family size in Richland County is 3.09 persons per family, with single female/mother families (27,472 | 28.7%) accounting for the largest median family size of 3.16 persons per family. On the other hand, single male/father families (6,695 | 7.0%) represent the smallest median family size with 2.72 persons per family.
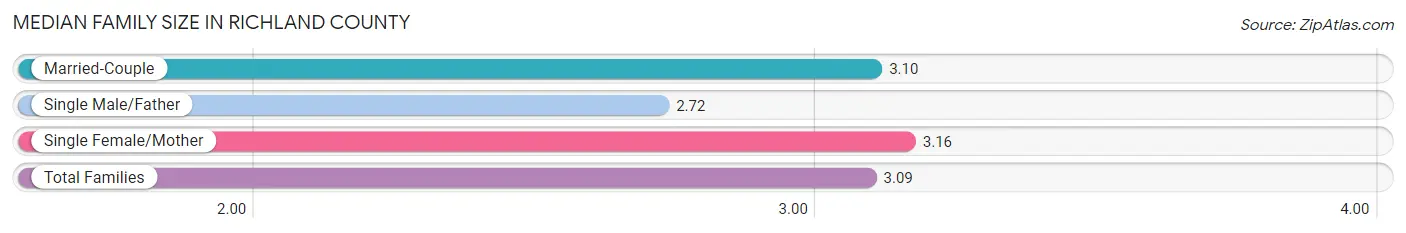
| Family Type | # Families | Family Size |
| Married-Couple | 61,426 (64.3%) | 3.10 |
| Single Male/Father | 6,695 (7.0%) | 2.72 |
| Single Female/Mother | 27,472 (28.7%) | 3.16 |
| Total Families | 95,593 (100.0%) | 3.09 |
Median Household Size in Richland County
The median household size in Richland County is 2.38 persons per household, with single female/mother households (27,472 | 16.9%) accounting for the largest median household size of 3.28 persons per household. non-family households (67,133 | 41.3%) represent the smallest median household size with 1.27 persons per household.
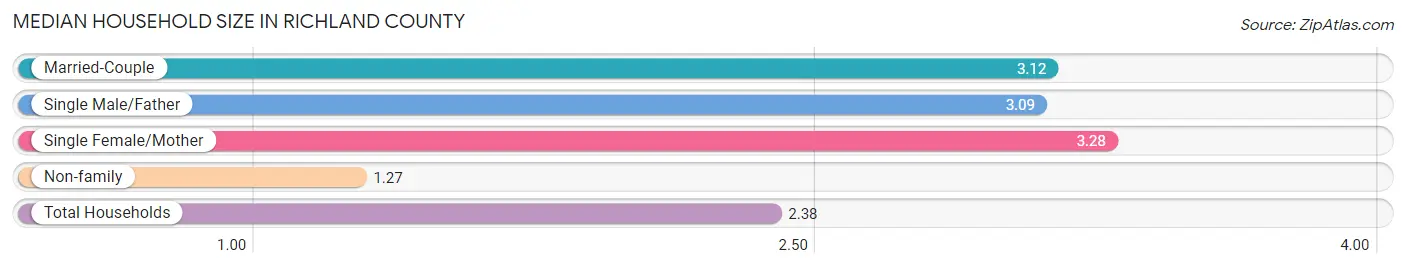
| Household Type | # Households | Household Size |
| Married-Couple | 61,426 (37.8%) | 3.12 |
| Single Male/Father | 6,695 (4.1%) | 3.09 |
| Single Female/Mother | 27,472 (16.9%) | 3.28 |
| Non-family | 67,133 (41.3%) | 1.27 |
| Total Households | 162,726 (100.0%) | 2.38 |
Household Size by Marriage Status in Richland County
Out of a total of 162,726 households in Richland County, 95,593 (58.7%) are family households, while 67,133 (41.3%) are nonfamily households. The most numerous type of family households are 2-person households, comprising 43,270, and the most common type of nonfamily households are 1-person households, comprising 54,553.
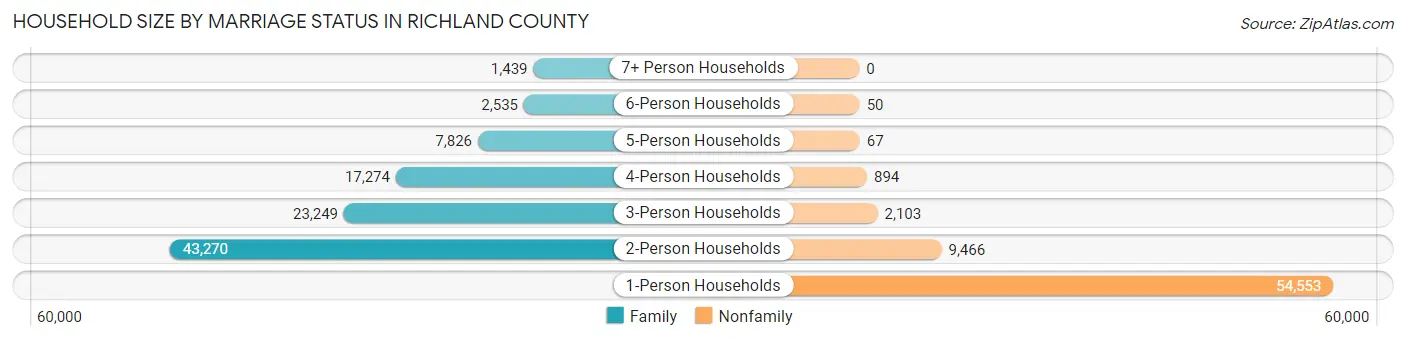
| Household Size | Family Households | Nonfamily Households |
| 1-Person Households | - | 54,553 (33.5%) |
| 2-Person Households | 43,270 (26.6%) | 9,466 (5.8%) |
| 3-Person Households | 23,249 (14.3%) | 2,103 (1.3%) |
| 4-Person Households | 17,274 (10.6%) | 894 (0.5%) |
| 5-Person Households | 7,826 (4.8%) | 67 (0.0%) |
| 6-Person Households | 2,535 (1.6%) | 50 (0.0%) |
| 7+ Person Households | 1,439 (0.9%) | 0 (0.0%) |
| Total | 95,593 (58.7%) | 67,133 (41.3%) |
Female Fertility in Richland County
Fertility by Age in Richland County
Average fertility rate in Richland County is 46.0 births per 1,000 women. Women in the age bracket of 20 to 34 years have the highest fertility rate with 73.0 births per 1,000 women. Women in the age bracket of 20 to 34 years acount for 73.8% of all women with births.
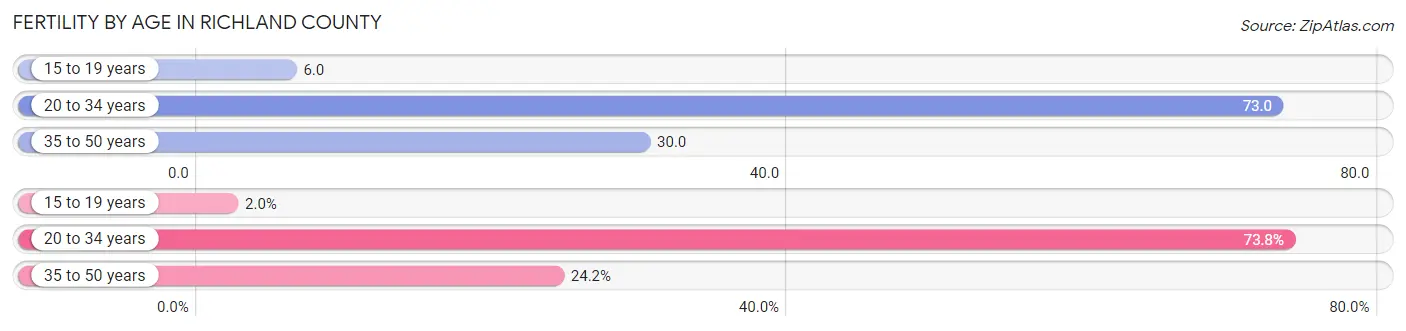
| Age Bracket | Women with Births | Births / 1,000 Women |
| 15 to 19 years | 105 (2.0%) | 6.0 |
| 20 to 34 years | 3,806 (73.8%) | 73.0 |
| 35 to 50 years | 1,245 (24.1%) | 30.0 |
| Total | 5,156 (100.0%) | 46.0 |
Fertility by Age by Marriage Status in Richland County
56.6% of women with births (5,156) in Richland County are married. The highest percentage of unmarried women with births falls into 15 to 19 years age bracket with 100.0% of them unmarried at the time of birth, while the lowest percentage of unmarried women with births belong to 35 to 50 years age bracket with 17.4% of them unmarried.
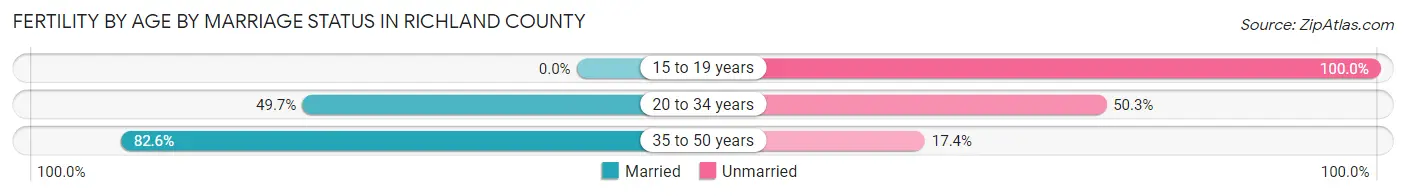
| Age Bracket | Married | Unmarried |
| 15 to 19 years | 0 (0.0%) | 105 (100.0%) |
| 20 to 34 years | 1,892 (49.7%) | 1,914 (50.3%) |
| 35 to 50 years | 1,028 (82.6%) | 217 (17.4%) |
| Total | 2,918 (56.6%) | 2,238 (43.4%) |
Fertility by Education in Richland County
Average fertility rate in Richland County is 46.0 births per 1,000 women. Women with the education attainment of high school diploma have the highest fertility rate of 52.0 births per 1,000 women, while women with the education attainment of less than high school have the lowest fertility at 34.0 births per 1,000 women. Women with the education attainment of college or associate's degree represent 40.7% of all women with births.
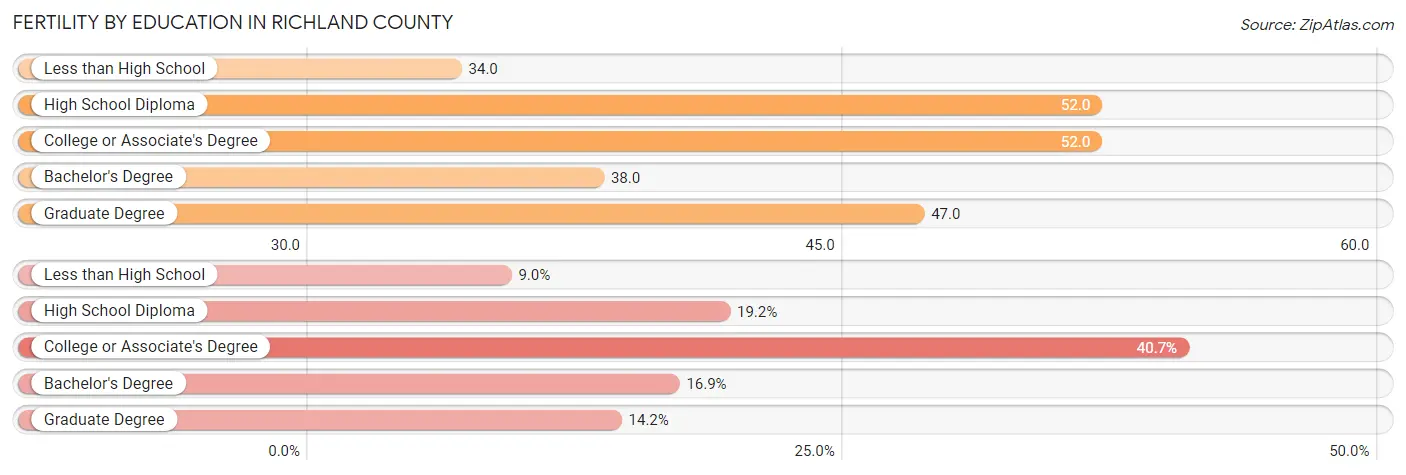
| Educational Attainment | Women with Births | Births / 1,000 Women |
| Less than High School | 464 (9.0%) | 34.0 |
| High School Diploma | 992 (19.2%) | 52.0 |
| College or Associate's Degree | 2,100 (40.7%) | 52.0 |
| Bachelor's Degree | 870 (16.9%) | 38.0 |
| Graduate Degree | 730 (14.2%) | 47.0 |
| Total | 5,156 (100.0%) | 46.0 |
Fertility by Education by Marriage Status in Richland County
43.4% of women with births in Richland County are unmarried. Women with the educational attainment of graduate degree are most likely to be married with 91.5% of them married at childbirth, while women with the educational attainment of less than high school are least likely to be married with 87.1% of them unmarried at childbirth.
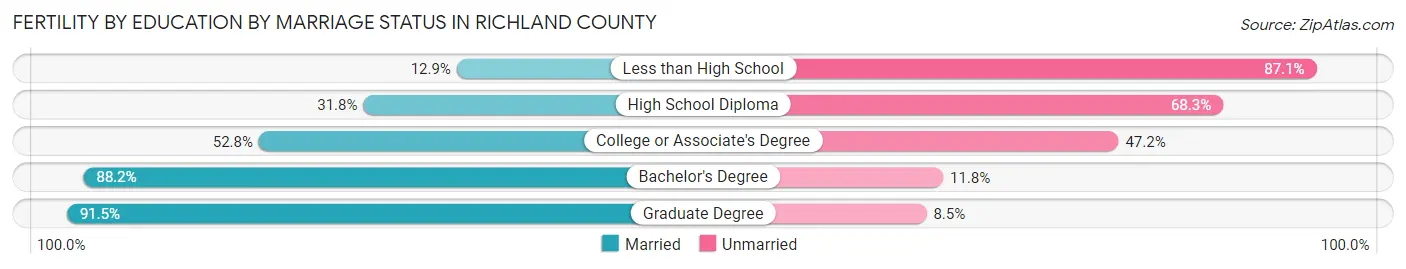
| Educational Attainment | Married | Unmarried |
| Less than High School | 60 (12.9%) | 404 (87.1%) |
| High School Diploma | 315 (31.8%) | 677 (68.2%) |
| College or Associate's Degree | 1,109 (52.8%) | 991 (47.2%) |
| Bachelor's Degree | 767 (88.2%) | 103 (11.8%) |
| Graduate Degree | 668 (91.5%) | 62 (8.5%) |
| Total | 2,918 (56.6%) | 2,238 (43.4%) |
Employment Characteristics in Richland County
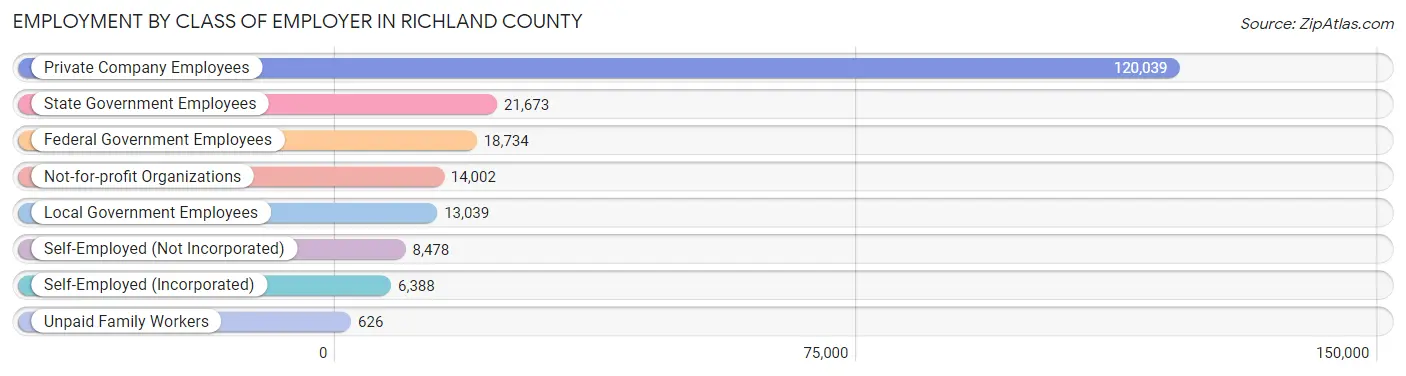
Employment by Class of Employer in Richland County
Among the 202,979 employed individuals in Richland County, private company employees (120,039 | 59.1%), state government employees (21,673 | 10.7%), and federal government employees (18,734 | 9.2%) make up the most common classes of employment.
| Employer Class | # Employees | % Employees |
| Private Company Employees | 120,039 | 59.1% |
| Self-Employed (Incorporated) | 6,388 | 3.2% |
| Self-Employed (Not Incorporated) | 8,478 | 4.2% |
| Not-for-profit Organizations | 14,002 | 6.9% |
| Local Government Employees | 13,039 | 6.4% |
| State Government Employees | 21,673 | 10.7% |
| Federal Government Employees | 18,734 | 9.2% |
| Unpaid Family Workers | 626 | 0.3% |
| Total | 202,979 | 100.0% |
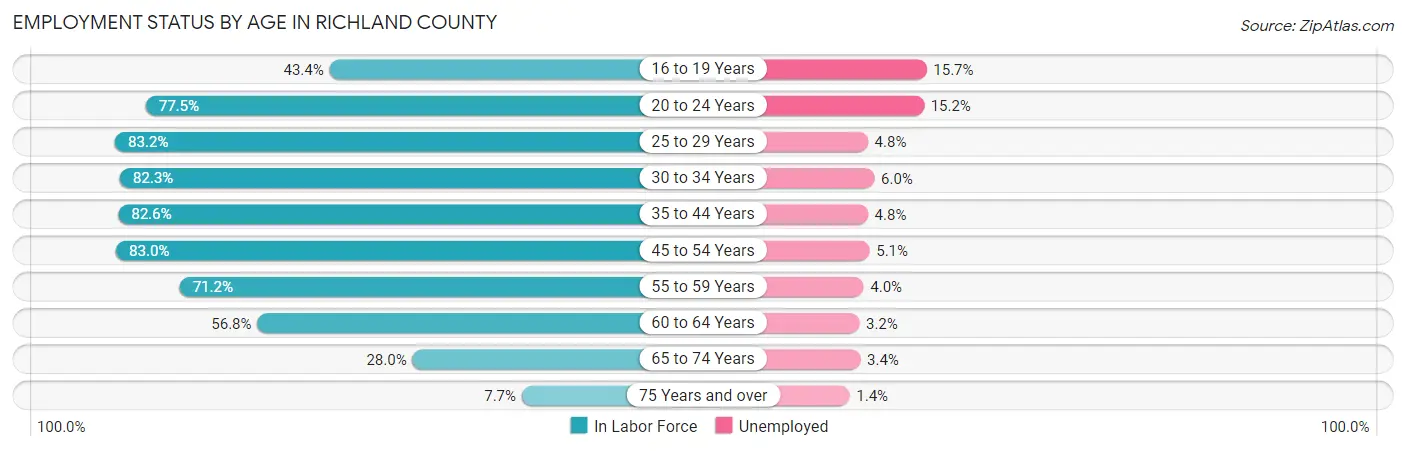
Employment Status by Age in Richland County
According to the labor force statistics for Richland County, out of the total population over 16 years of age (337,509), 65.5% or 221,068 individuals are in the labor force, with 6.8% or 15,033 of them unemployed. The age group with the highest labor force participation rate is 25 to 29 years, with 83.2% or 26,351 individuals in the labor force. Within the labor force, the 16 to 19 years age range has the highest percentage of unemployed individuals, with 15.7% or 2,134 of them being unemployed.
| Age Bracket | In Labor Force | Unemployed |
| 16 to 19 Years | 13,595 (43.4%) | 2,134 (15.7%) |
| 20 to 24 Years | 33,355 (77.5%) | 5,070 (15.2%) |
| 25 to 29 Years | 26,351 (83.2%) | 1,265 (4.8%) |
| 30 to 34 Years | 23,477 (82.3%) | 1,409 (6.0%) |
| 35 to 44 Years | 42,828 (82.6%) | 2,056 (4.8%) |
| 45 to 54 Years | 39,627 (83.0%) | 2,021 (5.1%) |
| 55 to 59 Years | 17,534 (71.2%) | 701 (4.0%) |
| 60 to 64 Years | 13,044 (56.8%) | 417 (3.2%) |
| 65 to 74 Years | 9,791 (28.0%) | 333 (3.4%) |
| 75 Years and over | 1,601 (7.7%) | 22 (1.4%) |
| Total | 221,068 (65.5%) | 15,033 (6.8%) |
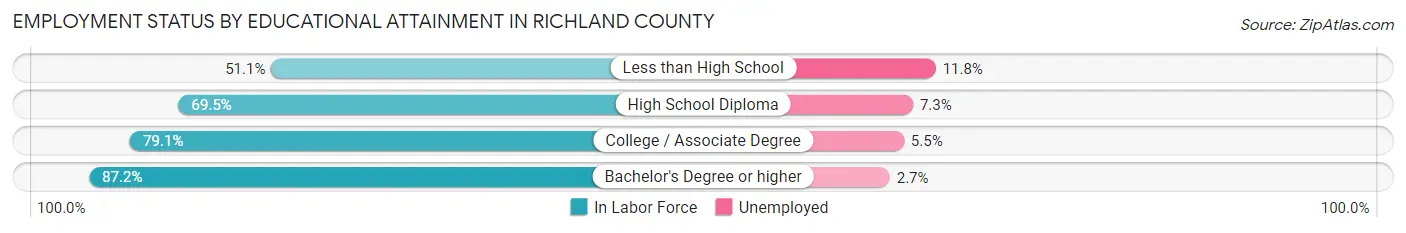
Employment Status by Educational Attainment in Richland County
According to labor force statistics for Richland County, 78.5% of individuals (162,794) out of the total population between 25 and 64 years of age (207,381) are in the labor force, with 4.8% or 7,814 of them being unemployed. The group with the highest labor force participation rate are those with the educational attainment of bachelor's degree or higher, with 87.2% or 75,458 individuals in the labor force. Within the labor force, individuals with less than high school education have the highest percentage of unemployment, with 11.8% or 892 of them being unemployed.
| Educational Attainment | In Labor Force | Unemployed |
| Less than High School | 7,557 (51.1%) | 1,745 (11.8%) |
| High School Diploma | 29,567 (69.5%) | 3,106 (7.3%) |
| College / Associate Degree | 50,242 (79.1%) | 3,493 (5.5%) |
| Bachelor's Degree or higher | 75,458 (87.2%) | 2,336 (2.7%) |
| Total | 162,794 (78.5%) | 9,954 (4.8%) |
Employment Occupations by Sex in Richland County
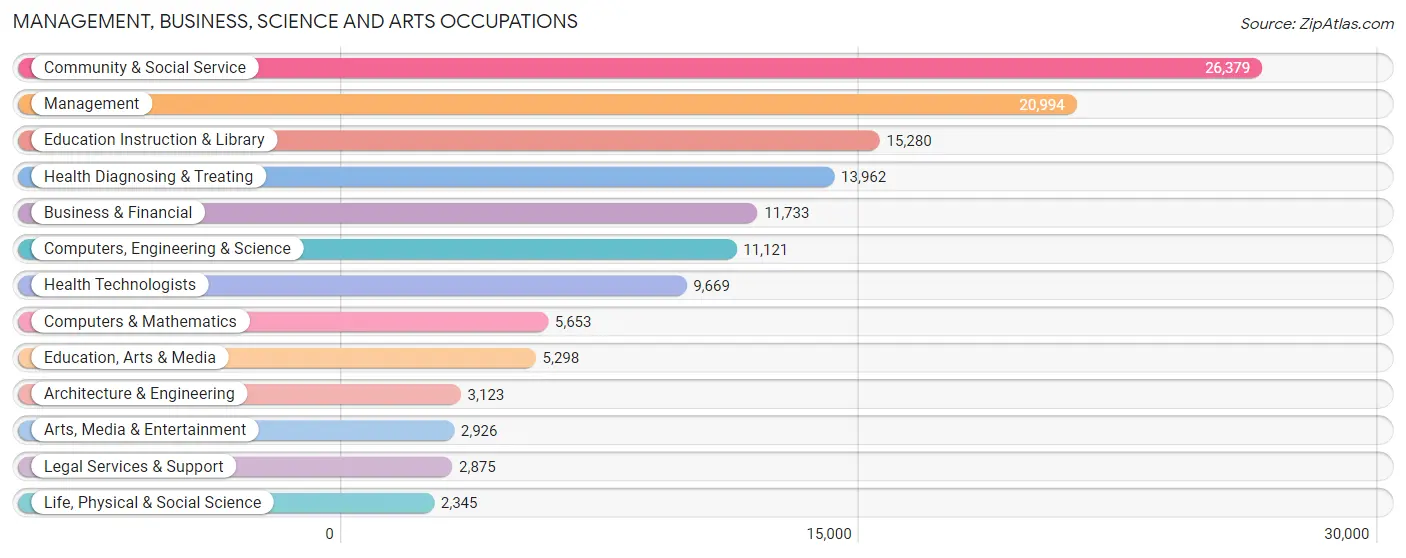
Management, Business, Science and Arts Occupations
The most common Management, Business, Science and Arts occupations in Richland County are Community & Social Service (26,379 | 13.4%), Management (20,994 | 10.7%), Education Instruction & Library (15,280 | 7.8%), Health Diagnosing & Treating (13,962 | 7.1%), and Business & Financial (11,733 | 6.0%).
Management, Business, Science and Arts Occupations by Sex
Within the Management, Business, Science and Arts occupations in Richland County, the most male-oriented occupations are Architecture & Engineering (82.7%), Computers, Engineering & Science (69.9%), and Computers & Mathematics (66.6%), while the most female-oriented occupations are Health Diagnosing & Treating (75.7%), Education, Arts & Media (74.5%), and Health Technologists (72.0%).
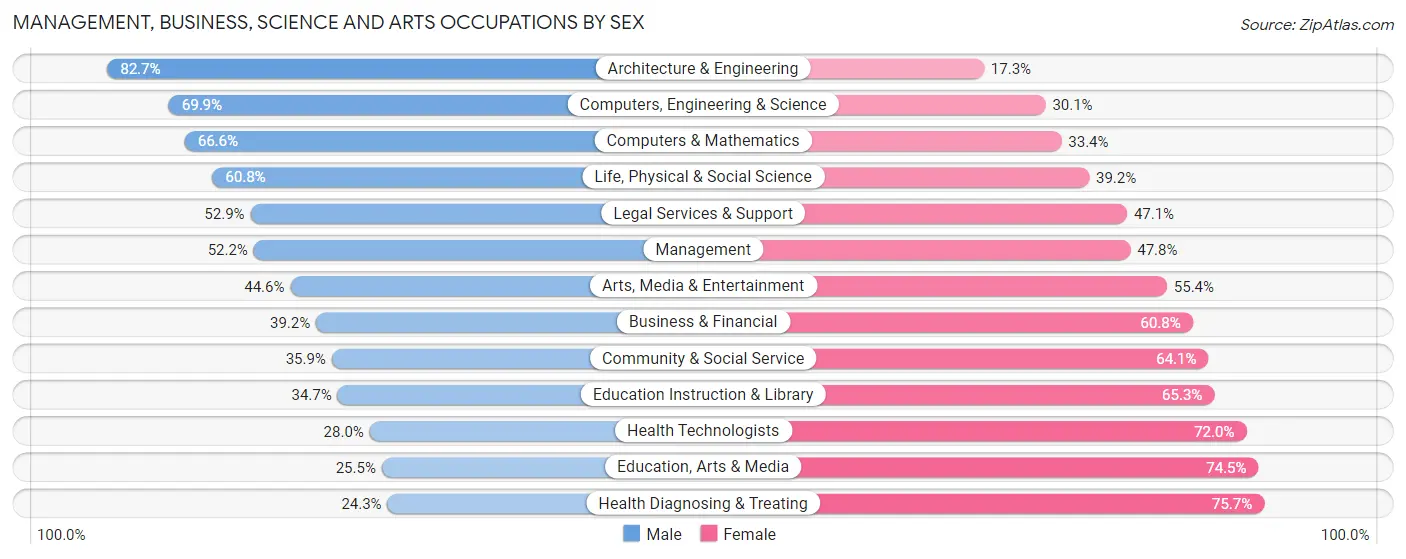
| Occupation | Male | Female |
| Management | 10,960 (52.2%) | 10,034 (47.8%) |
| Business & Financial | 4,601 (39.2%) | 7,132 (60.8%) |
| Computers, Engineering & Science | 7,774 (69.9%) | 3,347 (30.1%) |
| Computers & Mathematics | 3,764 (66.6%) | 1,889 (33.4%) |
| Architecture & Engineering | 2,584 (82.7%) | 539 (17.3%) |
| Life, Physical & Social Science | 1,426 (60.8%) | 919 (39.2%) |
| Community & Social Service | 9,481 (35.9%) | 16,898 (64.1%) |
| Education, Arts & Media | 1,351 (25.5%) | 3,947 (74.5%) |
| Legal Services & Support | 1,521 (52.9%) | 1,354 (47.1%) |
| Education Instruction & Library | 5,305 (34.7%) | 9,975 (65.3%) |
| Arts, Media & Entertainment | 1,304 (44.6%) | 1,622 (55.4%) |
| Health Diagnosing & Treating | 3,394 (24.3%) | 10,568 (75.7%) |
| Health Technologists | 2,709 (28.0%) | 6,960 (72.0%) |
| Total (Category) | 36,210 (43.0%) | 47,979 (57.0%) |
| Total (Overall) | 94,806 (48.3%) | 101,654 (51.7%) |
Services Occupations
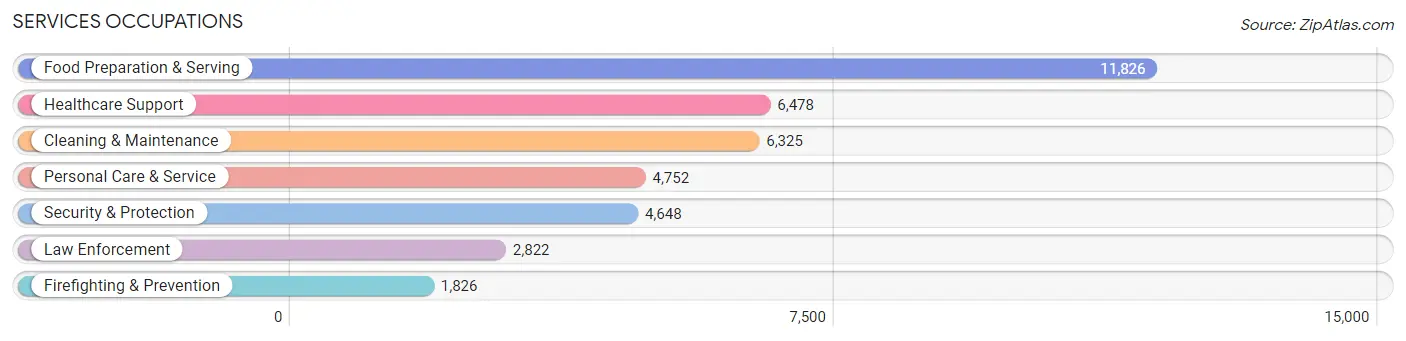
The most common Services occupations in Richland County are Food Preparation & Serving (11,826 | 6.0%), Healthcare Support (6,478 | 3.3%), Cleaning & Maintenance (6,325 | 3.2%), Personal Care & Service (4,752 | 2.4%), and Security & Protection (4,648 | 2.4%).
Services Occupations by Sex
Within the Services occupations in Richland County, the most male-oriented occupations are Law Enforcement (69.3%), Security & Protection (66.4%), and Cleaning & Maintenance (63.0%), while the most female-oriented occupations are Healthcare Support (85.0%), Personal Care & Service (68.1%), and Food Preparation & Serving (50.9%).
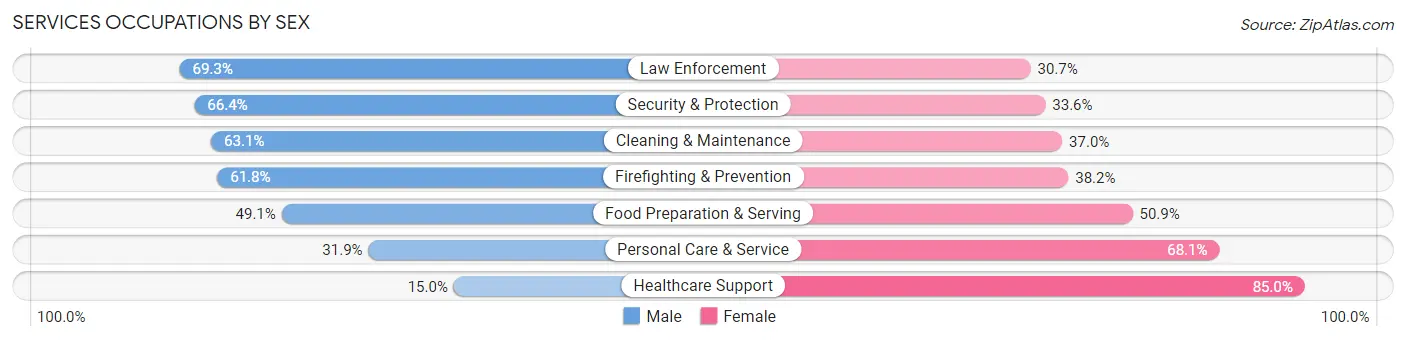
| Occupation | Male | Female |
| Healthcare Support | 973 (15.0%) | 5,505 (85.0%) |
| Security & Protection | 3,085 (66.4%) | 1,563 (33.6%) |
| Firefighting & Prevention | 1,129 (61.8%) | 697 (38.2%) |
| Law Enforcement | 1,956 (69.3%) | 866 (30.7%) |
| Food Preparation & Serving | 5,808 (49.1%) | 6,018 (50.9%) |
| Cleaning & Maintenance | 3,988 (63.0%) | 2,337 (36.9%) |
| Personal Care & Service | 1,517 (31.9%) | 3,235 (68.1%) |
| Total (Category) | 15,371 (45.2%) | 18,658 (54.8%) |
| Total (Overall) | 94,806 (48.3%) | 101,654 (51.7%) |
Sales and Office Occupations
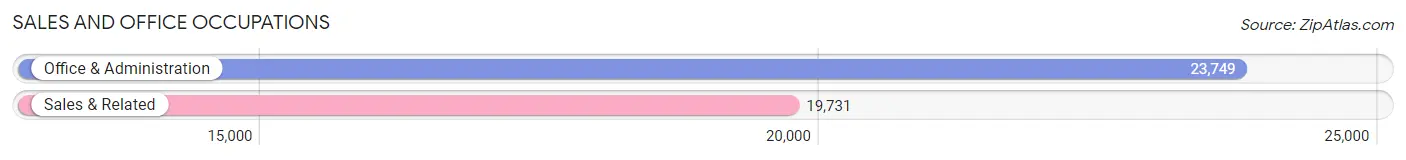
The most common Sales and Office occupations in Richland County are Office & Administration (23,749 | 12.1%), and Sales & Related (19,731 | 10.0%).
Sales and Office Occupations by Sex
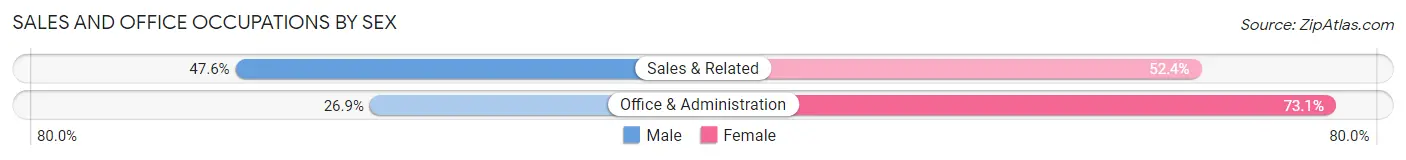
| Occupation | Male | Female |
| Sales & Related | 9,387 (47.6%) | 10,344 (52.4%) |
| Office & Administration | 6,388 (26.9%) | 17,361 (73.1%) |
| Total (Category) | 15,775 (36.3%) | 27,705 (63.7%) |
| Total (Overall) | 94,806 (48.3%) | 101,654 (51.7%) |
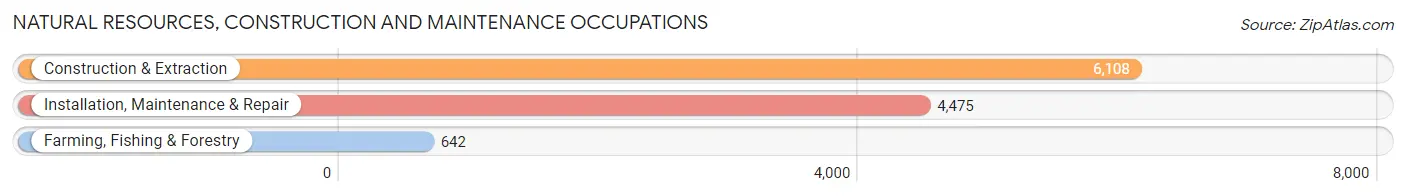
Natural Resources, Construction and Maintenance Occupations
The most common Natural Resources, Construction and Maintenance occupations in Richland County are Construction & Extraction (6,108 | 3.1%), Installation, Maintenance & Repair (4,475 | 2.3%), and Farming, Fishing & Forestry (642 | 0.3%).
Natural Resources, Construction and Maintenance Occupations by Sex
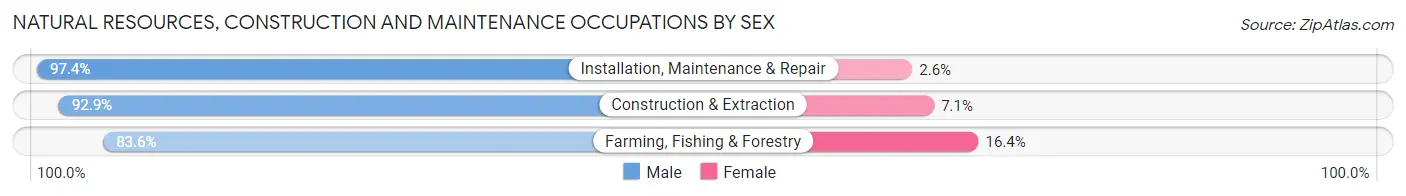
| Occupation | Male | Female |
| Farming, Fishing & Forestry | 537 (83.6%) | 105 (16.4%) |
| Construction & Extraction | 5,672 (92.9%) | 436 (7.1%) |
| Installation, Maintenance & Repair | 4,359 (97.4%) | 116 (2.6%) |
| Total (Category) | 10,568 (94.2%) | 657 (5.9%) |
| Total (Overall) | 94,806 (48.3%) | 101,654 (51.7%) |
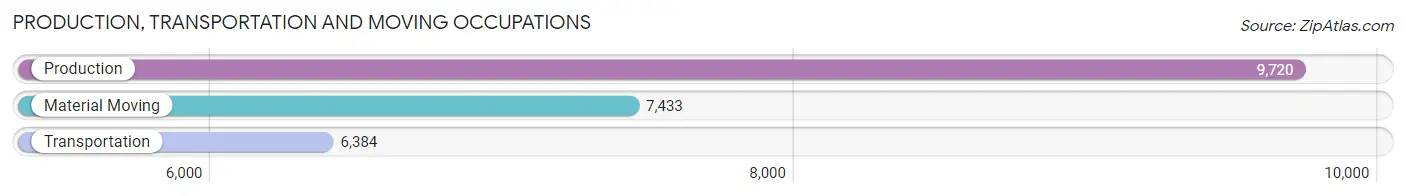
Production, Transportation and Moving Occupations
The most common Production, Transportation and Moving occupations in Richland County are Production (9,720 | 5.0%), Material Moving (7,433 | 3.8%), and Transportation (6,384 | 3.3%).
Production, Transportation and Moving Occupations by Sex
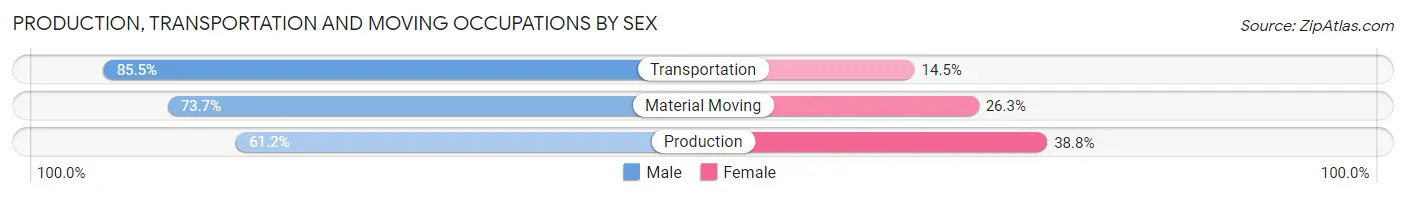
| Occupation | Male | Female |
| Production | 5,945 (61.2%) | 3,775 (38.8%) |
| Transportation | 5,457 (85.5%) | 927 (14.5%) |
| Material Moving | 5,480 (73.7%) | 1,953 (26.3%) |
| Total (Category) | 16,882 (71.7%) | 6,655 (28.3%) |
| Total (Overall) | 94,806 (48.3%) | 101,654 (51.7%) |
Employment Industries by Sex in Richland County
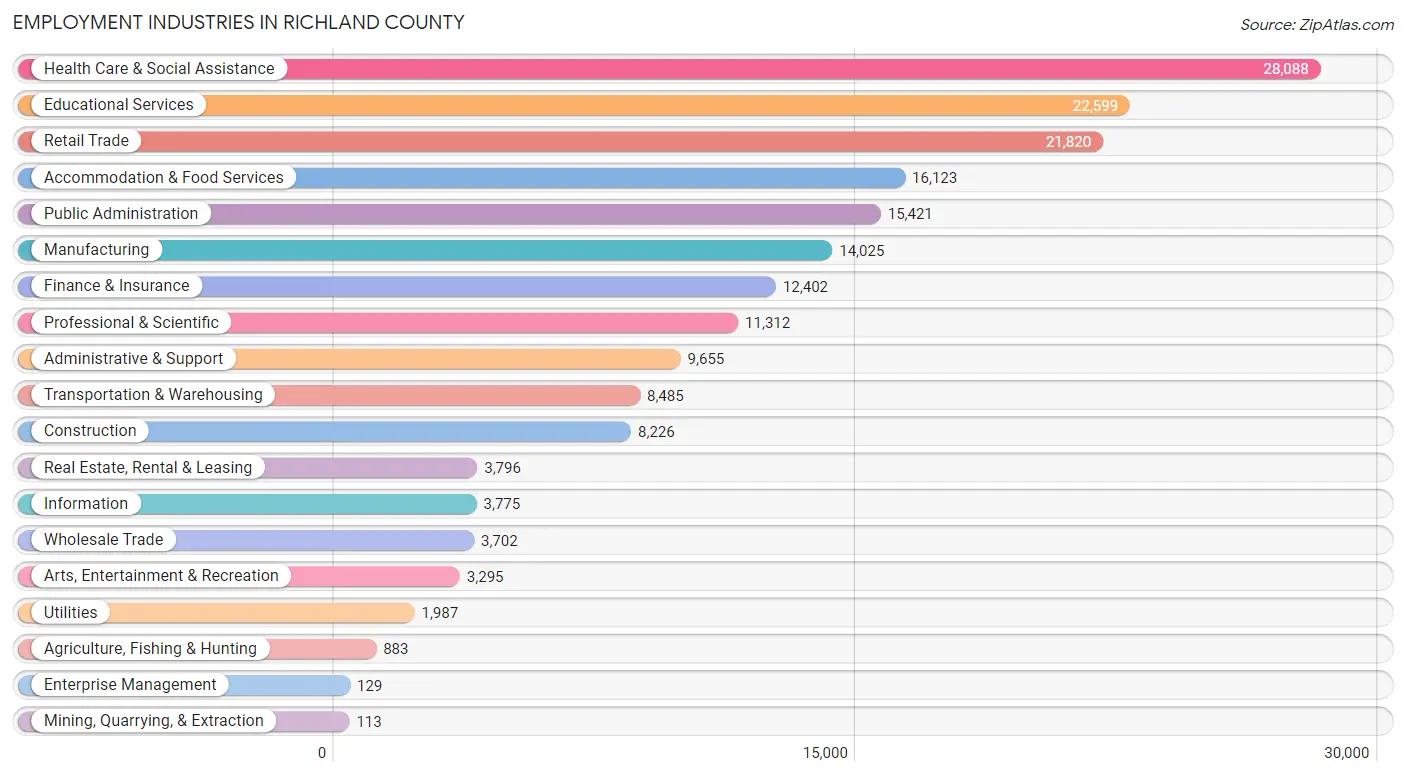
Employment Industries in Richland County
The major employment industries in Richland County include Health Care & Social Assistance (28,088 | 14.3%), Educational Services (22,599 | 11.5%), Retail Trade (21,820 | 11.1%), Accommodation & Food Services (16,123 | 8.2%), and Public Administration (15,421 | 7.9%).
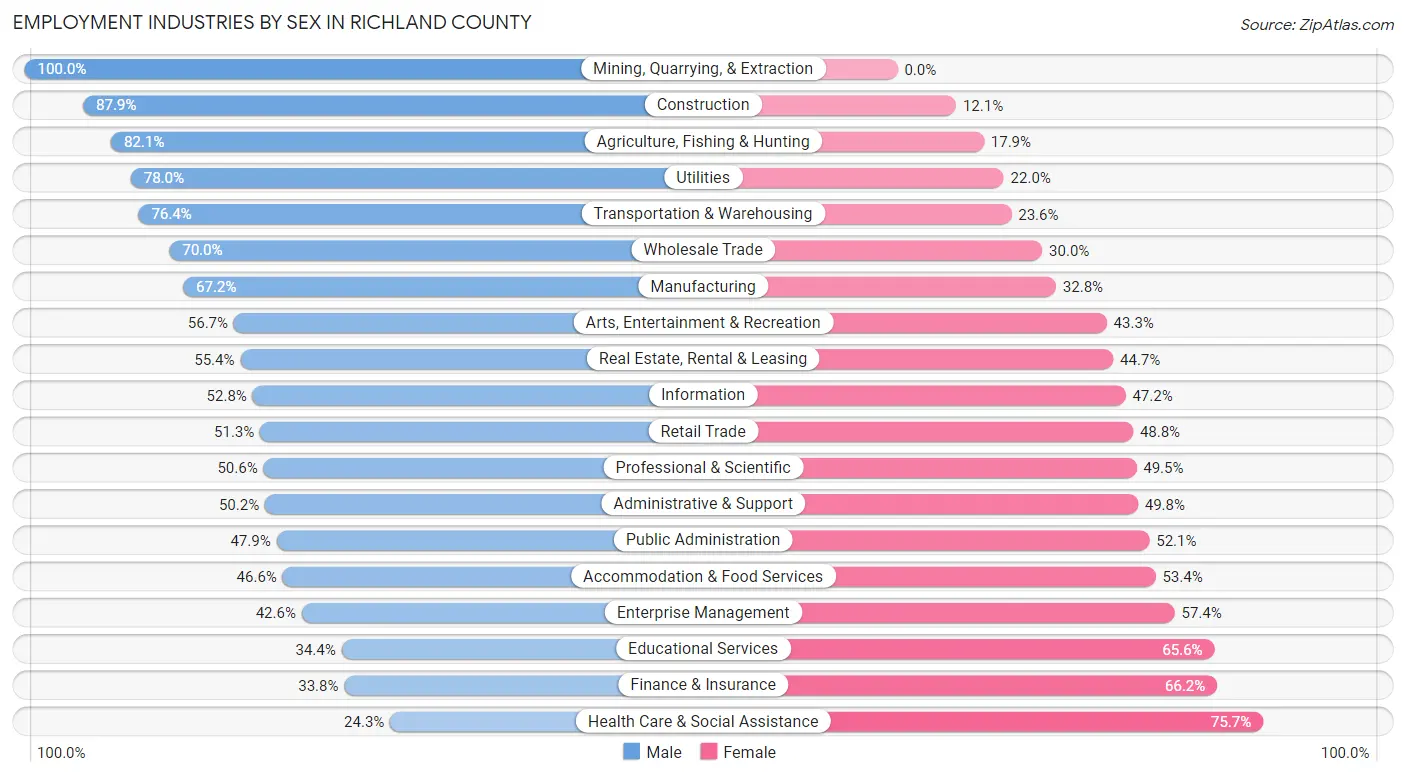
Employment Industries by Sex in Richland County
The Richland County industries that see more men than women are Mining, Quarrying, & Extraction (100.0%), Construction (87.9%), and Agriculture, Fishing & Hunting (82.1%), whereas the industries that tend to have a higher number of women are Health Care & Social Assistance (75.7%), Finance & Insurance (66.2%), and Educational Services (65.6%).
| Industry | Male | Female |
| Agriculture, Fishing & Hunting | 725 (82.1%) | 158 (17.9%) |
| Mining, Quarrying, & Extraction | 113 (100.0%) | 0 (0.0%) |
| Construction | 7,229 (87.9%) | 997 (12.1%) |
| Manufacturing | 9,425 (67.2%) | 4,600 (32.8%) |
| Wholesale Trade | 2,593 (70.0%) | 1,109 (30.0%) |
| Retail Trade | 11,183 (51.2%) | 10,637 (48.7%) |
| Transportation & Warehousing | 6,485 (76.4%) | 2,000 (23.6%) |
| Utilities | 1,550 (78.0%) | 437 (22.0%) |
| Information | 1,993 (52.8%) | 1,782 (47.2%) |
| Finance & Insurance | 4,196 (33.8%) | 8,206 (66.2%) |
| Real Estate, Rental & Leasing | 2,101 (55.3%) | 1,695 (44.7%) |
| Professional & Scientific | 5,718 (50.5%) | 5,594 (49.4%) |
| Enterprise Management | 55 (42.6%) | 74 (57.4%) |
| Administrative & Support | 4,851 (50.2%) | 4,804 (49.8%) |
| Educational Services | 7,771 (34.4%) | 14,828 (65.6%) |
| Health Care & Social Assistance | 6,833 (24.3%) | 21,255 (75.7%) |
| Arts, Entertainment & Recreation | 1,868 (56.7%) | 1,427 (43.3%) |
| Accommodation & Food Services | 7,510 (46.6%) | 8,613 (53.4%) |
| Public Administration | 7,380 (47.9%) | 8,041 (52.1%) |
| Total | 94,806 (48.3%) | 101,654 (51.7%) |
Education in Richland County
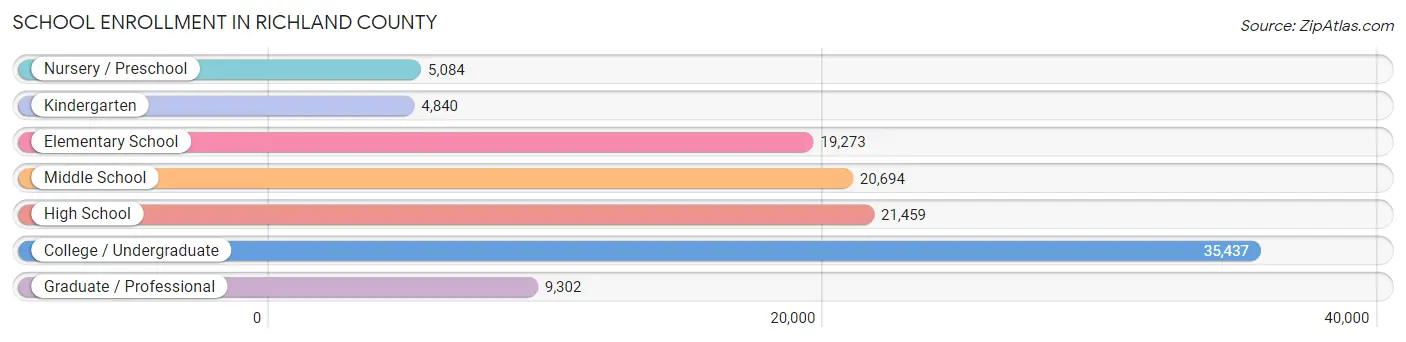
School Enrollment in Richland County
The most common levels of schooling among the 116,089 students in Richland County are college / undergraduate (35,437 | 30.5%), high school (21,459 | 18.5%), and middle school (20,694 | 17.8%).
| School Level | # Students | % Students |
| Nursery / Preschool | 5,084 | 4.4% |
| Kindergarten | 4,840 | 4.2% |
| Elementary School | 19,273 | 16.6% |
| Middle School | 20,694 | 17.8% |
| High School | 21,459 | 18.5% |
| College / Undergraduate | 35,437 | 30.5% |
| Graduate / Professional | 9,302 | 8.0% |
| Total | 116,089 | 100.0% |
School Enrollment by Age by Funding Source in Richland County
Out of a total of 116,089 students who are enrolled in schools in Richland County, 15,092 (13.0%) attend a private institution, while the remaining 100,997 (87.0%) are enrolled in public schools. The age group of 3 to 4 year olds has the highest likelihood of being enrolled in private schools, with 1,987 (44.5% in the age bracket) enrolled. Conversely, the age group of 18 to 19 year olds has the lowest likelihood of being enrolled in a private school, with 13,207 (93.9% in the age bracket) attending a public institution.
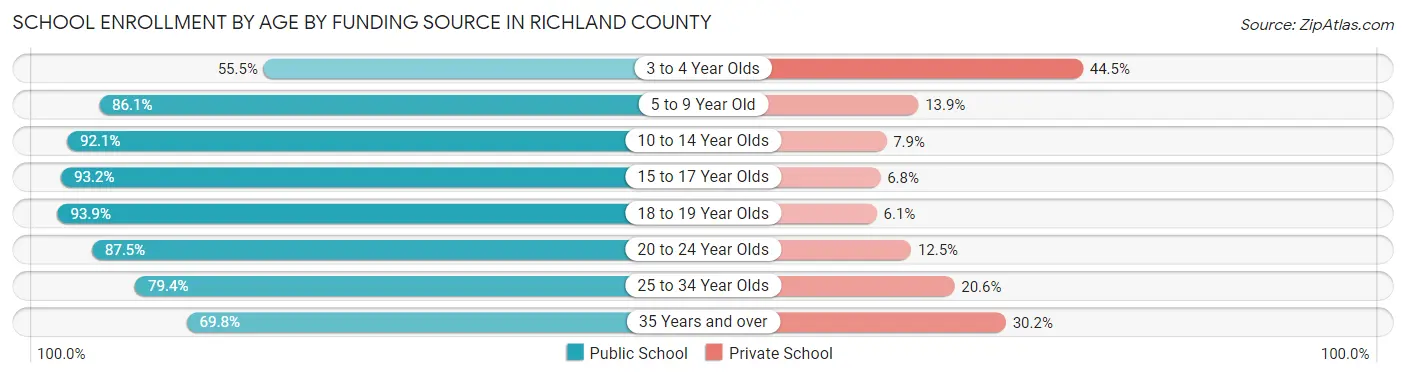
| Age Bracket | Public School | Private School |
| 3 to 4 Year Olds | 2,474 (55.5%) | 1,987 (44.5%) |
| 5 to 9 Year Old | 19,332 (86.1%) | 3,115 (13.9%) |
| 10 to 14 Year Olds | 23,774 (92.1%) | 2,049 (7.9%) |
| 15 to 17 Year Olds | 13,840 (93.2%) | 1,009 (6.8%) |
| 18 to 19 Year Olds | 13,207 (93.9%) | 862 (6.1%) |
| 20 to 24 Year Olds | 17,619 (87.5%) | 2,525 (12.5%) |
| 25 to 34 Year Olds | 6,582 (79.4%) | 1,708 (20.6%) |
| 35 Years and over | 4,193 (69.8%) | 1,813 (30.2%) |
| Total | 100,997 (87.0%) | 15,092 (13.0%) |
Educational Attainment by Field of Study in Richland County
Business (25,693 | 22.6%), education (11,517 | 10.1%), social sciences (10,293 | 9.0%), science & technology (9,597 | 8.4%), and arts & humanities (8,100 | 7.1%) are the most common fields of study among 113,779 individuals in Richland County who have obtained a bachelor's degree or higher.
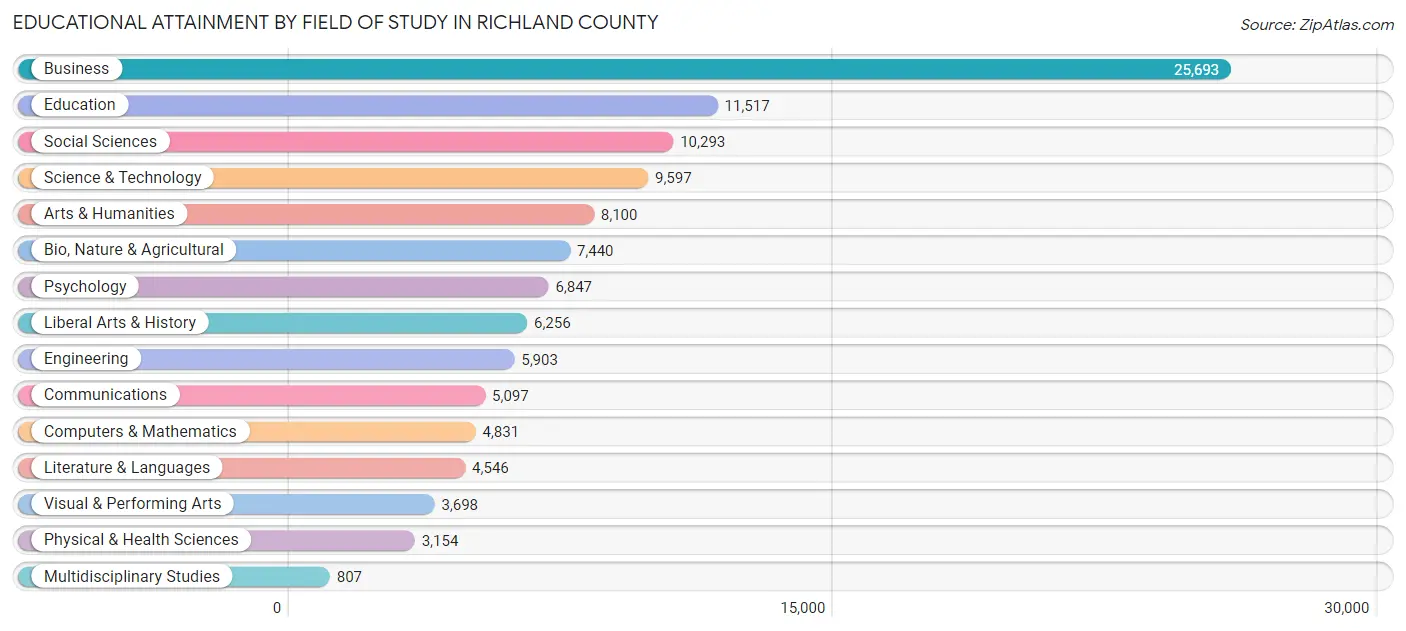
| Field of Study | # Graduates | % Graduates |
| Computers & Mathematics | 4,831 | 4.3% |
| Bio, Nature & Agricultural | 7,440 | 6.5% |
| Physical & Health Sciences | 3,154 | 2.8% |
| Psychology | 6,847 | 6.0% |
| Social Sciences | 10,293 | 9.0% |
| Engineering | 5,903 | 5.2% |
| Multidisciplinary Studies | 807 | 0.7% |
| Science & Technology | 9,597 | 8.4% |
| Business | 25,693 | 22.6% |
| Education | 11,517 | 10.1% |
| Literature & Languages | 4,546 | 4.0% |
| Liberal Arts & History | 6,256 | 5.5% |
| Visual & Performing Arts | 3,698 | 3.3% |
| Communications | 5,097 | 4.5% |
| Arts & Humanities | 8,100 | 7.1% |
| Total | 113,779 | 100.0% |
Transportation & Commute in Richland County
Vehicle Availability by Sex in Richland County
The most prevalent vehicle ownership categories in Richland County are males with 2 vehicles (41,197, accounting for 44.6%) and females with 2 vehicles (39,225, making up 42.4%).
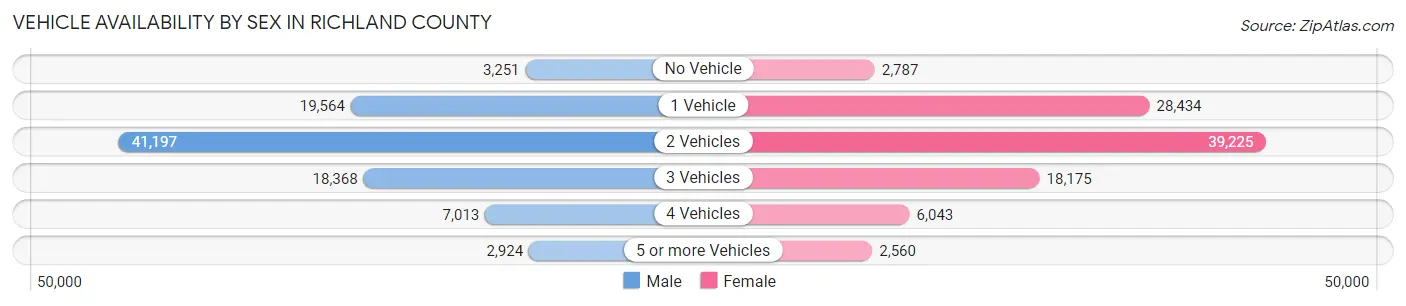
| Vehicles Available | Male | Female |
| No Vehicle | 3,251 (3.5%) | 2,787 (2.9%) |
| 1 Vehicle | 19,564 (21.2%) | 28,434 (29.2%) |
| 2 Vehicles | 41,197 (44.6%) | 39,225 (40.3%) |
| 3 Vehicles | 18,368 (19.9%) | 18,175 (18.7%) |
| 4 Vehicles | 7,013 (7.6%) | 6,043 (6.2%) |
| 5 or more Vehicles | 2,924 (3.2%) | 2,560 (2.6%) |
| Total | 92,317 (100.0%) | 97,224 (100.0%) |
Commute Time in Richland County
The most frequently occuring commute durations in Richland County are 15 to 19 minutes (32,458 commuters, 17.5%), 20 to 24 minutes (31,940 commuters, 17.2%), and 30 to 34 minutes (28,259 commuters, 15.2%).
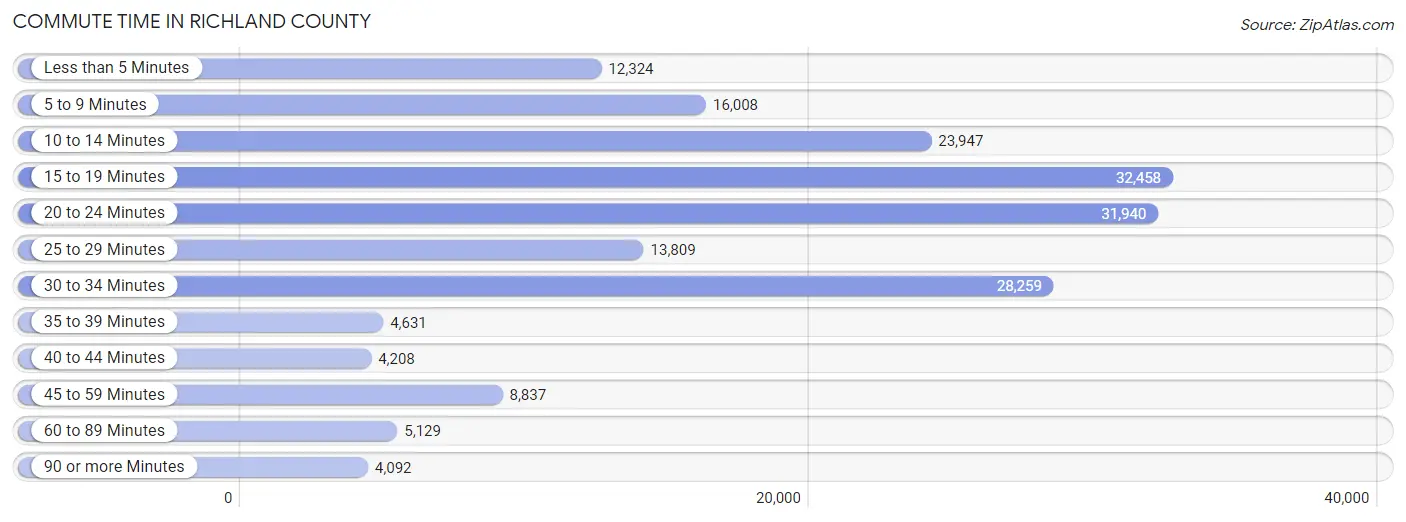
| Commute Time | # Commuters | % Commuters |
| Less than 5 Minutes | 12,324 | 6.6% |
| 5 to 9 Minutes | 16,008 | 8.6% |
| 10 to 14 Minutes | 23,947 | 12.9% |
| 15 to 19 Minutes | 32,458 | 17.5% |
| 20 to 24 Minutes | 31,940 | 17.2% |
| 25 to 29 Minutes | 13,809 | 7.4% |
| 30 to 34 Minutes | 28,259 | 15.2% |
| 35 to 39 Minutes | 4,631 | 2.5% |
| 40 to 44 Minutes | 4,208 | 2.3% |
| 45 to 59 Minutes | 8,837 | 4.8% |
| 60 to 89 Minutes | 5,129 | 2.8% |
| 90 or more Minutes | 4,092 | 2.2% |
Commute Time by Sex in Richland County
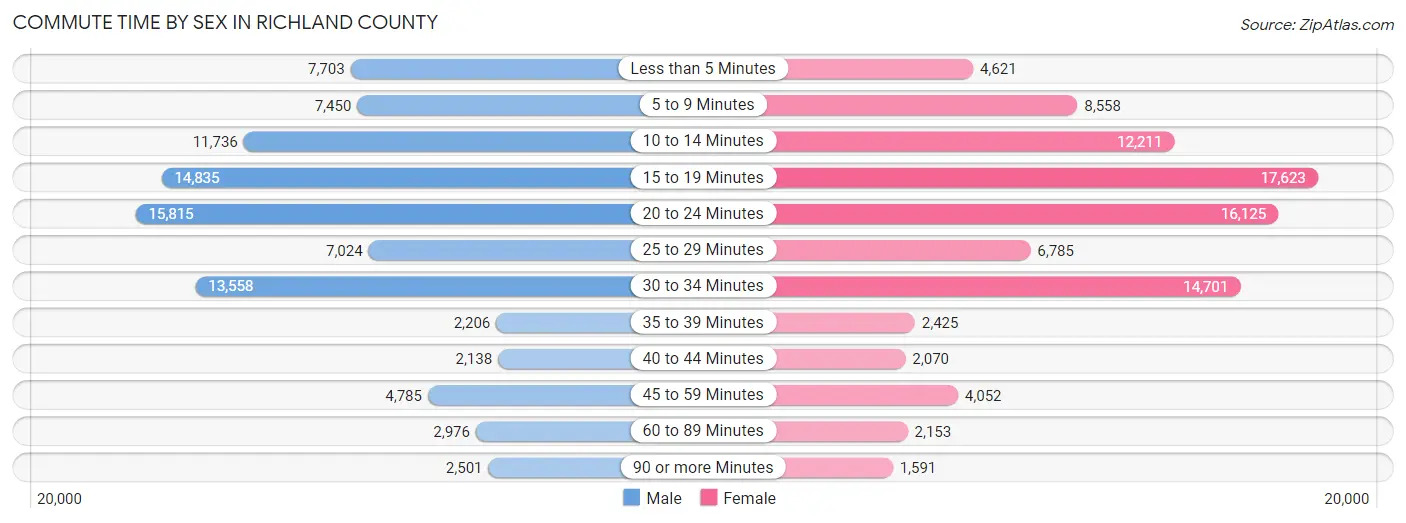
The most common commute times in Richland County are 20 to 24 minutes (15,815 commuters, 17.1%) for males and 15 to 19 minutes (17,623 commuters, 19.0%) for females.
| Commute Time | Male | Female |
| Less than 5 Minutes | 7,703 (8.3%) | 4,621 (5.0%) |
| 5 to 9 Minutes | 7,450 (8.0%) | 8,558 (9.2%) |
| 10 to 14 Minutes | 11,736 (12.7%) | 12,211 (13.1%) |
| 15 to 19 Minutes | 14,835 (16.0%) | 17,623 (19.0%) |
| 20 to 24 Minutes | 15,815 (17.1%) | 16,125 (17.3%) |
| 25 to 29 Minutes | 7,024 (7.6%) | 6,785 (7.3%) |
| 30 to 34 Minutes | 13,558 (14.6%) | 14,701 (15.8%) |
| 35 to 39 Minutes | 2,206 (2.4%) | 2,425 (2.6%) |
| 40 to 44 Minutes | 2,138 (2.3%) | 2,070 (2.2%) |
| 45 to 59 Minutes | 4,785 (5.2%) | 4,052 (4.4%) |
| 60 to 89 Minutes | 2,976 (3.2%) | 2,153 (2.3%) |
| 90 or more Minutes | 2,501 (2.7%) | 1,591 (1.7%) |
Time of Departure to Work by Sex in Richland County
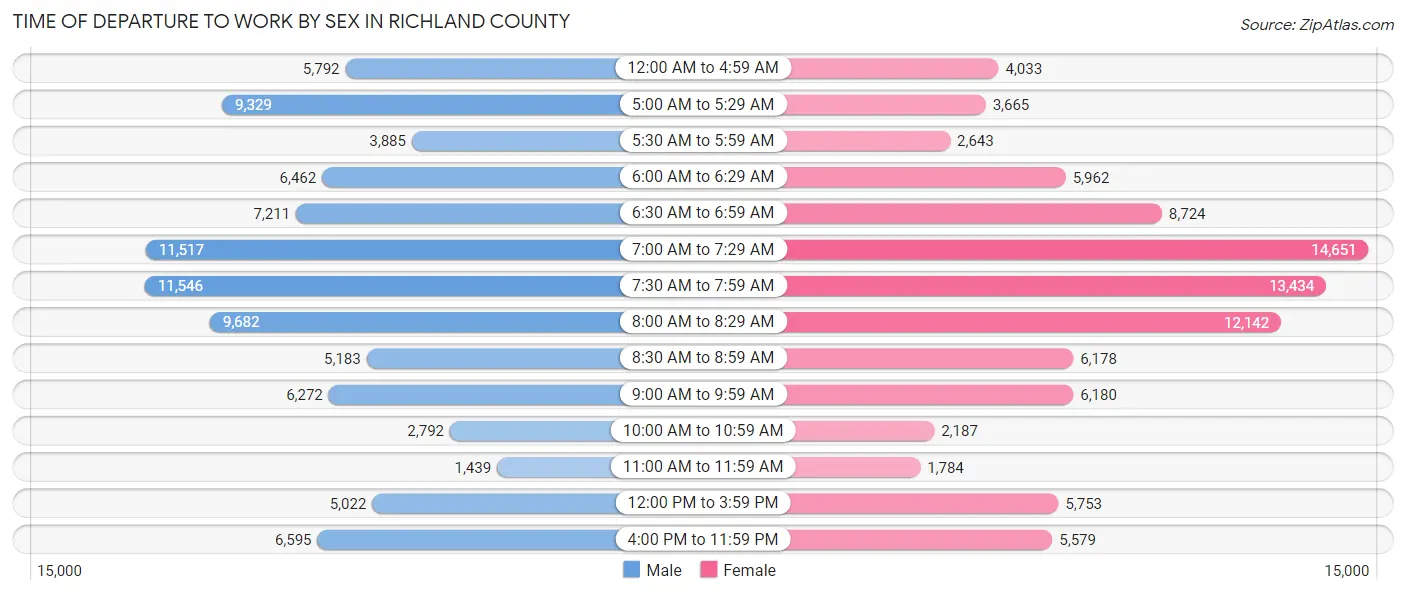
The most frequent times of departure to work in Richland County are 7:30 AM to 7:59 AM (11,546, 12.4%) for males and 7:00 AM to 7:29 AM (14,651, 15.8%) for females.
| Time of Departure | Male | Female |
| 12:00 AM to 4:59 AM | 5,792 (6.2%) | 4,033 (4.3%) |
| 5:00 AM to 5:29 AM | 9,329 (10.1%) | 3,665 (3.9%) |
| 5:30 AM to 5:59 AM | 3,885 (4.2%) | 2,643 (2.8%) |
| 6:00 AM to 6:29 AM | 6,462 (7.0%) | 5,962 (6.4%) |
| 6:30 AM to 6:59 AM | 7,211 (7.8%) | 8,724 (9.4%) |
| 7:00 AM to 7:29 AM | 11,517 (12.4%) | 14,651 (15.8%) |
| 7:30 AM to 7:59 AM | 11,546 (12.4%) | 13,434 (14.5%) |
| 8:00 AM to 8:29 AM | 9,682 (10.4%) | 12,142 (13.1%) |
| 8:30 AM to 8:59 AM | 5,183 (5.6%) | 6,178 (6.7%) |
| 9:00 AM to 9:59 AM | 6,272 (6.8%) | 6,180 (6.7%) |
| 10:00 AM to 10:59 AM | 2,792 (3.0%) | 2,187 (2.4%) |
| 11:00 AM to 11:59 AM | 1,439 (1.5%) | 1,784 (1.9%) |
| 12:00 PM to 3:59 PM | 5,022 (5.4%) | 5,753 (6.2%) |
| 4:00 PM to 11:59 PM | 6,595 (7.1%) | 5,579 (6.0%) |
| Total | 92,727 (100.0%) | 92,915 (100.0%) |
Housing Occupancy in Richland County
Occupancy by Ownership in Richland County
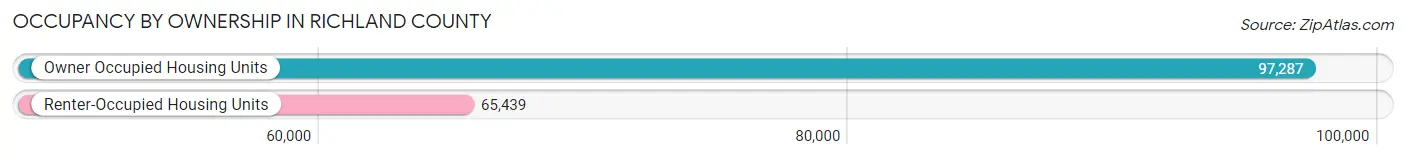
Of the total 162,726 dwellings in Richland County, owner-occupied units account for 97,287 (59.8%), while renter-occupied units make up 65,439 (40.2%).
| Occupancy | # Housing Units | % Housing Units |
| Owner Occupied Housing Units | 97,287 | 59.8% |
| Renter-Occupied Housing Units | 65,439 | 40.2% |
| Total Occupied Housing Units | 162,726 | 100.0% |
Occupancy by Household Size in Richland County
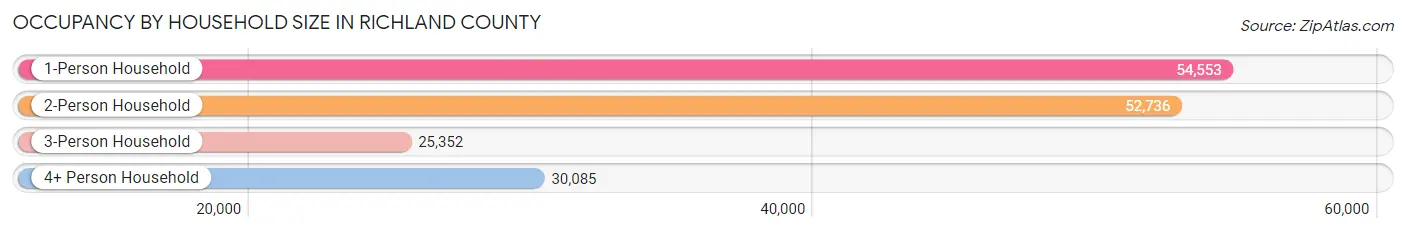
| Household Size | # Housing Units | % Housing Units |
| 1-Person Household | 54,553 | 33.5% |
| 2-Person Household | 52,736 | 32.4% |
| 3-Person Household | 25,352 | 15.6% |
| 4+ Person Household | 30,085 | 18.5% |
| Total Housing Units | 162,726 | 100.0% |
Occupancy by Ownership by Household Size in Richland County
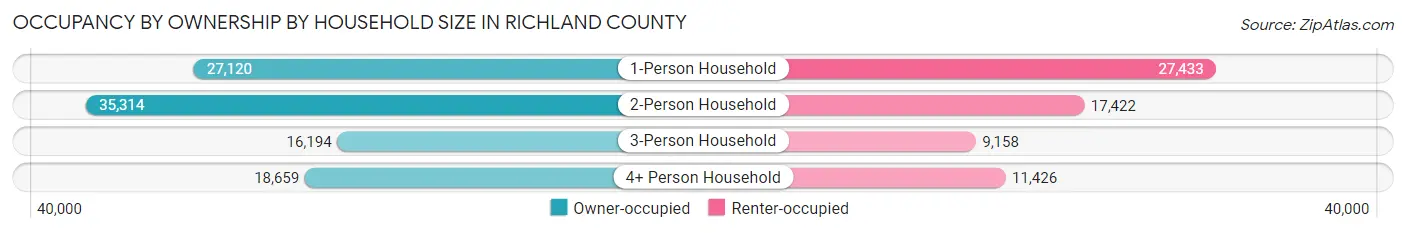
| Household Size | Owner-occupied | Renter-occupied |
| 1-Person Household | 27,120 (49.7%) | 27,433 (50.3%) |
| 2-Person Household | 35,314 (67.0%) | 17,422 (33.0%) |
| 3-Person Household | 16,194 (63.9%) | 9,158 (36.1%) |
| 4+ Person Household | 18,659 (62.0%) | 11,426 (38.0%) |
| Total Housing Units | 97,287 (59.8%) | 65,439 (40.2%) |
Occupancy by Educational Attainment in Richland County
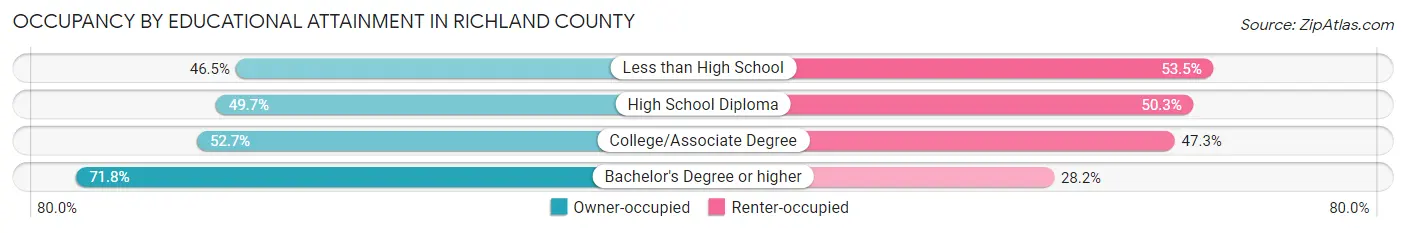
| Household Size | Owner-occupied | Renter-occupied |
| Less than High School | 4,591 (46.5%) | 5,283 (53.5%) |
| High School Diploma | 14,771 (49.7%) | 14,969 (50.3%) |
| College/Associate Degree | 28,789 (52.7%) | 25,885 (47.3%) |
| Bachelor's Degree or higher | 49,136 (71.8%) | 19,302 (28.2%) |
Occupancy by Age of Householder in Richland County
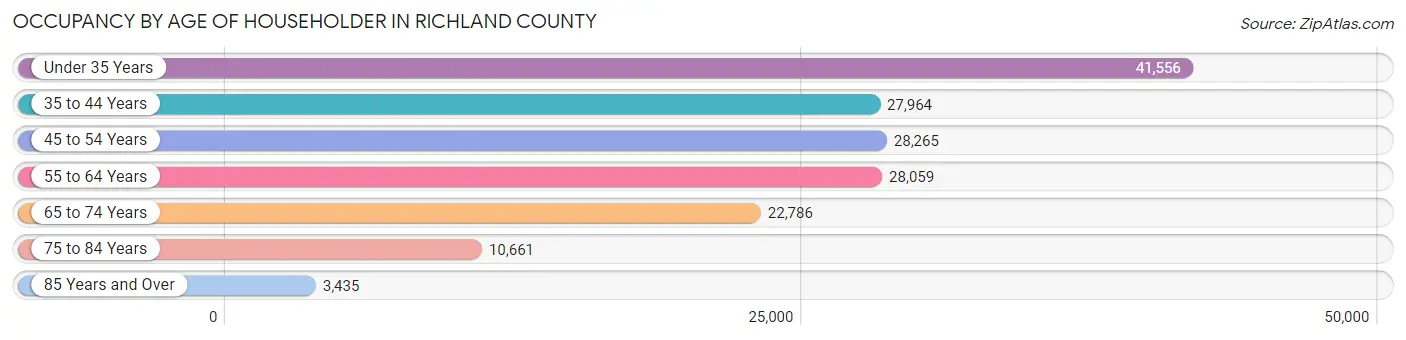
| Age Bracket | # Households | % Households |
| Under 35 Years | 41,556 | 25.5% |
| 35 to 44 Years | 27,964 | 17.2% |
| 45 to 54 Years | 28,265 | 17.4% |
| 55 to 64 Years | 28,059 | 17.2% |
| 65 to 74 Years | 22,786 | 14.0% |
| 75 to 84 Years | 10,661 | 6.6% |
| 85 Years and Over | 3,435 | 2.1% |
| Total | 162,726 | 100.0% |
Housing Finances in Richland County
Median Income by Occupancy in Richland County
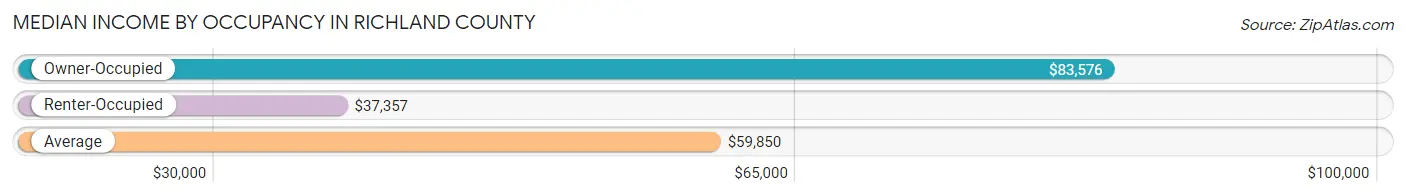
| Occupancy Type | # Households | Median Income |
| Owner-Occupied | 97,287 (59.8%) | $83,576 |
| Renter-Occupied | 65,439 (40.2%) | $37,357 |
| Average | 162,726 (100.0%) | $59,850 |
Occupancy by Householder Income Bracket in Richland County
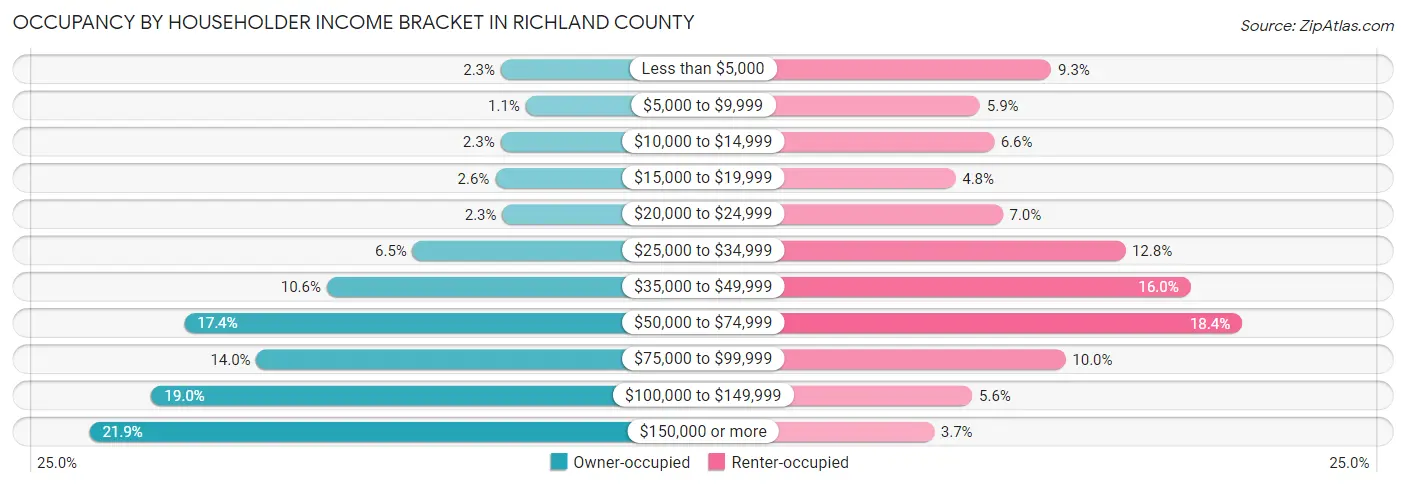
| Income Bracket | Owner-occupied | Renter-occupied |
| Less than $5,000 | 2,256 (2.3%) | 6,092 (9.3%) |
| $5,000 to $9,999 | 1,112 (1.1%) | 3,874 (5.9%) |
| $10,000 to $14,999 | 2,280 (2.3%) | 4,309 (6.6%) |
| $15,000 to $19,999 | 2,518 (2.6%) | 3,106 (4.8%) |
| $20,000 to $24,999 | 2,188 (2.2%) | 4,580 (7.0%) |
| $25,000 to $34,999 | 6,341 (6.5%) | 8,393 (12.8%) |
| $35,000 to $49,999 | 10,323 (10.6%) | 10,439 (16.0%) |
| $50,000 to $74,999 | 16,921 (17.4%) | 12,038 (18.4%) |
| $75,000 to $99,999 | 13,586 (14.0%) | 6,540 (10.0%) |
| $100,000 to $149,999 | 18,450 (19.0%) | 3,630 (5.6%) |
| $150,000 or more | 21,312 (21.9%) | 2,438 (3.7%) |
| Total | 97,287 (100.0%) | 65,439 (100.0%) |
Monthly Housing Cost Tiers in Richland County
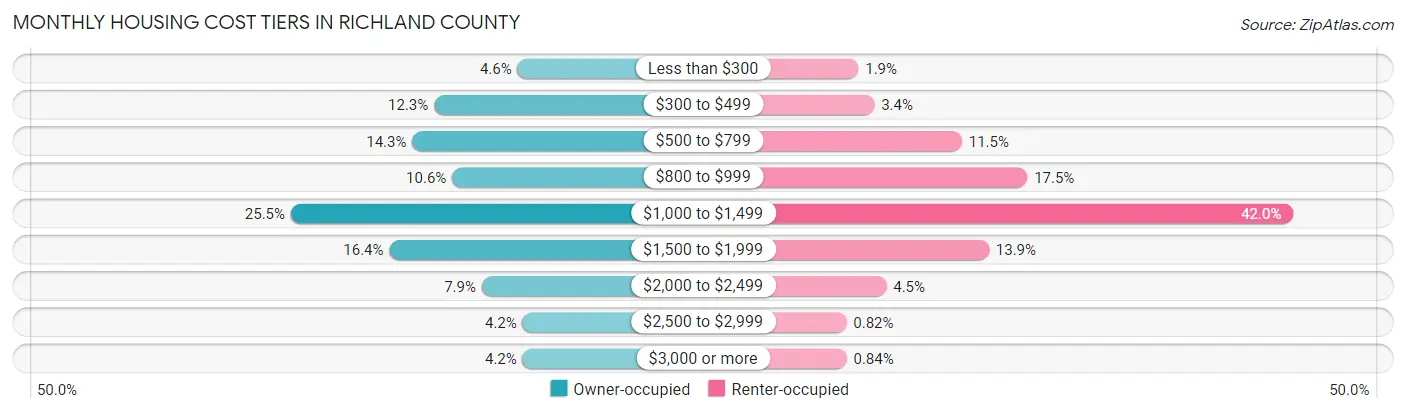
| Monthly Cost | Owner-occupied | Renter-occupied |
| Less than $300 | 4,494 (4.6%) | 1,259 (1.9%) |
| $300 to $499 | 11,968 (12.3%) | 2,219 (3.4%) |
| $500 to $799 | 13,922 (14.3%) | 7,493 (11.5%) |
| $800 to $999 | 10,354 (10.6%) | 11,429 (17.5%) |
| $1,000 to $1,499 | 24,802 (25.5%) | 27,460 (42.0%) |
| $1,500 to $1,999 | 15,971 (16.4%) | 9,120 (13.9%) |
| $2,000 to $2,499 | 7,696 (7.9%) | 2,946 (4.5%) |
| $2,500 to $2,999 | 4,041 (4.2%) | 534 (0.8%) |
| $3,000 or more | 4,039 (4.2%) | 550 (0.8%) |
| Total | 97,287 (100.0%) | 65,439 (100.0%) |
Physical Housing Characteristics in Richland County
Housing Structures in Richland County
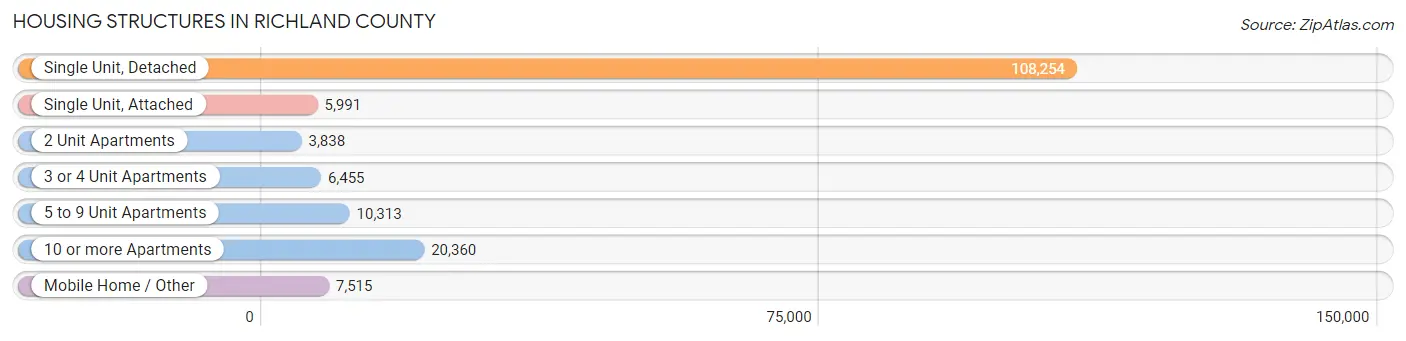
| Structure Type | # Housing Units | % Housing Units |
| Single Unit, Detached | 108,254 | 66.5% |
| Single Unit, Attached | 5,991 | 3.7% |
| 2 Unit Apartments | 3,838 | 2.4% |
| 3 or 4 Unit Apartments | 6,455 | 4.0% |
| 5 to 9 Unit Apartments | 10,313 | 6.3% |
| 10 or more Apartments | 20,360 | 12.5% |
| Mobile Home / Other | 7,515 | 4.6% |
| Total | 162,726 | 100.0% |
Housing Structures by Occupancy in Richland County
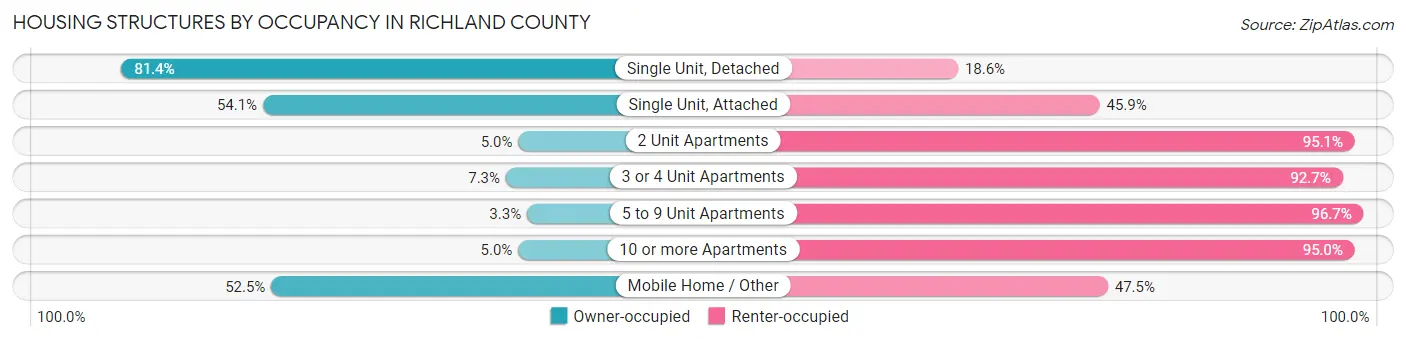
| Structure Type | Owner-occupied | Renter-occupied |
| Single Unit, Detached | 88,086 (81.4%) | 20,168 (18.6%) |
| Single Unit, Attached | 3,242 (54.1%) | 2,749 (45.9%) |
| 2 Unit Apartments | 190 (5.0%) | 3,648 (95.1%) |
| 3 or 4 Unit Apartments | 474 (7.3%) | 5,981 (92.7%) |
| 5 to 9 Unit Apartments | 337 (3.3%) | 9,976 (96.7%) |
| 10 or more Apartments | 1,011 (5.0%) | 19,349 (95.0%) |
| Mobile Home / Other | 3,947 (52.5%) | 3,568 (47.5%) |
| Total | 97,287 (59.8%) | 65,439 (40.2%) |
Housing Structures by Number of Rooms in Richland County
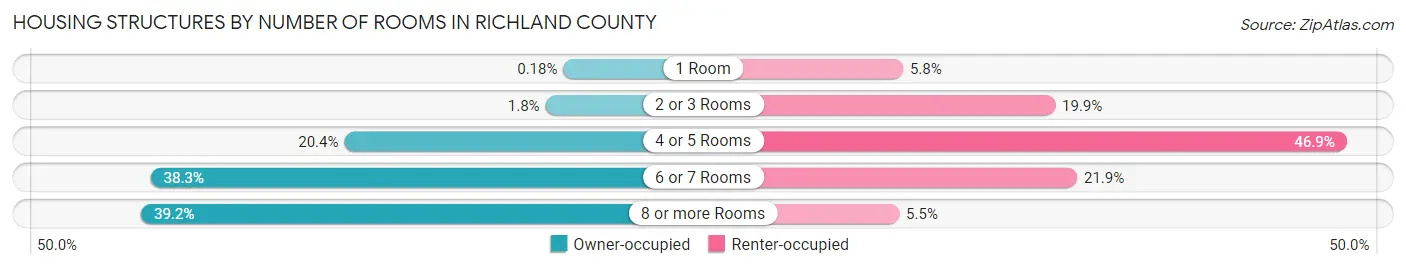
| Number of Rooms | Owner-occupied | Renter-occupied |
| 1 Room | 176 (0.2%) | 3,816 (5.8%) |
| 2 or 3 Rooms | 1,776 (1.8%) | 13,022 (19.9%) |
| 4 or 5 Rooms | 19,872 (20.4%) | 30,665 (46.9%) |
| 6 or 7 Rooms | 37,302 (38.3%) | 14,350 (21.9%) |
| 8 or more Rooms | 38,161 (39.2%) | 3,586 (5.5%) |
| Total | 97,287 (100.0%) | 65,439 (100.0%) |
Housing Structure by Heating Type in Richland County
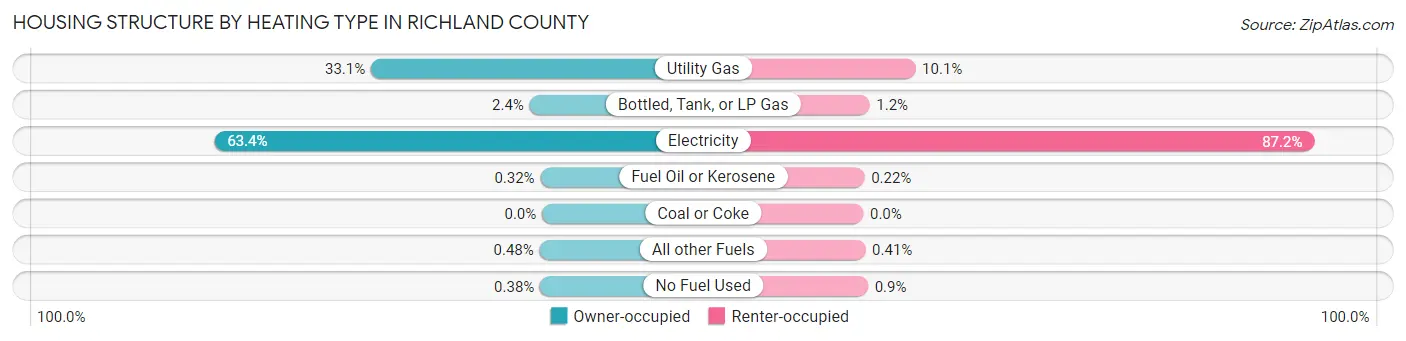
| Heating Type | Owner-occupied | Renter-occupied |
| Utility Gas | 32,165 (33.1%) | 6,587 (10.1%) |
| Bottled, Tank, or LP Gas | 2,338 (2.4%) | 800 (1.2%) |
| Electricity | 61,638 (63.4%) | 57,048 (87.2%) |
| Fuel Oil or Kerosene | 309 (0.3%) | 147 (0.2%) |
| Coal or Coke | 0 (0.0%) | 0 (0.0%) |
| All other Fuels | 467 (0.5%) | 266 (0.4%) |
| No Fuel Used | 370 (0.4%) | 591 (0.9%) |
| Total | 97,287 (100.0%) | 65,439 (100.0%) |
Household Vehicle Usage in Richland County
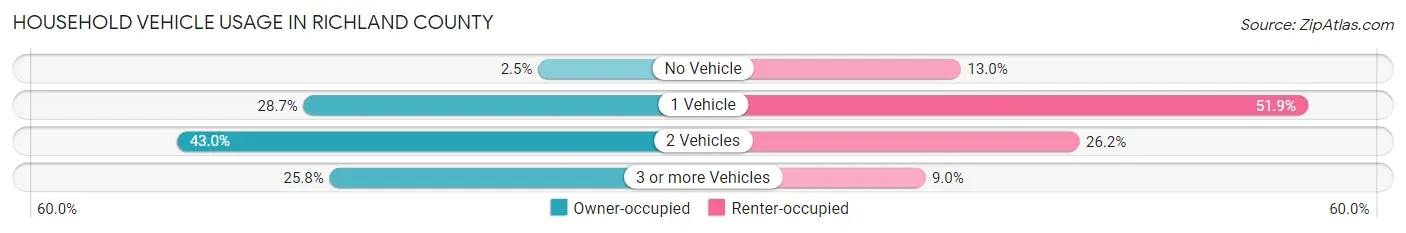
| Vehicles per Household | Owner-occupied | Renter-occupied |
| No Vehicle | 2,396 (2.5%) | 8,472 (13.0%) |
| 1 Vehicle | 27,959 (28.7%) | 33,929 (51.8%) |
| 2 Vehicles | 41,795 (43.0%) | 17,165 (26.2%) |
| 3 or more Vehicles | 25,137 (25.8%) | 5,873 (9.0%) |
| Total | 97,287 (100.0%) | 65,439 (100.0%) |
Real Estate & Mortgages in Richland County
Real Estate and Mortgage Overview in Richland County
| Characteristic | Without Mortgage | With Mortgage |
| Housing Units | 30,802 | 66,485 |
| Median Property Value | $177,400 | $211,600 |
| Median Household Income | $62,363 | $15,855 |
| Monthly Housing Costs | $490 | $3,902 |
| Real Estate Taxes | $1,248 | $3,007 |
Property Value by Mortgage Status in Richland County
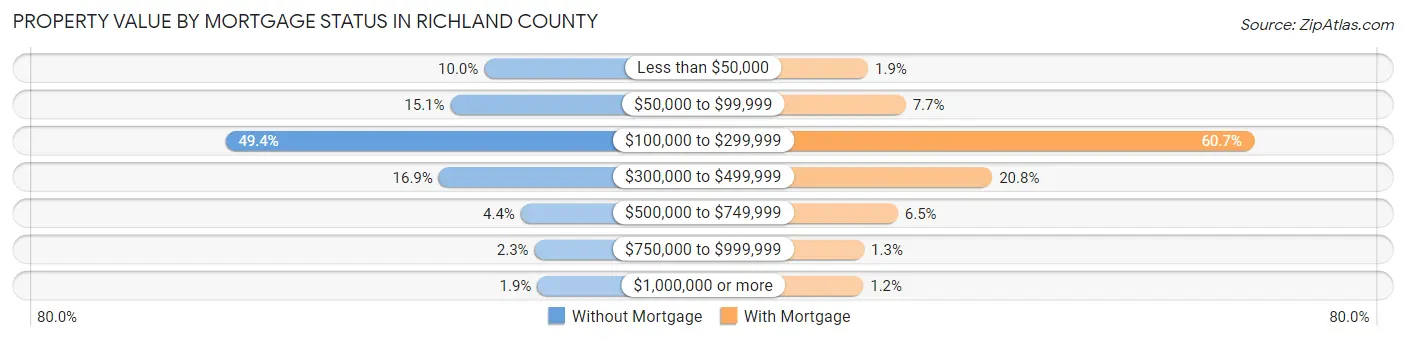
| Property Value | Without Mortgage | With Mortgage |
| Less than $50,000 | 3,073 (10.0%) | 1,271 (1.9%) |
| $50,000 to $99,999 | 4,656 (15.1%) | 5,085 (7.6%) |
| $100,000 to $299,999 | 15,213 (49.4%) | 40,336 (60.7%) |
| $300,000 to $499,999 | 5,209 (16.9%) | 13,849 (20.8%) |
| $500,000 to $749,999 | 1,357 (4.4%) | 4,290 (6.5%) |
| $750,000 to $999,999 | 711 (2.3%) | 871 (1.3%) |
| $1,000,000 or more | 583 (1.9%) | 783 (1.2%) |
| Total | 30,802 (100.0%) | 66,485 (100.0%) |
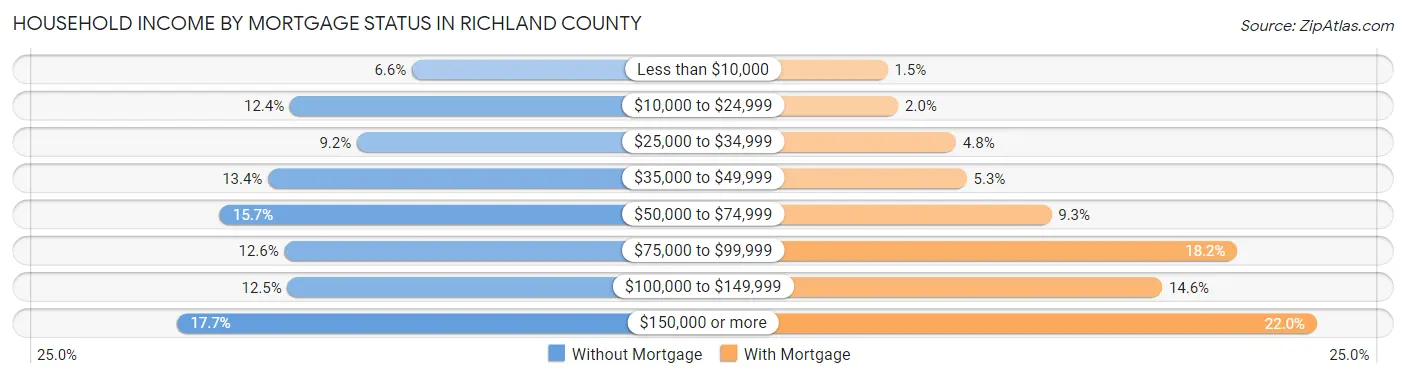
Household Income by Mortgage Status in Richland County
| Household Income | Without Mortgage | With Mortgage |
| Less than $10,000 | 2,016 (6.6%) | 1,008 (1.5%) |
| $10,000 to $24,999 | 3,807 (12.4%) | 1,352 (2.0%) |
| $25,000 to $34,999 | 2,825 (9.2%) | 3,179 (4.8%) |
| $35,000 to $49,999 | 4,128 (13.4%) | 3,516 (5.3%) |
| $50,000 to $74,999 | 4,837 (15.7%) | 6,195 (9.3%) |
| $75,000 to $99,999 | 3,888 (12.6%) | 12,084 (18.2%) |
| $100,000 to $149,999 | 3,844 (12.5%) | 9,698 (14.6%) |
| $150,000 or more | 5,457 (17.7%) | 14,606 (22.0%) |
| Total | 30,802 (100.0%) | 66,485 (100.0%) |
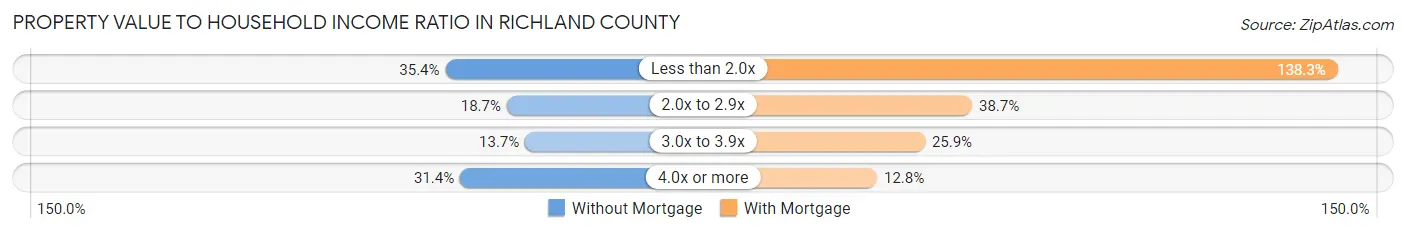
Property Value to Household Income Ratio in Richland County
| Value-to-Income Ratio | Without Mortgage | With Mortgage |
| Less than 2.0x | 10,899 (35.4%) | 91,963 (138.3%) |
| 2.0x to 2.9x | 5,745 (18.6%) | 25,743 (38.7%) |
| 3.0x to 3.9x | 4,203 (13.7%) | 17,211 (25.9%) |
| 4.0x or more | 9,667 (31.4%) | 8,534 (12.8%) |
| Total | 30,802 (100.0%) | 66,485 (100.0%) |
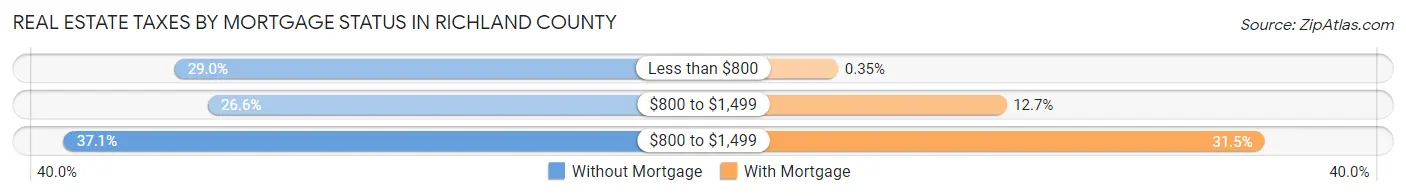
Real Estate Taxes by Mortgage Status in Richland County
| Property Taxes | Without Mortgage | With Mortgage |
| Less than $800 | 8,942 (29.0%) | 230 (0.4%) |
| $800 to $1,499 | 8,193 (26.6%) | 8,413 (12.7%) |
| $800 to $1,499 | 11,437 (37.1%) | 20,958 (31.5%) |
| Total | 30,802 (100.0%) | 66,485 (100.0%) |
Health & Disability in Richland County
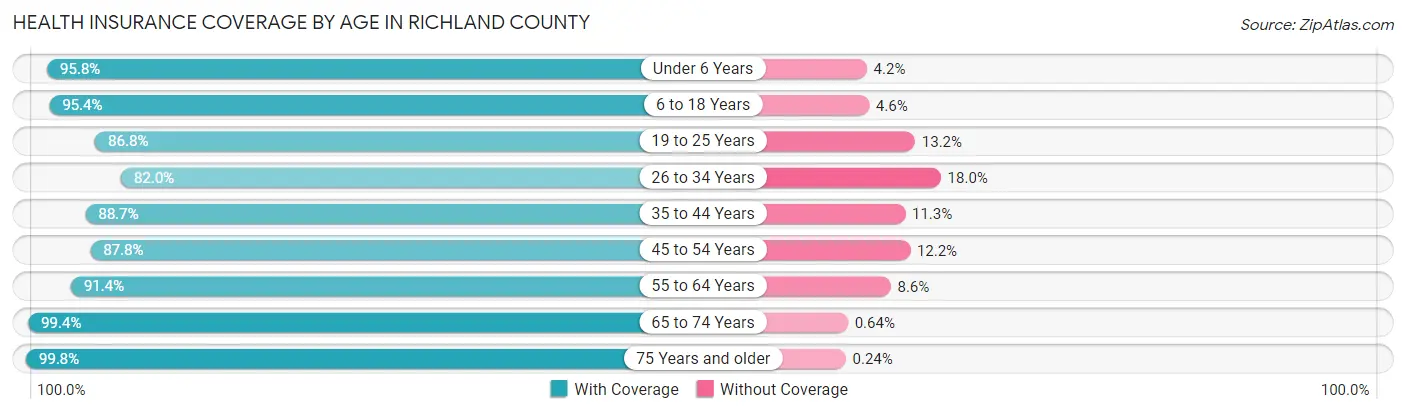
Health Insurance Coverage by Age in Richland County
| Age Bracket | With Coverage | Without Coverage |
| Under 6 Years | 25,965 (95.8%) | 1,131 (4.2%) |
| 6 to 18 Years | 67,690 (95.4%) | 3,255 (4.6%) |
| 19 to 25 Years | 43,996 (86.8%) | 6,670 (13.2%) |
| 26 to 34 Years | 40,525 (82.0%) | 8,876 (18.0%) |
| 35 to 44 Years | 43,390 (88.7%) | 5,541 (11.3%) |
| 45 to 54 Years | 40,665 (87.8%) | 5,672 (12.2%) |
| 55 to 64 Years | 42,845 (91.4%) | 4,040 (8.6%) |
| 65 to 74 Years | 34,156 (99.4%) | 221 (0.6%) |
| 75 Years and older | 19,895 (99.8%) | 48 (0.2%) |
| Total | 359,127 (91.0%) | 35,454 (9.0%) |
Health Insurance Coverage by Citizenship Status in Richland County
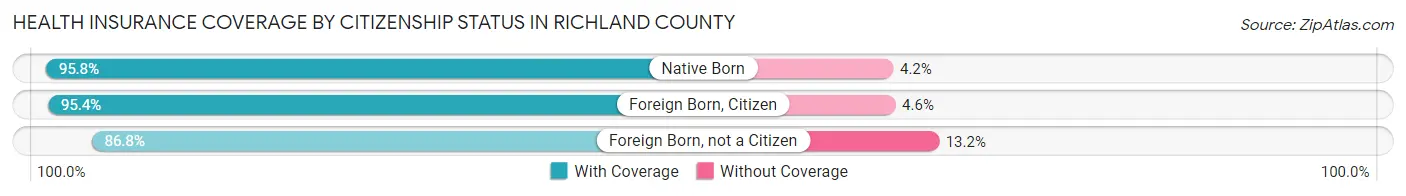
| Citizenship Status | With Coverage | Without Coverage |
| Native Born | 25,965 (95.8%) | 1,131 (4.2%) |
| Foreign Born, Citizen | 67,690 (95.4%) | 3,255 (4.6%) |
| Foreign Born, not a Citizen | 43,996 (86.8%) | 6,670 (13.2%) |
Health Insurance Coverage by Household Income in Richland County
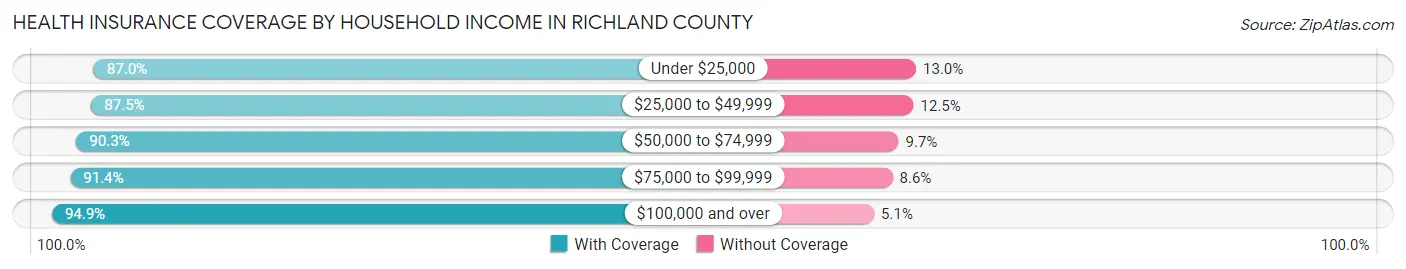
| Household Income | With Coverage | Without Coverage |
| Under $25,000 | 52,045 (87.0%) | 7,769 (13.0%) |
| $25,000 to $49,999 | 60,267 (87.5%) | 8,623 (12.5%) |
| $50,000 to $74,999 | 61,099 (90.3%) | 6,570 (9.7%) |
| $75,000 to $99,999 | 47,494 (91.4%) | 4,459 (8.6%) |
| $100,000 and over | 127,794 (94.9%) | 6,906 (5.1%) |
Public vs Private Health Insurance Coverage by Age in Richland County
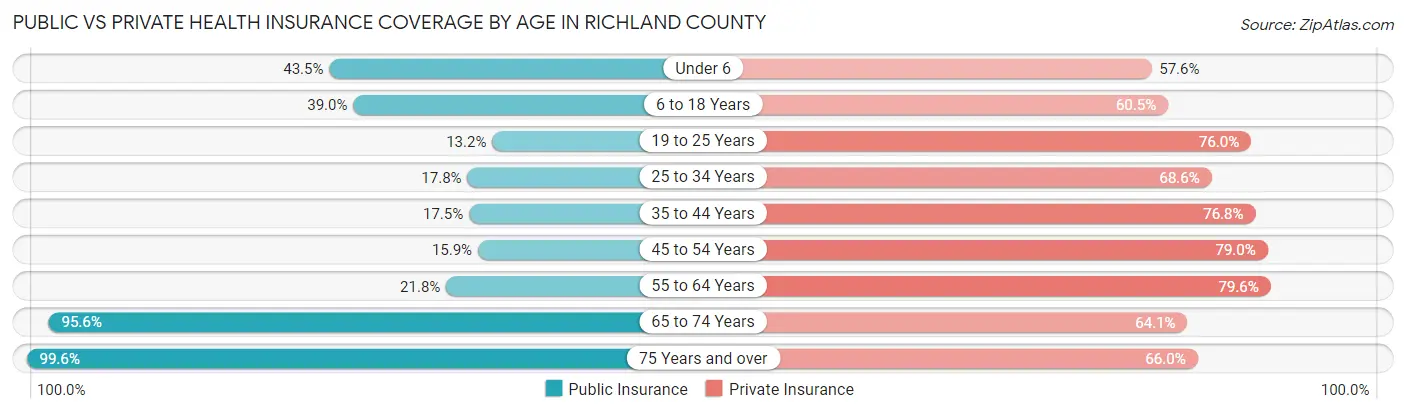
| Age Bracket | Public Insurance | Private Insurance |
| Under 6 | 11,772 (43.4%) | 15,619 (57.6%) |
| 6 to 18 Years | 27,659 (39.0%) | 42,951 (60.5%) |
| 19 to 25 Years | 6,687 (13.2%) | 38,487 (76.0%) |
| 25 to 34 Years | 8,796 (17.8%) | 33,901 (68.6%) |
| 35 to 44 Years | 8,563 (17.5%) | 37,556 (76.7%) |
| 45 to 54 Years | 7,343 (15.9%) | 36,616 (79.0%) |
| 55 to 64 Years | 10,199 (21.7%) | 37,314 (79.6%) |
| 65 to 74 Years | 32,847 (95.6%) | 22,048 (64.1%) |
| 75 Years and over | 19,870 (99.6%) | 13,164 (66.0%) |
| Total | 133,736 (33.9%) | 277,656 (70.4%) |
Disability Status by Sex by Age in Richland County
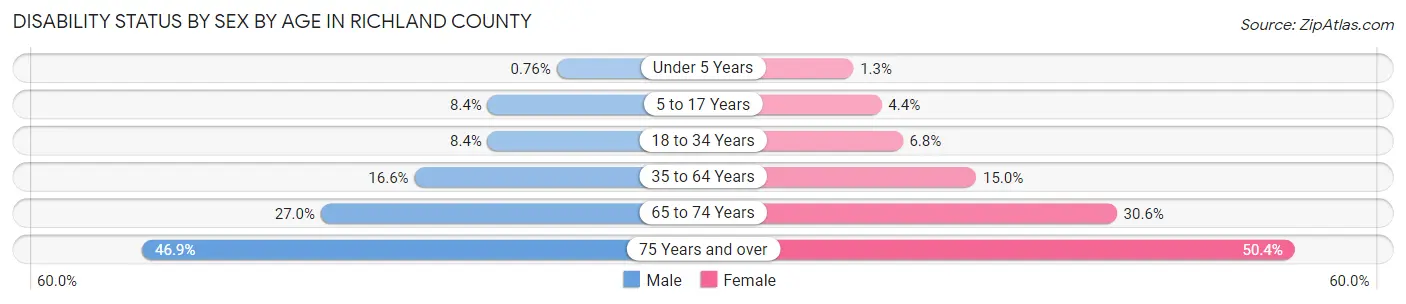
| Age Bracket | Male | Female |
| Under 5 Years | 91 (0.8%) | 145 (1.3%) |
| 5 to 17 Years | 2,782 (8.4%) | 1,424 (4.4%) |
| 18 to 34 Years | 4,377 (8.4%) | 3,887 (6.8%) |
| 35 to 64 Years | 10,892 (16.6%) | 11,439 (14.9%) |
| 65 to 74 Years | 4,114 (27.0%) | 5,861 (30.6%) |
| 75 Years and over | 3,603 (46.9%) | 6,185 (50.4%) |
Disability Class by Sex by Age in Richland County
Disability Class: Hearing Difficulty
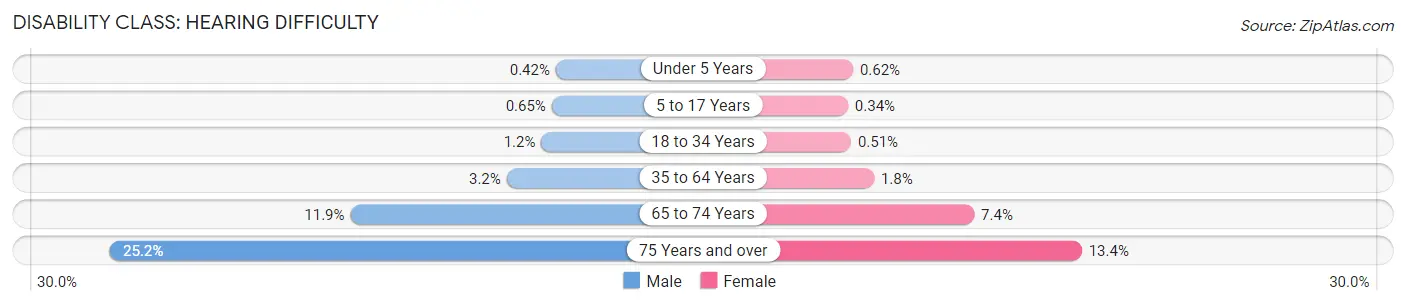
| Age Bracket | Male | Female |
| Under 5 Years | 50 (0.4%) | 71 (0.6%) |
| 5 to 17 Years | 214 (0.6%) | 111 (0.3%) |
| 18 to 34 Years | 640 (1.2%) | 296 (0.5%) |
| 35 to 64 Years | 2,077 (3.2%) | 1,366 (1.8%) |
| 65 to 74 Years | 1,806 (11.9%) | 1,412 (7.4%) |
| 75 Years and over | 1,938 (25.2%) | 1,638 (13.4%) |
Disability Class: Vision Difficulty
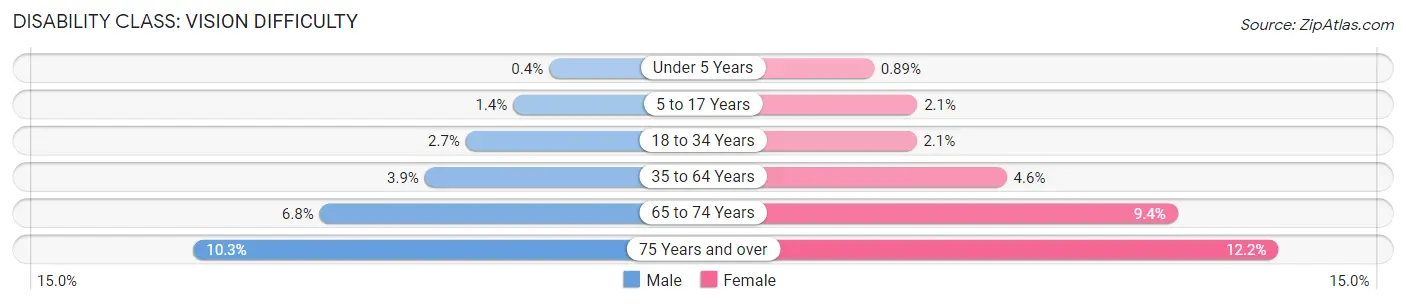
| Age Bracket | Male | Female |
| Under 5 Years | 48 (0.4%) | 102 (0.9%) |
| 5 to 17 Years | 462 (1.4%) | 680 (2.1%) |
| 18 to 34 Years | 1,410 (2.7%) | 1,194 (2.1%) |
| 35 to 64 Years | 2,533 (3.9%) | 3,511 (4.6%) |
| 65 to 74 Years | 1,034 (6.8%) | 1,791 (9.3%) |
| 75 Years and over | 791 (10.3%) | 1,490 (12.1%) |
Disability Class: Cognitive Difficulty
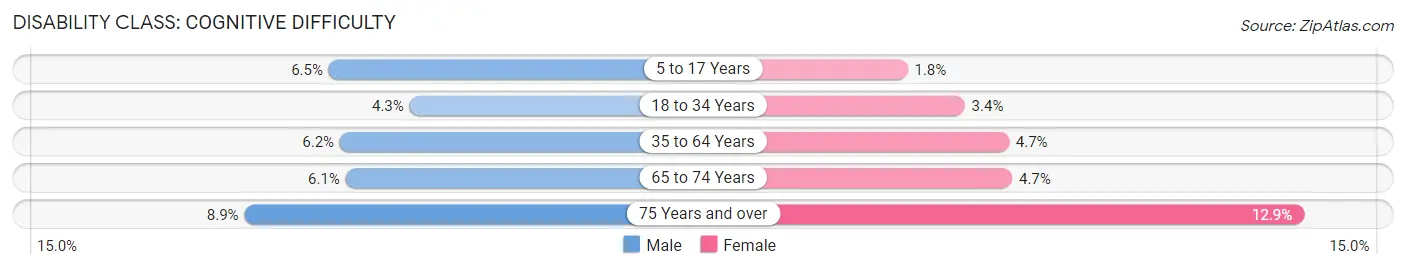
| Age Bracket | Male | Female |
| 5 to 17 Years | 2,156 (6.5%) | 591 (1.8%) |
| 18 to 34 Years | 2,221 (4.3%) | 1,965 (3.4%) |
| 35 to 64 Years | 4,082 (6.2%) | 3,555 (4.6%) |
| 65 to 74 Years | 923 (6.1%) | 908 (4.7%) |
| 75 Years and over | 682 (8.9%) | 1,578 (12.9%) |
Disability Class: Ambulatory Difficulty
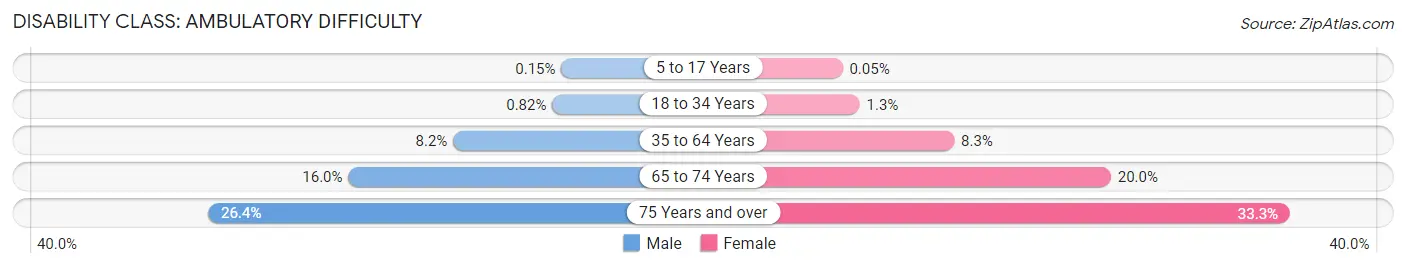
| Age Bracket | Male | Female |
| 5 to 17 Years | 49 (0.2%) | 16 (0.1%) |
| 18 to 34 Years | 424 (0.8%) | 759 (1.3%) |
| 35 to 64 Years | 5,370 (8.2%) | 6,381 (8.3%) |
| 65 to 74 Years | 2,431 (16.0%) | 3,824 (20.0%) |
| 75 Years and over | 2,026 (26.4%) | 4,080 (33.3%) |
Disability Class: Self-Care Difficulty
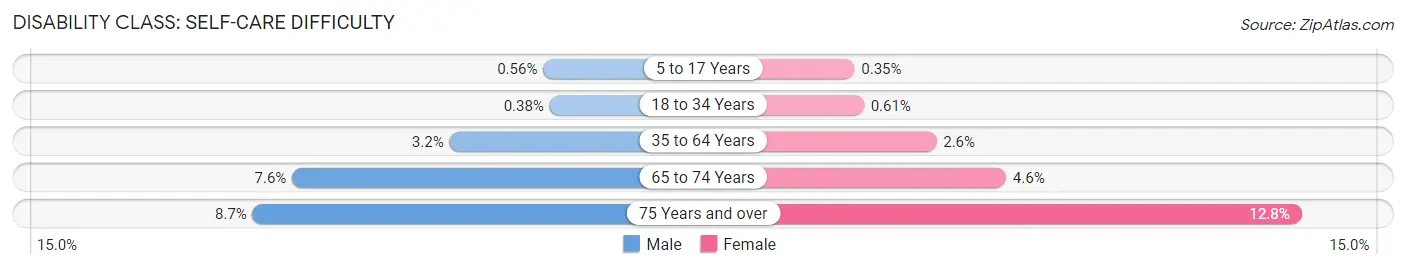
| Age Bracket | Male | Female |
| 5 to 17 Years | 185 (0.6%) | 113 (0.4%) |
| 18 to 34 Years | 198 (0.4%) | 353 (0.6%) |
| 35 to 64 Years | 2,080 (3.2%) | 2,011 (2.6%) |
| 65 to 74 Years | 1,150 (7.5%) | 875 (4.6%) |
| 75 Years and over | 664 (8.6%) | 1,570 (12.8%) |
Technology Access in Richland County
Computing Device Access in Richland County
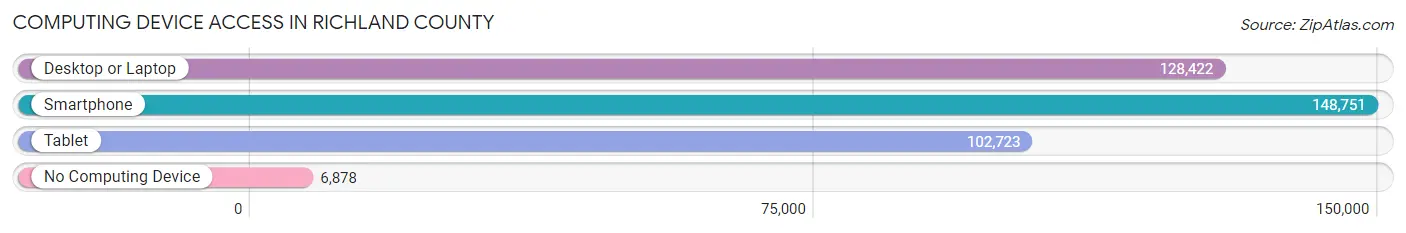
| Device Type | # Households | % Households |
| Desktop or Laptop | 128,422 | 78.9% |
| Smartphone | 148,751 | 91.4% |
| Tablet | 102,723 | 63.1% |
| No Computing Device | 6,878 | 4.2% |
| Total | 162,726 | 100.0% |
Internet Access in Richland County
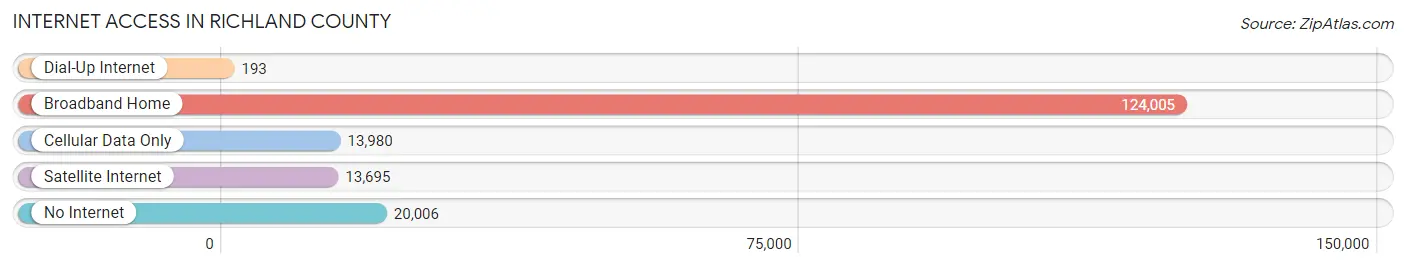
| Internet Type | # Households | % Households |
| Dial-Up Internet | 193 | 0.1% |
| Broadband Home | 124,005 | 76.2% |
| Cellular Data Only | 13,980 | 8.6% |
| Satellite Internet | 13,695 | 8.4% |
| No Internet | 20,006 | 12.3% |
| Total | 162,726 | 100.0% |
Richland County Summary
Richland County, South Carolina is located in the Midlands region of the state and is the second most populous county in the state. It is bordered by Lexington County to the west, Kershaw County to the east, Fairfield County to the north, and Calhoun and Sumter counties to the south. The county seat is Columbia, the state capital.
History
Richland County was established in 1785 and was named for its rich soil. The county was originally part of the larger Camden District, which was divided into smaller counties in 1791. The county was home to several Native American tribes, including the Catawba, Congaree, and Waxhaw.
The county was home to several prominent figures in South Carolina history, including John C. Calhoun, who served as a U.S. Senator and Vice President of the United States. The county was also home to the first African-American college in the United States, Benedict College, which was founded in 1870.
Geography
Richland County covers an area of 776 square miles and is located in the Midlands region of South Carolina. The county is bordered by Lexington County to the west, Kershaw County to the east, Fairfield County to the north, and Calhoun and Sumter counties to the south. The county is home to several rivers, including the Congaree, Saluda, and Broad rivers.
The county is home to several state parks, including Congaree National Park, Sesquicentennial State Park, and Lake Murray State Park. The county is also home to several lakes, including Lake Murray, Lake Wateree, and Lake Marion.
Economy
Richland County has a diverse economy, with a mix of manufacturing, retail, and service industries. The county is home to several major employers, including the University of South Carolina, Palmetto Health, and the South Carolina State Government.
The county is also home to several major shopping centers, including the Columbia Place Mall, the Village at Sandhill, and the Columbia Metropolitan Convention Center.
Demographics
As of the 2010 census, Richland County had a population of 384,504. The population was 54.2% White, 37.7% African American, 4.2% Hispanic or Latino, 2.2% Asian, and 0.7% Native American. The median household income was $45,890, and the median family income was $54,817.
Richland County is home to several major universities, including the University of South Carolina, Benedict College, and Columbia College. The county is also home to several major hospitals, including Palmetto Health Richland and Palmetto Health Baptist.
Common Questions
What is Per Capita Income in Richland County?
Per Capita income in Richland County is $35,720.
What is the Median Family Income in Richland County?
Median Family Income in Richland County is $81,801.
What is the Median Household income in Richland County?
Median Household Income in Richland County is $59,850.
What is Income or Wage Gap in Richland County?
Income or Wage Gap in Richland County is 17.0%.
Women in Richland County earn 83.0 cents for every dollar earned by a man.
What is Family Income Deficit in Richland County?
Family Income Deficit in Richland County is $12,293.
Families that are below poverty line in Richland County earn $12,293 less on average than the poverty threshold level.
What is Inequality or Gini Index in Richland County?
Inequality or Gini Index in Richland County is 0.49.
What is the Total Population of Richland County?
Total Population of Richland County is 416,161.
What is the Total Male Population of Richland County?
Total Male Population of Richland County is 200,680.
What is the Total Female Population of Richland County?
Total Female Population of Richland County is 215,481.
What is the Ratio of Males per 100 Females in Richland County?
There are 93.13 Males per 100 Females in Richland County.
What is the Ratio of Females per 100 Males in Richland County?
There are 107.38 Females per 100 Males in Richland County.
What is the Median Population Age in Richland County?
Median Population Age in Richland County is 33.9 Years.
What is the Average Family Size in Richland County
Average Family Size in Richland County is 3.1 People.
What is the Average Household Size in Richland County
Average Household Size in Richland County is 2.4 People.
How Large is the Labor Force in Richland County?
There are 221,068 People in the Labor Forcein in Richland County.
What is the Percentage of People in the Labor Force in Richland County?
65.5% of People are in the Labor Force in Richland County.
What is the Unemployment Rate in Richland County?
Unemployment Rate in Richland County is 6.8%.