Cities with the Most Immigrants from Scotland in the United States
RELATED REPORTS & OPTIONS
Scotland
United States
Compare Cities
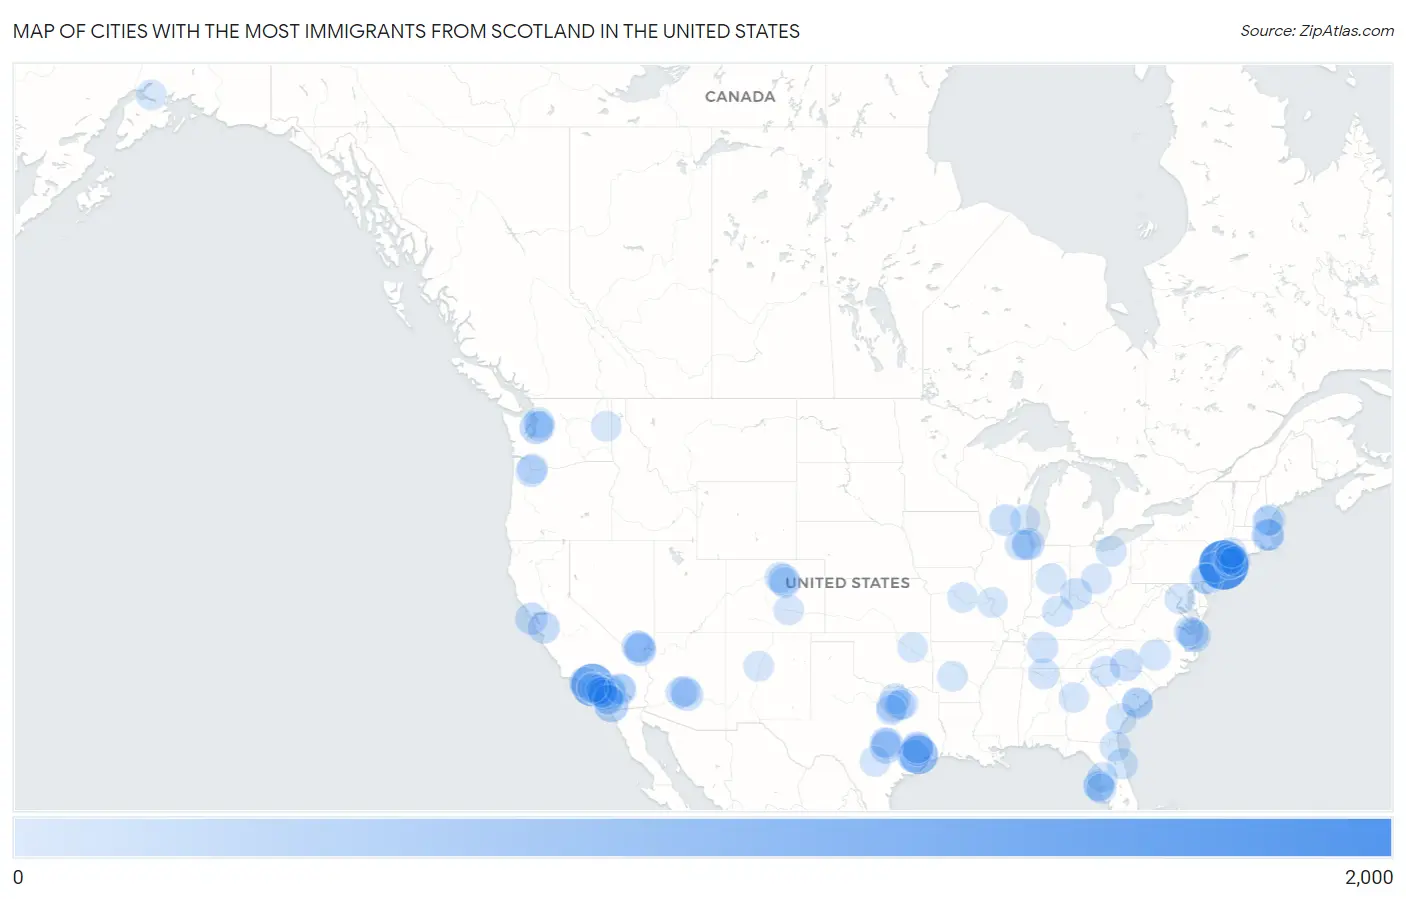
Map of Cities with the Most Immigrants from Scotland in the United States
0
2,000
Cities with the Most Immigrants from Scotland in the United States
| City | Scotland | vs State | vs National | |
| 1. | New York | 1,653 | 5,087(32.49%)#1 | 57,530(2.87%)#1 |
| 2. | Los Angeles | 1,065 | 8,444(12.61%)#1 | 57,530(1.85%)#2 |
| 3. | Houston | 720 | 5,917(12.17%)#1 | 57,530(1.25%)#3 |
| 4. | San Diego | 412 | 8,444(4.88%)#2 | 57,530(0.72%)#4 |
| 5. | Seattle | 291 | 2,020(14.41%)#1 | 57,530(0.51%)#5 |
| 6. | Cinco Ranch | 265 | 5,917(4.48%)#2 | 57,530(0.46%)#6 |
| 7. | The Woodlands | 227 | 5,917(3.84%)#3 | 57,530(0.39%)#7 |
| 8. | San Francisco | 214 | 8,444(2.53%)#3 | 57,530(0.37%)#8 |
| 9. | San Jose | 213 | 8,444(2.52%)#4 | 57,530(0.37%)#9 |
| 10. | Henderson | 209 | 708(29.52%)#1 | 57,530(0.36%)#10 |
| 11. | Austin | 207 | 5,917(3.50%)#4 | 57,530(0.36%)#11 |
| 12. | Charlotte | 207 | 1,464(14.14%)#1 | 57,530(0.36%)#12 |
| 13. | Virginia Beach | 198 | 1,592(12.44%)#1 | 57,530(0.34%)#13 |
| 14. | Norfolk | 197 | 1,592(12.37%)#2 | 57,530(0.34%)#14 |
| 15. | Northglenn | 194 | 1,073(18.08%)#1 | 57,530(0.34%)#15 |
| 16. | Conroe | 192 | 5,917(3.24%)#5 | 57,530(0.33%)#16 |
| 17. | Chicago | 191 | 1,361(14.03%)#1 | 57,530(0.33%)#17 |
| 18. | Boston | 186 | 1,923(9.67%)#1 | 57,530(0.32%)#18 |
| 19. | Fort Worth | 183 | 5,917(3.09%)#6 | 57,530(0.32%)#19 |
| 20. | Las Vegas | 178 | 708(25.14%)#2 | 57,530(0.31%)#20 |
| 21. | Mesa | 172 | 1,279(13.45%)#1 | 57,530(0.30%)#21 |
| 22. | Madison | 172 | 702(24.50%)#1 | 57,530(0.30%)#22 |
| 23. | The Village Of Indian Hill | 164 | 1,424(11.52%)#1 | 57,530(0.29%)#23 |
| 24. | Temecula | 161 | 8,444(1.91%)#5 | 57,530(0.28%)#24 |
| 25. | Thousand Oaks | 152 | 8,444(1.80%)#6 | 57,530(0.26%)#25 |
| 26. | Round Rock | 150 | 5,917(2.54%)#7 | 57,530(0.26%)#26 |
| 27. | Portland | 149 | 803(18.56%)#1 | 57,530(0.26%)#27 |
| 28. | Nashville | 145 | 462(31.39%)#1 | 57,530(0.25%)#28 |
| 29. | Phoenix | 144 | 1,279(11.26%)#2 | 57,530(0.25%)#29 |
| 30. | Pleasantville | 138 | 5,087(2.71%)#2 | 57,530(0.24%)#30 |
| 31. | Hull | 137 | 1,923(7.12%)#2 | 57,530(0.24%)#31 |
| 32. | Clearwater | 135 | 5,920(2.28%)#1 | 57,530(0.23%)#32 |
| 33. | Garland | 130 | 5,917(2.20%)#8 | 57,530(0.23%)#33 |
| 34. | Menifee | 130 | 8,444(1.54%)#7 | 57,530(0.23%)#34 |
| 35. | Sunrise Manor | 126 | 708(17.80%)#3 | 57,530(0.22%)#35 |
| 36. | Huntington Station | 123 | 5,087(2.42%)#3 | 57,530(0.21%)#36 |
| 37. | Philadelphia | 122 | 1,747(6.98%)#1 | 57,530(0.21%)#37 |
| 38. | Ormond Beach | 121 | 5,920(2.04%)#2 | 57,530(0.21%)#38 |
| 39. | Cary | 119 | 1,464(8.13%)#2 | 57,530(0.21%)#39 |
| 40. | North Charleston | 119 | 1,092(10.90%)#1 | 57,530(0.21%)#40 |
| 41. | Boulder | 119 | 1,073(11.09%)#2 | 57,530(0.21%)#41 |
| 42. | Portsmouth | 119 | 708(16.81%)#1 | 57,530(0.21%)#42 |
| 43. | Savannah | 118 | 1,124(10.50%)#1 | 57,530(0.21%)#43 |
| 44. | Long Beach | 113 | 8,444(1.34%)#8 | 57,530(0.20%)#44 |
| 45. | Louisville | 110 | 438(25.11%)#1 | 57,530(0.19%)#45 |
| 46. | Huntsville | 109 | 475(22.95%)#1 | 57,530(0.19%)#46 |
| 47. | Green Knoll | 107 | 2,470(4.33%)#1 | 57,530(0.19%)#47 |
| 48. | Jacksonville | 106 | 5,920(1.79%)#3 | 57,530(0.18%)#48 |
| 49. | Denton | 106 | 5,917(1.79%)#9 | 57,530(0.18%)#49 |
| 50. | Hicksville | 105 | 5,087(2.06%)#4 | 57,530(0.18%)#50 |
| 51. | Scottsdale | 104 | 1,279(8.13%)#3 | 57,530(0.18%)#51 |
| 52. | Greenville | 104 | 1,092(9.52%)#2 | 57,530(0.18%)#52 |
| 53. | Torrance | 103 | 8,444(1.22%)#9 | 57,530(0.18%)#53 |
| 54. | Orange | 102 | 8,444(1.21%)#10 | 57,530(0.18%)#54 |
| 55. | Denver | 101 | 1,073(9.41%)#3 | 57,530(0.18%)#55 |
| 56. | Arlington | 101 | 1,592(6.34%)#3 | 57,530(0.18%)#56 |
| 57. | Palm Desert | 101 | 8,444(1.20%)#11 | 57,530(0.18%)#57 |
| 58. | North Olmsted | 101 | 1,424(7.09%)#2 | 57,530(0.18%)#58 |
| 59. | Stamford | 99 | 1,307(7.57%)#1 | 57,530(0.17%)#59 |
| 60. | San Antonio | 98 | 5,917(1.66%)#10 | 57,530(0.17%)#60 |
| 61. | Hot Springs | 95 | 485(19.59%)#1 | 57,530(0.17%)#61 |
| 62. | Exeter | 95 | 708(13.42%)#2 | 57,530(0.17%)#62 |
| 63. | Aurora | 94 | 1,361(6.91%)#2 | 57,530(0.16%)#63 |
| 64. | Carmel | 94 | 581(16.18%)#1 | 57,530(0.16%)#64 |
| 65. | Spring Hill | 93 | 5,920(1.57%)#4 | 57,530(0.16%)#65 |
| 66. | Largo | 93 | 5,920(1.57%)#5 | 57,530(0.16%)#66 |
| 67. | Mill Creek | 93 | 2,020(4.60%)#2 | 57,530(0.16%)#67 |
| 68. | Anchorage | 92 | 147(62.59%)#1 | 57,530(0.16%)#68 |
| 69. | Irvine | 88 | 8,444(1.04%)#12 | 57,530(0.15%)#69 |
| 70. | Columbia | 88 | 551(15.97%)#1 | 57,530(0.15%)#70 |
| 71. | Port Chester | 87 | 5,087(1.71%)#5 | 57,530(0.15%)#71 |
| 72. | Drexel Hill | 84 | 1,747(4.81%)#2 | 57,530(0.15%)#72 |
| 73. | Kings Park | 84 | 5,087(1.65%)#6 | 57,530(0.15%)#73 |
| 74. | Spokane | 83 | 2,020(4.11%)#3 | 57,530(0.14%)#74 |
| 75. | Newport Beach | 83 | 8,444(0.98%)#13 | 57,530(0.14%)#75 |
| 76. | Redmond | 83 | 2,020(4.11%)#4 | 57,530(0.14%)#76 |
| 77. | Columbus | 81 | 1,424(5.69%)#3 | 57,530(0.14%)#77 |
| 78. | San Clemente | 81 | 8,444(0.96%)#14 | 57,530(0.14%)#78 |
| 79. | Hopatcong Borough | 81 | 2,470(3.28%)#2 | 57,530(0.14%)#79 |
| 80. | St Louis | 80 | 551(14.52%)#2 | 57,530(0.14%)#80 |
| 81. | Pueblo | 80 | 1,073(7.46%)#4 | 57,530(0.14%)#81 |
| 82. | Albuquerque | 79 | 186(42.47%)#1 | 57,530(0.14%)#82 |
| 83. | Vancouver | 79 | 2,020(3.91%)#5 | 57,530(0.14%)#83 |
| 84. | Oceanside | 79 | 8,444(0.94%)#15 | 57,530(0.14%)#84 |
| 85. | St Petersburg | 78 | 5,920(1.32%)#6 | 57,530(0.14%)#85 |
| 86. | Huntington Beach | 78 | 8,444(0.92%)#16 | 57,530(0.14%)#86 |
| 87. | Danbury | 78 | 1,307(5.97%)#2 | 57,530(0.14%)#87 |
| 88. | Tulsa | 76 | 310(24.52%)#1 | 57,530(0.13%)#88 |
| 89. | Leander | 76 | 5,917(1.28%)#11 | 57,530(0.13%)#89 |
| 90. | Rancho Mirage | 75 | 8,444(0.89%)#17 | 57,530(0.13%)#90 |
| 91. | Dallas | 74 | 5,917(1.25%)#12 | 57,530(0.13%)#91 |
| 92. | Crowley | 74 | 5,917(1.25%)#13 | 57,530(0.13%)#92 |
| 93. | Milwaukee | 73 | 702(10.40%)#2 | 57,530(0.13%)#93 |
| 94. | Carlsbad | 73 | 8,444(0.86%)#18 | 57,530(0.13%)#94 |
| 95. | Goose Creek | 73 | 1,092(6.68%)#3 | 57,530(0.13%)#95 |
| 96. | Mission Viejo | 72 | 8,444(0.85%)#19 | 57,530(0.13%)#96 |
| 97. | Newport News | 71 | 1,592(4.46%)#4 | 57,530(0.12%)#97 |
| 98. | Redondo Beach | 71 | 8,444(0.84%)#20 | 57,530(0.12%)#98 |
| 99. | Western Springs | 70 | 1,361(5.14%)#3 | 57,530(0.12%)#99 |
| 100. | Senoia | 70 | 1,124(6.23%)#2 | 57,530(0.12%)#100 |
Common Questions
What are the Top 10 Cities with the Most Immigrants from Scotland in the United States?
Top 10 Cities with the Most Immigrants from Scotland in the United States are:
#1
1,653
#2
1,065
#3
720
#4
412
#5
291
#6
265
#7
227
#8
214
#9
213
#10
209
What city has the Most Immigrants from Scotland in the United States?
New York has the Most Immigrants from Scotland in the United States with 1,653.
What is the Total Immigrants from Scotland in the United States?
Total Immigrants from Scotland in the United States is 57,530.