Greenwood County, SC Map & Demographics
Greenwood County Map
Greenwood County Overview
$30,237
PER CAPITA INCOME
$64,288
AVG FAMILY INCOME
$47,553
AVG HOUSEHOLD INCOME
24.4%
WAGE / INCOME GAP [ % ]
75.6¢/ $1
WAGE / INCOME GAP [ $ ]
$12,143
FAMILY INCOME DEFICIT
0.50
INEQUALITY / GINI INDEX
69,309
TOTAL POPULATION
32,530
MALE POPULATION
36,779
FEMALE POPULATION
88.45
MALES / 100 FEMALES
113.06
FEMALES / 100 MALES
40.2
MEDIAN AGE
3.1
AVG FAMILY SIZE
2.4
AVG HOUSEHOLD SIZE
31,152
LABOR FORCE [ PEOPLE ]
56.1%
PERCENT IN LABOR FORCE
5.5%
UNEMPLOYMENT RATE
Greenwood County Area Codes
Income in Greenwood County
Income Overview in Greenwood County
Per Capita Income in Greenwood County is $30,237, while median incomes of families and households are $64,288 and $47,553 respectively.
| Characteristic | Number | Measure |
| Per Capita Income | 69,309 | $30,237 |
| Median Family Income | 16,712 | $64,288 |
| Mean Family Income | 16,712 | $90,199 |
| Median Household Income | 27,640 | $47,553 |
| Mean Household Income | 27,640 | $71,476 |
| Income Deficit | 16,712 | $12,143 |
| Wage / Income Gap (%) | 69,309 | 24.43% |
| Wage / Income Gap ($) | 69,309 | 75.57¢ per $1 |
| Gini / Inequality Index | 69,309 | 0.50 |
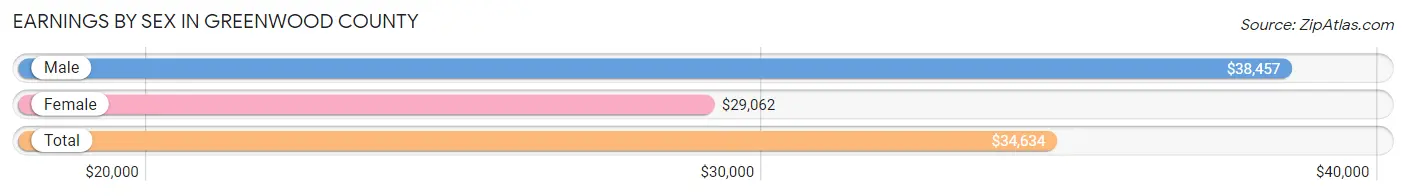
Earnings by Sex in Greenwood County
Average Earnings in Greenwood County are $34,634, $38,457 for men and $29,062 for women, a difference of 24.4%.
| Sex | Number | Average Earnings |
| Male | 16,141 (49.4%) | $38,457 |
| Female | 16,530 (50.6%) | $29,062 |
| Total | 32,671 (100.0%) | $34,634 |
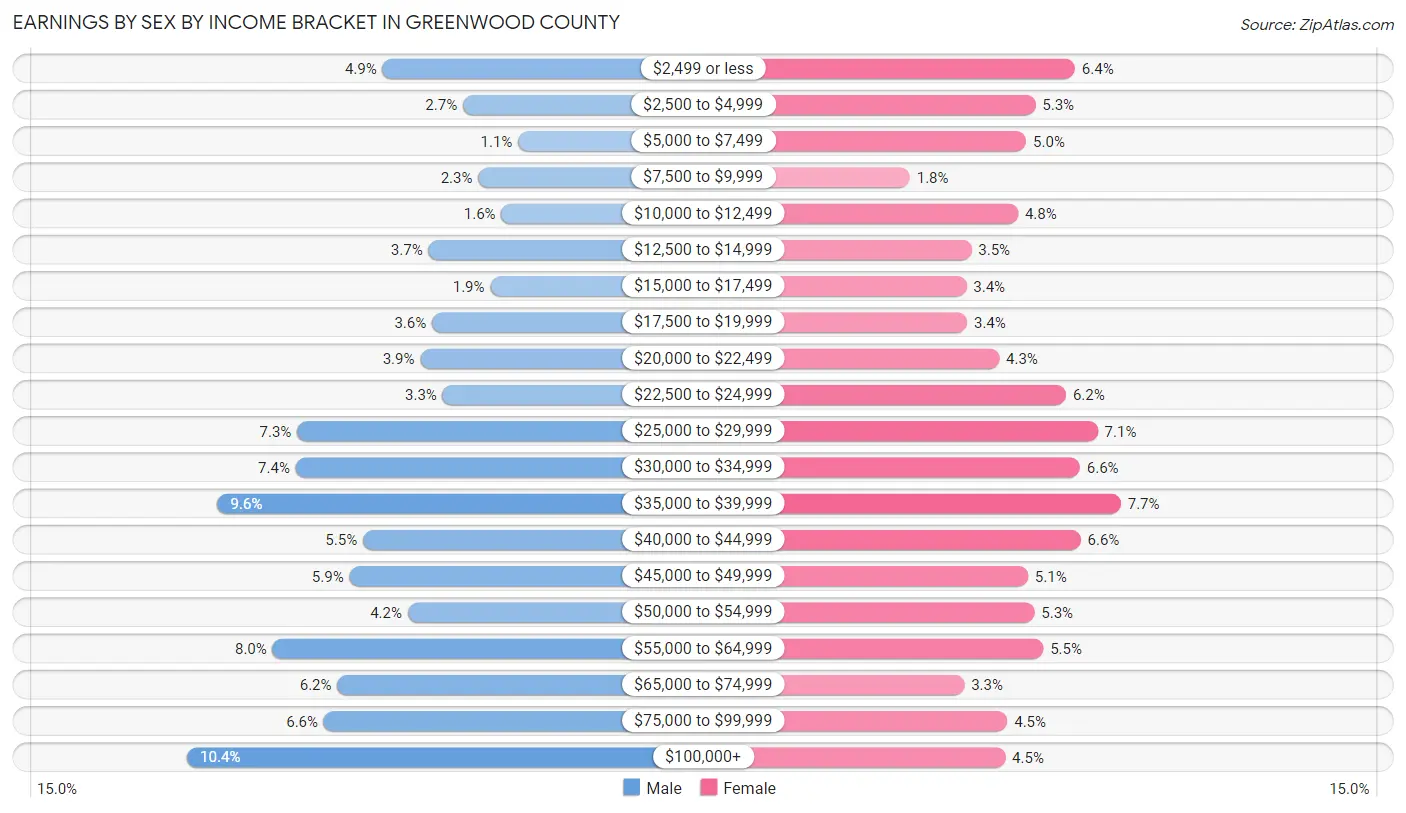
Earnings by Sex by Income Bracket in Greenwood County
The most common earnings brackets in Greenwood County are $100,000+ for men (1,684 | 10.4%) and $35,000 to $39,999 for women (1,273 | 7.7%).
| Income | Male | Female |
| $2,499 or less | 798 (4.9%) | 1,059 (6.4%) |
| $2,500 to $4,999 | 432 (2.7%) | 876 (5.3%) |
| $5,000 to $7,499 | 182 (1.1%) | 833 (5.0%) |
| $7,500 to $9,999 | 363 (2.2%) | 292 (1.8%) |
| $10,000 to $12,499 | 259 (1.6%) | 795 (4.8%) |
| $12,500 to $14,999 | 589 (3.6%) | 578 (3.5%) |
| $15,000 to $17,499 | 308 (1.9%) | 555 (3.4%) |
| $17,500 to $19,999 | 573 (3.5%) | 559 (3.4%) |
| $20,000 to $22,499 | 627 (3.9%) | 707 (4.3%) |
| $22,500 to $24,999 | 524 (3.3%) | 1,019 (6.2%) |
| $25,000 to $29,999 | 1,185 (7.3%) | 1,165 (7.0%) |
| $30,000 to $34,999 | 1,192 (7.4%) | 1,083 (6.6%) |
| $35,000 to $39,999 | 1,547 (9.6%) | 1,273 (7.7%) |
| $40,000 to $44,999 | 886 (5.5%) | 1,086 (6.6%) |
| $45,000 to $49,999 | 948 (5.9%) | 842 (5.1%) |
| $50,000 to $54,999 | 682 (4.2%) | 871 (5.3%) |
| $55,000 to $64,999 | 1,296 (8.0%) | 912 (5.5%) |
| $65,000 to $74,999 | 1,003 (6.2%) | 545 (3.3%) |
| $75,000 to $99,999 | 1,063 (6.6%) | 745 (4.5%) |
| $100,000+ | 1,684 (10.4%) | 735 (4.4%) |
| Total | 16,141 (100.0%) | 16,530 (100.0%) |
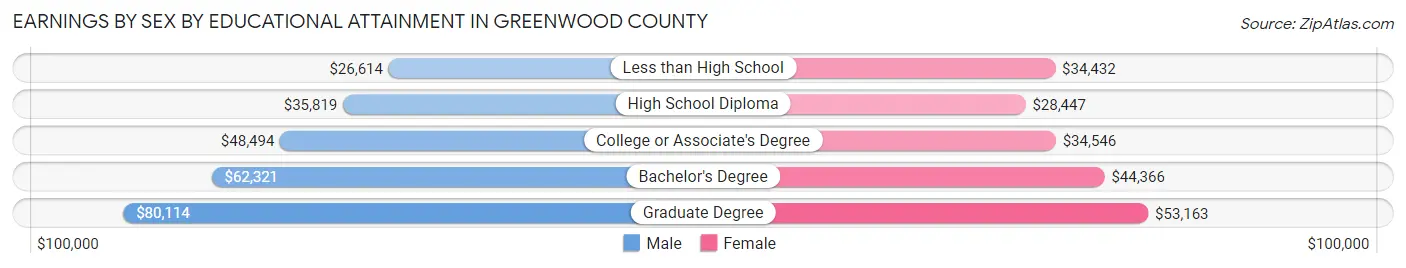
Earnings by Sex by Educational Attainment in Greenwood County
Average earnings in Greenwood County are $43,308 for men and $35,202 for women, a difference of 18.7%. Men with an educational attainment of graduate degree enjoy the highest average annual earnings of $80,114, while those with less than high school education earn the least with $26,614. Women with an educational attainment of graduate degree earn the most with the average annual earnings of $53,163, while those with high school diploma education have the smallest earnings of $28,447.
| Educational Attainment | Male Income | Female Income |
| Less than High School | $26,614 | $34,432 |
| High School Diploma | $35,819 | $28,447 |
| College or Associate's Degree | $48,494 | $34,546 |
| Bachelor's Degree | $62,321 | $44,366 |
| Graduate Degree | $80,114 | $53,163 |
| Total | $43,308 | $35,202 |
Family Income in Greenwood County
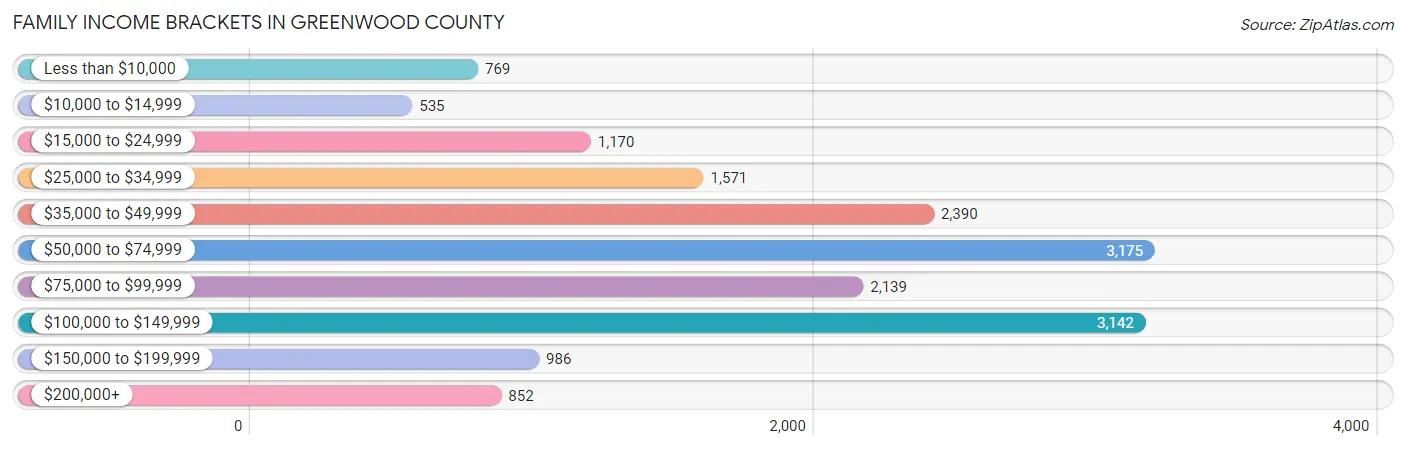
Family Income Brackets in Greenwood County
According to the Greenwood County family income data, there are 3,175 families falling into the $50,000 to $74,999 income range, which is the most common income bracket and makes up 19.0% of all families. Conversely, the $10,000 to $14,999 income bracket is the least frequent group with only 535 families (3.2%) belonging to this category.
| Income Bracket | # Families | % Families |
| Less than $10,000 | 769 | 4.6% |
| $10,000 to $14,999 | 535 | 3.2% |
| $15,000 to $24,999 | 1,170 | 7.0% |
| $25,000 to $34,999 | 1,571 | 9.4% |
| $35,000 to $49,999 | 2,390 | 14.3% |
| $50,000 to $74,999 | 3,175 | 19.0% |
| $75,000 to $99,999 | 2,139 | 12.8% |
| $100,000 to $149,999 | 3,142 | 18.8% |
| $150,000 to $199,999 | 986 | 5.9% |
| $200,000+ | 852 | 5.1% |
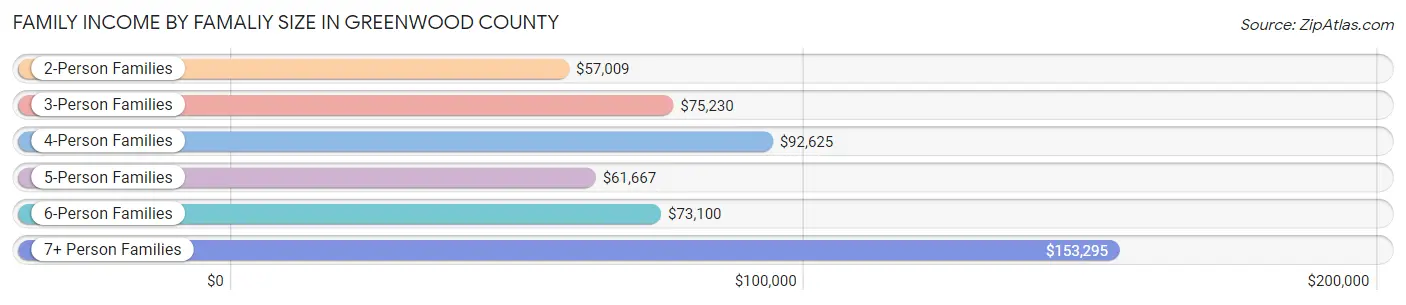
Family Income by Famaliy Size in Greenwood County
7+ person families (61 | 0.4%) account for the highest median family income in Greenwood County with $153,295 per family, while 2-person families (8,768 | 52.5%) have the highest median income of $28,504 per family member.
| Income Bracket | # Families | Median Income |
| 2-Person Families | 8,768 (52.5%) | $57,009 |
| 3-Person Families | 3,984 (23.8%) | $75,230 |
| 4-Person Families | 1,773 (10.6%) | $92,625 |
| 5-Person Families | 1,624 (9.7%) | $61,667 |
| 6-Person Families | 502 (3.0%) | $73,100 |
| 7+ Person Families | 61 (0.4%) | $153,295 |
| Total | 16,712 (100.0%) | $64,288 |
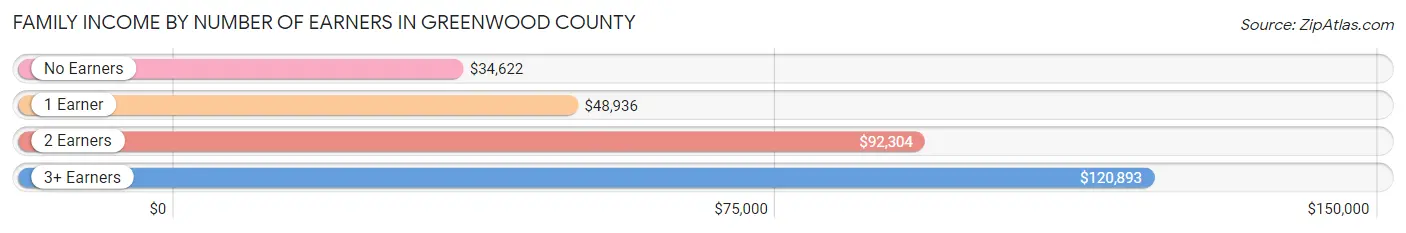
Family Income by Number of Earners in Greenwood County
The median family income in Greenwood County is $64,288, with families comprising 3+ earners (1,433) having the highest median family income of $120,893, while families with no earners (3,571) have the lowest median family income of $34,622, accounting for 8.6% and 21.4% of families, respectively.
| Number of Earners | # Families | Median Income |
| No Earners | 3,571 (21.4%) | $34,622 |
| 1 Earner | 6,299 (37.7%) | $48,936 |
| 2 Earners | 5,409 (32.4%) | $92,304 |
| 3+ Earners | 1,433 (8.6%) | $120,893 |
| Total | 16,712 (100.0%) | $64,288 |
Household Income in Greenwood County
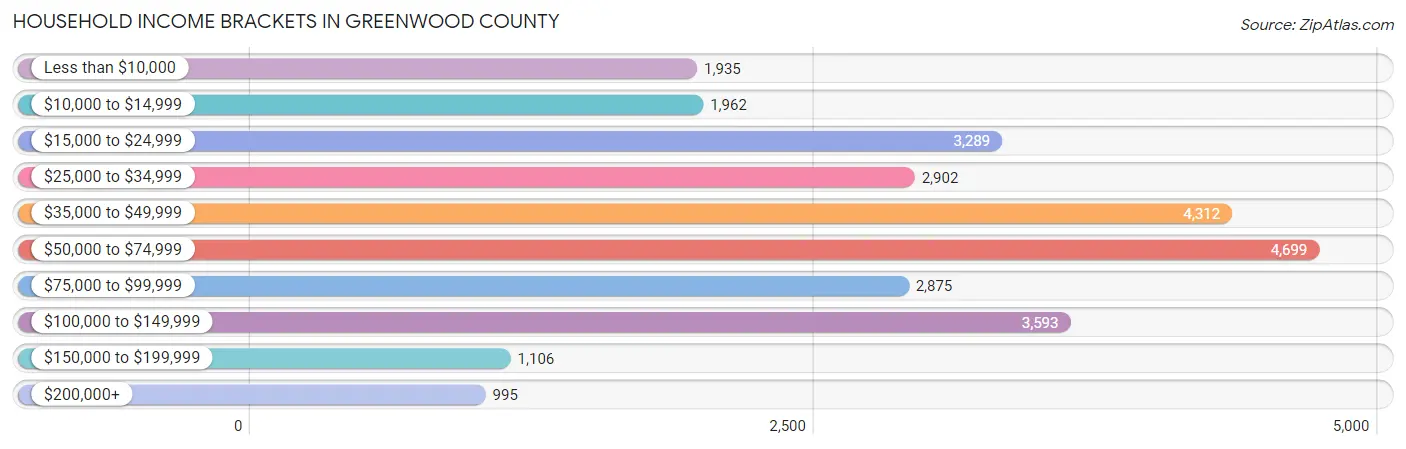
Household Income Brackets in Greenwood County
With 4,699 households falling in the category, the $50,000 to $74,999 income range is the most frequent in Greenwood County, accounting for 17.0% of all households. In contrast, only 995 households (3.6%) fall into the $200,000+ income bracket, making it the least populous group.
| Income Bracket | # Households | % Households |
| Less than $10,000 | 1,935 | 7.0% |
| $10,000 to $14,999 | 1,962 | 7.1% |
| $15,000 to $24,999 | 3,289 | 11.9% |
| $25,000 to $34,999 | 2,902 | 10.5% |
| $35,000 to $49,999 | 4,312 | 15.6% |
| $50,000 to $74,999 | 4,699 | 17.0% |
| $75,000 to $99,999 | 2,875 | 10.4% |
| $100,000 to $149,999 | 3,593 | 13.0% |
| $150,000 to $199,999 | 1,106 | 4.0% |
| $200,000+ | 995 | 3.6% |
Household Income by Householder Age in Greenwood County
The median household income in Greenwood County is $47,553, with the highest median household income of $57,886 found in the 45 to 64 years age bracket for the primary householder. A total of 10,062 households (36.4%) fall into this category. Meanwhile, the 15 to 24 years age bracket for the primary householder has the lowest median household income of $24,512, with 1,014 households (3.7%) in this group.
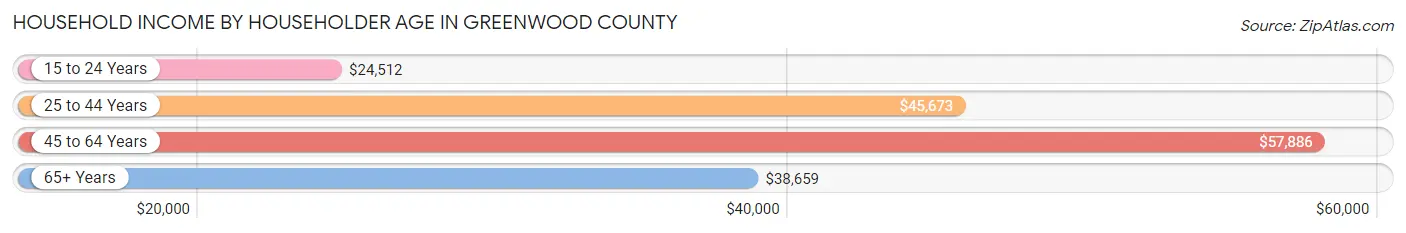
| Income Bracket | # Households | Median Income |
| 15 to 24 Years | 1,014 (3.7%) | $24,512 |
| 25 to 44 Years | 8,112 (29.3%) | $45,673 |
| 45 to 64 Years | 10,062 (36.4%) | $57,886 |
| 65+ Years | 8,452 (30.6%) | $38,659 |
| Total | 27,640 (100.0%) | $47,553 |
Poverty in Greenwood County
Income Below Poverty by Sex and Age in Greenwood County
With 15.9% poverty level for males and 18.7% for females among the residents of Greenwood County, under 5 year old males and under 5 year old females are the most vulnerable to poverty, with 675 males (35.6%) and 817 females (41.1%) in their respective age groups living below the poverty level.
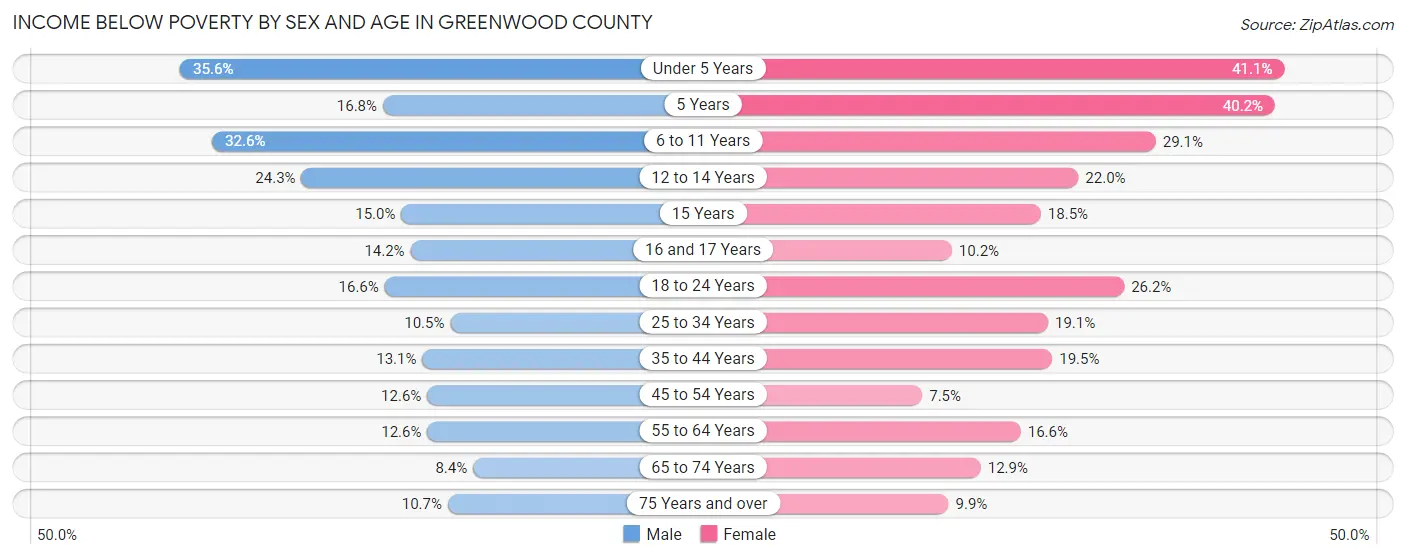
| Age Bracket | Male | Female |
| Under 5 Years | 675 (35.6%) | 817 (41.1%) |
| 5 Years | 96 (16.8%) | 252 (40.2%) |
| 6 to 11 Years | 818 (32.6%) | 801 (29.1%) |
| 12 to 14 Years | 343 (24.3%) | 222 (22.0%) |
| 15 Years | 54 (15.0%) | 85 (18.5%) |
| 16 and 17 Years | 129 (14.2%) | 79 (10.2%) |
| 18 to 24 Years | 494 (16.6%) | 687 (26.2%) |
| 25 to 34 Years | 388 (10.5%) | 823 (19.1%) |
| 35 to 44 Years | 479 (13.1%) | 818 (19.5%) |
| 45 to 54 Years | 492 (12.6%) | 317 (7.5%) |
| 55 to 64 Years | 521 (12.6%) | 766 (16.6%) |
| 65 to 74 Years | 285 (8.4%) | 505 (12.9%) |
| 75 Years and over | 234 (10.7%) | 318 (9.9%) |
| Total | 5,008 (15.9%) | 6,490 (18.7%) |
Income Above Poverty by Sex and Age in Greenwood County
According to the poverty statistics in Greenwood County, males aged 65 to 74 years and females aged 45 to 54 years are the age groups that are most secure financially, with 91.6% of males and 92.5% of females in these age groups living above the poverty line.
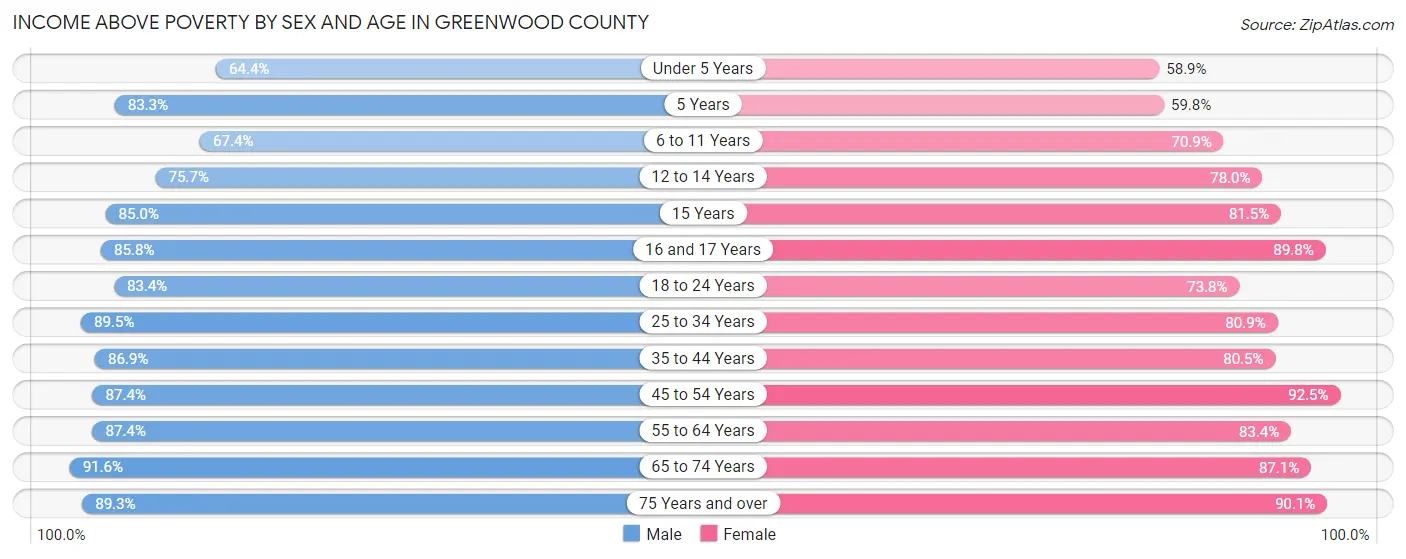
| Age Bracket | Male | Female |
| Under 5 Years | 1,223 (64.4%) | 1,173 (58.9%) |
| 5 Years | 477 (83.3%) | 375 (59.8%) |
| 6 to 11 Years | 1,692 (67.4%) | 1,948 (70.9%) |
| 12 to 14 Years | 1,068 (75.7%) | 789 (78.0%) |
| 15 Years | 305 (85.0%) | 375 (81.5%) |
| 16 and 17 Years | 780 (85.8%) | 694 (89.8%) |
| 18 to 24 Years | 2,483 (83.4%) | 1,934 (73.8%) |
| 25 to 34 Years | 3,309 (89.5%) | 3,478 (80.9%) |
| 35 to 44 Years | 3,180 (86.9%) | 3,369 (80.5%) |
| 45 to 54 Years | 3,400 (87.4%) | 3,926 (92.5%) |
| 55 to 64 Years | 3,605 (87.4%) | 3,847 (83.4%) |
| 65 to 74 Years | 3,116 (91.6%) | 3,409 (87.1%) |
| 75 Years and over | 1,948 (89.3%) | 2,890 (90.1%) |
| Total | 26,586 (84.2%) | 28,207 (81.3%) |
Income Below Poverty Among Married-Couple Families in Greenwood County
The poverty statistics for married-couple families in Greenwood County show that 4.4% or 473 of the total 10,849 families live below the poverty line. Families with 5 or more children have the highest poverty rate of 15.6%, comprising of 5 families. On the other hand, families with no children have the lowest poverty rate of 3.1%, which includes 217 families.
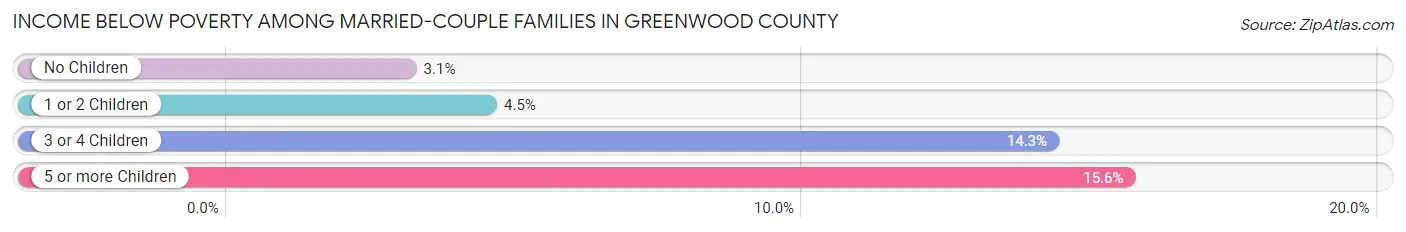
| Children | Above Poverty | Below Poverty |
| No Children | 6,750 (96.9%) | 217 (3.1%) |
| 1 or 2 Children | 2,921 (95.5%) | 138 (4.5%) |
| 3 or 4 Children | 678 (85.7%) | 113 (14.3%) |
| 5 or more Children | 27 (84.4%) | 5 (15.6%) |
| Total | 10,376 (95.6%) | 473 (4.4%) |
Income Below Poverty Among Single-Parent Households in Greenwood County
According to the poverty data in Greenwood County, 16.9% or 202 single-father households and 29.3% or 1,370 single-mother households are living below the poverty line. Among single-father households, those with 3 or 4 children have the highest poverty rate, with 90 households (56.2%) experiencing poverty. Likewise, among single-mother households, those with 5 or more children have the highest poverty rate, with 81 households (100.0%) falling below the poverty line.
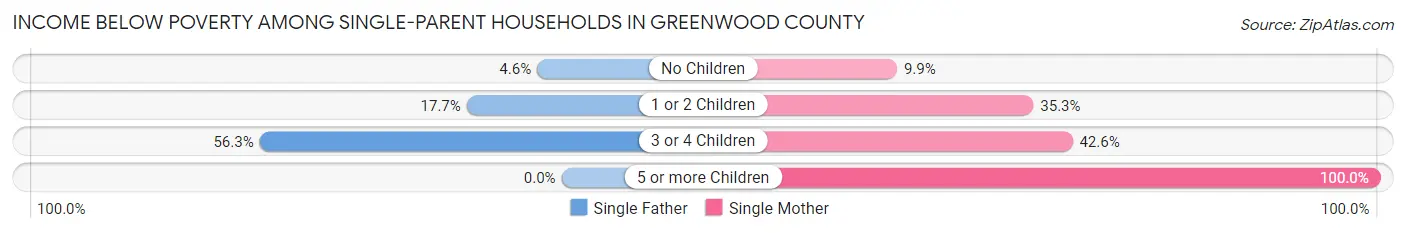
| Children | Single Father | Single Mother |
| No Children | 24 (4.6%) | 152 (9.9%) |
| 1 or 2 Children | 88 (17.7%) | 808 (35.3%) |
| 3 or 4 Children | 90 (56.2%) | 329 (42.6%) |
| 5 or more Children | 0 (0.0%) | 81 (100.0%) |
| Total | 202 (16.9%) | 1,370 (29.3%) |
Income Below Poverty Among Married-Couple vs Single-Parent Households in Greenwood County
The poverty data for Greenwood County shows that 473 of the married-couple family households (4.4%) and 1,572 of the single-parent households (26.8%) are living below the poverty level. Within the married-couple family households, those with 5 or more children have the highest poverty rate, with 5 households (15.6%) falling below the poverty line. Among the single-parent households, those with 5 or more children have the highest poverty rate, with 81 household (90.0%) living below poverty.
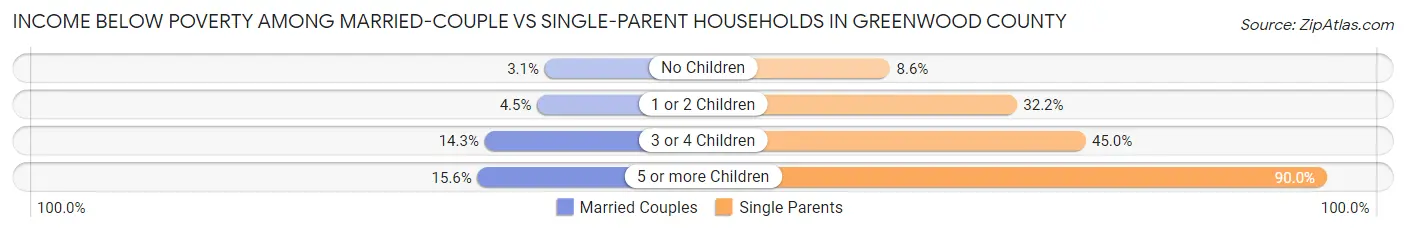
| Children | Married-Couple Families | Single-Parent Households |
| No Children | 217 (3.1%) | 176 (8.6%) |
| 1 or 2 Children | 138 (4.5%) | 896 (32.2%) |
| 3 or 4 Children | 113 (14.3%) | 419 (45.0%) |
| 5 or more Children | 5 (15.6%) | 81 (90.0%) |
| Total | 473 (4.4%) | 1,572 (26.8%) |
Race in Greenwood County
The most populous races in Greenwood County are White / Caucasian (43,025 | 62.1%), Black / African American (21,989 | 31.7%), and Hispanic or Latino (4,520 | 6.5%).
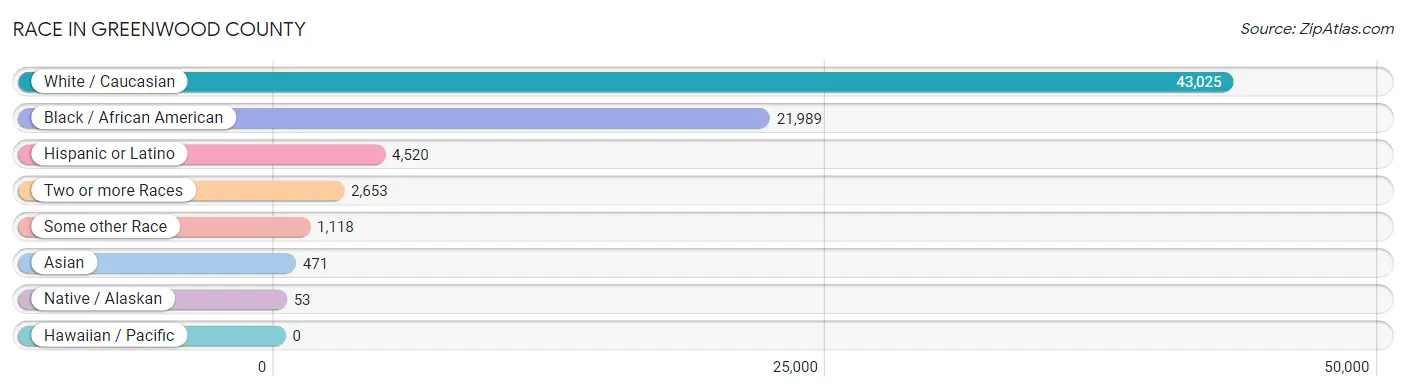
| Race | # Population | % Population |
| Asian | 471 | 0.7% |
| Black / African American | 21,989 | 31.7% |
| Hawaiian / Pacific | 0 | 0.0% |
| Hispanic or Latino | 4,520 | 6.5% |
| Native / Alaskan | 53 | 0.1% |
| White / Caucasian | 43,025 | 62.1% |
| Two or more Races | 2,653 | 3.8% |
| Some other Race | 1,118 | 1.6% |
| Total | 69,309 | 100.0% |
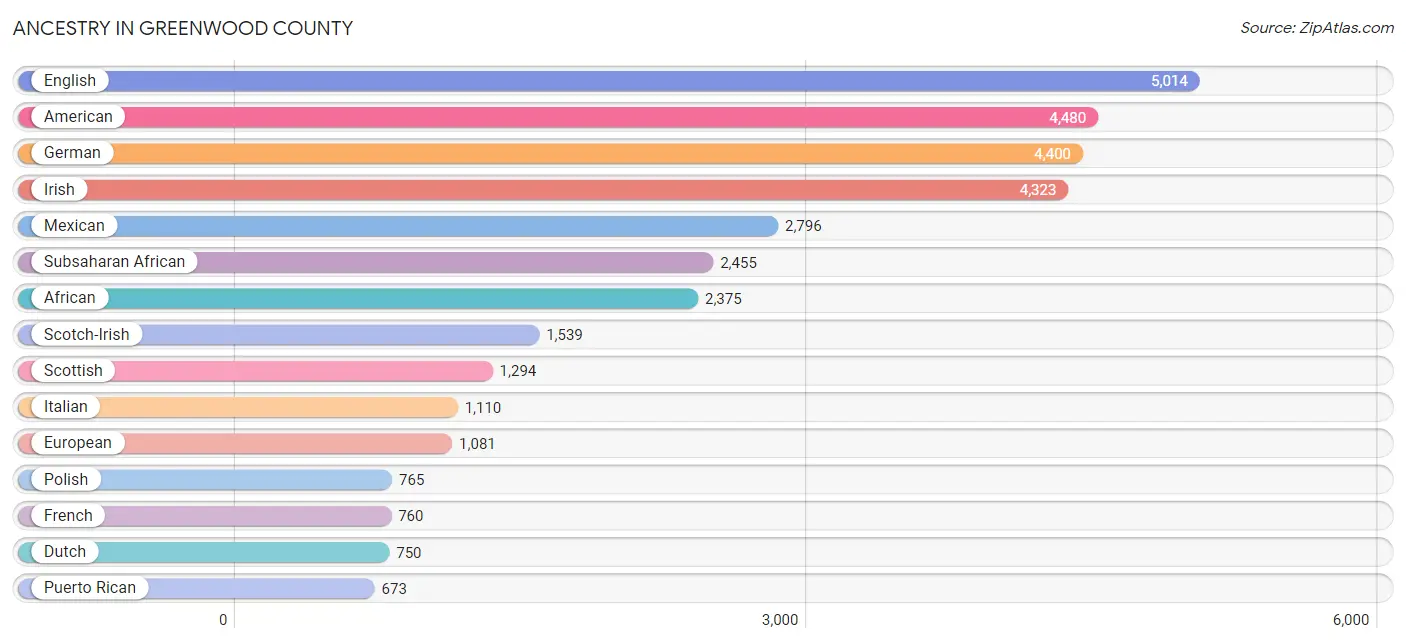
Ancestry in Greenwood County
The most populous ancestries reported in Greenwood County are English (5,014 | 7.2%), American (4,480 | 6.5%), German (4,400 | 6.4%), Irish (4,323 | 6.2%), and Mexican (2,796 | 4.0%), together accounting for 30.3% of all Greenwood County residents.
| Ancestry | # Population | % Population |
| African | 2,375 | 3.4% |
| Alaskan Athabascan | 12 | 0.0% |
| American | 4,480 | 6.5% |
| Arab | 18 | 0.0% |
| Argentinean | 98 | 0.1% |
| Austrian | 73 | 0.1% |
| Bhutanese | 132 | 0.2% |
| Brazilian | 14 | 0.0% |
| British | 606 | 0.9% |
| British West Indian | 7 | 0.0% |
| Burmese | 70 | 0.1% |
| Canadian | 3 | 0.0% |
| Carpatho Rusyn | 10 | 0.0% |
| Celtic | 14 | 0.0% |
| Central American | 359 | 0.5% |
| Cherokee | 137 | 0.2% |
| Chickasaw | 28 | 0.0% |
| Colombian | 37 | 0.1% |
| Costa Rican | 20 | 0.0% |
| Croatian | 9 | 0.0% |
| Cuban | 277 | 0.4% |
| Czech | 34 | 0.1% |
| Czechoslovakian | 14 | 0.0% |
| Danish | 14 | 0.0% |
| Dominican | 63 | 0.1% |
| Dutch | 750 | 1.1% |
| Eastern European | 34 | 0.1% |
| Ecuadorian | 5 | 0.0% |
| English | 5,014 | 7.2% |
| Estonian | 16 | 0.0% |
| European | 1,081 | 1.6% |
| Filipino | 9 | 0.0% |
| Finnish | 5 | 0.0% |
| French | 760 | 1.1% |
| French Canadian | 32 | 0.1% |
| German | 4,400 | 6.4% |
| Greek | 39 | 0.1% |
| Guatemalan | 212 | 0.3% |
| Honduran | 74 | 0.1% |
| Hungarian | 38 | 0.1% |
| Indian (Asian) | 155 | 0.2% |
| Irish | 4,323 | 6.2% |
| Italian | 1,110 | 1.6% |
| Jamaican | 35 | 0.1% |
| Jordanian | 7 | 0.0% |
| Korean | 151 | 0.2% |
| Lebanese | 9 | 0.0% |
| Lithuanian | 21 | 0.0% |
| Lumbee | 2 | 0.0% |
| Mexican | 2,796 | 4.0% |
| Mexican American Indian | 27 | 0.0% |
| Navajo | 105 | 0.2% |
| Nigerian | 71 | 0.1% |
| Northern European | 8 | 0.0% |
| Norwegian | 155 | 0.2% |
| Pakistani | 126 | 0.2% |
| Panamanian | 47 | 0.1% |
| Peruvian | 106 | 0.2% |
| Polish | 765 | 1.1% |
| Portuguese | 101 | 0.2% |
| Puerto Rican | 673 | 1.0% |
| Romanian | 9 | 0.0% |
| Russian | 123 | 0.2% |
| Salvadoran | 6 | 0.0% |
| Scandinavian | 23 | 0.0% |
| Scotch-Irish | 1,539 | 2.2% |
| Scottish | 1,294 | 1.9% |
| Sierra Leonean | 10 | 0.0% |
| Sioux | 10 | 0.0% |
| Slovak | 13 | 0.0% |
| Slovene | 18 | 0.0% |
| South American | 273 | 0.4% |
| Sri Lankan | 181 | 0.3% |
| Subsaharan African | 2,455 | 3.5% |
| Swedish | 164 | 0.2% |
| Swiss | 18 | 0.0% |
| Thai | 46 | 0.1% |
| Ukrainian | 36 | 0.1% |
| Uruguayan | 12 | 0.0% |
| Venezuelan | 15 | 0.0% |
| Welsh | 405 | 0.6% |
| West Indian | 15 | 0.0% |
| Yugoslavian | 21 | 0.0% |
| Zimbabwean | 9 | 0.0% | View All 84 Rows |
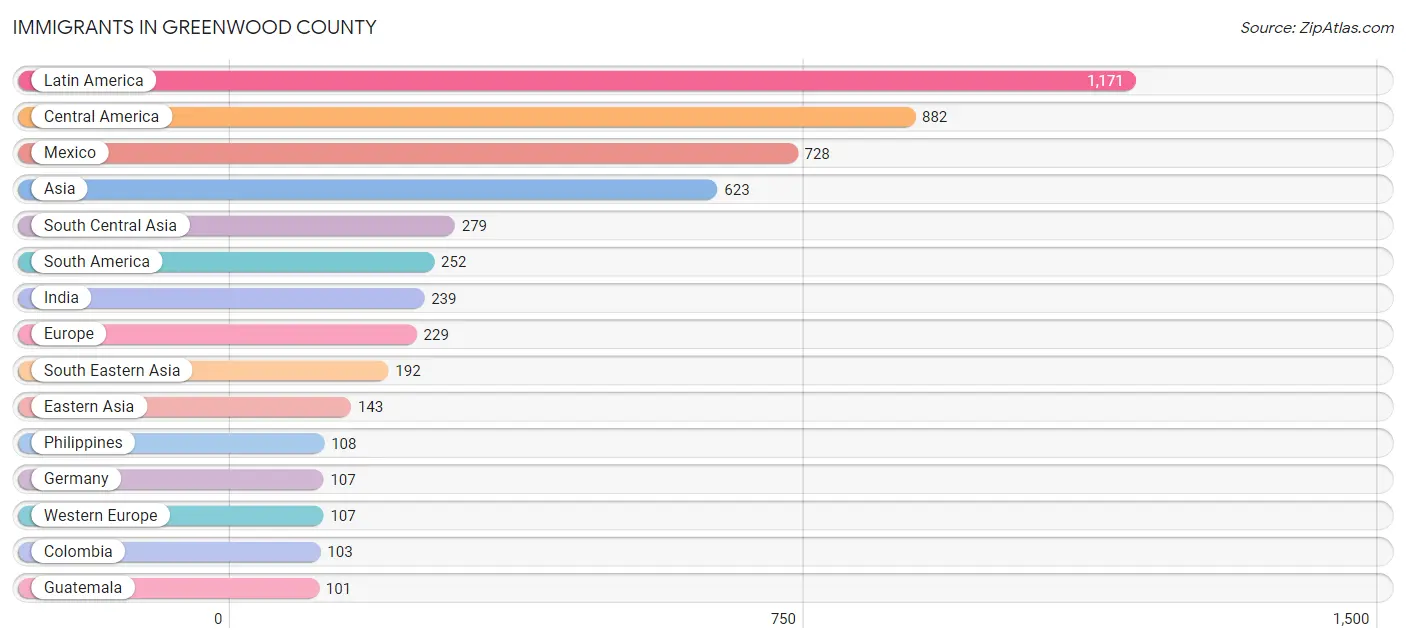
Immigrants in Greenwood County
The most numerous immigrant groups reported in Greenwood County came from Latin America (1,171 | 1.7%), Central America (882 | 1.3%), Mexico (728 | 1.1%), Asia (623 | 0.9%), and South Central Asia (279 | 0.4%), together accounting for 5.3% of all Greenwood County residents.
| Immigration Origin | # Population | % Population |
| Africa | 70 | 0.1% |
| Argentina | 98 | 0.1% |
| Asia | 623 | 0.9% |
| Bosnia and Herzegovina | 12 | 0.0% |
| Brazil | 36 | 0.1% |
| Canada | 29 | 0.0% |
| Caribbean | 37 | 0.1% |
| Central America | 882 | 1.3% |
| China | 21 | 0.0% |
| Colombia | 103 | 0.2% |
| Dominican Republic | 30 | 0.0% |
| Eastern Africa | 46 | 0.1% |
| Eastern Asia | 143 | 0.2% |
| Eastern Europe | 31 | 0.0% |
| England | 7 | 0.0% |
| Europe | 229 | 0.3% |
| Germany | 107 | 0.2% |
| Guatemala | 101 | 0.2% |
| Honduras | 53 | 0.1% |
| India | 239 | 0.3% |
| Israel | 2 | 0.0% |
| Japan | 94 | 0.1% |
| Jordan | 7 | 0.0% |
| Kazakhstan | 40 | 0.1% |
| Kenya | 6 | 0.0% |
| Korea | 28 | 0.0% |
| Latin America | 1,171 | 1.7% |
| Liberia | 10 | 0.0% |
| Mexico | 728 | 1.1% |
| Northern Europe | 60 | 0.1% |
| Philippines | 108 | 0.2% |
| Russia | 3 | 0.0% |
| South America | 252 | 0.4% |
| South Central Asia | 279 | 0.4% |
| South Eastern Asia | 192 | 0.3% |
| Southern Europe | 31 | 0.0% |
| Spain | 31 | 0.0% |
| Sweden | 17 | 0.0% |
| Taiwan | 9 | 0.0% |
| Thailand | 64 | 0.1% |
| Trinidad and Tobago | 6 | 0.0% |
| Venezuela | 15 | 0.0% |
| Vietnam | 20 | 0.0% |
| Western Africa | 10 | 0.0% |
| Western Asia | 9 | 0.0% |
| Western Europe | 107 | 0.2% |
| Zimbabwe | 9 | 0.0% | View All 47 Rows |
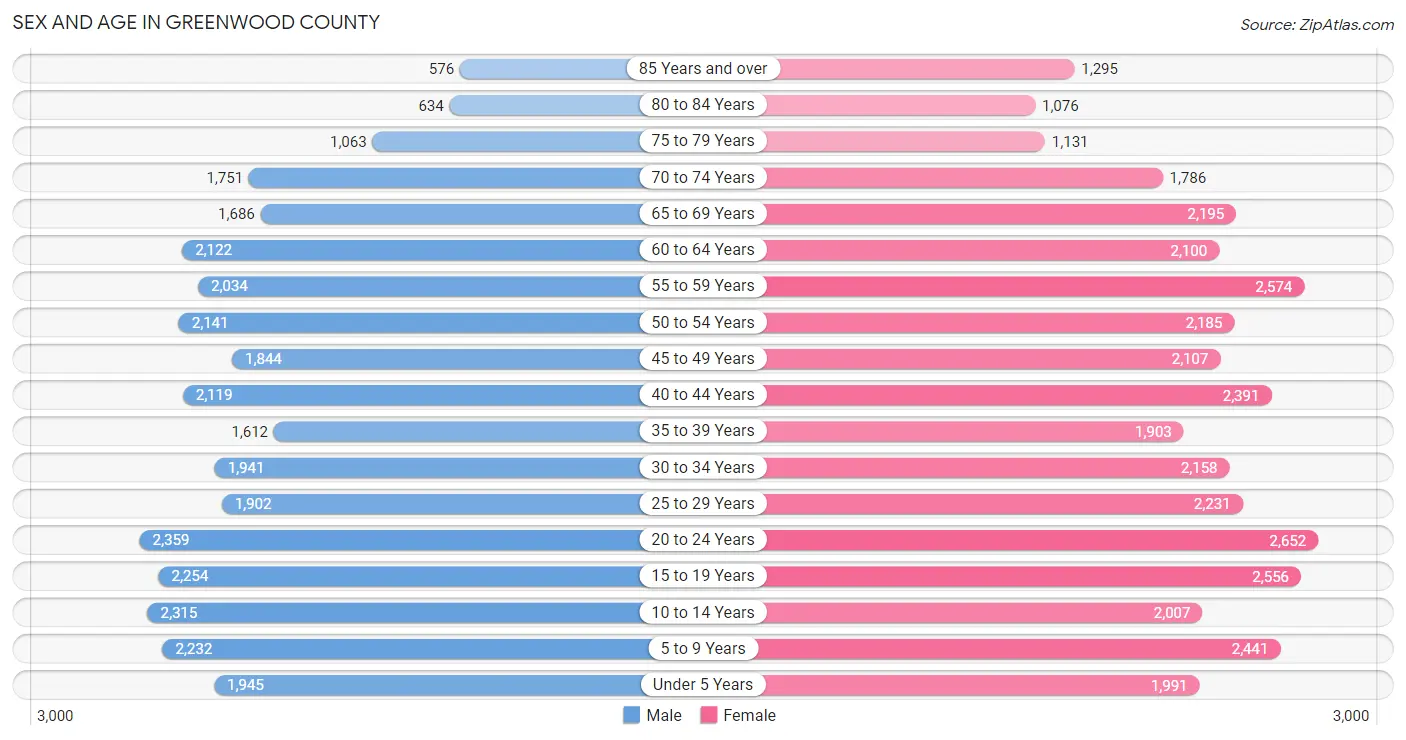
Sex and Age in Greenwood County
Sex and Age in Greenwood County
The most populous age groups in Greenwood County are 20 to 24 Years (2,359 | 7.2%) for men and 20 to 24 Years (2,652 | 7.2%) for women.
| Age Bracket | Male | Female |
| Under 5 Years | 1,945 (6.0%) | 1,991 (5.4%) |
| 5 to 9 Years | 2,232 (6.9%) | 2,441 (6.6%) |
| 10 to 14 Years | 2,315 (7.1%) | 2,007 (5.5%) |
| 15 to 19 Years | 2,254 (6.9%) | 2,556 (7.0%) |
| 20 to 24 Years | 2,359 (7.2%) | 2,652 (7.2%) |
| 25 to 29 Years | 1,902 (5.9%) | 2,231 (6.1%) |
| 30 to 34 Years | 1,941 (6.0%) | 2,158 (5.9%) |
| 35 to 39 Years | 1,612 (5.0%) | 1,903 (5.2%) |
| 40 to 44 Years | 2,119 (6.5%) | 2,391 (6.5%) |
| 45 to 49 Years | 1,844 (5.7%) | 2,107 (5.7%) |
| 50 to 54 Years | 2,141 (6.6%) | 2,185 (5.9%) |
| 55 to 59 Years | 2,034 (6.2%) | 2,574 (7.0%) |
| 60 to 64 Years | 2,122 (6.5%) | 2,100 (5.7%) |
| 65 to 69 Years | 1,686 (5.2%) | 2,195 (6.0%) |
| 70 to 74 Years | 1,751 (5.4%) | 1,786 (4.9%) |
| 75 to 79 Years | 1,063 (3.3%) | 1,131 (3.1%) |
| 80 to 84 Years | 634 (1.9%) | 1,076 (2.9%) |
| 85 Years and over | 576 (1.8%) | 1,295 (3.5%) |
| Total | 32,530 (100.0%) | 36,779 (100.0%) |
Families and Households in Greenwood County
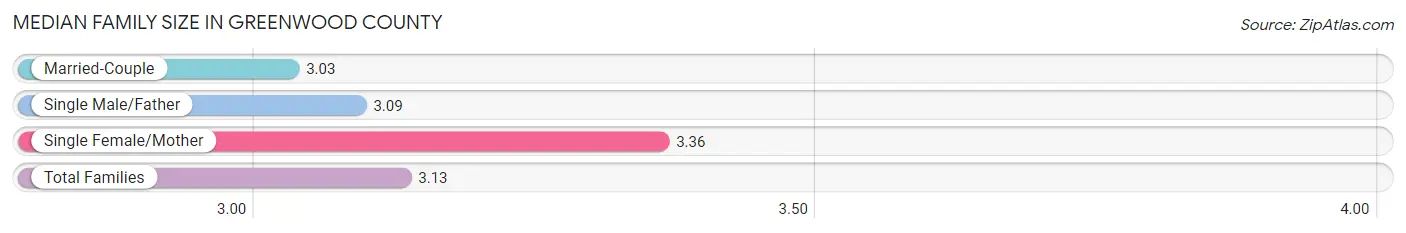
Median Family Size in Greenwood County
The median family size in Greenwood County is 3.13 persons per family, with single female/mother families (4,670 | 27.9%) accounting for the largest median family size of 3.36 persons per family. On the other hand, married-couple families (10,849 | 64.9%) represent the smallest median family size with 3.03 persons per family.
| Family Type | # Families | Family Size |
| Married-Couple | 10,849 (64.9%) | 3.03 |
| Single Male/Father | 1,193 (7.1%) | 3.09 |
| Single Female/Mother | 4,670 (27.9%) | 3.36 |
| Total Families | 16,712 (100.0%) | 3.13 |
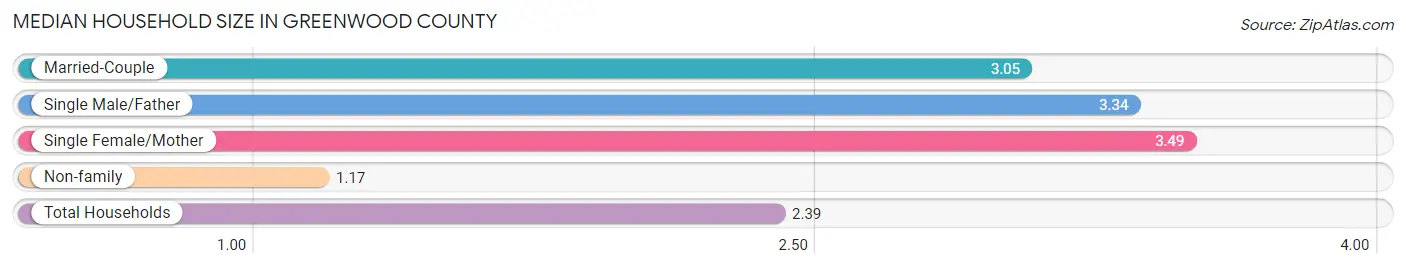
Median Household Size in Greenwood County
The median household size in Greenwood County is 2.39 persons per household, with single female/mother households (4,670 | 16.9%) accounting for the largest median household size of 3.49 persons per household. non-family households (10,928 | 39.5%) represent the smallest median household size with 1.17 persons per household.
| Household Type | # Households | Household Size |
| Married-Couple | 10,849 (39.3%) | 3.05 |
| Single Male/Father | 1,193 (4.3%) | 3.34 |
| Single Female/Mother | 4,670 (16.9%) | 3.49 |
| Non-family | 10,928 (39.5%) | 1.17 |
| Total Households | 27,640 (100.0%) | 2.39 |
Household Size by Marriage Status in Greenwood County
Out of a total of 27,640 households in Greenwood County, 16,712 (60.5%) are family households, while 10,928 (39.5%) are nonfamily households. The most numerous type of family households are 2-person households, comprising 8,403, and the most common type of nonfamily households are 1-person households, comprising 9,624.
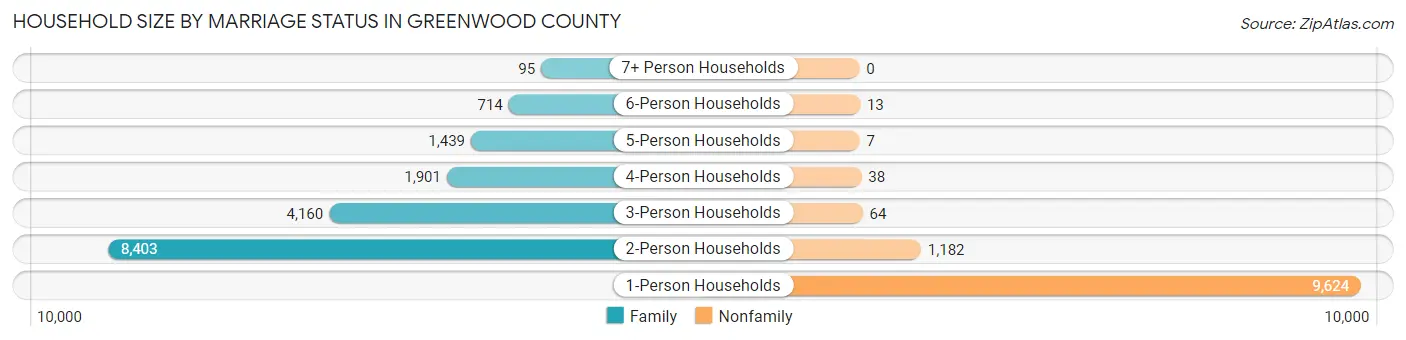
| Household Size | Family Households | Nonfamily Households |
| 1-Person Households | - | 9,624 (34.8%) |
| 2-Person Households | 8,403 (30.4%) | 1,182 (4.3%) |
| 3-Person Households | 4,160 (15.0%) | 64 (0.2%) |
| 4-Person Households | 1,901 (6.9%) | 38 (0.1%) |
| 5-Person Households | 1,439 (5.2%) | 7 (0.0%) |
| 6-Person Households | 714 (2.6%) | 13 (0.1%) |
| 7+ Person Households | 95 (0.3%) | 0 (0.0%) |
| Total | 16,712 (60.5%) | 10,928 (39.5%) |
Female Fertility in Greenwood County
Fertility by Age in Greenwood County
Average fertility rate in Greenwood County is 43.0 births per 1,000 women. Women in the age bracket of 20 to 34 years have the highest fertility rate with 86.0 births per 1,000 women. Women in the age bracket of 20 to 34 years acount for 86.9% of all women with births.
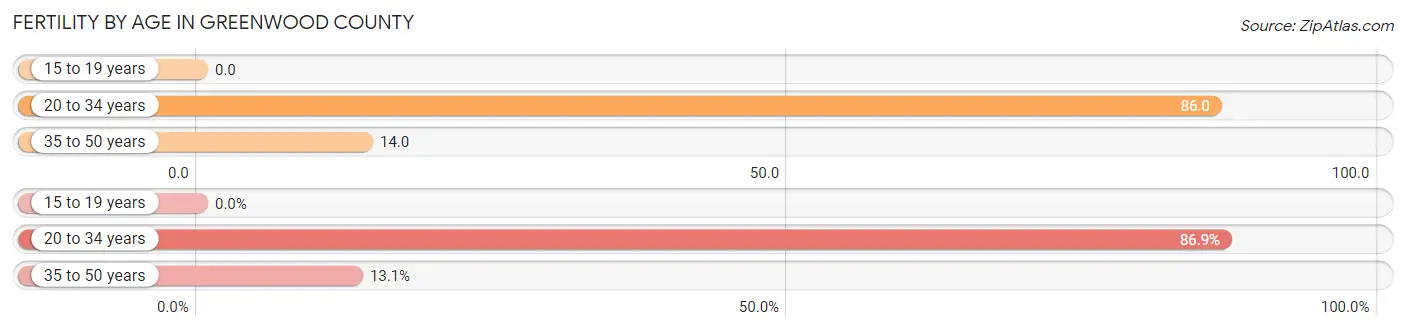
| Age Bracket | Women with Births | Births / 1,000 Women |
| 15 to 19 years | 0 (0.0%) | 0.0 |
| 20 to 34 years | 608 (86.9%) | 86.0 |
| 35 to 50 years | 92 (13.1%) | 14.0 |
| Total | 700 (100.0%) | 43.0 |
Fertility by Age by Marriage Status in Greenwood County
34.0% of women with births (700) in Greenwood County are married. The highest percentage of unmarried women with births falls into 20 to 34 years age bracket with 68.6% of them unmarried at the time of birth, while the lowest percentage of unmarried women with births belong to 35 to 50 years age bracket with 48.9% of them unmarried.
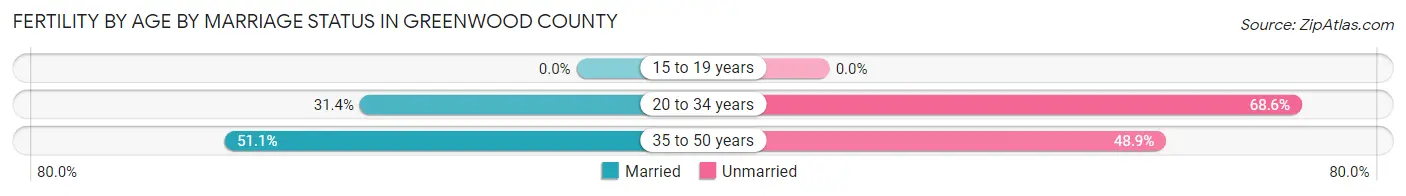
| Age Bracket | Married | Unmarried |
| 15 to 19 years | 0 (0.0%) | 0 (0.0%) |
| 20 to 34 years | 191 (31.4%) | 417 (68.6%) |
| 35 to 50 years | 47 (51.1%) | 45 (48.9%) |
| Total | 238 (34.0%) | 462 (66.0%) |
Fertility by Education in Greenwood County
Average fertility rate in Greenwood County is 43.0 births per 1,000 women. Women with the education attainment of high school diploma have the highest fertility rate of 57.0 births per 1,000 women, while women with the education attainment of less than high school have the lowest fertility at 14.0 births per 1,000 women. Women with the education attainment of college or associate's degree represent 44.4% of all women with births.
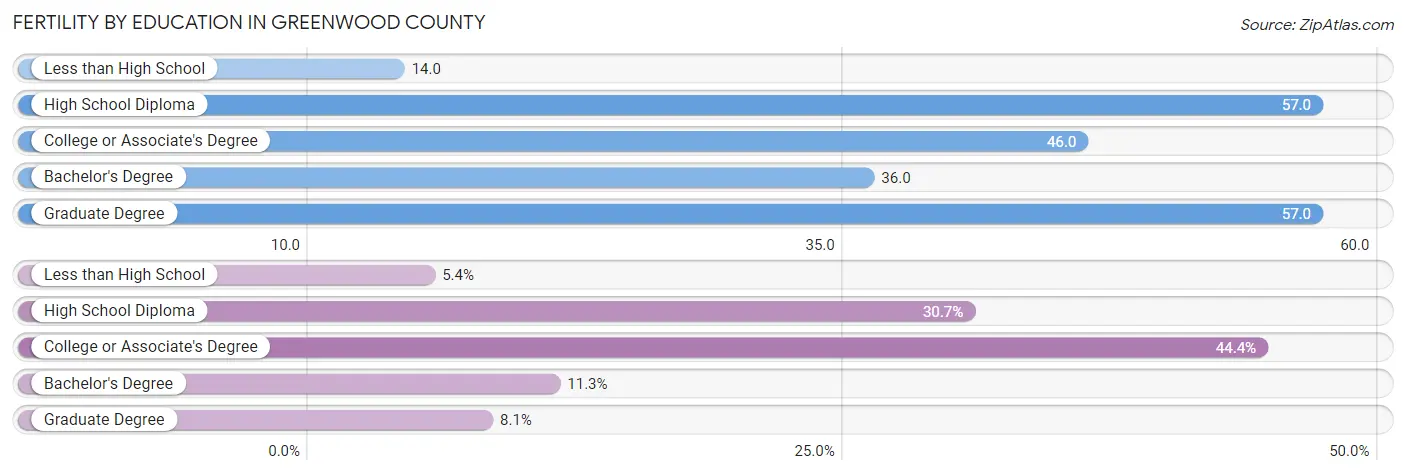
| Educational Attainment | Women with Births | Births / 1,000 Women |
| Less than High School | 38 (5.4%) | 14.0 |
| High School Diploma | 215 (30.7%) | 57.0 |
| College or Associate's Degree | 311 (44.4%) | 46.0 |
| Bachelor's Degree | 79 (11.3%) | 36.0 |
| Graduate Degree | 57 (8.1%) | 57.0 |
| Total | 700 (100.0%) | 43.0 |
Fertility by Education by Marriage Status in Greenwood County
66.0% of women with births in Greenwood County are unmarried. Women with the educational attainment of bachelor's degree are most likely to be married with 92.4% of them married at childbirth, while women with the educational attainment of graduate degree are least likely to be married with 100.0% of them unmarried at childbirth.
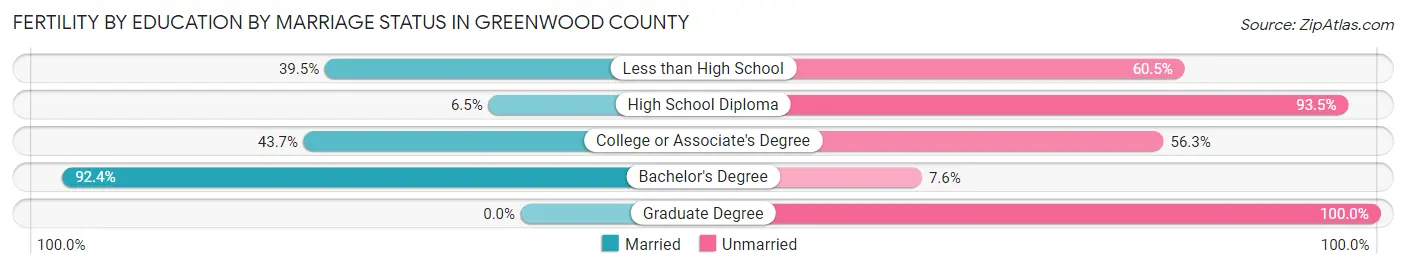
| Educational Attainment | Married | Unmarried |
| Less than High School | 15 (39.5%) | 23 (60.5%) |
| High School Diploma | 14 (6.5%) | 201 (93.5%) |
| College or Associate's Degree | 136 (43.7%) | 175 (56.3%) |
| Bachelor's Degree | 73 (92.4%) | 6 (7.6%) |
| Graduate Degree | 0 (0.0%) | 57 (100.0%) |
| Total | 238 (34.0%) | 462 (66.0%) |
Employment Characteristics in Greenwood County
Employment by Class of Employer in Greenwood County
Among the 28,878 employed individuals in Greenwood County, private company employees (21,018 | 72.8%), not-for-profit organizations (2,261 | 7.8%), and state government employees (2,124 | 7.4%) make up the most common classes of employment.
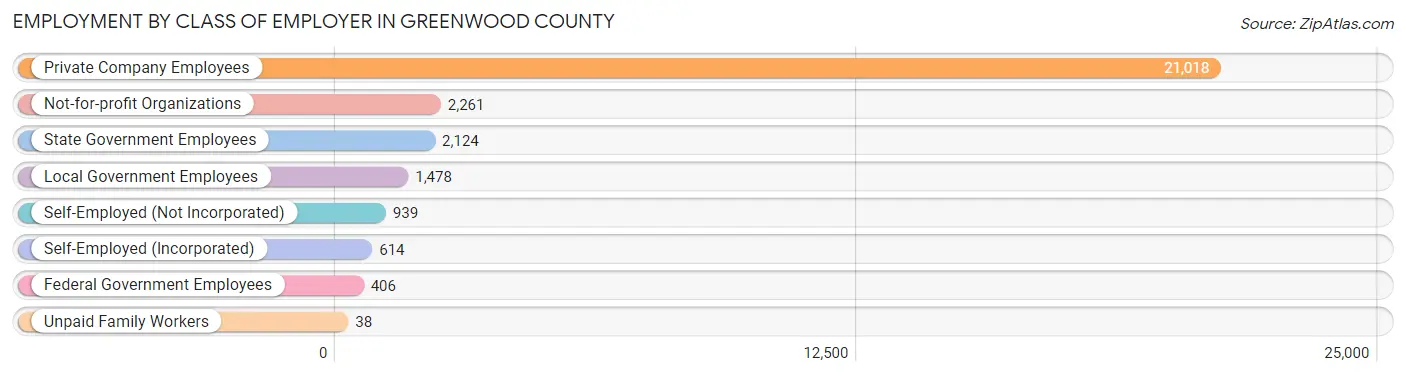
| Employer Class | # Employees | % Employees |
| Private Company Employees | 21,018 | 72.8% |
| Self-Employed (Incorporated) | 614 | 2.1% |
| Self-Employed (Not Incorporated) | 939 | 3.3% |
| Not-for-profit Organizations | 2,261 | 7.8% |
| Local Government Employees | 1,478 | 5.1% |
| State Government Employees | 2,124 | 7.4% |
| Federal Government Employees | 406 | 1.4% |
| Unpaid Family Workers | 38 | 0.1% |
| Total | 28,878 | 100.0% |
Employment Status by Age in Greenwood County
According to the labor force statistics for Greenwood County, out of the total population over 16 years of age (55,529), 56.1% or 31,152 individuals are in the labor force, with 5.5% or 1,713 of them unemployed. The age group with the highest labor force participation rate is 25 to 29 years, with 83.9% or 3,468 individuals in the labor force. Within the labor force, the 16 to 19 years age range has the highest percentage of unemployed individuals, with 27.1% or 477 of them being unemployed.
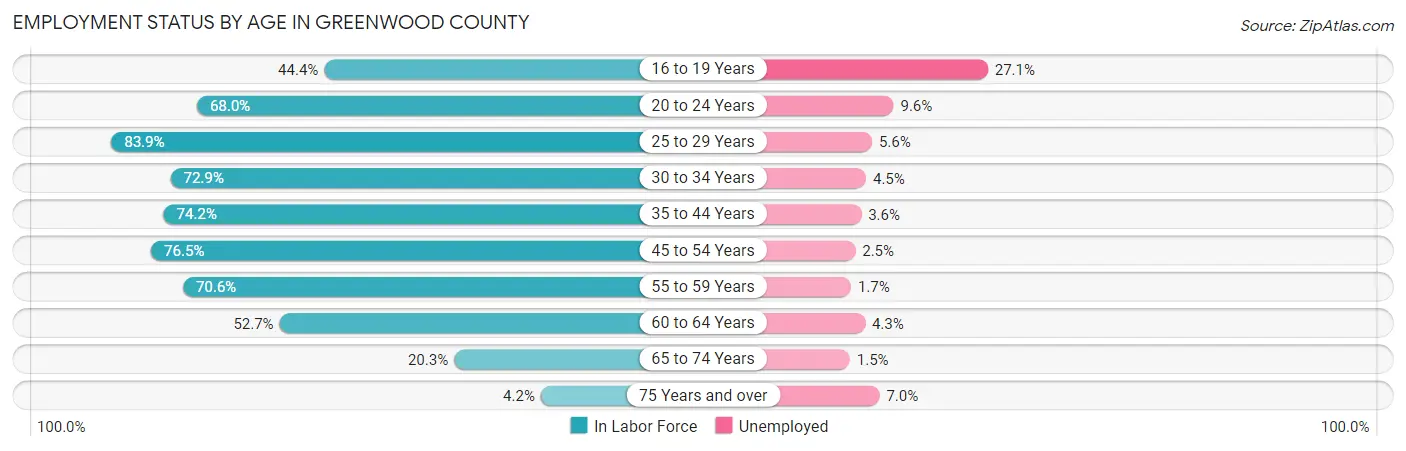
| Age Bracket | In Labor Force | Unemployed |
| 16 to 19 Years | 1,759 (44.4%) | 477 (27.1%) |
| 20 to 24 Years | 3,407 (68.0%) | 327 (9.6%) |
| 25 to 29 Years | 3,468 (83.9%) | 194 (5.6%) |
| 30 to 34 Years | 2,988 (72.9%) | 134 (4.5%) |
| 35 to 44 Years | 5,955 (74.2%) | 214 (3.6%) |
| 45 to 54 Years | 6,332 (76.5%) | 158 (2.5%) |
| 55 to 59 Years | 3,253 (70.6%) | 55 (1.7%) |
| 60 to 64 Years | 2,225 (52.7%) | 96 (4.3%) |
| 65 to 74 Years | 1,506 (20.3%) | 23 (1.5%) |
| 75 Years and over | 243 (4.2%) | 17 (7.0%) |
| Total | 31,152 (56.1%) | 1,713 (5.5%) |
Employment Status by Educational Attainment in Greenwood County
According to labor force statistics for Greenwood County, 72.6% of individuals (24,222) out of the total population between 25 and 64 years of age (33,364) are in the labor force, with 3.5% or 848 of them being unemployed. The group with the highest labor force participation rate are those with the educational attainment of bachelor's degree or higher, with 85.1% or 6,360 individuals in the labor force. Within the labor force, individuals with less than high school education have the highest percentage of unemployment, with 6.4% or 156 of them being unemployed.
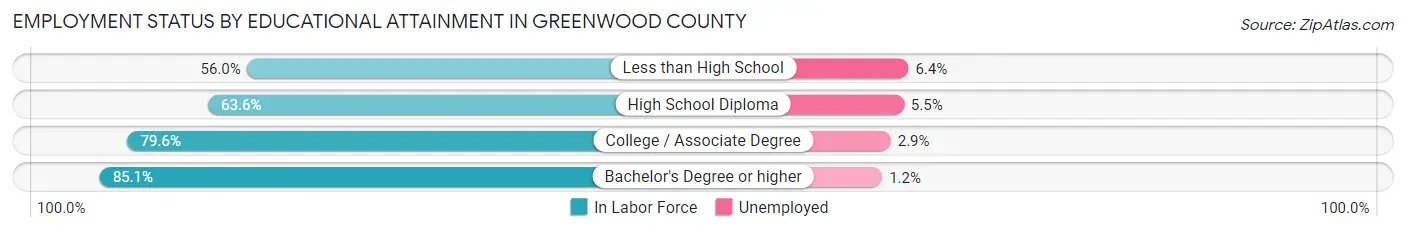
| Educational Attainment | In Labor Force | Unemployed |
| Less than High School | 2,438 (56.0%) | 279 (6.4%) |
| High School Diploma | 6,819 (63.6%) | 590 (5.5%) |
| College / Associate Degree | 8,610 (79.6%) | 314 (2.9%) |
| Bachelor's Degree or higher | 6,360 (85.1%) | 90 (1.2%) |
| Total | 24,222 (72.6%) | 1,168 (3.5%) |
Employment Occupations by Sex in Greenwood County
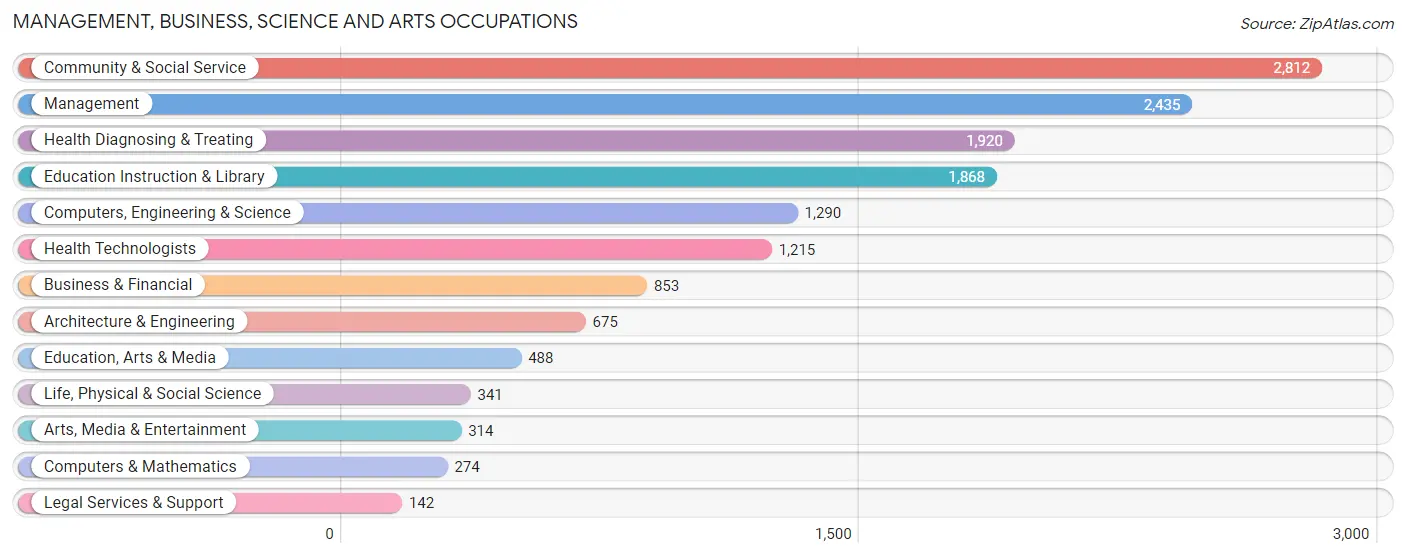
Management, Business, Science and Arts Occupations
The most common Management, Business, Science and Arts occupations in Greenwood County are Community & Social Service (2,812 | 9.6%), Management (2,435 | 8.3%), Health Diagnosing & Treating (1,920 | 6.5%), Education Instruction & Library (1,868 | 6.4%), and Computers, Engineering & Science (1,290 | 4.4%).
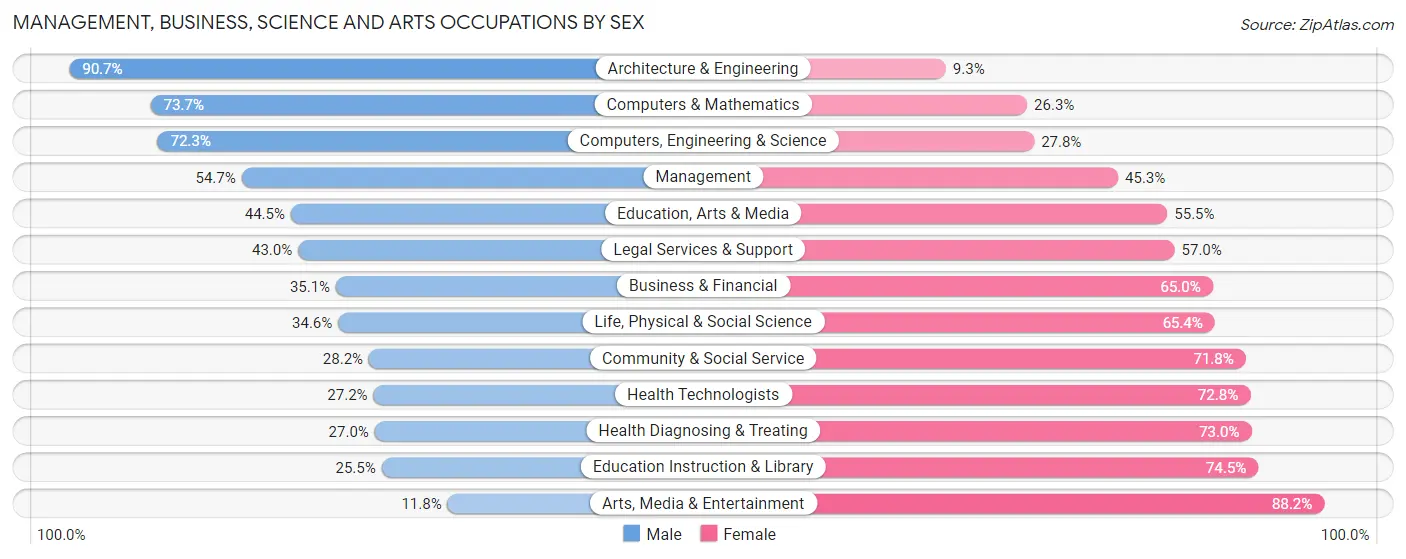
Management, Business, Science and Arts Occupations by Sex
Within the Management, Business, Science and Arts occupations in Greenwood County, the most male-oriented occupations are Architecture & Engineering (90.7%), Computers & Mathematics (73.7%), and Computers, Engineering & Science (72.3%), while the most female-oriented occupations are Arts, Media & Entertainment (88.2%), Education Instruction & Library (74.5%), and Health Diagnosing & Treating (73.0%).
| Occupation | Male | Female |
| Management | 1,333 (54.7%) | 1,102 (45.3%) |
| Business & Financial | 299 (35.0%) | 554 (64.9%) |
| Computers, Engineering & Science | 932 (72.3%) | 358 (27.8%) |
| Computers & Mathematics | 202 (73.7%) | 72 (26.3%) |
| Architecture & Engineering | 612 (90.7%) | 63 (9.3%) |
| Life, Physical & Social Science | 118 (34.6%) | 223 (65.4%) |
| Community & Social Service | 792 (28.2%) | 2,020 (71.8%) |
| Education, Arts & Media | 217 (44.5%) | 271 (55.5%) |
| Legal Services & Support | 61 (43.0%) | 81 (57.0%) |
| Education Instruction & Library | 477 (25.5%) | 1,391 (74.5%) |
| Arts, Media & Entertainment | 37 (11.8%) | 277 (88.2%) |
| Health Diagnosing & Treating | 518 (27.0%) | 1,402 (73.0%) |
| Health Technologists | 331 (27.2%) | 884 (72.8%) |
| Total (Category) | 3,874 (41.6%) | 5,436 (58.4%) |
| Total (Overall) | 14,846 (50.5%) | 14,549 (49.5%) |
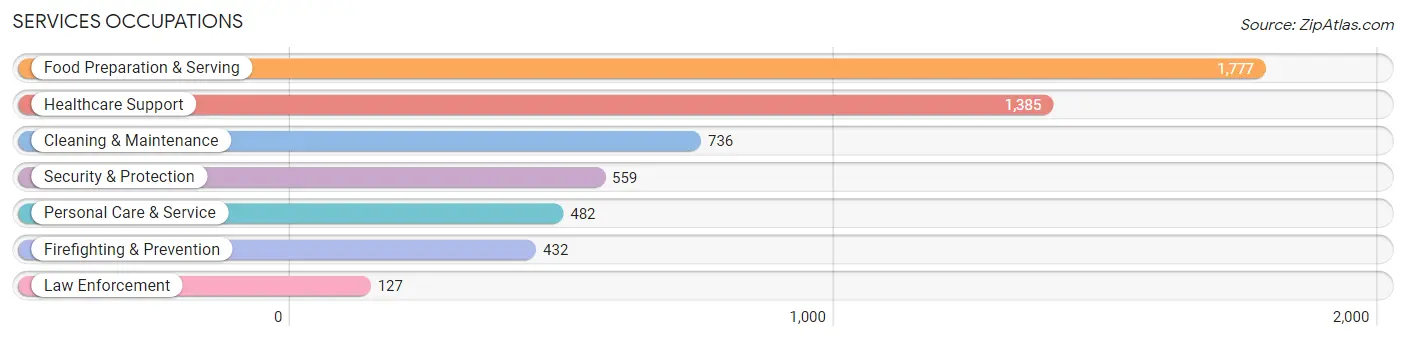
Services Occupations
The most common Services occupations in Greenwood County are Food Preparation & Serving (1,777 | 6.0%), Healthcare Support (1,385 | 4.7%), Cleaning & Maintenance (736 | 2.5%), Security & Protection (559 | 1.9%), and Personal Care & Service (482 | 1.6%).
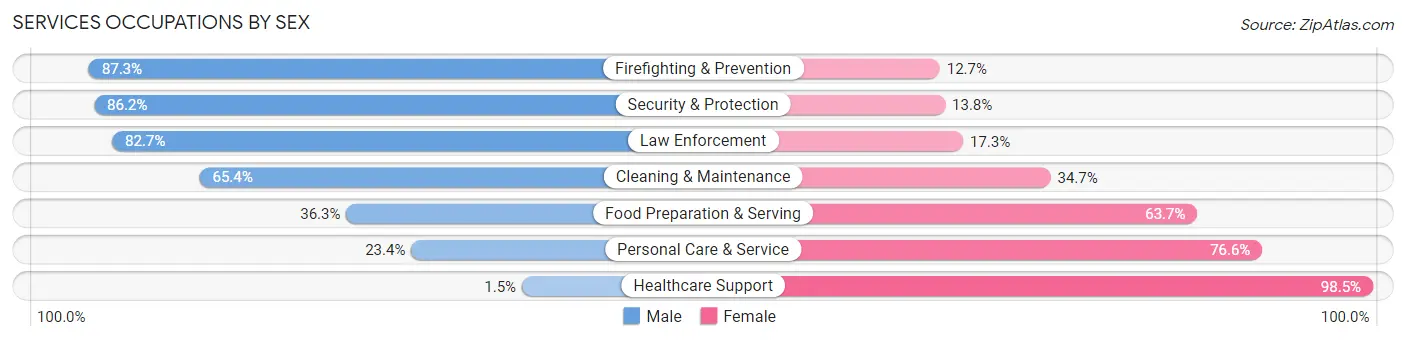
Services Occupations by Sex
Within the Services occupations in Greenwood County, the most male-oriented occupations are Firefighting & Prevention (87.3%), Security & Protection (86.2%), and Law Enforcement (82.7%), while the most female-oriented occupations are Healthcare Support (98.5%), Personal Care & Service (76.6%), and Food Preparation & Serving (63.7%).
| Occupation | Male | Female |
| Healthcare Support | 21 (1.5%) | 1,364 (98.5%) |
| Security & Protection | 482 (86.2%) | 77 (13.8%) |
| Firefighting & Prevention | 377 (87.3%) | 55 (12.7%) |
| Law Enforcement | 105 (82.7%) | 22 (17.3%) |
| Food Preparation & Serving | 645 (36.3%) | 1,132 (63.7%) |
| Cleaning & Maintenance | 481 (65.3%) | 255 (34.6%) |
| Personal Care & Service | 113 (23.4%) | 369 (76.6%) |
| Total (Category) | 1,742 (35.3%) | 3,197 (64.7%) |
| Total (Overall) | 14,846 (50.5%) | 14,549 (49.5%) |
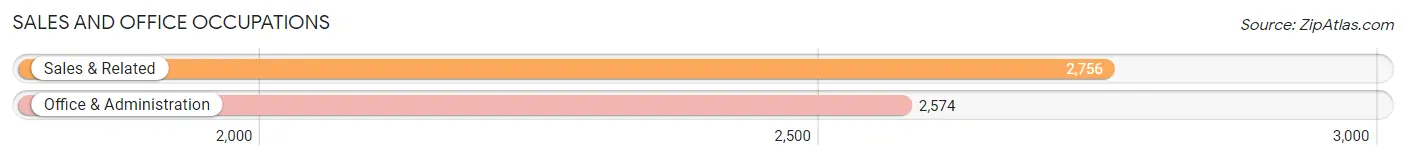
Sales and Office Occupations
The most common Sales and Office occupations in Greenwood County are Sales & Related (2,756 | 9.4%), and Office & Administration (2,574 | 8.8%).
Sales and Office Occupations by Sex
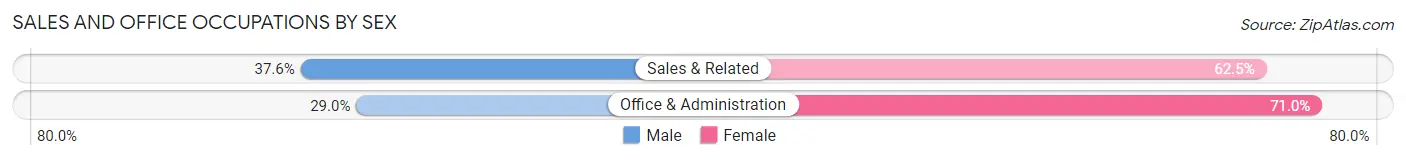
| Occupation | Male | Female |
| Sales & Related | 1,035 (37.6%) | 1,721 (62.5%) |
| Office & Administration | 746 (29.0%) | 1,828 (71.0%) |
| Total (Category) | 1,781 (33.4%) | 3,549 (66.6%) |
| Total (Overall) | 14,846 (50.5%) | 14,549 (49.5%) |
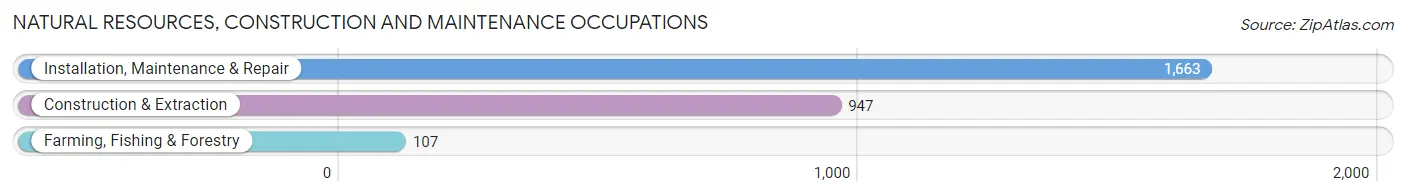
Natural Resources, Construction and Maintenance Occupations
The most common Natural Resources, Construction and Maintenance occupations in Greenwood County are Installation, Maintenance & Repair (1,663 | 5.7%), Construction & Extraction (947 | 3.2%), and Farming, Fishing & Forestry (107 | 0.4%).
Natural Resources, Construction and Maintenance Occupations by Sex
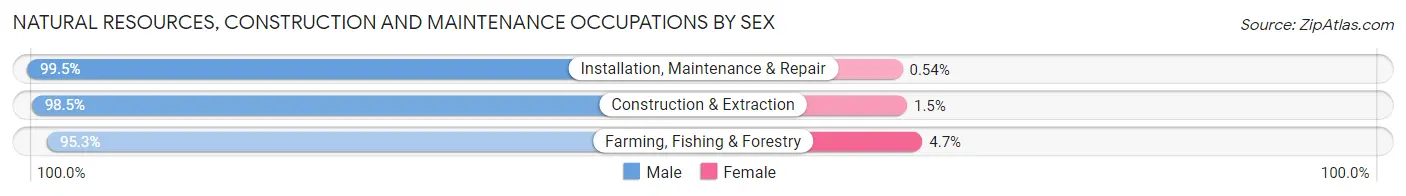
| Occupation | Male | Female |
| Farming, Fishing & Forestry | 102 (95.3%) | 5 (4.7%) |
| Construction & Extraction | 933 (98.5%) | 14 (1.5%) |
| Installation, Maintenance & Repair | 1,654 (99.5%) | 9 (0.5%) |
| Total (Category) | 2,689 (99.0%) | 28 (1.0%) |
| Total (Overall) | 14,846 (50.5%) | 14,549 (49.5%) |
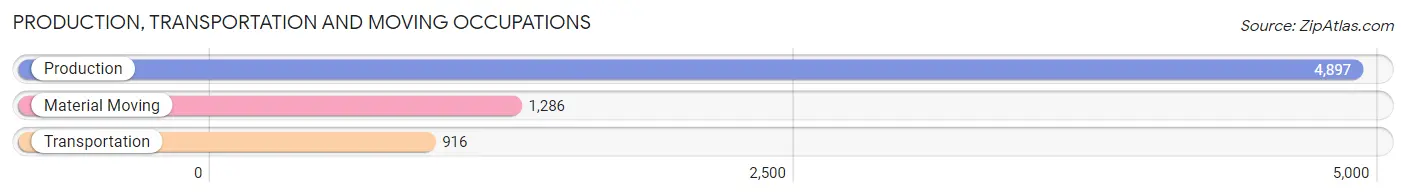
Production, Transportation and Moving Occupations
The most common Production, Transportation and Moving occupations in Greenwood County are Production (4,897 | 16.7%), Material Moving (1,286 | 4.4%), and Transportation (916 | 3.1%).
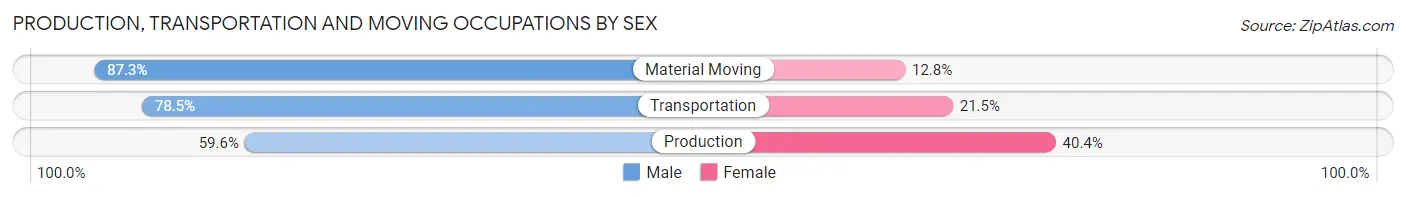
Production, Transportation and Moving Occupations by Sex
| Occupation | Male | Female |
| Production | 2,919 (59.6%) | 1,978 (40.4%) |
| Transportation | 719 (78.5%) | 197 (21.5%) |
| Material Moving | 1,122 (87.3%) | 164 (12.8%) |
| Total (Category) | 4,760 (67.0%) | 2,339 (33.0%) |
| Total (Overall) | 14,846 (50.5%) | 14,549 (49.5%) |
Employment Industries by Sex in Greenwood County
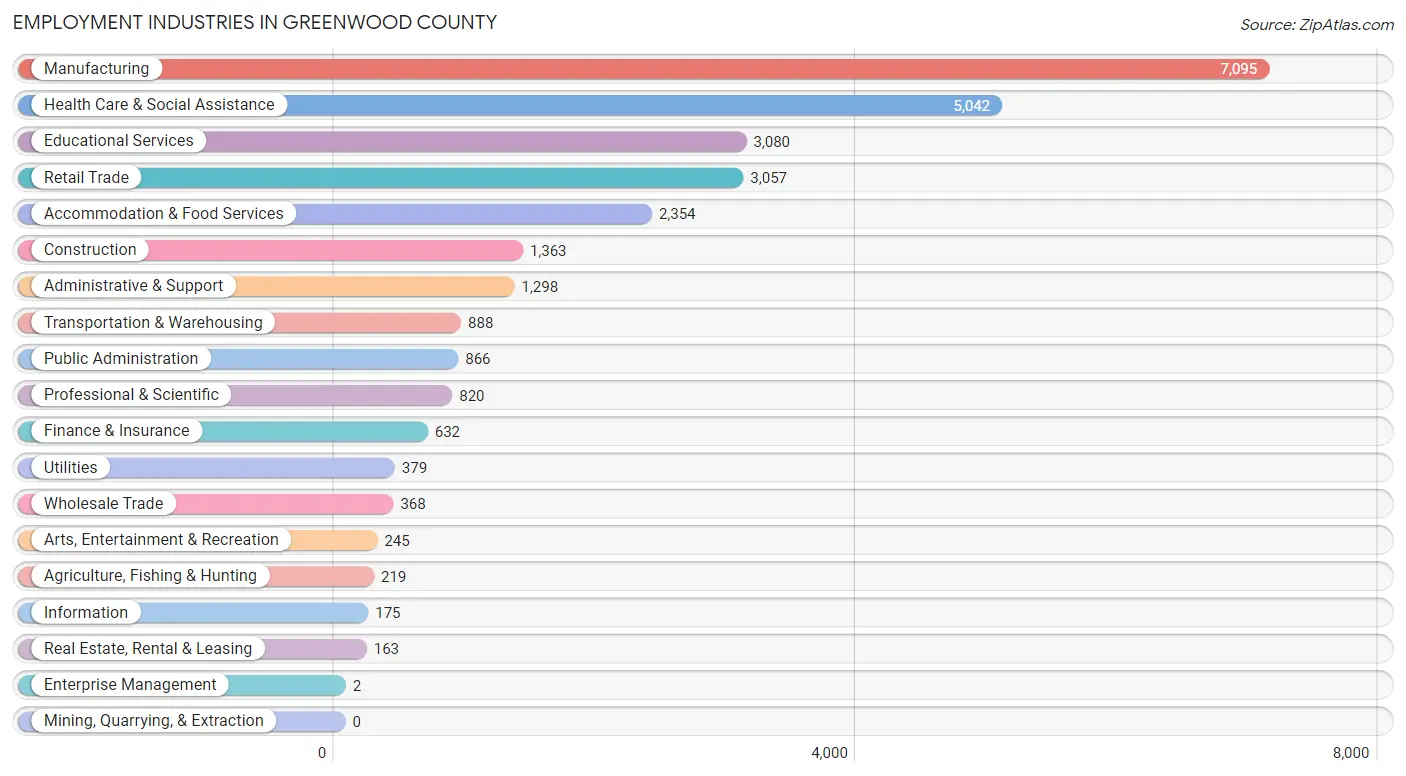
Employment Industries in Greenwood County
The major employment industries in Greenwood County include Manufacturing (7,095 | 24.1%), Health Care & Social Assistance (5,042 | 17.2%), Educational Services (3,080 | 10.5%), Retail Trade (3,057 | 10.4%), and Accommodation & Food Services (2,354 | 8.0%).
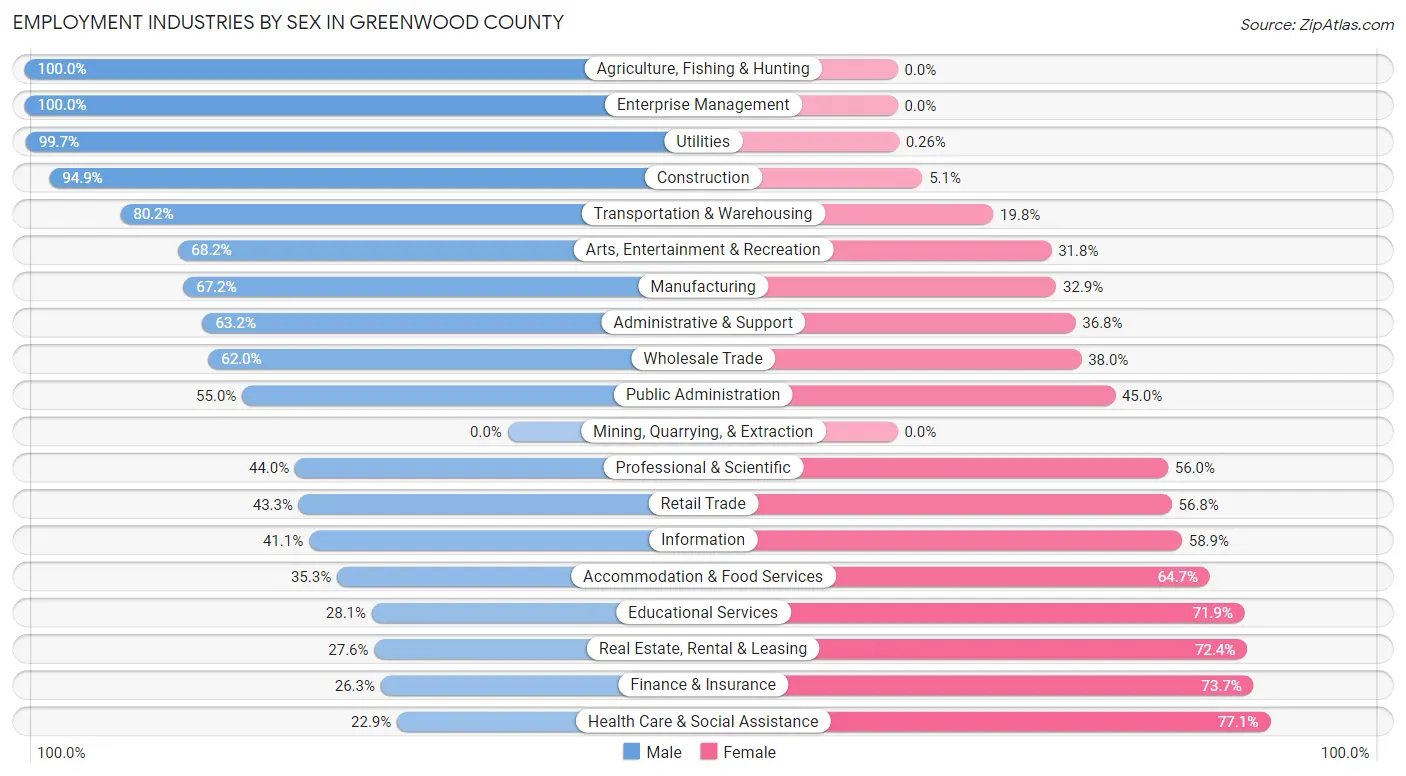
Employment Industries by Sex in Greenwood County
The Greenwood County industries that see more men than women are Agriculture, Fishing & Hunting (100.0%), Enterprise Management (100.0%), and Utilities (99.7%), whereas the industries that tend to have a higher number of women are Health Care & Social Assistance (77.1%), Finance & Insurance (73.7%), and Real Estate, Rental & Leasing (72.4%).
| Industry | Male | Female |
| Agriculture, Fishing & Hunting | 219 (100.0%) | 0 (0.0%) |
| Mining, Quarrying, & Extraction | 0 (0.0%) | 0 (0.0%) |
| Construction | 1,293 (94.9%) | 70 (5.1%) |
| Manufacturing | 4,764 (67.1%) | 2,331 (32.9%) |
| Wholesale Trade | 228 (62.0%) | 140 (38.0%) |
| Retail Trade | 1,322 (43.2%) | 1,735 (56.8%) |
| Transportation & Warehousing | 712 (80.2%) | 176 (19.8%) |
| Utilities | 378 (99.7%) | 1 (0.3%) |
| Information | 72 (41.1%) | 103 (58.9%) |
| Finance & Insurance | 166 (26.3%) | 466 (73.7%) |
| Real Estate, Rental & Leasing | 45 (27.6%) | 118 (72.4%) |
| Professional & Scientific | 361 (44.0%) | 459 (56.0%) |
| Enterprise Management | 2 (100.0%) | 0 (0.0%) |
| Administrative & Support | 820 (63.2%) | 478 (36.8%) |
| Educational Services | 866 (28.1%) | 2,214 (71.9%) |
| Health Care & Social Assistance | 1,154 (22.9%) | 3,888 (77.1%) |
| Arts, Entertainment & Recreation | 167 (68.2%) | 78 (31.8%) |
| Accommodation & Food Services | 832 (35.3%) | 1,522 (64.7%) |
| Public Administration | 476 (55.0%) | 390 (45.0%) |
| Total | 14,846 (50.5%) | 14,549 (49.5%) |
Education in Greenwood County
School Enrollment in Greenwood County
The most common levels of schooling among the 16,846 students in Greenwood County are college / undergraduate (4,737 | 28.1%), elementary school (3,705 | 22.0%), and middle school (3,151 | 18.7%).
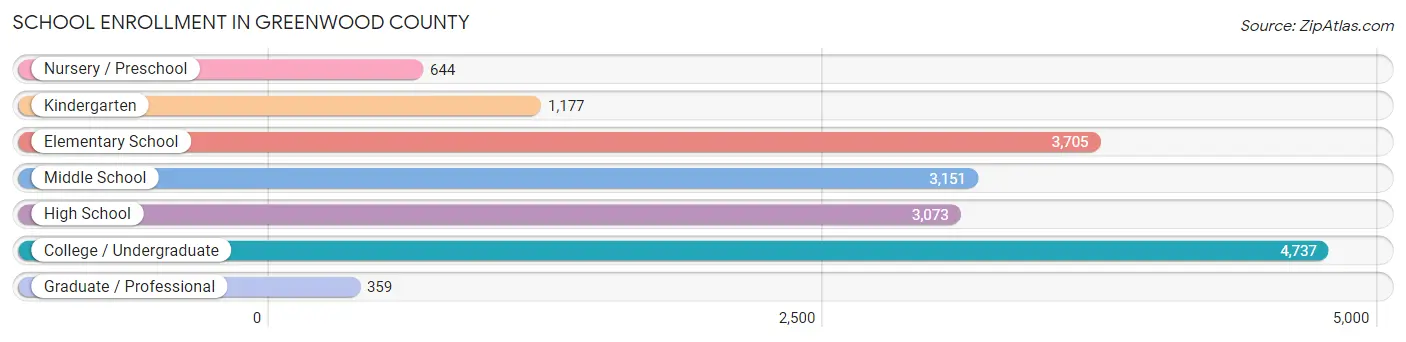
| School Level | # Students | % Students |
| Nursery / Preschool | 644 | 3.8% |
| Kindergarten | 1,177 | 7.0% |
| Elementary School | 3,705 | 22.0% |
| Middle School | 3,151 | 18.7% |
| High School | 3,073 | 18.2% |
| College / Undergraduate | 4,737 | 28.1% |
| Graduate / Professional | 359 | 2.1% |
| Total | 16,846 | 100.0% |
School Enrollment by Age by Funding Source in Greenwood County
Out of a total of 16,846 students who are enrolled in schools in Greenwood County, 1,685 (10.0%) attend a private institution, while the remaining 15,161 (90.0%) are enrolled in public schools. The age group of 3 to 4 year olds has the highest likelihood of being enrolled in private schools, with 154 (48.6% in the age bracket) enrolled. Conversely, the age group of 20 to 24 year olds has the lowest likelihood of being enrolled in a private school, with 2,315 (96.8% in the age bracket) attending a public institution.
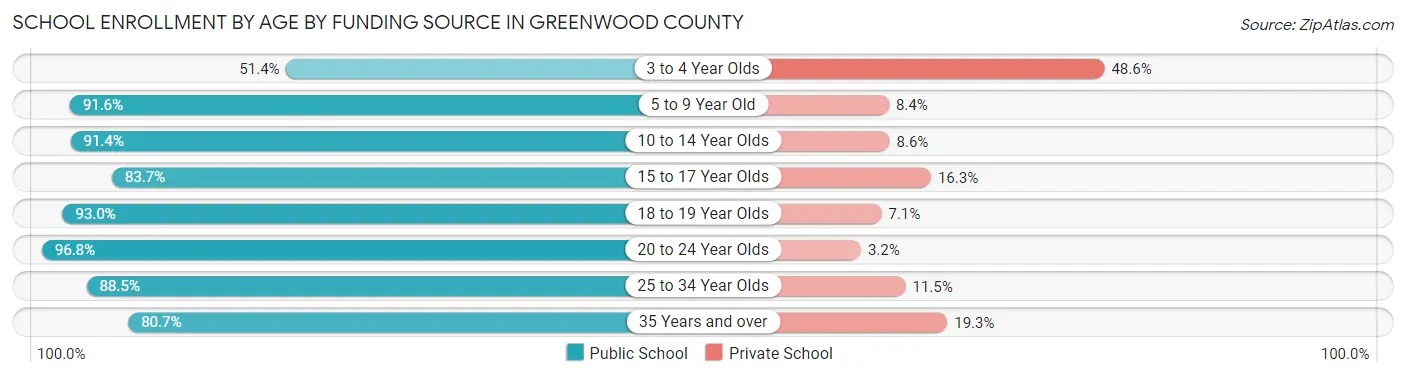
| Age Bracket | Public School | Private School |
| 3 to 4 Year Olds | 163 (51.4%) | 154 (48.6%) |
| 5 to 9 Year Old | 4,001 (91.6%) | 369 (8.4%) |
| 10 to 14 Year Olds | 3,868 (91.4%) | 362 (8.6%) |
| 15 to 17 Year Olds | 2,024 (83.7%) | 393 (16.3%) |
| 18 to 19 Year Olds | 1,581 (92.9%) | 120 (7.0%) |
| 20 to 24 Year Olds | 2,315 (96.8%) | 77 (3.2%) |
| 25 to 34 Year Olds | 637 (88.5%) | 83 (11.5%) |
| 35 Years and over | 564 (80.7%) | 135 (19.3%) |
| Total | 15,161 (90.0%) | 1,685 (10.0%) |
Educational Attainment by Field of Study in Greenwood County
Business (2,596 | 21.2%), education (2,022 | 16.5%), science & technology (1,361 | 11.1%), engineering (1,110 | 9.1%), and arts & humanities (748 | 6.1%) are the most common fields of study among 12,223 individuals in Greenwood County who have obtained a bachelor's degree or higher.
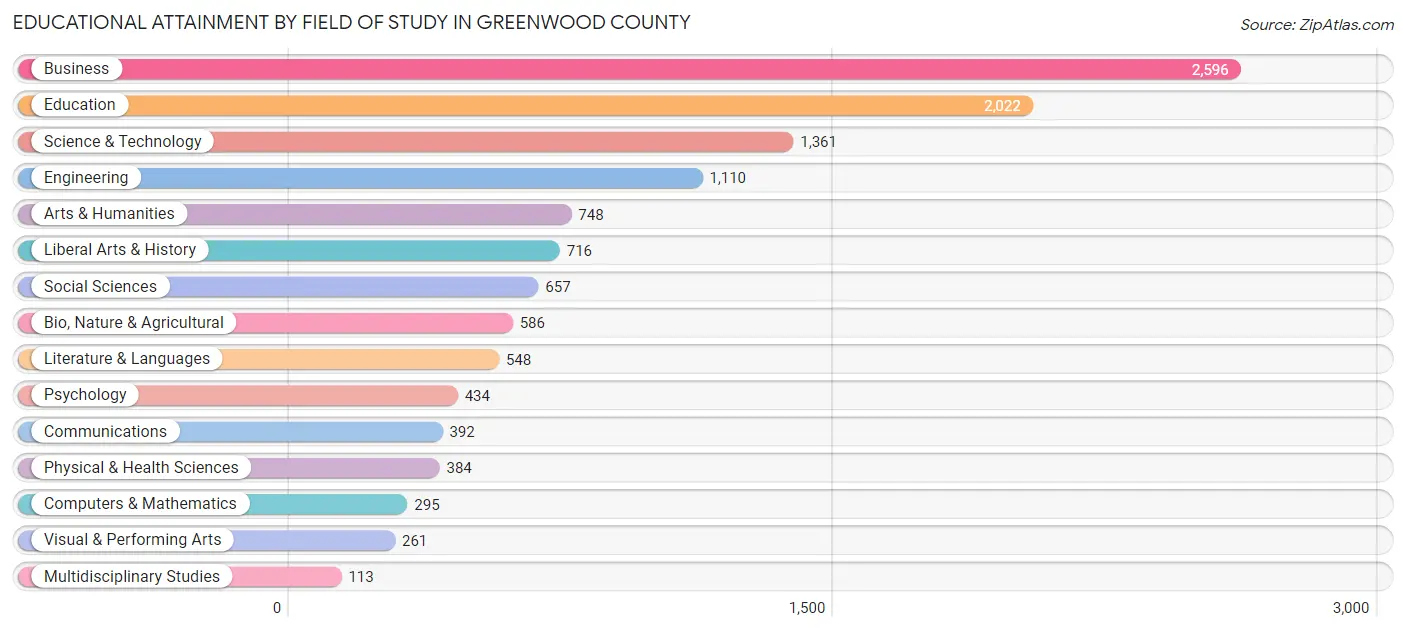
| Field of Study | # Graduates | % Graduates |
| Computers & Mathematics | 295 | 2.4% |
| Bio, Nature & Agricultural | 586 | 4.8% |
| Physical & Health Sciences | 384 | 3.1% |
| Psychology | 434 | 3.5% |
| Social Sciences | 657 | 5.4% |
| Engineering | 1,110 | 9.1% |
| Multidisciplinary Studies | 113 | 0.9% |
| Science & Technology | 1,361 | 11.1% |
| Business | 2,596 | 21.2% |
| Education | 2,022 | 16.5% |
| Literature & Languages | 548 | 4.5% |
| Liberal Arts & History | 716 | 5.9% |
| Visual & Performing Arts | 261 | 2.1% |
| Communications | 392 | 3.2% |
| Arts & Humanities | 748 | 6.1% |
| Total | 12,223 | 100.0% |
Transportation & Commute in Greenwood County
Vehicle Availability by Sex in Greenwood County
The most prevalent vehicle ownership categories in Greenwood County are males with 2 vehicles (5,855, accounting for 40.7%) and females with 2 vehicles (4,955, making up 42.5%).
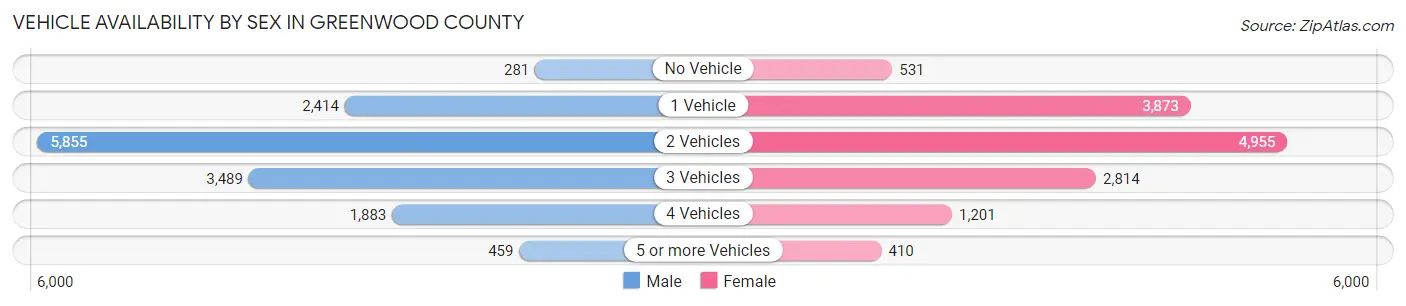
| Vehicles Available | Male | Female |
| No Vehicle | 281 (1.9%) | 531 (3.8%) |
| 1 Vehicle | 2,414 (16.8%) | 3,873 (28.1%) |
| 2 Vehicles | 5,855 (40.7%) | 4,955 (35.9%) |
| 3 Vehicles | 3,489 (24.3%) | 2,814 (20.4%) |
| 4 Vehicles | 1,883 (13.1%) | 1,201 (8.7%) |
| 5 or more Vehicles | 459 (3.2%) | 410 (3.0%) |
| Total | 14,381 (100.0%) | 13,784 (100.0%) |
Commute Time in Greenwood County
The most frequently occuring commute durations in Greenwood County are 10 to 14 minutes (6,336 commuters, 22.6%), 15 to 19 minutes (6,235 commuters, 22.2%), and 20 to 24 minutes (3,646 commuters, 13.0%).
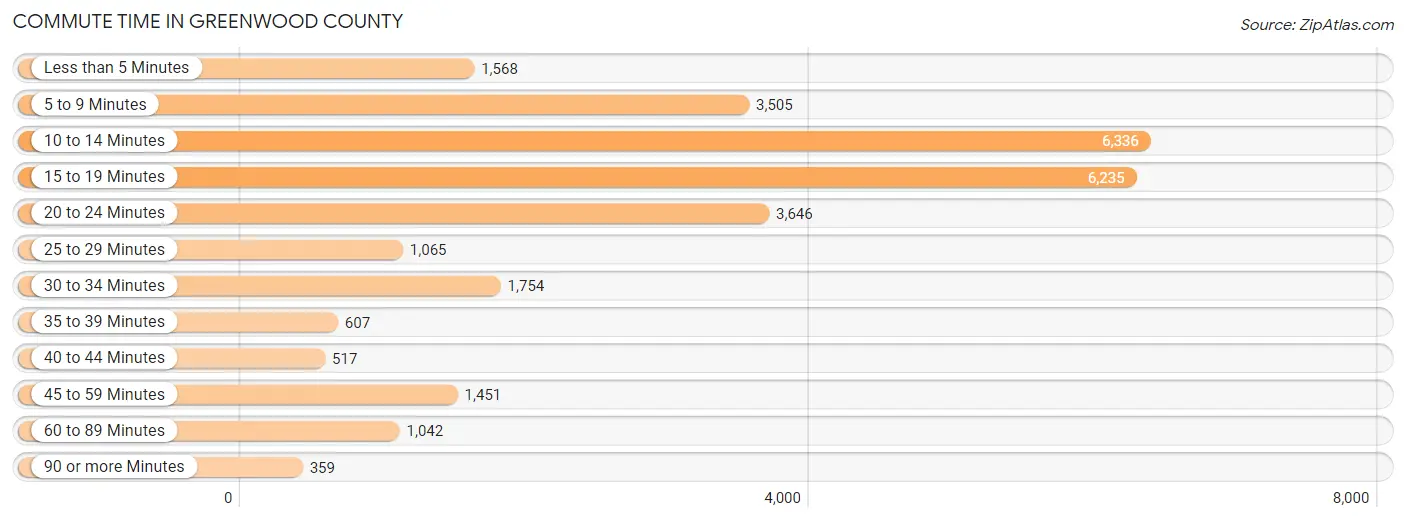
| Commute Time | # Commuters | % Commuters |
| Less than 5 Minutes | 1,568 | 5.6% |
| 5 to 9 Minutes | 3,505 | 12.5% |
| 10 to 14 Minutes | 6,336 | 22.6% |
| 15 to 19 Minutes | 6,235 | 22.2% |
| 20 to 24 Minutes | 3,646 | 13.0% |
| 25 to 29 Minutes | 1,065 | 3.8% |
| 30 to 34 Minutes | 1,754 | 6.2% |
| 35 to 39 Minutes | 607 | 2.2% |
| 40 to 44 Minutes | 517 | 1.8% |
| 45 to 59 Minutes | 1,451 | 5.2% |
| 60 to 89 Minutes | 1,042 | 3.7% |
| 90 or more Minutes | 359 | 1.3% |
Commute Time by Sex in Greenwood County
The most common commute times in Greenwood County are 10 to 14 minutes (2,952 commuters, 20.6%) for males and 10 to 14 minutes (3,384 commuters, 24.5%) for females.
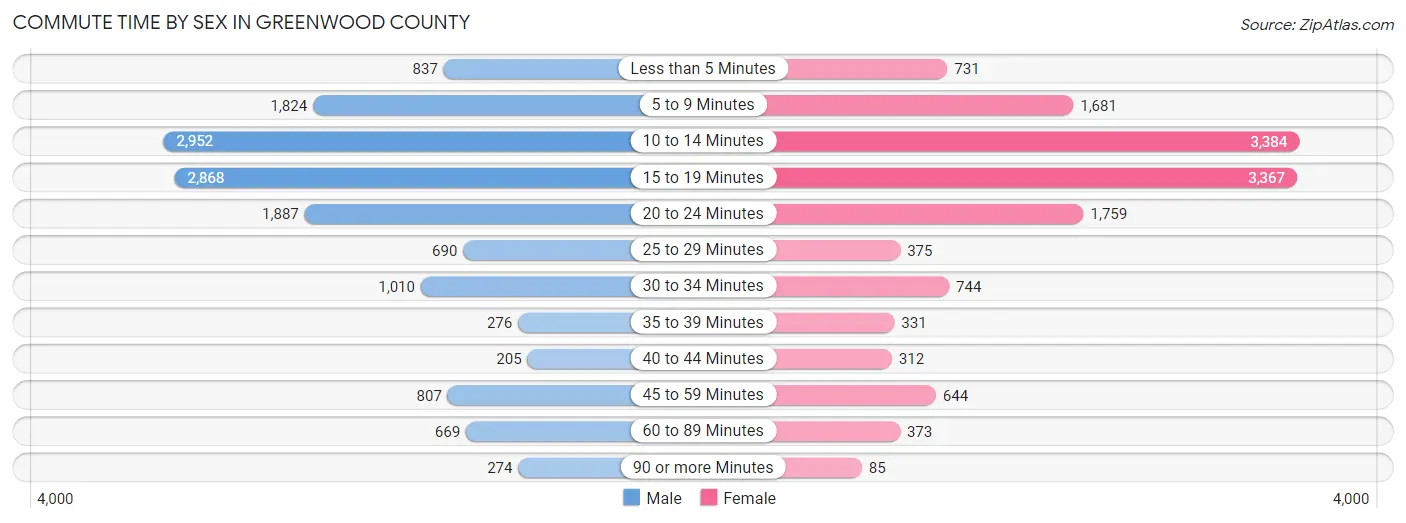
| Commute Time | Male | Female |
| Less than 5 Minutes | 837 (5.9%) | 731 (5.3%) |
| 5 to 9 Minutes | 1,824 (12.8%) | 1,681 (12.2%) |
| 10 to 14 Minutes | 2,952 (20.6%) | 3,384 (24.5%) |
| 15 to 19 Minutes | 2,868 (20.1%) | 3,367 (24.4%) |
| 20 to 24 Minutes | 1,887 (13.2%) | 1,759 (12.8%) |
| 25 to 29 Minutes | 690 (4.8%) | 375 (2.7%) |
| 30 to 34 Minutes | 1,010 (7.1%) | 744 (5.4%) |
| 35 to 39 Minutes | 276 (1.9%) | 331 (2.4%) |
| 40 to 44 Minutes | 205 (1.4%) | 312 (2.3%) |
| 45 to 59 Minutes | 807 (5.6%) | 644 (4.7%) |
| 60 to 89 Minutes | 669 (4.7%) | 373 (2.7%) |
| 90 or more Minutes | 274 (1.9%) | 85 (0.6%) |
Time of Departure to Work by Sex in Greenwood County
The most frequent times of departure to work in Greenwood County are 7:00 AM to 7:29 AM (2,749, 19.2%) for males and 7:30 AM to 7:59 AM (2,942, 21.3%) for females.
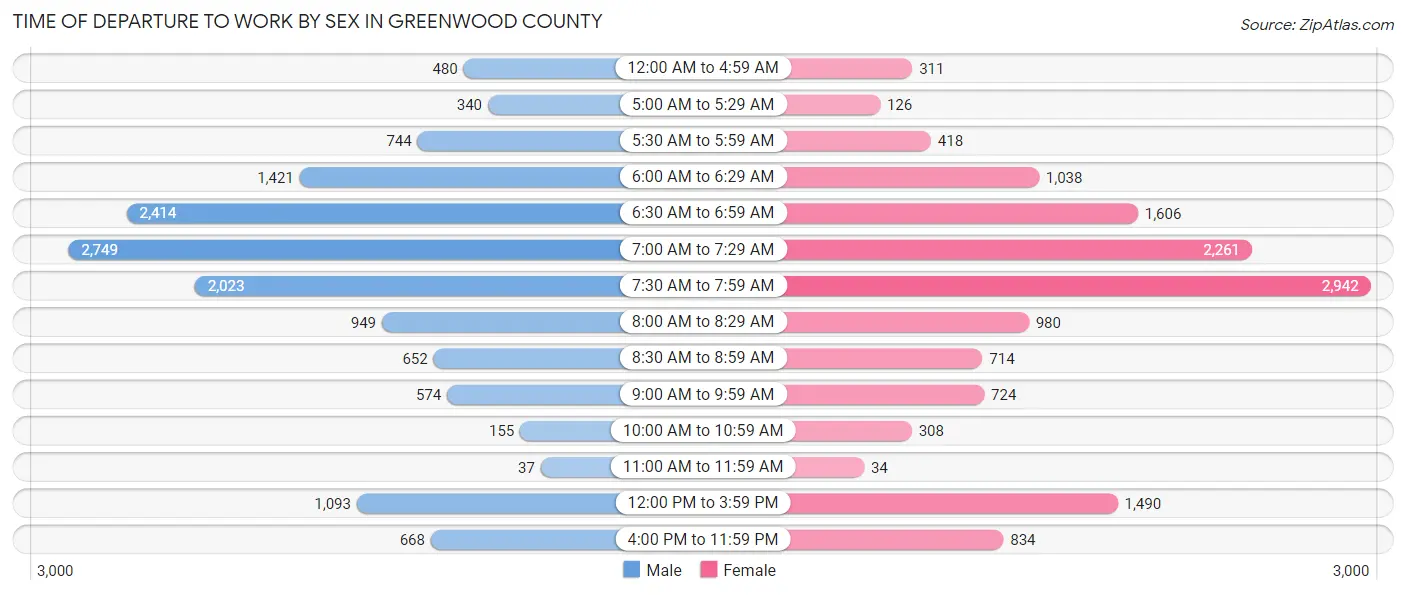
| Time of Departure | Male | Female |
| 12:00 AM to 4:59 AM | 480 (3.4%) | 311 (2.3%) |
| 5:00 AM to 5:29 AM | 340 (2.4%) | 126 (0.9%) |
| 5:30 AM to 5:59 AM | 744 (5.2%) | 418 (3.0%) |
| 6:00 AM to 6:29 AM | 1,421 (9.9%) | 1,038 (7.5%) |
| 6:30 AM to 6:59 AM | 2,414 (16.9%) | 1,606 (11.7%) |
| 7:00 AM to 7:29 AM | 2,749 (19.2%) | 2,261 (16.4%) |
| 7:30 AM to 7:59 AM | 2,023 (14.1%) | 2,942 (21.3%) |
| 8:00 AM to 8:29 AM | 949 (6.6%) | 980 (7.1%) |
| 8:30 AM to 8:59 AM | 652 (4.6%) | 714 (5.2%) |
| 9:00 AM to 9:59 AM | 574 (4.0%) | 724 (5.2%) |
| 10:00 AM to 10:59 AM | 155 (1.1%) | 308 (2.2%) |
| 11:00 AM to 11:59 AM | 37 (0.3%) | 34 (0.3%) |
| 12:00 PM to 3:59 PM | 1,093 (7.6%) | 1,490 (10.8%) |
| 4:00 PM to 11:59 PM | 668 (4.7%) | 834 (6.0%) |
| Total | 14,299 (100.0%) | 13,786 (100.0%) |
Housing Occupancy in Greenwood County
Occupancy by Ownership in Greenwood County
Of the total 27,640 dwellings in Greenwood County, owner-occupied units account for 17,983 (65.1%), while renter-occupied units make up 9,657 (34.9%).
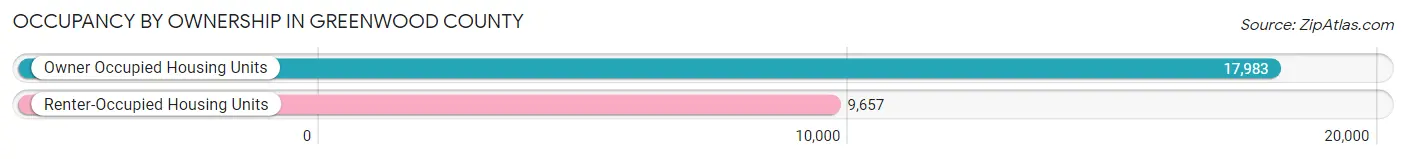
| Occupancy | # Housing Units | % Housing Units |
| Owner Occupied Housing Units | 17,983 | 65.1% |
| Renter-Occupied Housing Units | 9,657 | 34.9% |
| Total Occupied Housing Units | 27,640 | 100.0% |
Occupancy by Household Size in Greenwood County
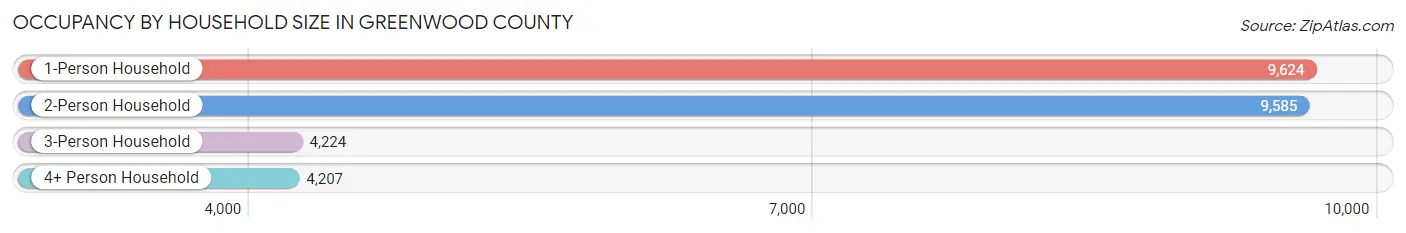
| Household Size | # Housing Units | % Housing Units |
| 1-Person Household | 9,624 | 34.8% |
| 2-Person Household | 9,585 | 34.7% |
| 3-Person Household | 4,224 | 15.3% |
| 4+ Person Household | 4,207 | 15.2% |
| Total Housing Units | 27,640 | 100.0% |
Occupancy by Ownership by Household Size in Greenwood County
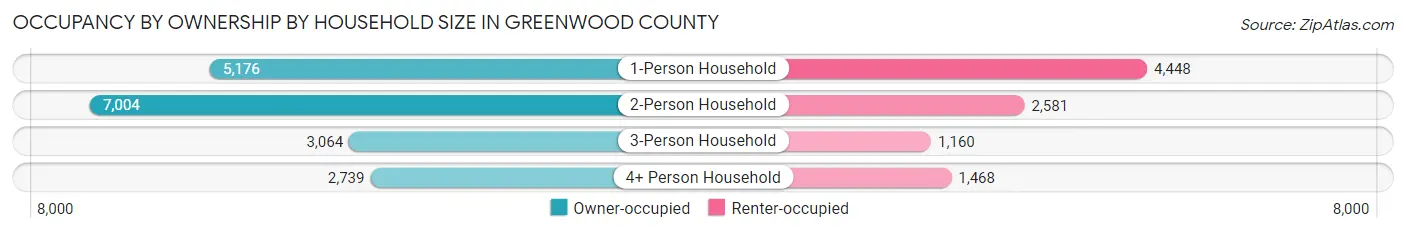
| Household Size | Owner-occupied | Renter-occupied |
| 1-Person Household | 5,176 (53.8%) | 4,448 (46.2%) |
| 2-Person Household | 7,004 (73.1%) | 2,581 (26.9%) |
| 3-Person Household | 3,064 (72.5%) | 1,160 (27.5%) |
| 4+ Person Household | 2,739 (65.1%) | 1,468 (34.9%) |
| Total Housing Units | 17,983 (65.1%) | 9,657 (34.9%) |
Occupancy by Educational Attainment in Greenwood County
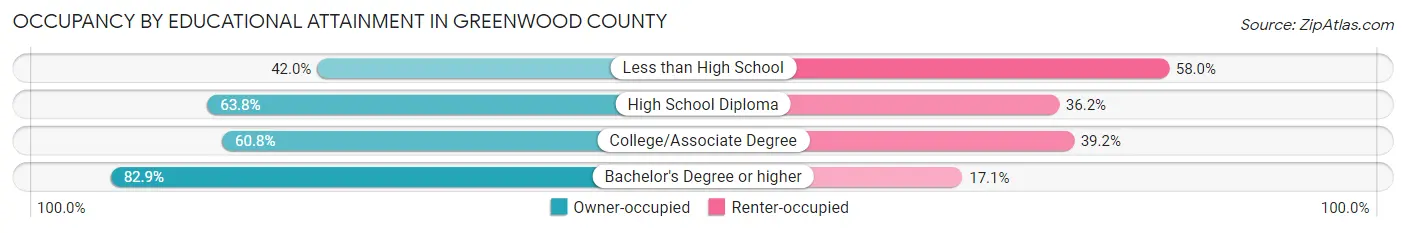
| Household Size | Owner-occupied | Renter-occupied |
| Less than High School | 1,428 (42.0%) | 1,973 (58.0%) |
| High School Diploma | 5,299 (63.8%) | 3,011 (36.2%) |
| College/Associate Degree | 5,376 (60.8%) | 3,462 (39.2%) |
| Bachelor's Degree or higher | 5,880 (82.9%) | 1,211 (17.1%) |
Occupancy by Age of Householder in Greenwood County
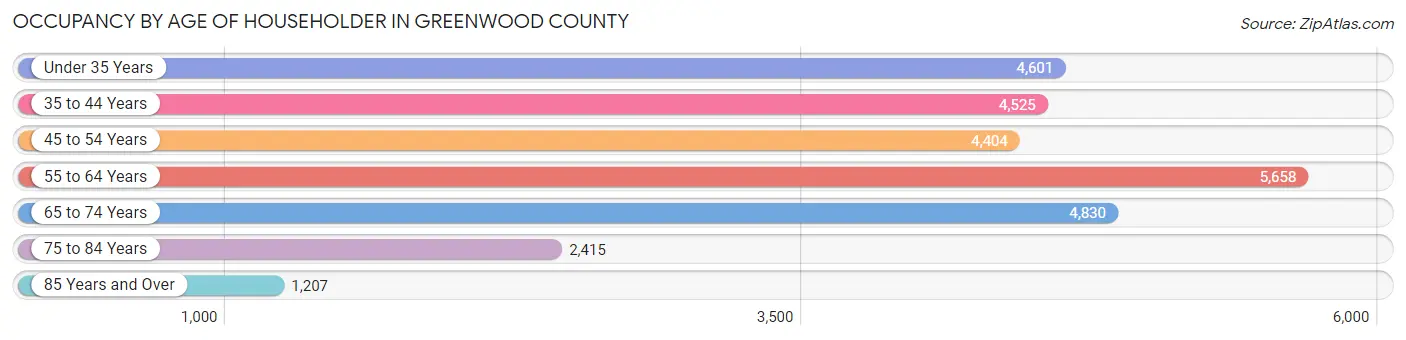
| Age Bracket | # Households | % Households |
| Under 35 Years | 4,601 | 16.7% |
| 35 to 44 Years | 4,525 | 16.4% |
| 45 to 54 Years | 4,404 | 15.9% |
| 55 to 64 Years | 5,658 | 20.5% |
| 65 to 74 Years | 4,830 | 17.5% |
| 75 to 84 Years | 2,415 | 8.7% |
| 85 Years and Over | 1,207 | 4.4% |
| Total | 27,640 | 100.0% |
Housing Finances in Greenwood County
Median Income by Occupancy in Greenwood County
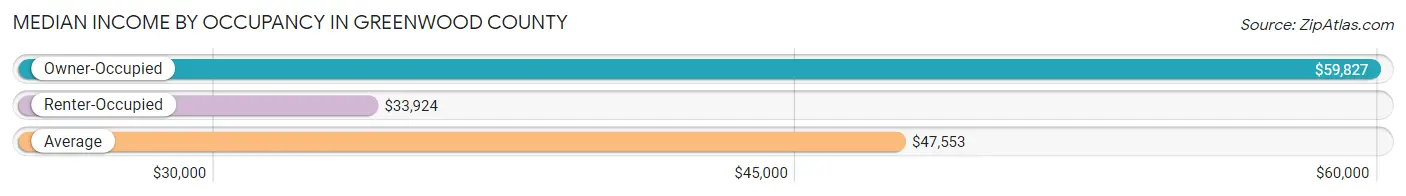
| Occupancy Type | # Households | Median Income |
| Owner-Occupied | 17,983 (65.1%) | $59,827 |
| Renter-Occupied | 9,657 (34.9%) | $33,924 |
| Average | 27,640 (100.0%) | $47,553 |
Occupancy by Householder Income Bracket in Greenwood County
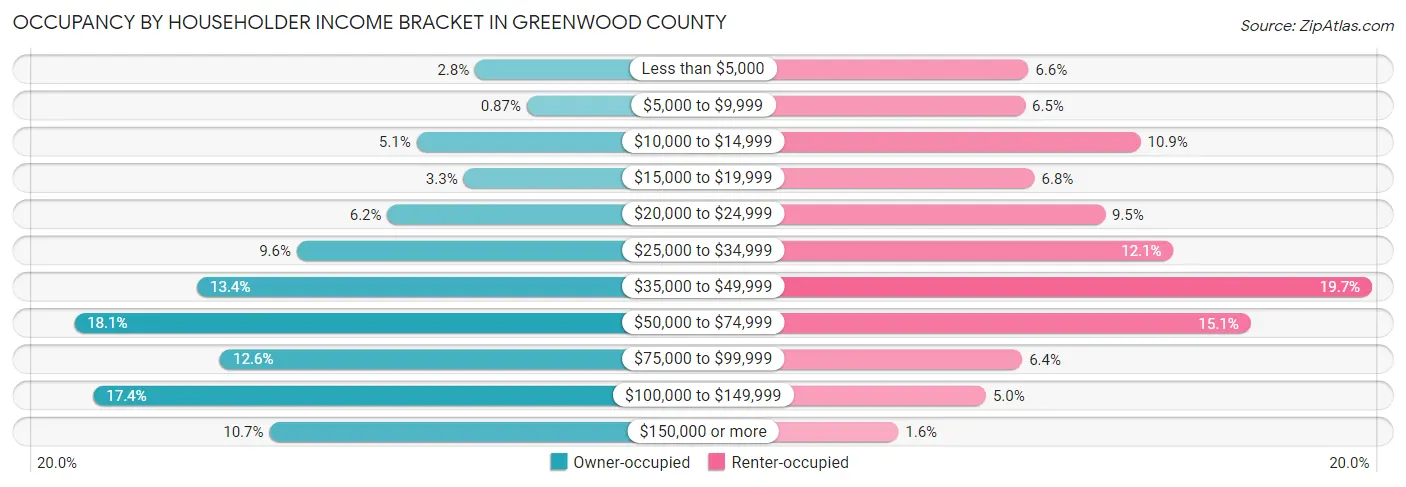
| Income Bracket | Owner-occupied | Renter-occupied |
| Less than $5,000 | 510 (2.8%) | 636 (6.6%) |
| $5,000 to $9,999 | 156 (0.9%) | 624 (6.5%) |
| $10,000 to $14,999 | 912 (5.1%) | 1,049 (10.9%) |
| $15,000 to $19,999 | 589 (3.3%) | 659 (6.8%) |
| $20,000 to $24,999 | 1,111 (6.2%) | 917 (9.5%) |
| $25,000 to $34,999 | 1,731 (9.6%) | 1,169 (12.1%) |
| $35,000 to $49,999 | 2,415 (13.4%) | 1,900 (19.7%) |
| $50,000 to $74,999 | 3,256 (18.1%) | 1,453 (15.0%) |
| $75,000 to $99,999 | 2,257 (12.6%) | 613 (6.4%) |
| $100,000 to $149,999 | 3,126 (17.4%) | 480 (5.0%) |
| $150,000 or more | 1,920 (10.7%) | 157 (1.6%) |
| Total | 17,983 (100.0%) | 9,657 (100.0%) |
Monthly Housing Cost Tiers in Greenwood County
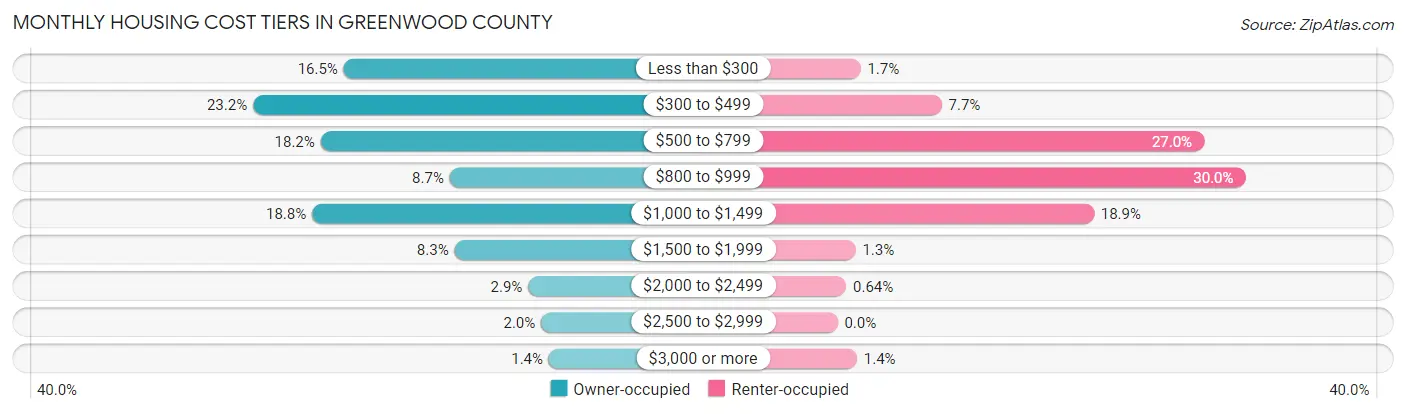
| Monthly Cost | Owner-occupied | Renter-occupied |
| Less than $300 | 2,968 (16.5%) | 164 (1.7%) |
| $300 to $499 | 4,168 (23.2%) | 741 (7.7%) |
| $500 to $799 | 3,273 (18.2%) | 2,606 (27.0%) |
| $800 to $999 | 1,562 (8.7%) | 2,901 (30.0%) |
| $1,000 to $1,499 | 3,387 (18.8%) | 1,823 (18.9%) |
| $1,500 to $1,999 | 1,499 (8.3%) | 128 (1.3%) |
| $2,000 to $2,499 | 524 (2.9%) | 62 (0.6%) |
| $2,500 to $2,999 | 352 (2.0%) | 0 (0.0%) |
| $3,000 or more | 250 (1.4%) | 138 (1.4%) |
| Total | 17,983 (100.0%) | 9,657 (100.0%) |
Physical Housing Characteristics in Greenwood County
Housing Structures in Greenwood County
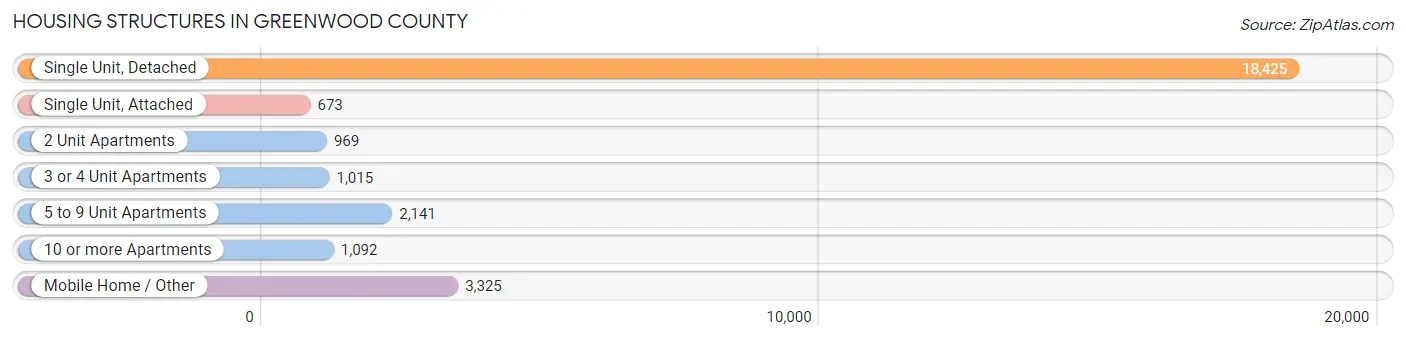
| Structure Type | # Housing Units | % Housing Units |
| Single Unit, Detached | 18,425 | 66.7% |
| Single Unit, Attached | 673 | 2.4% |
| 2 Unit Apartments | 969 | 3.5% |
| 3 or 4 Unit Apartments | 1,015 | 3.7% |
| 5 to 9 Unit Apartments | 2,141 | 7.7% |
| 10 or more Apartments | 1,092 | 4.0% |
| Mobile Home / Other | 3,325 | 12.0% |
| Total | 27,640 | 100.0% |
Housing Structures by Occupancy in Greenwood County
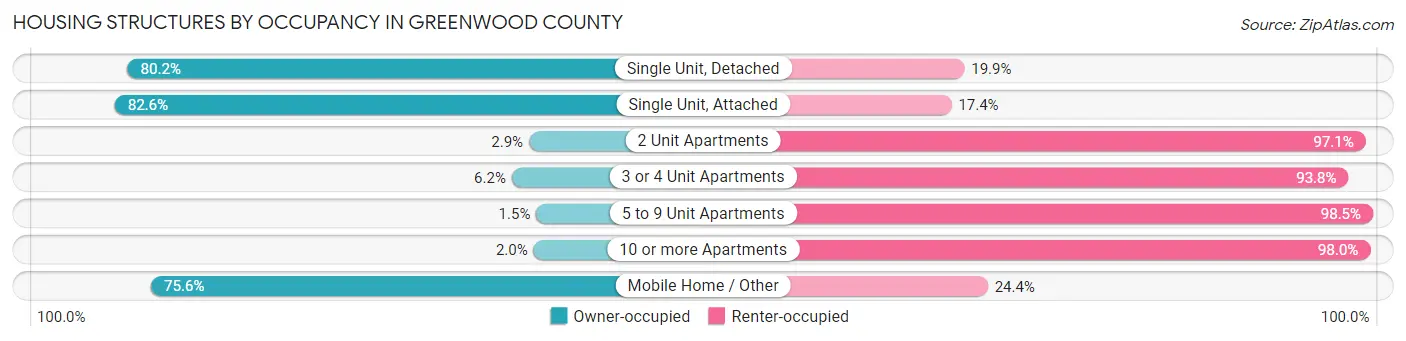
| Structure Type | Owner-occupied | Renter-occupied |
| Single Unit, Detached | 14,767 (80.1%) | 3,658 (19.9%) |
| Single Unit, Attached | 556 (82.6%) | 117 (17.4%) |
| 2 Unit Apartments | 28 (2.9%) | 941 (97.1%) |
| 3 or 4 Unit Apartments | 63 (6.2%) | 952 (93.8%) |
| 5 to 9 Unit Apartments | 32 (1.5%) | 2,109 (98.5%) |
| 10 or more Apartments | 22 (2.0%) | 1,070 (98.0%) |
| Mobile Home / Other | 2,515 (75.6%) | 810 (24.4%) |
| Total | 17,983 (65.1%) | 9,657 (34.9%) |
Housing Structures by Number of Rooms in Greenwood County
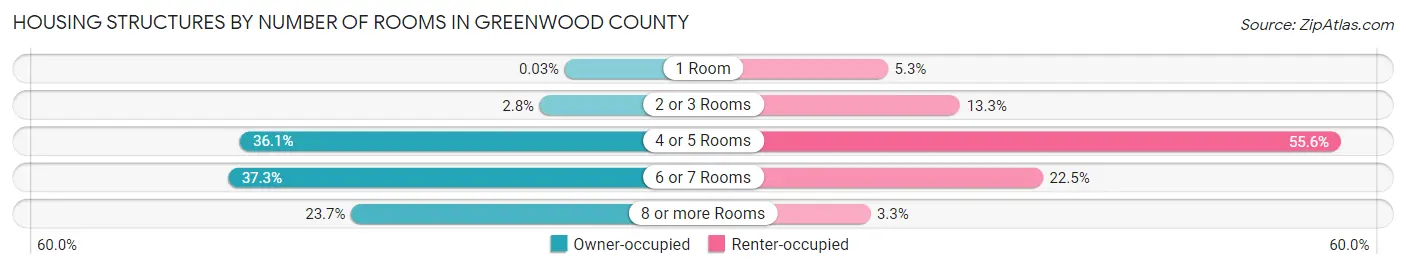
| Number of Rooms | Owner-occupied | Renter-occupied |
| 1 Room | 5 (0.0%) | 511 (5.3%) |
| 2 or 3 Rooms | 505 (2.8%) | 1,284 (13.3%) |
| 4 or 5 Rooms | 6,489 (36.1%) | 5,369 (55.6%) |
| 6 or 7 Rooms | 6,715 (37.3%) | 2,171 (22.5%) |
| 8 or more Rooms | 4,269 (23.7%) | 322 (3.3%) |
| Total | 17,983 (100.0%) | 9,657 (100.0%) |
Housing Structure by Heating Type in Greenwood County
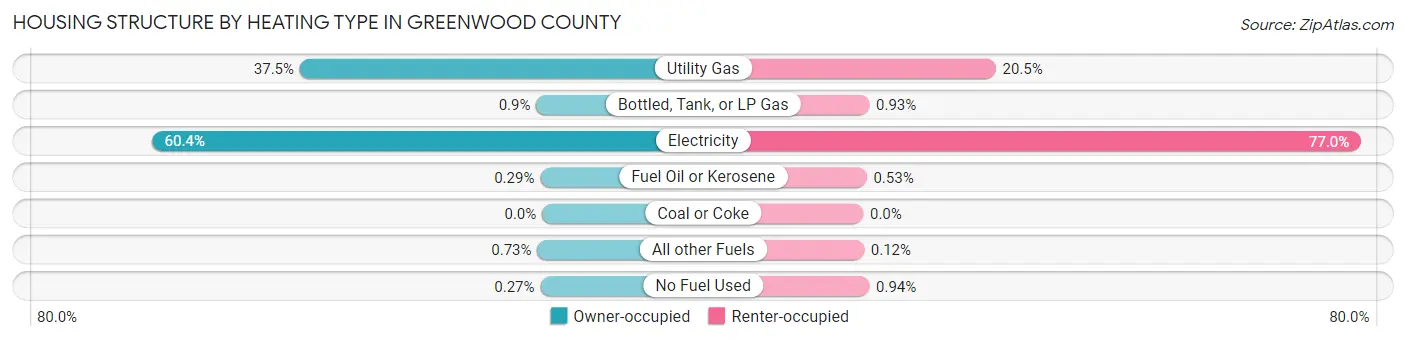
| Heating Type | Owner-occupied | Renter-occupied |
| Utility Gas | 6,734 (37.4%) | 1,978 (20.5%) |
| Bottled, Tank, or LP Gas | 161 (0.9%) | 90 (0.9%) |
| Electricity | 10,854 (60.4%) | 7,435 (77.0%) |
| Fuel Oil or Kerosene | 53 (0.3%) | 51 (0.5%) |
| Coal or Coke | 0 (0.0%) | 0 (0.0%) |
| All other Fuels | 132 (0.7%) | 12 (0.1%) |
| No Fuel Used | 49 (0.3%) | 91 (0.9%) |
| Total | 17,983 (100.0%) | 9,657 (100.0%) |
Household Vehicle Usage in Greenwood County
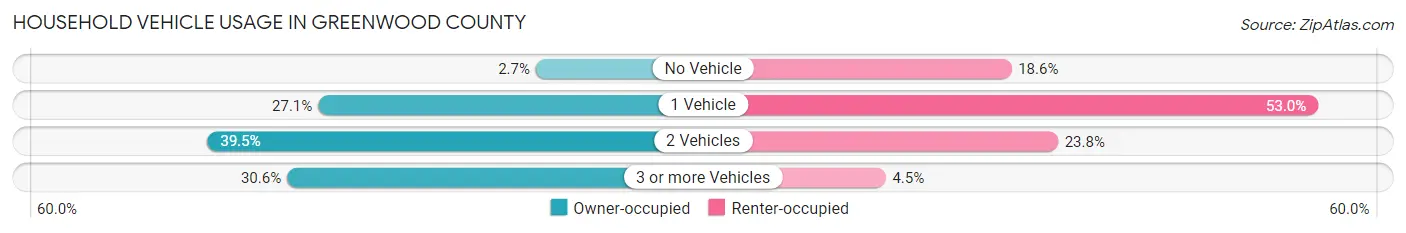
| Vehicles per Household | Owner-occupied | Renter-occupied |
| No Vehicle | 493 (2.7%) | 1,799 (18.6%) |
| 1 Vehicle | 4,877 (27.1%) | 5,118 (53.0%) |
| 2 Vehicles | 7,109 (39.5%) | 2,302 (23.8%) |
| 3 or more Vehicles | 5,504 (30.6%) | 438 (4.5%) |
| Total | 17,983 (100.0%) | 9,657 (100.0%) |
Real Estate & Mortgages in Greenwood County
Real Estate and Mortgage Overview in Greenwood County
| Characteristic | Without Mortgage | With Mortgage |
| Housing Units | 8,976 | 9,007 |
| Median Property Value | $119,200 | $164,600 |
| Median Household Income | $49,113 | $1,312 |
| Monthly Housing Costs | $355 | $239 |
| Real Estate Taxes | $754 | $213 |
Property Value by Mortgage Status in Greenwood County
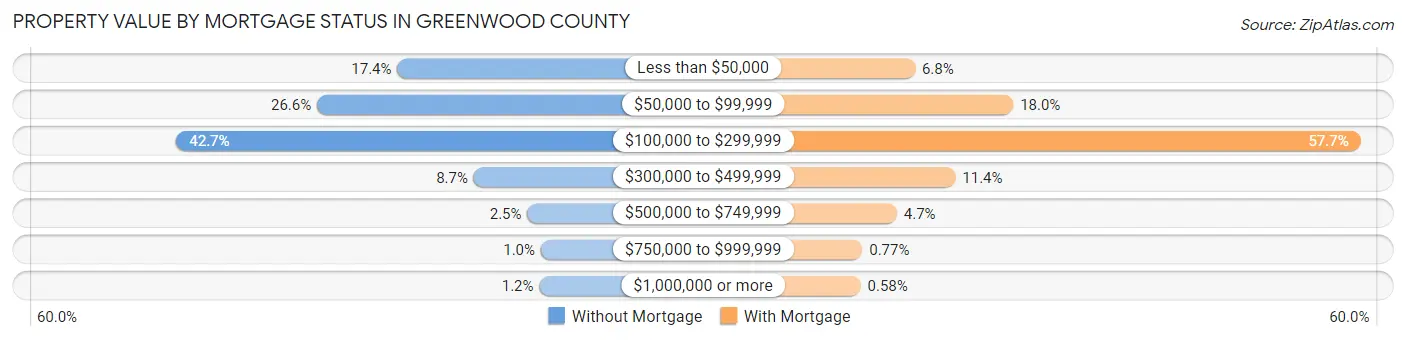
| Property Value | Without Mortgage | With Mortgage |
| Less than $50,000 | 1,562 (17.4%) | 612 (6.8%) |
| $50,000 to $99,999 | 2,386 (26.6%) | 1,623 (18.0%) |
| $100,000 to $299,999 | 3,828 (42.6%) | 5,198 (57.7%) |
| $300,000 to $499,999 | 777 (8.7%) | 1,028 (11.4%) |
| $500,000 to $749,999 | 228 (2.5%) | 425 (4.7%) |
| $750,000 to $999,999 | 90 (1.0%) | 69 (0.8%) |
| $1,000,000 or more | 105 (1.2%) | 52 (0.6%) |
| Total | 8,976 (100.0%) | 9,007 (100.0%) |
Household Income by Mortgage Status in Greenwood County
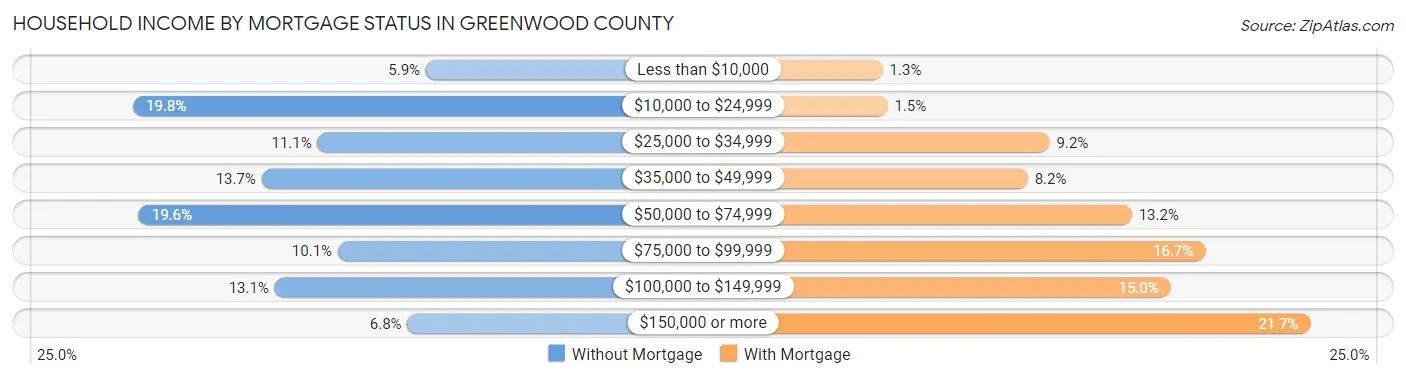
| Household Income | Without Mortgage | With Mortgage |
| Less than $10,000 | 529 (5.9%) | 116 (1.3%) |
| $10,000 to $24,999 | 1,780 (19.8%) | 137 (1.5%) |
| $25,000 to $34,999 | 992 (11.1%) | 832 (9.2%) |
| $35,000 to $49,999 | 1,231 (13.7%) | 739 (8.2%) |
| $50,000 to $74,999 | 1,756 (19.6%) | 1,184 (13.2%) |
| $75,000 to $99,999 | 905 (10.1%) | 1,500 (16.7%) |
| $100,000 to $149,999 | 1,175 (13.1%) | 1,352 (15.0%) |
| $150,000 or more | 608 (6.8%) | 1,951 (21.7%) |
| Total | 8,976 (100.0%) | 9,007 (100.0%) |
Property Value to Household Income Ratio in Greenwood County
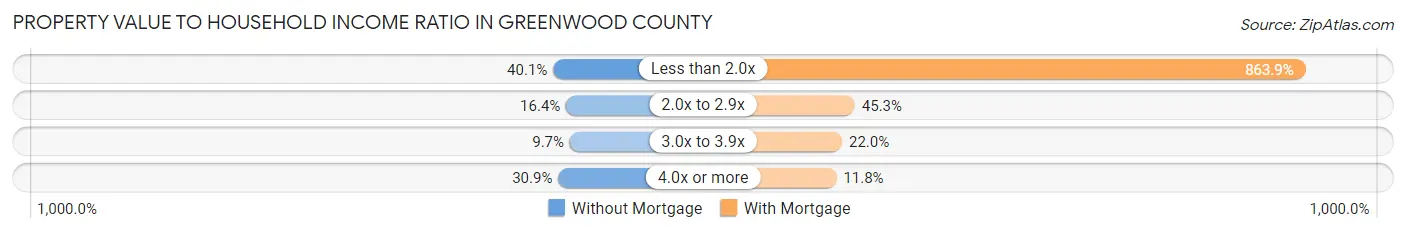
| Value-to-Income Ratio | Without Mortgage | With Mortgage |
| Less than 2.0x | 3,597 (40.1%) | 77,808 (863.9%) |
| 2.0x to 2.9x | 1,475 (16.4%) | 4,083 (45.3%) |
| 3.0x to 3.9x | 870 (9.7%) | 1,980 (22.0%) |
| 4.0x or more | 2,773 (30.9%) | 1,066 (11.8%) |
| Total | 8,976 (100.0%) | 9,007 (100.0%) |
Real Estate Taxes by Mortgage Status in Greenwood County
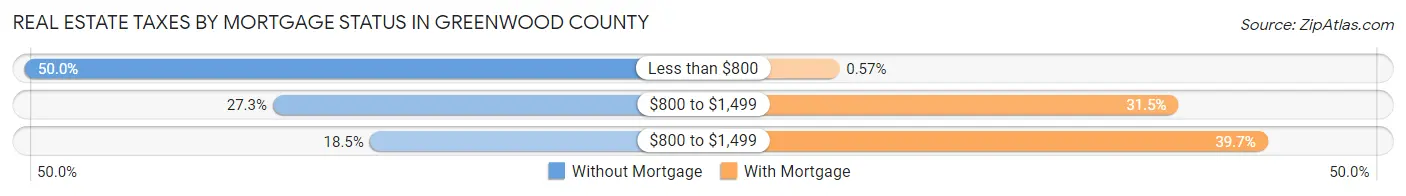
| Property Taxes | Without Mortgage | With Mortgage |
| Less than $800 | 4,485 (50.0%) | 51 (0.6%) |
| $800 to $1,499 | 2,453 (27.3%) | 2,841 (31.5%) |
| $800 to $1,499 | 1,660 (18.5%) | 3,573 (39.7%) |
| Total | 8,976 (100.0%) | 9,007 (100.0%) |
Health & Disability in Greenwood County
Health Insurance Coverage by Age in Greenwood County
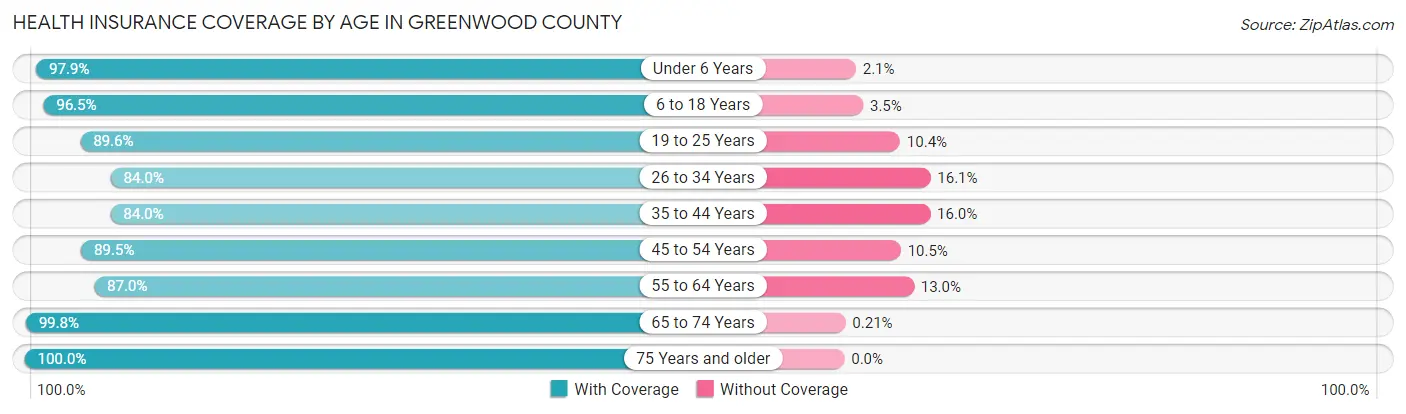
| Age Bracket | With Coverage | Without Coverage |
| Under 6 Years | 5,026 (97.9%) | 110 (2.1%) |
| 6 to 18 Years | 11,049 (96.5%) | 399 (3.5%) |
| 19 to 25 Years | 5,949 (89.6%) | 688 (10.4%) |
| 26 to 34 Years | 6,257 (84.0%) | 1,196 (16.1%) |
| 35 to 44 Years | 6,591 (84.0%) | 1,255 (16.0%) |
| 45 to 54 Years | 7,249 (89.5%) | 852 (10.5%) |
| 55 to 64 Years | 7,606 (87.0%) | 1,133 (13.0%) |
| 65 to 74 Years | 7,300 (99.8%) | 15 (0.2%) |
| 75 Years and older | 5,390 (100.0%) | 0 (0.0%) |
| Total | 62,417 (91.7%) | 5,648 (8.3%) |
Health Insurance Coverage by Citizenship Status in Greenwood County
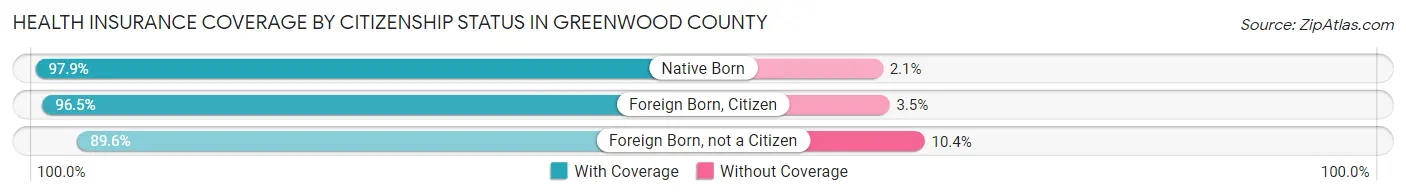
| Citizenship Status | With Coverage | Without Coverage |
| Native Born | 5,026 (97.9%) | 110 (2.1%) |
| Foreign Born, Citizen | 11,049 (96.5%) | 399 (3.5%) |
| Foreign Born, not a Citizen | 5,949 (89.6%) | 688 (10.4%) |
Health Insurance Coverage by Household Income in Greenwood County
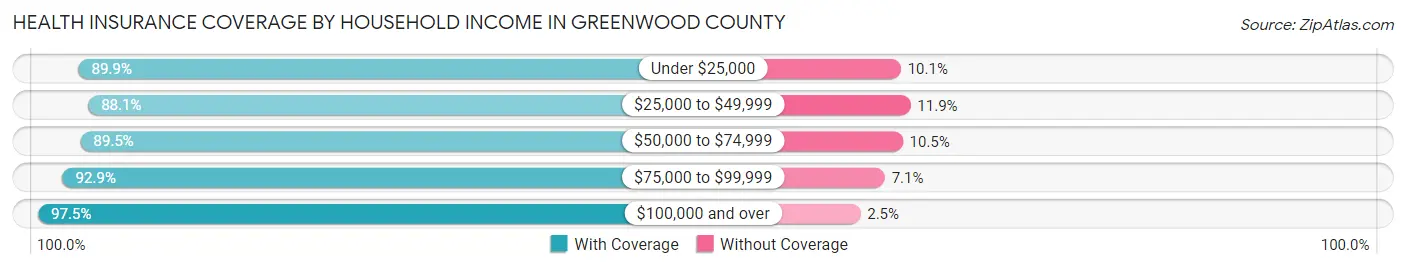
| Household Income | With Coverage | Without Coverage |
| Under $25,000 | 10,507 (89.9%) | 1,182 (10.1%) |
| $25,000 to $49,999 | 14,302 (88.1%) | 1,935 (11.9%) |
| $50,000 to $74,999 | 11,492 (89.5%) | 1,342 (10.5%) |
| $75,000 to $99,999 | 7,392 (92.9%) | 565 (7.1%) |
| $100,000 and over | 16,970 (97.5%) | 441 (2.5%) |
Public vs Private Health Insurance Coverage by Age in Greenwood County
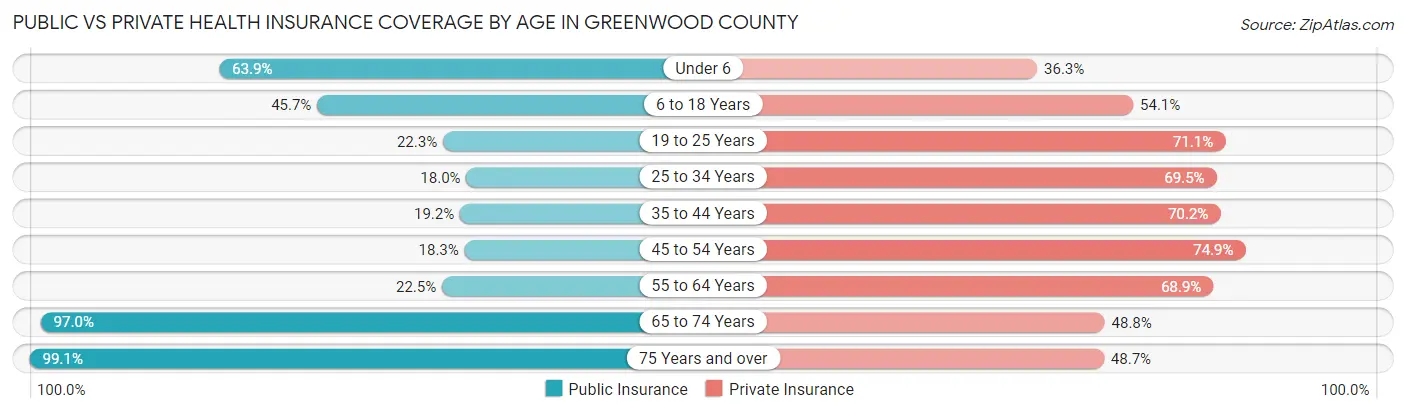
| Age Bracket | Public Insurance | Private Insurance |
| Under 6 | 3,281 (63.9%) | 1,862 (36.2%) |
| 6 to 18 Years | 5,231 (45.7%) | 6,190 (54.1%) |
| 19 to 25 Years | 1,483 (22.3%) | 4,721 (71.1%) |
| 25 to 34 Years | 1,341 (18.0%) | 5,182 (69.5%) |
| 35 to 44 Years | 1,504 (19.2%) | 5,510 (70.2%) |
| 45 to 54 Years | 1,485 (18.3%) | 6,068 (74.9%) |
| 55 to 64 Years | 1,967 (22.5%) | 6,024 (68.9%) |
| 65 to 74 Years | 7,097 (97.0%) | 3,568 (48.8%) |
| 75 Years and over | 5,340 (99.1%) | 2,622 (48.6%) |
| Total | 28,729 (42.2%) | 41,747 (61.3%) |
Disability Status by Sex by Age in Greenwood County
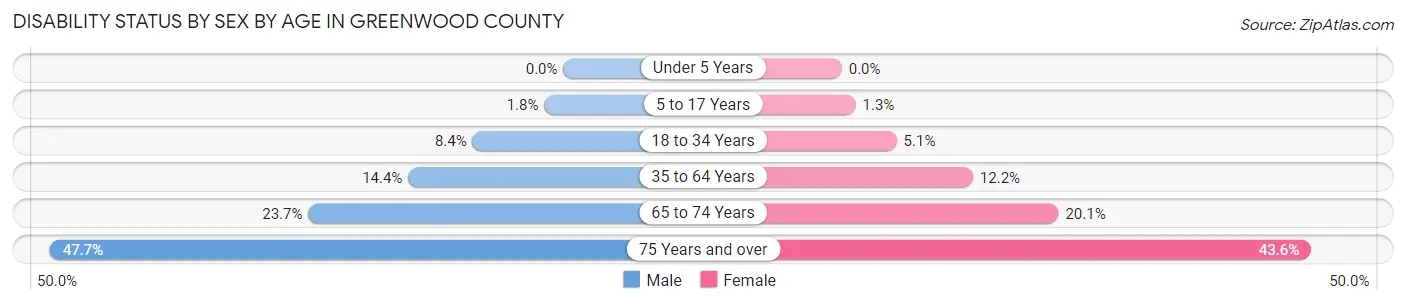
| Age Bracket | Male | Female |
| Under 5 Years | 0 (0.0%) | 0 (0.0%) |
| 5 to 17 Years | 103 (1.8%) | 73 (1.3%) |
| 18 to 34 Years | 591 (8.4%) | 419 (5.1%) |
| 35 to 64 Years | 1,677 (14.4%) | 1,587 (12.2%) |
| 65 to 74 Years | 805 (23.7%) | 787 (20.1%) |
| 75 Years and over | 1,040 (47.7%) | 1,397 (43.5%) |
Disability Class by Sex by Age in Greenwood County
Disability Class: Hearing Difficulty
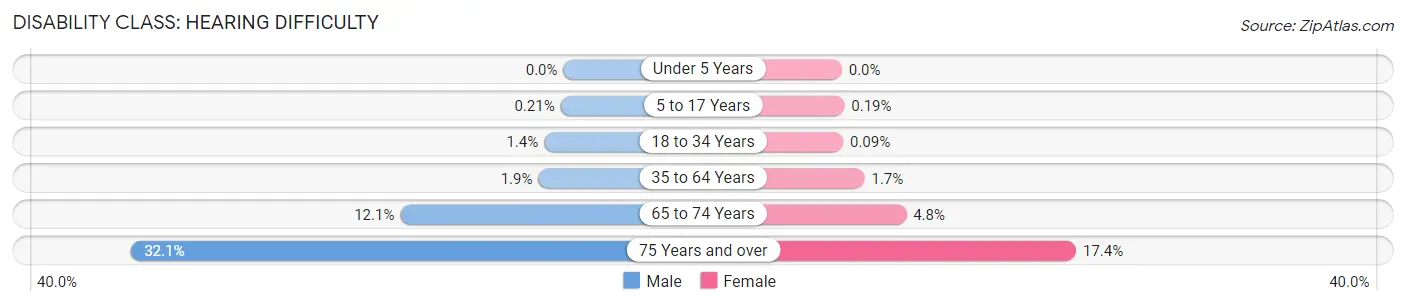
| Age Bracket | Male | Female |
| Under 5 Years | 0 (0.0%) | 0 (0.0%) |
| 5 to 17 Years | 12 (0.2%) | 11 (0.2%) |
| 18 to 34 Years | 100 (1.4%) | 7 (0.1%) |
| 35 to 64 Years | 217 (1.9%) | 221 (1.7%) |
| 65 to 74 Years | 412 (12.1%) | 187 (4.8%) |
| 75 Years and over | 700 (32.1%) | 558 (17.4%) |
Disability Class: Vision Difficulty
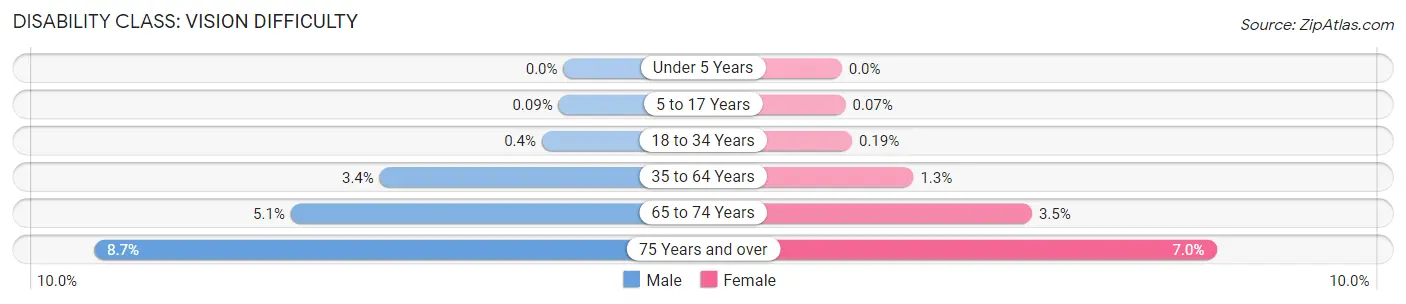
| Age Bracket | Male | Female |
| Under 5 Years | 0 (0.0%) | 0 (0.0%) |
| 5 to 17 Years | 5 (0.1%) | 4 (0.1%) |
| 18 to 34 Years | 28 (0.4%) | 16 (0.2%) |
| 35 to 64 Years | 397 (3.4%) | 174 (1.3%) |
| 65 to 74 Years | 172 (5.1%) | 138 (3.5%) |
| 75 Years and over | 190 (8.7%) | 223 (7.0%) |
Disability Class: Cognitive Difficulty
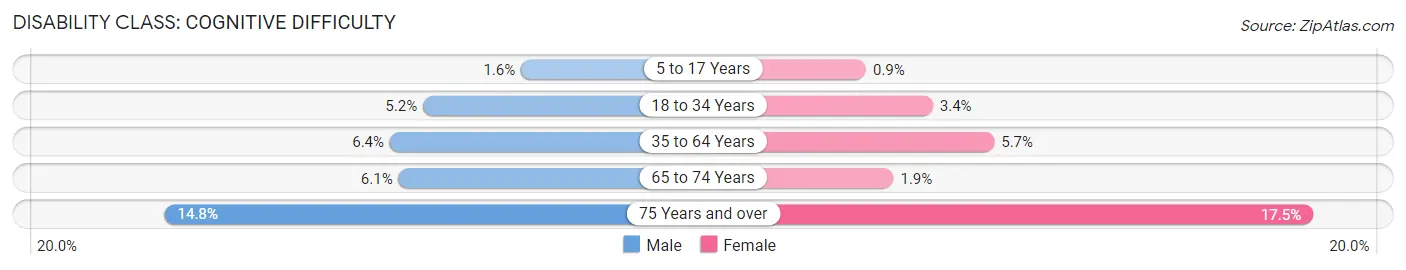
| Age Bracket | Male | Female |
| 5 to 17 Years | 91 (1.6%) | 51 (0.9%) |
| 18 to 34 Years | 365 (5.2%) | 278 (3.4%) |
| 35 to 64 Years | 750 (6.4%) | 738 (5.7%) |
| 65 to 74 Years | 208 (6.1%) | 75 (1.9%) |
| 75 Years and over | 323 (14.8%) | 561 (17.5%) |
Disability Class: Ambulatory Difficulty
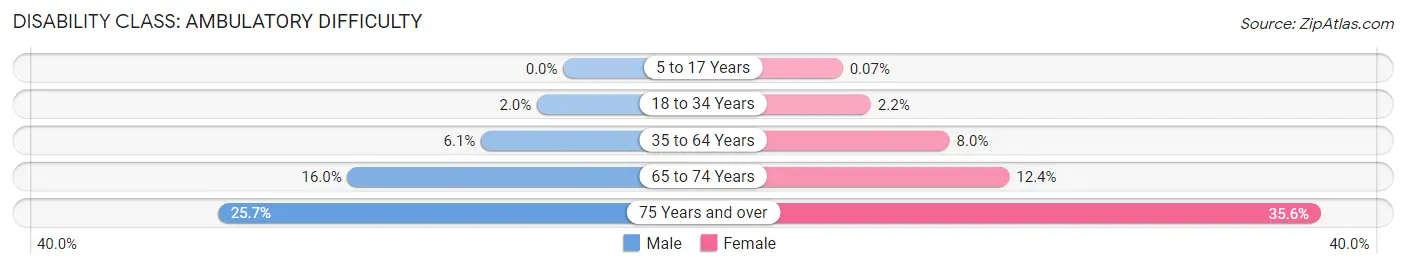
| Age Bracket | Male | Female |
| 5 to 17 Years | 0 (0.0%) | 4 (0.1%) |
| 18 to 34 Years | 137 (1.9%) | 178 (2.2%) |
| 35 to 64 Years | 710 (6.1%) | 1,045 (8.0%) |
| 65 to 74 Years | 545 (16.0%) | 487 (12.4%) |
| 75 Years and over | 560 (25.7%) | 1,141 (35.6%) |
Disability Class: Self-Care Difficulty
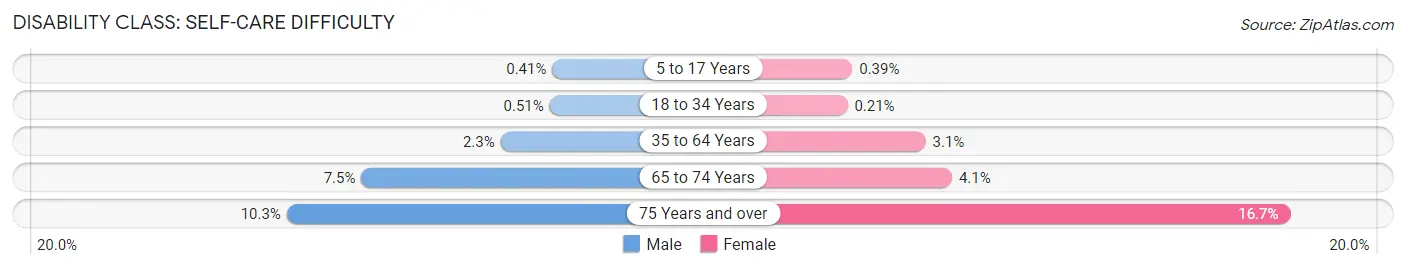
| Age Bracket | Male | Female |
| 5 to 17 Years | 24 (0.4%) | 22 (0.4%) |
| 18 to 34 Years | 36 (0.5%) | 17 (0.2%) |
| 35 to 64 Years | 271 (2.3%) | 406 (3.1%) |
| 65 to 74 Years | 255 (7.5%) | 160 (4.1%) |
| 75 Years and over | 224 (10.3%) | 534 (16.7%) |
Technology Access in Greenwood County
Computing Device Access in Greenwood County
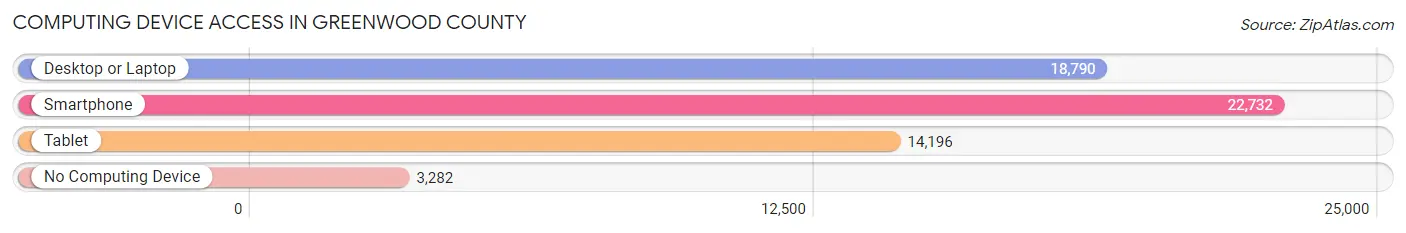
| Device Type | # Households | % Households |
| Desktop or Laptop | 18,790 | 68.0% |
| Smartphone | 22,732 | 82.2% |
| Tablet | 14,196 | 51.4% |
| No Computing Device | 3,282 | 11.9% |
| Total | 27,640 | 100.0% |
Internet Access in Greenwood County
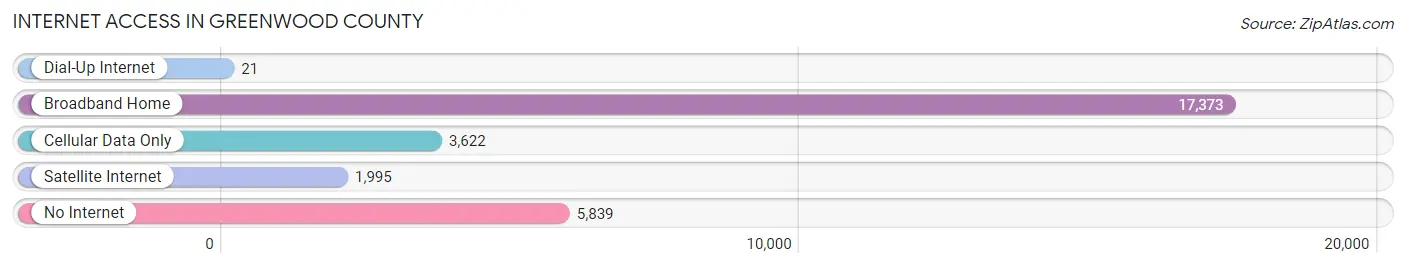
| Internet Type | # Households | % Households |
| Dial-Up Internet | 21 | 0.1% |
| Broadband Home | 17,373 | 62.8% |
| Cellular Data Only | 3,622 | 13.1% |
| Satellite Internet | 1,995 | 7.2% |
| No Internet | 5,839 | 21.1% |
| Total | 27,640 | 100.0% |
Greenwood County Summary
Greenwood County is located in the Upstate region of South Carolina, and is bordered by Abbeville, Laurens, Newberry, and Edgefield counties. The county seat is Greenwood, and the county is home to approximately 69,000 people.
History
Greenwood County was established in 1897 from parts of Abbeville, Edgefield, and Laurens counties. The county was named after the town of Greenwood, which was named after a local plantation owned by the Greenwood family. The county was originally home to the Cherokee and Creek Native American tribes, and the area was first settled by Europeans in the late 1700s.
During the Civil War, Greenwood County was the site of several battles, including the Battle of Greenwood in 1865. After the war, the county experienced a period of economic growth, with the development of the railroad and the establishment of several cotton mills.
Geography
Greenwood County covers an area of 545 square miles, and is located in the Piedmont region of South Carolina. The county is mostly rural, with rolling hills and forests. The Saluda River runs through the county, and Lake Greenwood is located in the northern part of the county.
The climate in Greenwood County is humid subtropical, with hot, humid summers and mild winters. The average annual temperature is around 64°F, and the average annual precipitation is around 45 inches.
Economy
Greenwood County’s economy is largely based on agriculture and manufacturing. The county is home to several large farms, and the main crops grown in the area are cotton, soybeans, corn, and wheat. The county is also home to several manufacturing companies, including textile mills, automotive parts manufacturers, and food processing plants.
The county is also home to several large employers, including Self Regional Healthcare, Lander University, and the Greenwood County School District. The county is also home to several tourist attractions, including the Greenwood County Museum and the Uptown Greenwood Historic District.
Demographics
As of the 2010 census, Greenwood County had a population of 69,661. The racial makeup of the county was 68.3% White, 28.2% African American, 0.5% Native American, 0.7% Asian, 0.1% Pacific Islander, and 1.2% from other races. Hispanic or Latino of any race were 2.2% of the population.
The median household income in Greenwood County was $37,845, and the median family income was $45,945. The per capita income was $20,845. About 17.2% of the population was below the poverty line.
Greenwood County is home to several religious denominations, including Baptist, Methodist, Presbyterian, and Catholic. The county is also home to several colleges and universities, including Lander University and Piedmont Technical College.
Common Questions
What is Per Capita Income in Greenwood County?
Per Capita income in Greenwood County is $30,237.
What is the Median Family Income in Greenwood County?
Median Family Income in Greenwood County is $64,288.
What is the Median Household income in Greenwood County?
Median Household Income in Greenwood County is $47,553.
What is Income or Wage Gap in Greenwood County?
Income or Wage Gap in Greenwood County is 24.4%.
Women in Greenwood County earn 75.6 cents for every dollar earned by a man.
What is Family Income Deficit in Greenwood County?
Family Income Deficit in Greenwood County is $12,143.
Families that are below poverty line in Greenwood County earn $12,143 less on average than the poverty threshold level.
What is Inequality or Gini Index in Greenwood County?
Inequality or Gini Index in Greenwood County is 0.50.
What is the Total Population of Greenwood County?
Total Population of Greenwood County is 69,309.
What is the Total Male Population of Greenwood County?
Total Male Population of Greenwood County is 32,530.
What is the Total Female Population of Greenwood County?
Total Female Population of Greenwood County is 36,779.
What is the Ratio of Males per 100 Females in Greenwood County?
There are 88.45 Males per 100 Females in Greenwood County.
What is the Ratio of Females per 100 Males in Greenwood County?
There are 113.06 Females per 100 Males in Greenwood County.
What is the Median Population Age in Greenwood County?
Median Population Age in Greenwood County is 40.2 Years.
What is the Average Family Size in Greenwood County
Average Family Size in Greenwood County is 3.1 People.
What is the Average Household Size in Greenwood County
Average Household Size in Greenwood County is 2.4 People.
How Large is the Labor Force in Greenwood County?
There are 31,152 People in the Labor Forcein in Greenwood County.
What is the Percentage of People in the Labor Force in Greenwood County?
56.1% of People are in the Labor Force in Greenwood County.
What is the Unemployment Rate in Greenwood County?
Unemployment Rate in Greenwood County is 5.5%.