Minnesota Map & Demographics
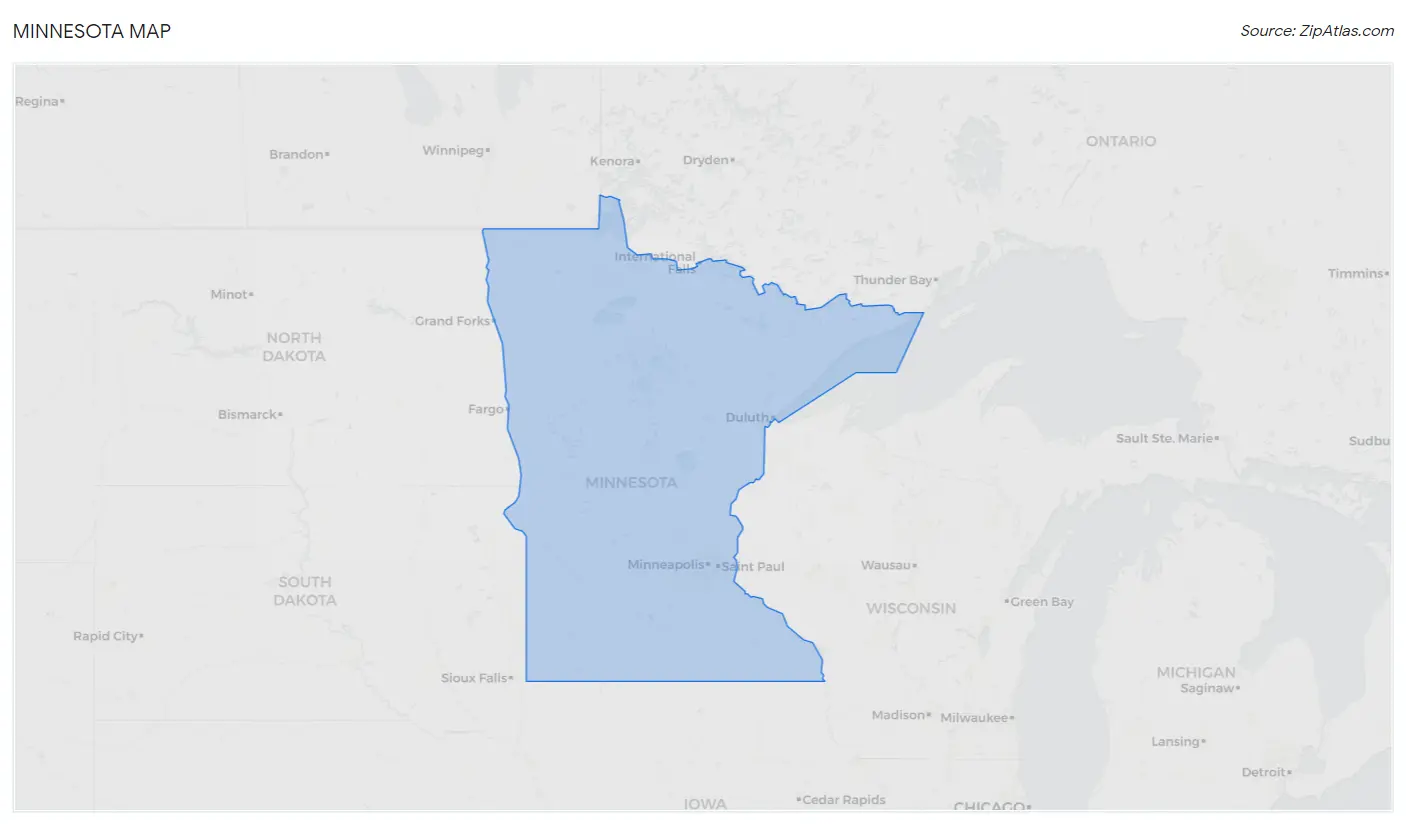
Minnesota Map
Minnesota Overview
May 11, 1858
INCORPORATED
86,935
TOTAL AREA [ SQ MI ]
79,607
LAND AREA [ SQ MI ]
7,328
WATER AREA [ SQ MI ]
1,200
ELEVATION AVG [ FT ]
2,301
ELEVATION HIGH [ FT ]
602
ELEVATION LOW [ FT ]
71.5
POP DENSITY [ PPL / SQ MI ]
$44,947
PER CAPITA INCOME
$107,072
AVG FAMILY INCOME
$84,313
AVG HOUSEHOLD INCOME
26.2%
WAGE / INCOME GAP [ % ]
73.8¢/ $1
WAGE / INCOME GAP [ $ ]
$10,624
FAMILY INCOME DEFICIT
0.45
INEQUALITY / GINI INDEX
55044
LARGEST ZIP CODE
Minneapolis
LARGEST CITY
Hennepin County
LARGEST COUNTY
5,695,292
TOTAL POPULATION
2,857,964
MALE POPULATION
2,837,328
FEMALE POPULATION
100.73
MALES / 100 FEMALES
99.28
FEMALES / 100 MALES
38.5
MEDIAN AGE
3.1
AVG FAMILY SIZE
2.5
AVG HOUSEHOLD SIZE
3,117,089
LABOR FORCE [ PEOPLE ]
68.7%
PERCENT IN LABOR FORCE
4.0%
UNEMPLOYMENT RATE
Income in Minnesota
Income Overview in Minnesota
Per Capita Income in Minnesota is $44,947, while median incomes of families and households are $107,072 and $84,313 respectively.
| Characteristic | Number | Measure |
| Per Capita Income | 5,695,292 | $44,947 |
| Median Family Income | 1,424,131 | $107,072 |
| Mean Family Income | 1,424,131 | $134,671 |
| Median Household Income | 2,256,126 | $84,313 |
| Mean Household Income | 2,256,126 | $111,341 |
| Income Deficit | 1,424,131 | $10,624 |
| Wage / Income Gap (%) | 5,695,292 | 26.25% |
| Wage / Income Gap ($) | 5,695,292 | 73.75¢ per $1 |
| Gini / Inequality Index | 5,695,292 | 0.45 |
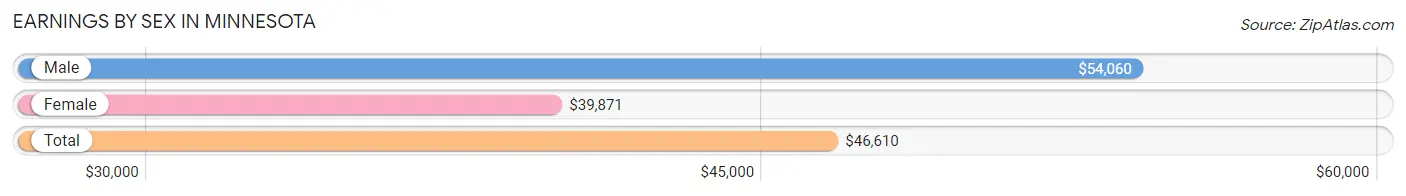
Earnings by Sex in Minnesota
Average Earnings in Minnesota are $46,610, $54,060 for men and $39,871 for women, a difference of 26.3%.
| Sex | Number | Average Earnings |
| Male | 1,727,289 (52.5%) | $54,060 |
| Female | 1,564,496 (47.5%) | $39,871 |
| Total | 3,291,785 (100.0%) | $46,610 |
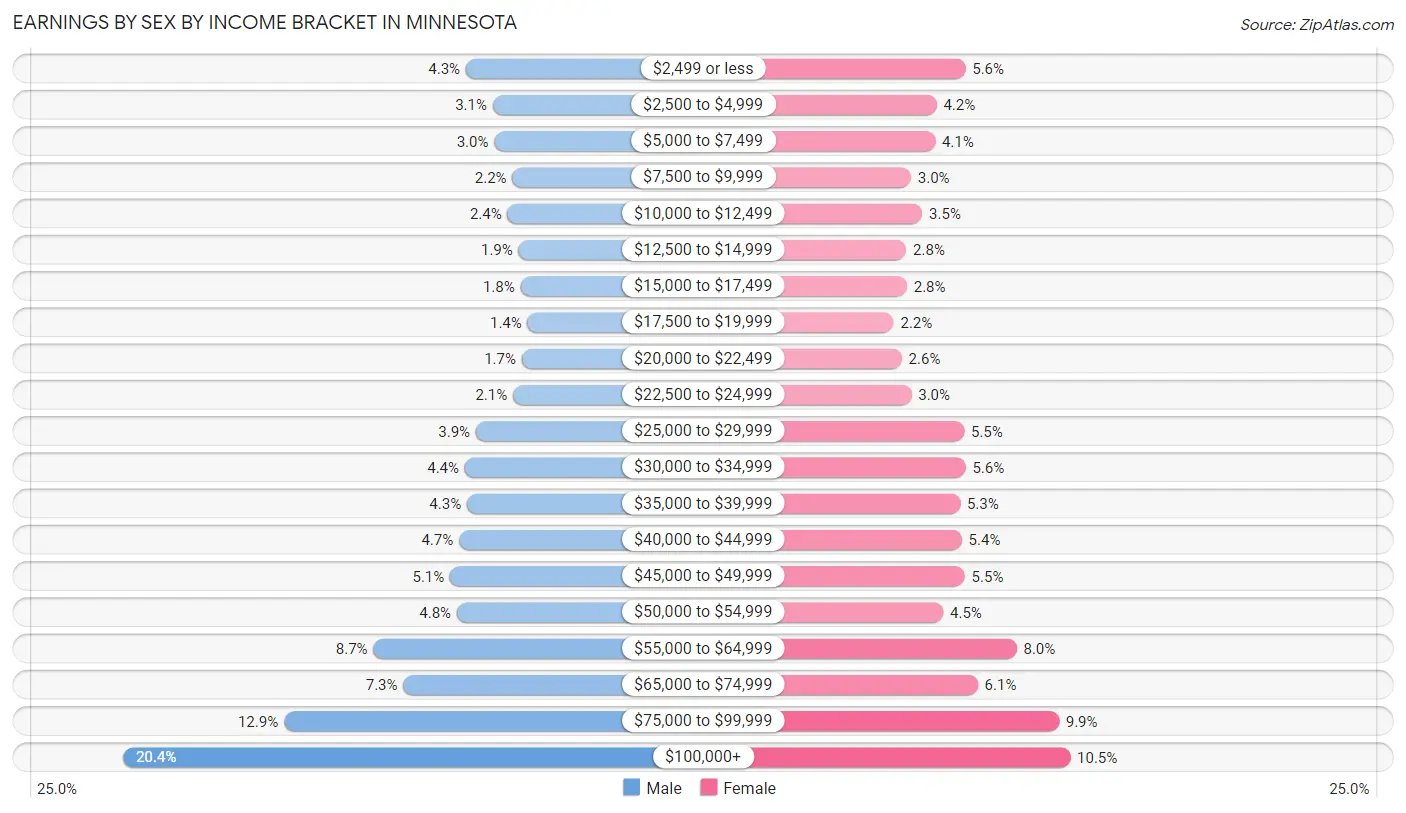
Earnings by Sex by Income Bracket in Minnesota
The most common earnings brackets in Minnesota are $100,000+ for men (352,204 | 20.4%) and $100,000+ for women (163,590 | 10.5%).
| Income | Male | Female |
| $2,499 or less | 74,733 (4.3%) | 86,760 (5.6%) |
| $2,500 to $4,999 | 53,005 (3.1%) | 65,736 (4.2%) |
| $5,000 to $7,499 | 51,853 (3.0%) | 64,585 (4.1%) |
| $7,500 to $9,999 | 37,157 (2.1%) | 46,892 (3.0%) |
| $10,000 to $12,499 | 41,097 (2.4%) | 55,268 (3.5%) |
| $12,500 to $14,999 | 32,055 (1.9%) | 43,524 (2.8%) |
| $15,000 to $17,499 | 30,647 (1.8%) | 43,951 (2.8%) |
| $17,500 to $19,999 | 24,936 (1.4%) | 34,276 (2.2%) |
| $20,000 to $22,499 | 29,557 (1.7%) | 40,192 (2.6%) |
| $22,500 to $24,999 | 36,682 (2.1%) | 47,317 (3.0%) |
| $25,000 to $29,999 | 66,757 (3.9%) | 85,815 (5.5%) |
| $30,000 to $34,999 | 75,725 (4.4%) | 86,983 (5.6%) |
| $35,000 to $39,999 | 73,990 (4.3%) | 82,968 (5.3%) |
| $40,000 to $44,999 | 80,364 (4.6%) | 84,114 (5.4%) |
| $45,000 to $49,999 | 87,521 (5.1%) | 86,282 (5.5%) |
| $50,000 to $54,999 | 82,008 (4.8%) | 70,619 (4.5%) |
| $55,000 to $64,999 | 149,567 (8.7%) | 124,416 (8.0%) |
| $65,000 to $74,999 | 125,470 (7.3%) | 95,839 (6.1%) |
| $75,000 to $99,999 | 221,961 (12.9%) | 155,369 (9.9%) |
| $100,000+ | 352,204 (20.4%) | 163,590 (10.5%) |
| Total | 1,727,289 (100.0%) | 1,564,496 (100.0%) |
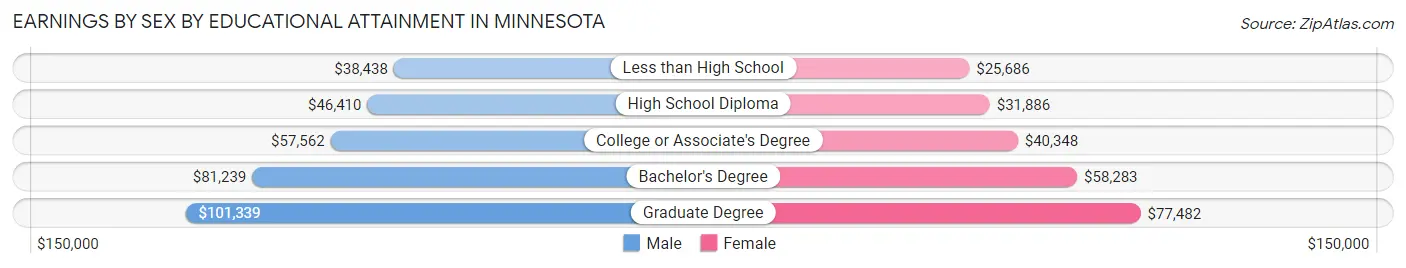
Earnings by Sex by Educational Attainment in Minnesota
Average earnings in Minnesota are $61,358 for men and $46,337 for women, a difference of 24.5%. Men with an educational attainment of graduate degree enjoy the highest average annual earnings of $101,339, while those with less than high school education earn the least with $38,438. Women with an educational attainment of graduate degree earn the most with the average annual earnings of $77,482, while those with less than high school education have the smallest earnings of $25,686.
| Educational Attainment | Male Income | Female Income |
| Less than High School | $38,438 | $25,686 |
| High School Diploma | $46,410 | $31,886 |
| College or Associate's Degree | $57,562 | $40,348 |
| Bachelor's Degree | $81,239 | $58,283 |
| Graduate Degree | $101,339 | $77,482 |
| Total | $61,358 | $46,337 |
Family Income in Minnesota
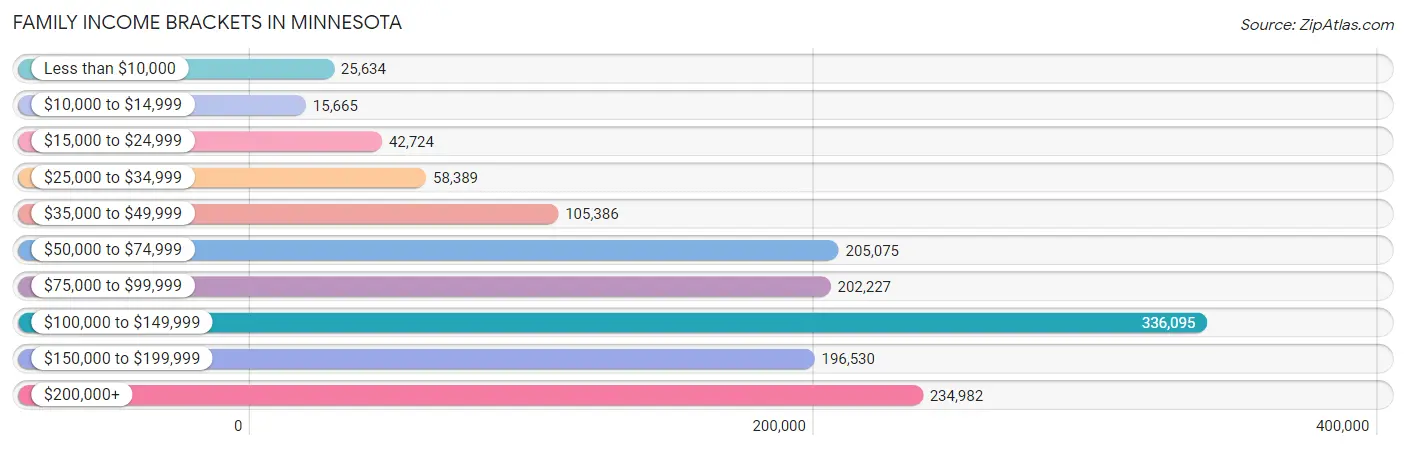
Family Income Brackets in Minnesota
According to the Minnesota family income data, there are 336,095 families falling into the $100,000 to $149,999 income range, which is the most common income bracket and makes up 23.6% of all families. Conversely, the $10,000 to $14,999 income bracket is the least frequent group with only 15,665 families (1.1%) belonging to this category.
| Income Bracket | # Families | % Families |
| Less than $10,000 | 25,634 | 1.8% |
| $10,000 to $14,999 | 15,665 | 1.1% |
| $15,000 to $24,999 | 42,724 | 3.0% |
| $25,000 to $34,999 | 58,389 | 4.1% |
| $35,000 to $49,999 | 105,386 | 7.4% |
| $50,000 to $74,999 | 205,075 | 14.4% |
| $75,000 to $99,999 | 202,227 | 14.2% |
| $100,000 to $149,999 | 336,095 | 23.6% |
| $150,000 to $199,999 | 196,530 | 13.8% |
| $200,000+ | 234,982 | 16.5% |
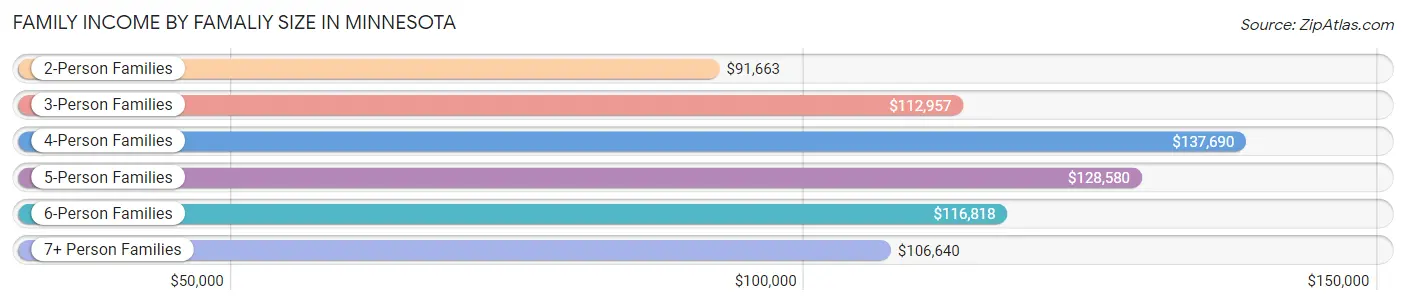
Family Income by Famaliy Size in Minnesota
4-person families (258,071 | 18.1%) account for the highest median family income in Minnesota with $137,690 per family, while 2-person families (700,846 | 49.2%) have the highest median income of $45,832 per family member.
| Income Bracket | # Families | Median Income |
| 2-Person Families | 700,846 (49.2%) | $91,663 |
| 3-Person Families | 283,820 (19.9%) | $112,957 |
| 4-Person Families | 258,071 (18.1%) | $137,690 |
| 5-Person Families | 115,082 (8.1%) | $128,580 |
| 6-Person Families | 40,146 (2.8%) | $116,818 |
| 7+ Person Families | 26,166 (1.8%) | $106,640 |
| Total | 1,424,131 (100.0%) | $107,072 |
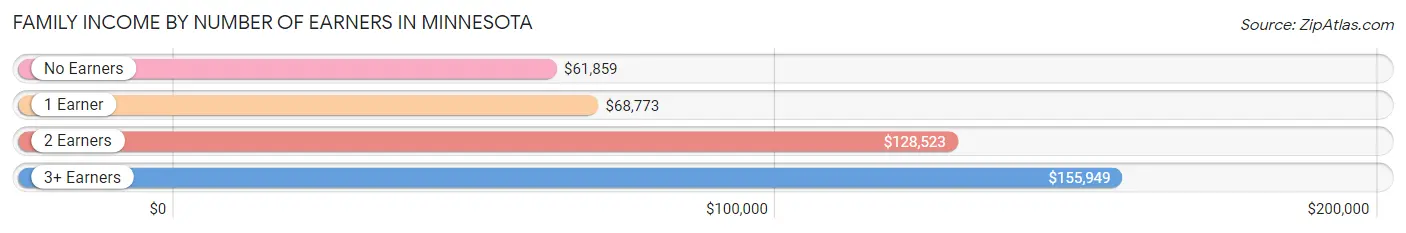
Family Income by Number of Earners in Minnesota
The median family income in Minnesota is $107,072, with families comprising 3+ earners (186,130) having the highest median family income of $155,949, while families with no earners (188,195) have the lowest median family income of $61,859, accounting for 13.1% and 13.2% of families, respectively.
| Number of Earners | # Families | Median Income |
| No Earners | 188,195 (13.2%) | $61,859 |
| 1 Earner | 372,961 (26.2%) | $68,773 |
| 2 Earners | 676,845 (47.5%) | $128,523 |
| 3+ Earners | 186,130 (13.1%) | $155,949 |
| Total | 1,424,131 (100.0%) | $107,072 |
Household Income in Minnesota
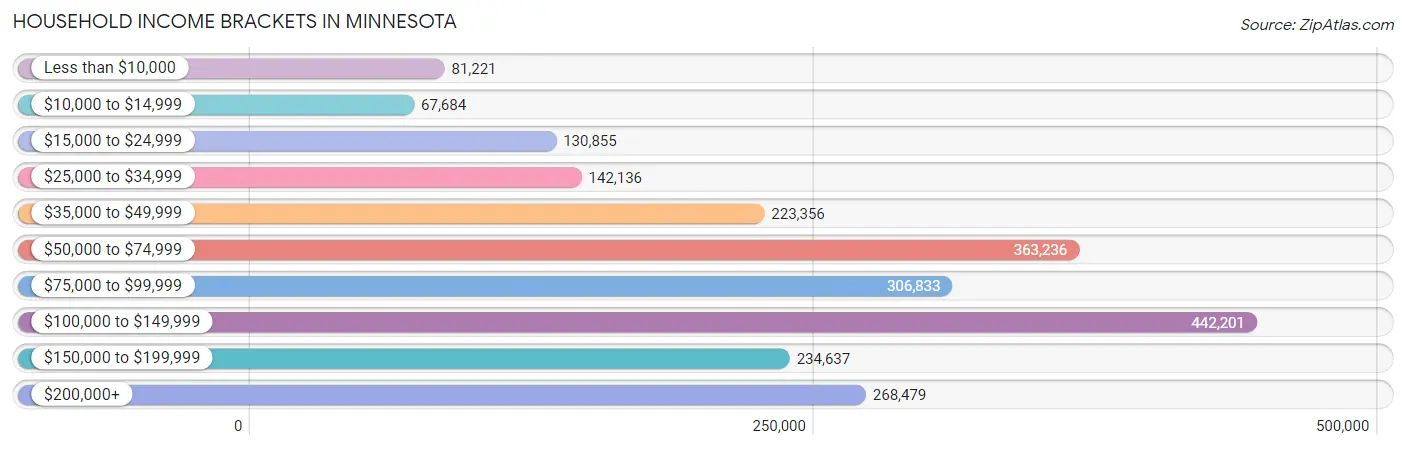
Household Income Brackets in Minnesota
With 442,201 households falling in the category, the $100,000 to $149,999 income range is the most frequent in Minnesota, accounting for 19.6% of all households. In contrast, only 67,684 households (3.0%) fall into the $10,000 to $14,999 income bracket, making it the least populous group.
| Income Bracket | # Households | % Households |
| Less than $10,000 | 81,221 | 3.6% |
| $10,000 to $14,999 | 67,684 | 3.0% |
| $15,000 to $24,999 | 130,855 | 5.8% |
| $25,000 to $34,999 | 142,136 | 6.3% |
| $35,000 to $49,999 | 223,356 | 9.9% |
| $50,000 to $74,999 | 363,236 | 16.1% |
| $75,000 to $99,999 | 306,833 | 13.6% |
| $100,000 to $149,999 | 442,201 | 19.6% |
| $150,000 to $199,999 | 234,637 | 10.4% |
| $200,000+ | 268,479 | 11.9% |
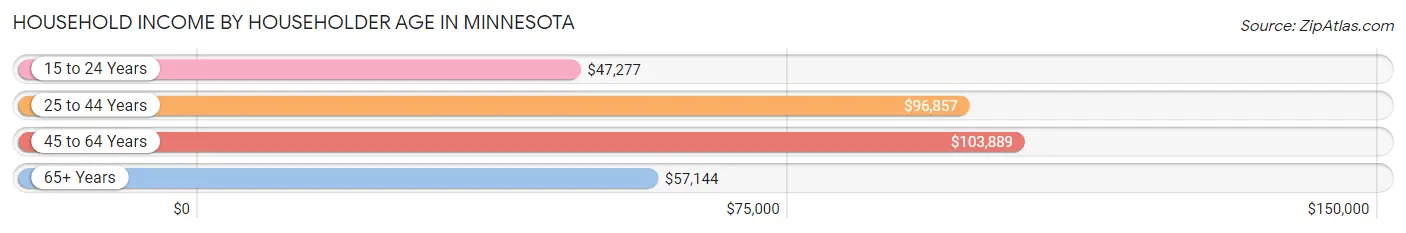
Household Income by Householder Age in Minnesota
The median household income in Minnesota is $84,313, with the highest median household income of $103,889 found in the 45 to 64 years age bracket for the primary householder. A total of 815,597 households (36.1%) fall into this category. Meanwhile, the 15 to 24 years age bracket for the primary householder has the lowest median household income of $47,277, with 98,843 households (4.4%) in this group.
| Income Bracket | # Households | Median Income |
| 15 to 24 Years | 98,843 (4.4%) | $47,277 |
| 25 to 44 Years | 754,412 (33.4%) | $96,857 |
| 45 to 64 Years | 815,597 (36.1%) | $103,889 |
| 65+ Years | 587,274 (26.0%) | $57,144 |
| Total | 2,256,126 (100.0%) | $84,313 |
Poverty in Minnesota
Income Below Poverty by Sex and Age in Minnesota
With 8.4% poverty level for males and 10.1% for females among the residents of Minnesota, 18 to 24 year old males and 18 to 24 year old females are the most vulnerable to poverty, with 36,374 males (15.1%) and 49,063 females (21.5%) in their respective age groups living below the poverty level.
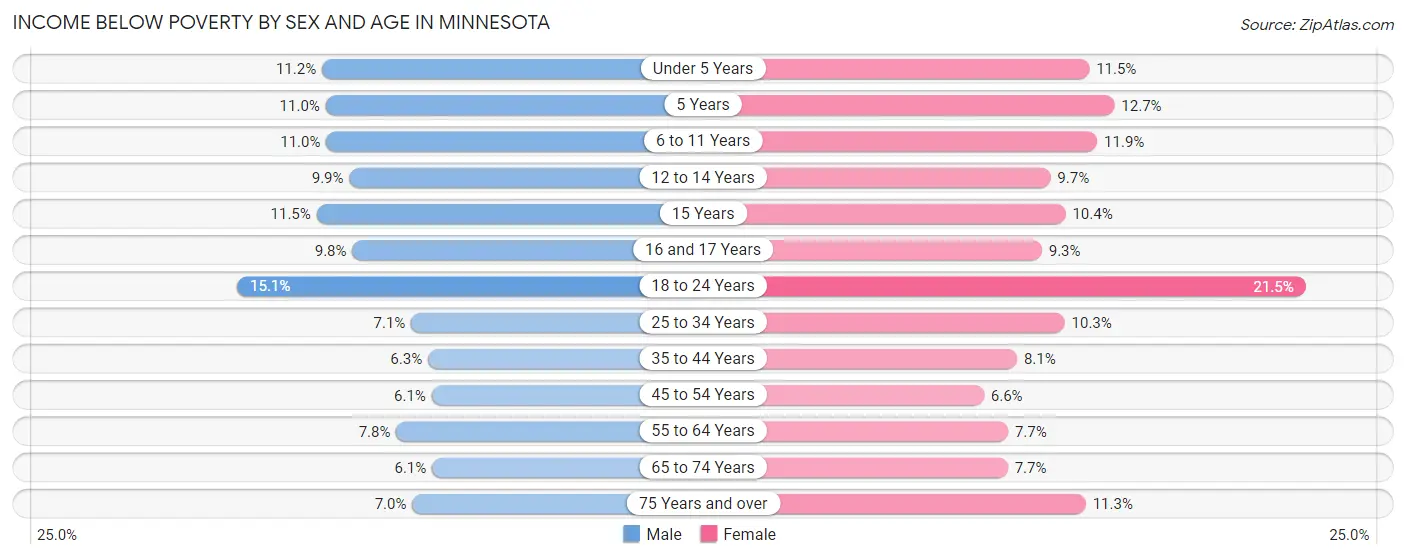
| Age Bracket | Male | Female |
| Under 5 Years | 19,103 (11.2%) | 18,870 (11.5%) |
| 5 Years | 4,022 (11.0%) | 4,254 (12.7%) |
| 6 to 11 Years | 24,735 (11.0%) | 24,823 (11.8%) |
| 12 to 14 Years | 10,864 (9.9%) | 10,795 (9.7%) |
| 15 Years | 4,474 (11.5%) | 3,872 (10.4%) |
| 16 and 17 Years | 7,431 (9.8%) | 6,712 (9.3%) |
| 18 to 24 Years | 36,374 (15.1%) | 49,063 (21.5%) |
| 25 to 34 Years | 26,894 (7.1%) | 37,743 (10.3%) |
| 35 to 44 Years | 23,936 (6.3%) | 29,615 (8.1%) |
| 45 to 54 Years | 20,942 (6.1%) | 21,708 (6.6%) |
| 55 to 64 Years | 29,176 (7.7%) | 28,928 (7.7%) |
| 65 to 74 Years | 16,093 (6.1%) | 21,491 (7.7%) |
| 75 Years and over | 10,756 (7.0%) | 23,610 (11.3%) |
| Total | 234,800 (8.4%) | 281,484 (10.1%) |
Income Above Poverty by Sex and Age in Minnesota
According to the poverty statistics in Minnesota, males aged 65 to 74 years and females aged 45 to 54 years are the age groups that are most secure financially, with 93.9% of males and 93.4% of females in these age groups living above the poverty line.
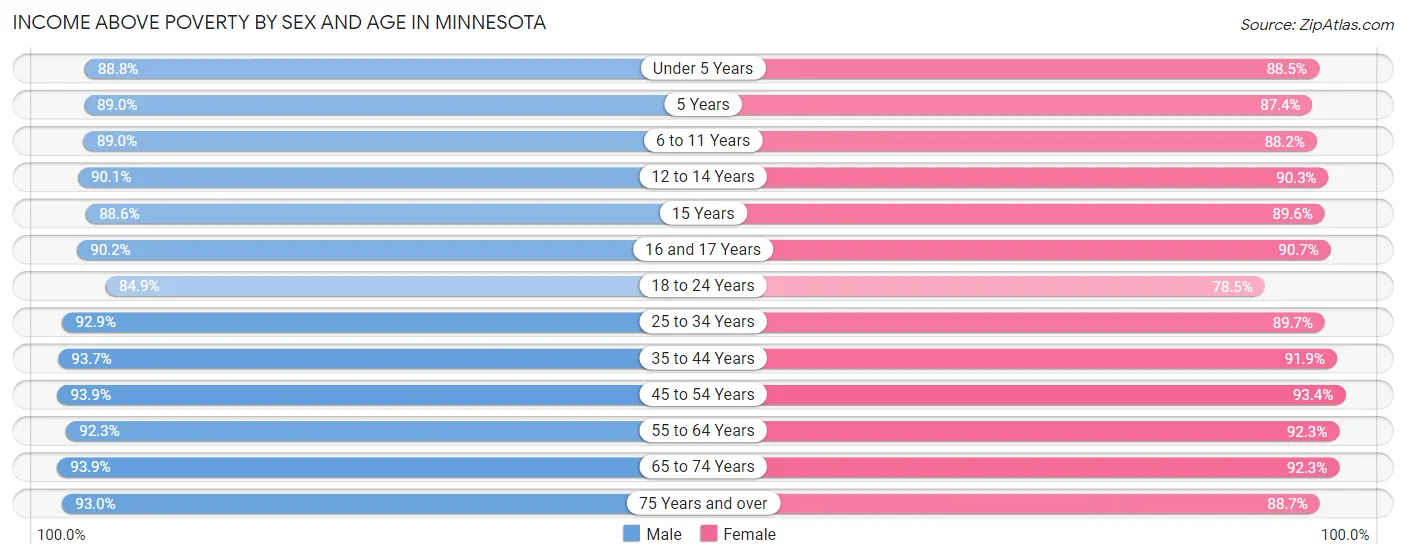
| Age Bracket | Male | Female |
| Under 5 Years | 151,526 (88.8%) | 145,566 (88.5%) |
| 5 Years | 32,448 (89.0%) | 29,376 (87.4%) |
| 6 to 11 Years | 200,175 (89.0%) | 184,597 (88.1%) |
| 12 to 14 Years | 98,539 (90.1%) | 100,745 (90.3%) |
| 15 Years | 34,593 (88.5%) | 33,417 (89.6%) |
| 16 and 17 Years | 68,510 (90.2%) | 65,637 (90.7%) |
| 18 to 24 Years | 203,870 (84.9%) | 178,951 (78.5%) |
| 25 to 34 Years | 354,239 (92.9%) | 327,231 (89.7%) |
| 35 to 44 Years | 357,252 (93.7%) | 334,779 (91.9%) |
| 45 to 54 Years | 321,758 (93.9%) | 307,636 (93.4%) |
| 55 to 64 Years | 347,205 (92.2%) | 346,059 (92.3%) |
| 65 to 74 Years | 248,338 (93.9%) | 257,646 (92.3%) |
| 75 Years and over | 142,680 (93.0%) | 184,982 (88.7%) |
| Total | 2,561,133 (91.6%) | 2,496,622 (89.9%) |
Income Below Poverty Among Married-Couple Families in Minnesota
The poverty statistics for married-couple families in Minnesota show that 2.6% or 28,814 of the total 1,120,173 families live below the poverty line. Families with 5 or more children have the highest poverty rate of 22.4%, comprising of 2,719 families. On the other hand, families with no children have the lowest poverty rate of 2.1%, which includes 13,731 families.
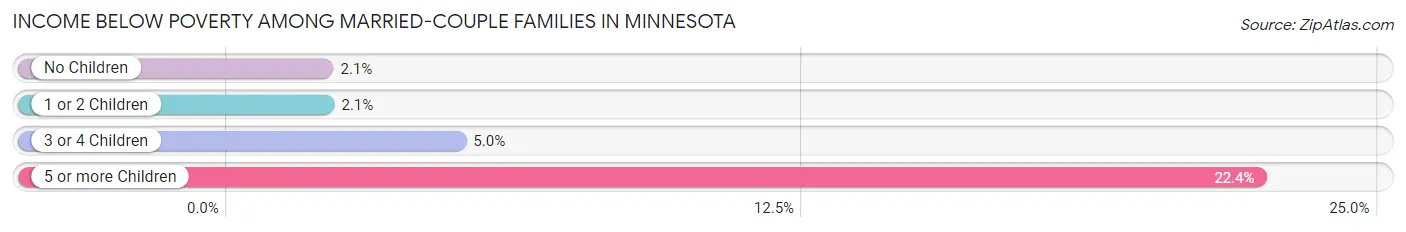
| Children | Above Poverty | Below Poverty |
| No Children | 646,779 (97.9%) | 13,731 (2.1%) |
| 1 or 2 Children | 337,358 (97.9%) | 7,247 (2.1%) |
| 3 or 4 Children | 97,791 (95.0%) | 5,117 (5.0%) |
| 5 or more Children | 9,431 (77.6%) | 2,719 (22.4%) |
| Total | 1,091,359 (97.4%) | 28,814 (2.6%) |
Income Below Poverty Among Single-Parent Households in Minnesota
According to the poverty data in Minnesota, 9.5% or 9,558 single-father households and 19.9% or 40,315 single-mother households are living below the poverty line. Among single-father households, those with 5 or more children have the highest poverty rate, with 205 households (22.1%) experiencing poverty. Likewise, among single-mother households, those with 5 or more children have the highest poverty rate, with 2,152 households (63.2%) falling below the poverty line.
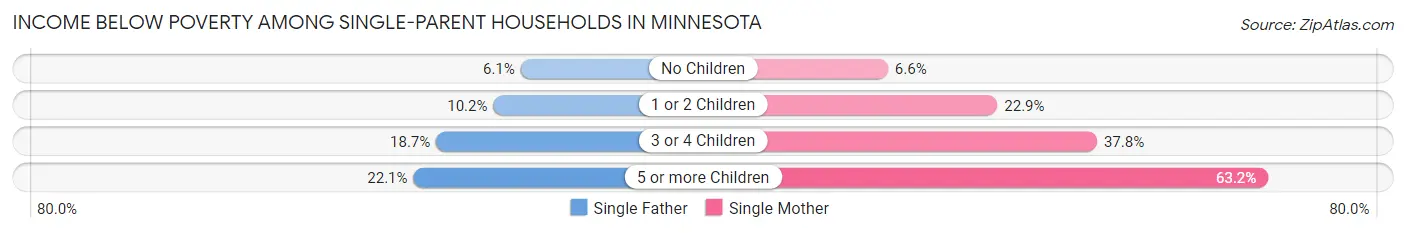
| Children | Single Father | Single Mother |
| No Children | 2,452 (6.1%) | 4,486 (6.6%) |
| 1 or 2 Children | 5,069 (10.2%) | 24,682 (22.9%) |
| 3 or 4 Children | 1,832 (18.7%) | 8,995 (37.8%) |
| 5 or more Children | 205 (22.1%) | 2,152 (63.2%) |
| Total | 9,558 (9.5%) | 40,315 (19.9%) |
Income Below Poverty Among Married-Couple vs Single-Parent Households in Minnesota
The poverty data for Minnesota shows that 28,814 of the married-couple family households (2.6%) and 49,873 of the single-parent households (16.4%) are living below the poverty level. Within the married-couple family households, those with 5 or more children have the highest poverty rate, with 2,719 households (22.4%) falling below the poverty line. Among the single-parent households, those with 5 or more children have the highest poverty rate, with 2,357 household (54.4%) living below poverty.
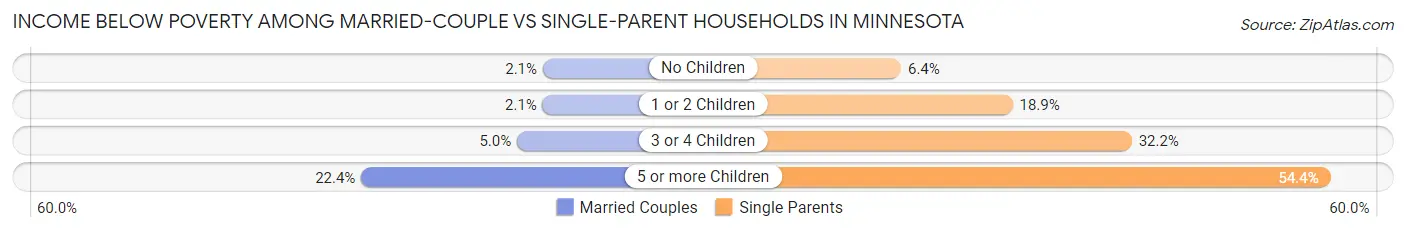
| Children | Married-Couple Families | Single-Parent Households |
| No Children | 13,731 (2.1%) | 6,938 (6.4%) |
| 1 or 2 Children | 7,247 (2.1%) | 29,751 (18.9%) |
| 3 or 4 Children | 5,117 (5.0%) | 10,827 (32.2%) |
| 5 or more Children | 2,719 (22.4%) | 2,357 (54.4%) |
| Total | 28,814 (2.6%) | 49,873 (16.4%) |
Largest Zip Codes by Population in Minnesota
The largest zip codes in Minnesota by population are 55044 (61,134), 55901 (58,015), 55106 (57,662), 55124 (55,594), and 55303 (52,051).
1.55044
61,134 (1.07%)
2.55901
58,015 (1.02%)
3.55106
57,662 (1.01%)
4.55124
55,594 (0.98%)
5.55303
52,051 (0.91%)
6.56001
50,524 (0.89%)
7.55304
49,175 (0.86%)
8.55379
48,318 (0.85%)
9.55337
47,697 (0.84%)
10.55112
46,095 (0.81%)
11.55125
45,835 (0.80%)
12.55117
45,550 (0.80%)
13.55119
45,105 (0.79%)
14.55104
44,498 (0.78%)
15.55330
44,149 (0.78%)
16.56560
43,860 (0.77%)
17.55113
41,369 (0.73%)
18.55016
38,842 (0.68%)
19.55110
37,986 (0.67%)
20.55369
37,983 (0.67%)
21.55311
37,797 (0.66%)
22.55407
36,997 (0.65%)
23.55423
36,859 (0.65%)
24.55024
36,697 (0.64%)
25.55082
36,154 (0.63%)
26.55406
35,726 (0.63%)
27.56301
35,150 (0.62%)
28.55416
34,715 (0.61%)
29.56601
34,476 (0.61%)
30.55109
34,220 (0.60%)
Largest Cities by Population in Minnesota
The largest cities in Minnesota by population are Minneapolis (426,877), St Paul (308,806), Rochester (120,848), Bloomington (89,244), and Duluth (86,772).
426,877 (7.50%)
2.St Paul
308,806 (5.42%)
120,848 (2.12%)
89,244 (1.57%)
5.Duluth
86,772 (1.52%)
84,951 (1.49%)
7.Plymouth
79,918 (1.40%)
8.Woodbury
75,549 (1.33%)
70,696 (1.24%)
10.Maple Grove
70,110 (1.23%)
11.Blaine
70,047 (1.23%)
12.St Cloud
68,910 (1.21%)
13.Eagan
68,262 (1.20%)
14.Burnsville
64,075 (1.13%)
15.Eden Prairie
63,623 (1.12%)
16.Coon Rapids
63,296 (1.11%)
17.Apple Valley
55,594 (0.98%)
18.Minnetonka
53,529 (0.94%)
19.Edina
53,037 (0.93%)
49,500 (0.87%)
21.Mankato
44,444 (0.78%)
22.Moorhead
44,443 (0.78%)
23.Shakopee
44,135 (0.77%)
24.Maplewood
41,405 (0.73%)
39,274 (0.69%)
26.Richfield
36,809 (0.65%)
27.Roseville
36,066 (0.63%)
35,673 (0.63%)
33,109 (0.58%)
30.Andover
32,639 (0.57%)
Largest Counties by Population in Minnesota
The largest counties in Minnesota by population are Hennepin County (1,270,787), Ramsey County (547,202), Dakota County (439,179), Anoka County (363,985), and Washington County (268,651).
1,270,787 (22.31%)
547,202 (9.61%)
439,179 (7.71%)
363,985 (6.39%)
268,651 (4.72%)
200,122 (3.51%)
162,307 (2.85%)
158,622 (2.79%)
151,347 (2.66%)
142,543 (2.50%)
107,216 (1.88%)
97,820 (1.72%)
69,022 (1.21%)
14.Rice County
67,152 (1.18%)
66,558 (1.17%)
16.Clay County
65,307 (1.15%)
60,072 (1.05%)
56,927 (1.00%)
49,792 (0.87%)
47,697 (0.84%)
46,274 (0.81%)
45,054 (0.79%)
43,686 (0.77%)
41,300 (0.73%)
41,257 (0.72%)
26.Mower County
40,082 (0.70%)
39,081 (0.69%)
37,396 (0.66%)
36,727 (0.64%)
36,362 (0.64%)
Race in Minnesota
The most populous races in Minnesota are White / Caucasian (4,537,219 | 79.7%), Black / African American (382,082 | 6.7%), and Hispanic or Latino (327,049 | 5.7%).
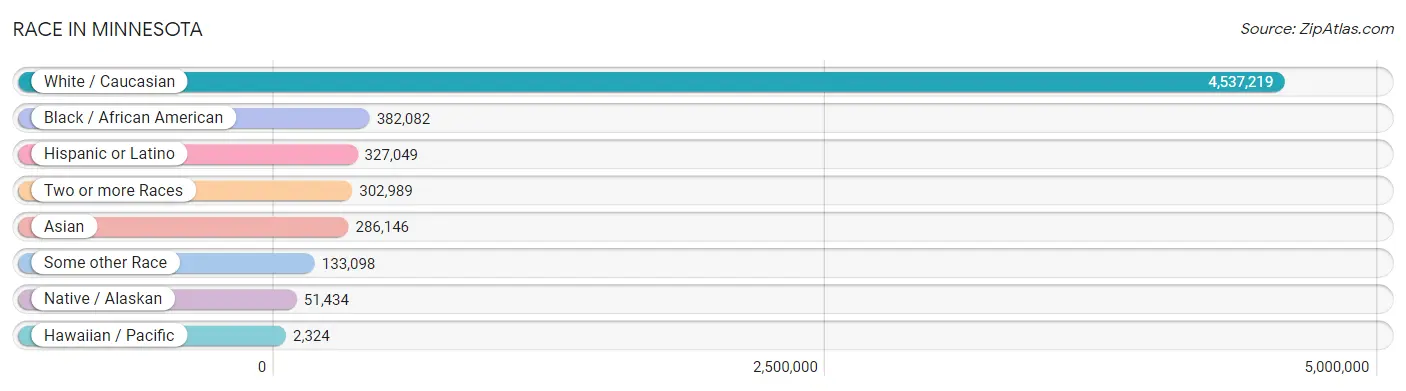
| Race | # Population | % Population |
| Asian | 286,146 | 5.0% |
| Black / African American | 382,082 | 6.7% |
| Hawaiian / Pacific | 2,324 | 0.0% |
| Hispanic or Latino | 327,049 | 5.7% |
| Native / Alaskan | 51,434 | 0.9% |
| White / Caucasian | 4,537,219 | 79.7% |
| Two or more Races | 302,989 | 5.3% |
| Some other Race | 133,098 | 2.3% |
| Total | 5,695,292 | 100.0% |
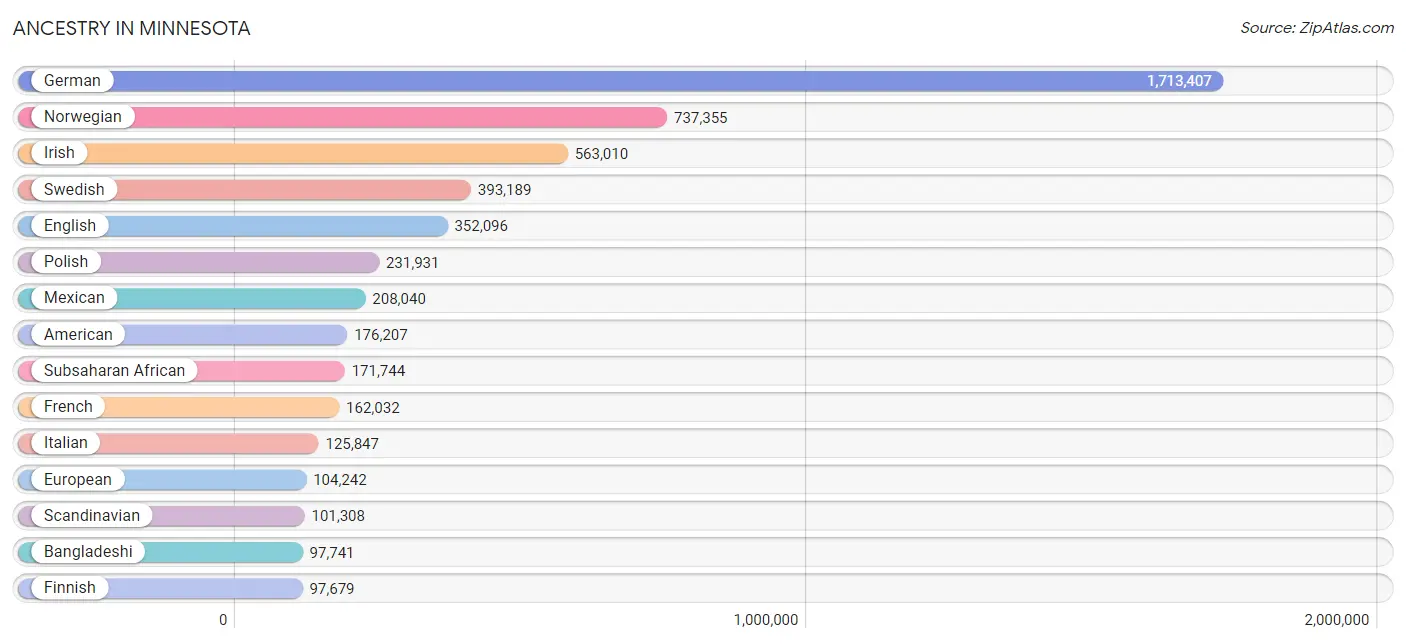
Ancestry in Minnesota
The most populous ancestries reported in Minnesota are German (1,713,407 | 30.1%), Norwegian (737,355 | 13.0%), Irish (563,010 | 9.9%), Swedish (393,189 | 6.9%), and English (352,096 | 6.2%), together accounting for 66.0% of all Minnesota residents.
| Ancestry | # Population | % Population |
| Afghan | 1,267 | 0.0% |
| African | 32,871 | 0.6% |
| Alaska Native | 147 | 0.0% |
| Alaskan Athabascan | 56 | 0.0% |
| Albanian | 804 | 0.0% |
| Aleut | 148 | 0.0% |
| Alsatian | 116 | 0.0% |
| American | 176,207 | 3.1% |
| Apache | 608 | 0.0% |
| Arab | 26,128 | 0.5% |
| Arapaho | 30 | 0.0% |
| Argentinean | 1,587 | 0.0% |
| Armenian | 1,170 | 0.0% |
| Assyrian / Chaldean / Syriac | 47 | 0.0% |
| Australian | 850 | 0.0% |
| Austrian | 15,507 | 0.3% |
| Bahamian | 641 | 0.0% |
| Bangladeshi | 97,741 | 1.7% |
| Barbadian | 235 | 0.0% |
| Basque | 170 | 0.0% |
| Belgian | 14,212 | 0.3% |
| Belizean | 177 | 0.0% |
| Bermudan | 49 | 0.0% |
| Bhutanese | 11,891 | 0.2% |
| Blackfeet | 2,206 | 0.0% |
| Bolivian | 627 | 0.0% |
| Brazilian | 2,346 | 0.0% |
| British | 20,215 | 0.4% |
| British West Indian | 158 | 0.0% |
| Bulgarian | 1,326 | 0.0% |
| Burmese | 25,104 | 0.4% |
| Cajun | 252 | 0.0% |
| Cambodian | 270 | 0.0% |
| Canadian | 6,696 | 0.1% |
| Cape Verdean | 106 | 0.0% |
| Carpatho Rusyn | 226 | 0.0% |
| Celtic | 680 | 0.0% |
| Central American | 35,066 | 0.6% |
| Central American Indian | 2,750 | 0.1% |
| Cherokee | 6,068 | 0.1% |
| Cheyenne | 188 | 0.0% |
| Chickasaw | 258 | 0.0% |
| Chilean | 1,464 | 0.0% |
| Chinese | 12 | 0.0% |
| Chippewa | 52,447 | 0.9% |
| Choctaw | 1,052 | 0.0% |
| Colombian | 6,667 | 0.1% |
| Colville | 13 | 0.0% |
| Comanche | 192 | 0.0% |
| Costa Rican | 1,505 | 0.0% |
| Cree | 620 | 0.0% |
| Creek | 312 | 0.0% |
| Croatian | 9,488 | 0.2% |
| Crow | 71 | 0.0% |
| Cuban | 7,156 | 0.1% |
| Cypriot | 89 | 0.0% |
| Czech | 80,915 | 1.4% |
| Czechoslovakian | 10,106 | 0.2% |
| Danish | 65,672 | 1.1% |
| Delaware | 105 | 0.0% |
| Dominican | 3,328 | 0.1% |
| Dutch | 85,388 | 1.5% |
| Dutch West Indian | 72 | 0.0% |
| Eastern European | 15,160 | 0.3% |
| Ecuadorian | 14,276 | 0.3% |
| Egyptian | 3,910 | 0.1% |
| English | 352,096 | 6.2% |
| Estonian | 556 | 0.0% |
| Ethiopian | 26,858 | 0.5% |
| European | 104,242 | 1.8% |
| Fijian | 164 | 0.0% |
| Filipino | 2,190 | 0.0% |
| Finnish | 97,679 | 1.7% |
| French | 162,032 | 2.9% |
| French American Indian | 1,931 | 0.0% |
| French Canadian | 47,243 | 0.8% |
| German | 1,713,407 | 30.1% |
| German Russian | 878 | 0.0% |
| Ghanaian | 3,826 | 0.1% |
| Greek | 10,154 | 0.2% |
| Guamanian / Chamorro | 781 | 0.0% |
| Guatemalan | 11,097 | 0.2% |
| Guyanese | 2,667 | 0.1% |
| Haitian | 1,726 | 0.0% |
| Hmong | 21 | 0.0% |
| Honduran | 5,522 | 0.1% |
| Hopi | 401 | 0.0% |
| Houma | 2 | 0.0% |
| Hungarian | 12,546 | 0.2% |
| Icelander | 3,123 | 0.1% |
| Indian (Asian) | 40,623 | 0.7% |
| Indonesian | 15,237 | 0.3% |
| Inupiat | 797 | 0.0% |
| Iranian | 3,378 | 0.1% |
| Iraqi | 1,975 | 0.0% |
| Irish | 563,010 | 9.9% |
| Iroquois | 842 | 0.0% |
| Israeli | 703 | 0.0% |
| Italian | 125,847 | 2.2% |
| Jamaican | 3,507 | 0.1% |
| Japanese | 10,101 | 0.2% |
| Jordanian | 806 | 0.0% |
| Kenyan | 7,862 | 0.1% |
| Kiowa | 140 | 0.0% |
| Korean | 25,050 | 0.4% |
| Laotian | 879 | 0.0% |
| Latvian | 2,508 | 0.0% |
| Lebanese | 8,040 | 0.1% |
| Liberian | 14,080 | 0.3% |
| Lithuanian | 5,734 | 0.1% |
| Lumbee | 41 | 0.0% |
| Luxembourger | 5,402 | 0.1% |
| Macedonian | 344 | 0.0% |
| Malaysian | 13,072 | 0.2% |
| Maltese | 316 | 0.0% |
| Marshallese | 191 | 0.0% |
| Menominee | 168 | 0.0% |
| Mexican | 208,040 | 3.6% |
| Mexican American Indian | 3,144 | 0.1% |
| Mongolian | 561 | 0.0% |
| Moroccan | 1,878 | 0.0% |
| Native Hawaiian | 2,662 | 0.1% |
| Navajo | 918 | 0.0% |
| New Zealander | 171 | 0.0% |
| Nicaraguan | 2,795 | 0.1% |
| Nigerian | 9,917 | 0.2% |
| Northern European | 14,579 | 0.3% |
| Norwegian | 737,355 | 13.0% |
| Okinawan | 97 | 0.0% |
| Osage | 91 | 0.0% |
| Ottawa | 72 | 0.0% |
| Paiute | 26 | 0.0% |
| Pakistani | 4,586 | 0.1% |
| Palestinian | 1,745 | 0.0% |
| Panamanian | 1,272 | 0.0% |
| Paraguayan | 354 | 0.0% |
| Pennsylvania German | 1,385 | 0.0% |
| Peruvian | 3,490 | 0.1% |
| Pima | 3 | 0.0% |
| Polish | 231,931 | 4.1% |
| Portuguese | 3,357 | 0.1% |
| Potawatomi | 259 | 0.0% |
| Pueblo | 217 | 0.0% |
| Puerto Rican | 16,689 | 0.3% |
| Puget Sound Salish | 236 | 0.0% |
| Romanian | 5,841 | 0.1% |
| Russian | 34,401 | 0.6% |
| Salvadoran | 12,822 | 0.2% |
| Samoan | 1,152 | 0.0% |
| Scandinavian | 101,308 | 1.8% |
| Scotch-Irish | 25,978 | 0.5% |
| Scottish | 62,613 | 1.1% |
| Seminole | 129 | 0.0% |
| Senegalese | 173 | 0.0% |
| Serbian | 3,771 | 0.1% |
| Shoshone | 28 | 0.0% |
| Sierra Leonean | 894 | 0.0% |
| Sioux | 10,635 | 0.2% |
| Slavic | 3,122 | 0.1% |
| Slovak | 7,532 | 0.1% |
| Slovene | 8,816 | 0.2% |
| Somali | 63,569 | 1.1% |
| South African | 805 | 0.0% |
| South American | 32,523 | 0.6% |
| South American Indian | 660 | 0.0% |
| Soviet Union | 43 | 0.0% |
| Spaniard | 6,726 | 0.1% |
| Spanish | 4,340 | 0.1% |
| Spanish American | 100 | 0.0% |
| Spanish American Indian | 76 | 0.0% |
| Sri Lankan | 34,210 | 0.6% |
| Subsaharan African | 171,744 | 3.0% |
| Sudanese | 3,867 | 0.1% |
| Swedish | 393,189 | 6.9% |
| Swiss | 20,575 | 0.4% |
| Syrian | 1,516 | 0.0% |
| Thai | 53,003 | 0.9% |
| Tlingit-Haida | 226 | 0.0% |
| Tohono O'Odham | 65 | 0.0% |
| Tongan | 293 | 0.0% |
| Trinidadian and Tobagonian | 1,384 | 0.0% |
| Tsimshian | 41 | 0.0% |
| Turkish | 1,761 | 0.0% |
| U.S. Virgin Islander | 119 | 0.0% |
| Ugandan | 827 | 0.0% |
| Ukrainian | 16,813 | 0.3% |
| Uruguayan | 790 | 0.0% |
| Ute | 37 | 0.0% |
| Venezuelan | 2,805 | 0.1% |
| Vietnamese | 1,344 | 0.0% |
| Welsh | 22,927 | 0.4% |
| West Indian | 1,444 | 0.0% |
| Yakama | 91 | 0.0% |
| Yaqui | 85 | 0.0% |
| Yugoslavian | 5,059 | 0.1% |
| Yuman | 41 | 0.0% |
| Yup'ik | 140 | 0.0% |
| Zimbabwean | 107 | 0.0% | View All 198 Rows |
Immigrants in Minnesota
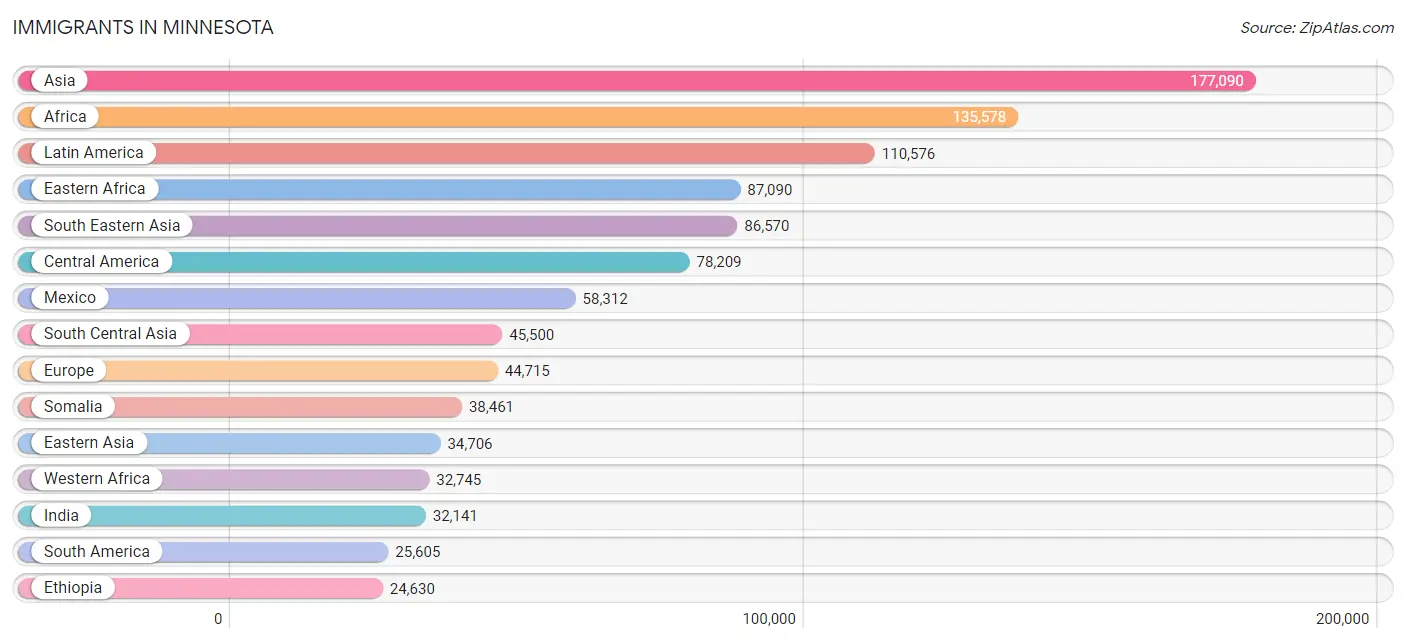
The most numerous immigrant groups reported in Minnesota came from Asia (177,090 | 3.1%), Africa (135,578 | 2.4%), Latin America (110,576 | 1.9%), Eastern Africa (87,090 | 1.5%), and South Eastern Asia (86,570 | 1.5%), together accounting for 10.5% of all Minnesota residents.
| Immigration Origin | # Population | % Population |
| Afghanistan | 1,107 | 0.0% |
| Africa | 135,578 | 2.4% |
| Albania | 183 | 0.0% |
| Argentina | 1,241 | 0.0% |
| Armenia | 39 | 0.0% |
| Asia | 177,090 | 3.1% |
| Australia | 1,001 | 0.0% |
| Austria | 349 | 0.0% |
| Azores | 4 | 0.0% |
| Bahamas | 302 | 0.0% |
| Bangladesh | 1,174 | 0.0% |
| Barbados | 135 | 0.0% |
| Belarus | 1,358 | 0.0% |
| Belgium | 283 | 0.0% |
| Belize | 167 | 0.0% |
| Bolivia | 312 | 0.0% |
| Bosnia and Herzegovina | 2,134 | 0.0% |
| Brazil | 2,981 | 0.1% |
| Bulgaria | 627 | 0.0% |
| Cabo Verde | 24 | 0.0% |
| Cambodia | 4,264 | 0.1% |
| Cameroon | 3,598 | 0.1% |
| Canada | 11,939 | 0.2% |
| Caribbean | 6,762 | 0.1% |
| Central America | 78,209 | 1.4% |
| Chile | 531 | 0.0% |
| China | 20,595 | 0.4% |
| Colombia | 3,651 | 0.1% |
| Congo | 392 | 0.0% |
| Costa Rica | 652 | 0.0% |
| Croatia | 321 | 0.0% |
| Cuba | 1,621 | 0.0% |
| Czechoslovakia | 577 | 0.0% |
| Denmark | 333 | 0.0% |
| Dominica | 68 | 0.0% |
| Dominican Republic | 1,665 | 0.0% |
| Eastern Africa | 87,090 | 1.5% |
| Eastern Asia | 34,706 | 0.6% |
| Eastern Europe | 23,770 | 0.4% |
| Ecuador | 8,438 | 0.2% |
| Egypt | 2,929 | 0.1% |
| El Salvador | 6,841 | 0.1% |
| England | 2,636 | 0.1% |
| Eritrea | 2,993 | 0.1% |
| Ethiopia | 24,630 | 0.4% |
| Europe | 44,715 | 0.8% |
| Fiji | 51 | 0.0% |
| France | 1,664 | 0.0% |
| Germany | 6,670 | 0.1% |
| Ghana | 3,528 | 0.1% |
| Greece | 408 | 0.0% |
| Grenada | 8 | 0.0% |
| Guatemala | 6,706 | 0.1% |
| Guyana | 3,436 | 0.1% |
| Haiti | 872 | 0.0% |
| Honduras | 4,085 | 0.1% |
| Hong Kong | 1,119 | 0.0% |
| Hungary | 508 | 0.0% |
| India | 32,141 | 0.6% |
| Indonesia | 351 | 0.0% |
| Iran | 2,035 | 0.0% |
| Iraq | 2,283 | 0.0% |
| Ireland | 807 | 0.0% |
| Israel | 436 | 0.0% |
| Italy | 952 | 0.0% |
| Jamaica | 934 | 0.0% |
| Japan | 2,345 | 0.0% |
| Jordan | 725 | 0.0% |
| Kazakhstan | 763 | 0.0% |
| Kenya | 15,701 | 0.3% |
| Korea | 11,675 | 0.2% |
| Kuwait | 579 | 0.0% |
| Laos | 24,591 | 0.4% |
| Latin America | 110,576 | 1.9% |
| Latvia | 643 | 0.0% |
| Lebanon | 795 | 0.0% |
| Liberia | 13,695 | 0.2% |
| Lithuania | 300 | 0.0% |
| Malaysia | 914 | 0.0% |
| Mexico | 58,312 | 1.0% |
| Micronesia | 260 | 0.0% |
| Middle Africa | 4,581 | 0.1% |
| Moldova | 1,779 | 0.0% |
| Morocco | 1,042 | 0.0% |
| Nepal | 3,038 | 0.1% |
| Netherlands | 771 | 0.0% |
| Nicaragua | 946 | 0.0% |
| Nigeria | 8,263 | 0.2% |
| North Macedonia | 46 | 0.0% |
| Northern Africa | 6,532 | 0.1% |
| Northern Europe | 8,158 | 0.1% |
| Norway | 377 | 0.0% |
| Oceania | 1,927 | 0.0% |
| Pakistan | 2,729 | 0.1% |
| Panama | 437 | 0.0% |
| Peru | 1,963 | 0.0% |
| Philippines | 9,850 | 0.2% |
| Poland | 1,875 | 0.0% |
| Portugal | 143 | 0.0% |
| Romania | 967 | 0.0% |
| Russia | 6,329 | 0.1% |
| Saudi Arabia | 1,216 | 0.0% |
| Scotland | 451 | 0.0% |
| Senegal | 297 | 0.0% |
| Serbia | 230 | 0.0% |
| Sierra Leone | 1,385 | 0.0% |
| Singapore | 187 | 0.0% |
| Somalia | 38,461 | 0.7% |
| South Africa | 1,401 | 0.0% |
| South America | 25,605 | 0.4% |
| South Central Asia | 45,500 | 0.8% |
| South Eastern Asia | 86,570 | 1.5% |
| Southern Europe | 2,564 | 0.1% |
| Spain | 998 | 0.0% |
| Sri Lanka | 902 | 0.0% |
| St. Vincent and the Grenadines | 3 | 0.0% |
| Sudan | 2,042 | 0.0% |
| Sweden | 526 | 0.0% |
| Switzerland | 397 | 0.0% |
| Syria | 928 | 0.0% |
| Taiwan | 2,357 | 0.0% |
| Thailand | 19,333 | 0.3% |
| Trinidad and Tobago | 804 | 0.0% |
| Turkey | 981 | 0.0% |
| Uganda | 1,547 | 0.0% |
| Ukraine | 4,646 | 0.1% |
| Uruguay | 552 | 0.0% |
| Uzbekistan | 395 | 0.0% |
| Venezuela | 2,003 | 0.0% |
| Vietnam | 18,442 | 0.3% |
| West Indies | 12 | 0.0% |
| Western Africa | 32,745 | 0.6% |
| Western Asia | 9,838 | 0.2% |
| Western Europe | 10,134 | 0.2% |
| Yemen | 522 | 0.0% |
| Zaire | 551 | 0.0% |
| Zimbabwe | 313 | 0.0% | View All 137 Rows |
Sex and Age in Minnesota
Sex and Age in Minnesota
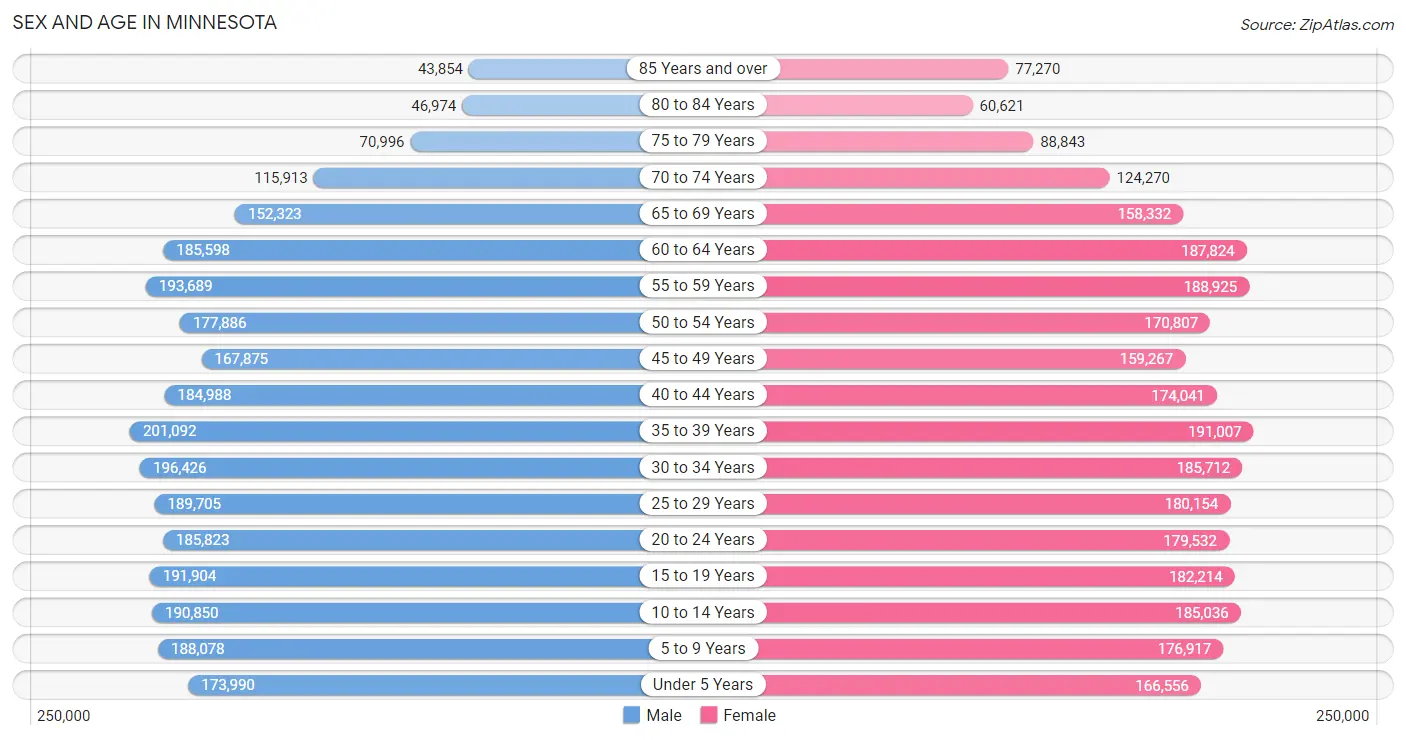
The most populous age groups in Minnesota are 35 to 39 Years (201,092 | 7.0%) for men and 35 to 39 Years (191,007 | 6.7%) for women.
| Age Bracket | Male | Female |
| Under 5 Years | 173,990 (6.1%) | 166,556 (5.9%) |
| 5 to 9 Years | 188,078 (6.6%) | 176,917 (6.2%) |
| 10 to 14 Years | 190,850 (6.7%) | 185,036 (6.5%) |
| 15 to 19 Years | 191,904 (6.7%) | 182,214 (6.4%) |
| 20 to 24 Years | 185,823 (6.5%) | 179,532 (6.3%) |
| 25 to 29 Years | 189,705 (6.6%) | 180,154 (6.4%) |
| 30 to 34 Years | 196,426 (6.9%) | 185,712 (6.6%) |
| 35 to 39 Years | 201,092 (7.0%) | 191,007 (6.7%) |
| 40 to 44 Years | 184,988 (6.5%) | 174,041 (6.1%) |
| 45 to 49 Years | 167,875 (5.9%) | 159,267 (5.6%) |
| 50 to 54 Years | 177,886 (6.2%) | 170,807 (6.0%) |
| 55 to 59 Years | 193,689 (6.8%) | 188,925 (6.7%) |
| 60 to 64 Years | 185,598 (6.5%) | 187,824 (6.6%) |
| 65 to 69 Years | 152,323 (5.3%) | 158,332 (5.6%) |
| 70 to 74 Years | 115,913 (4.1%) | 124,270 (4.4%) |
| 75 to 79 Years | 70,996 (2.5%) | 88,843 (3.1%) |
| 80 to 84 Years | 46,974 (1.6%) | 60,621 (2.1%) |
| 85 Years and over | 43,854 (1.5%) | 77,270 (2.7%) |
| Total | 2,857,964 (100.0%) | 2,837,328 (100.0%) |
Families and Households in Minnesota
Median Family Size in Minnesota
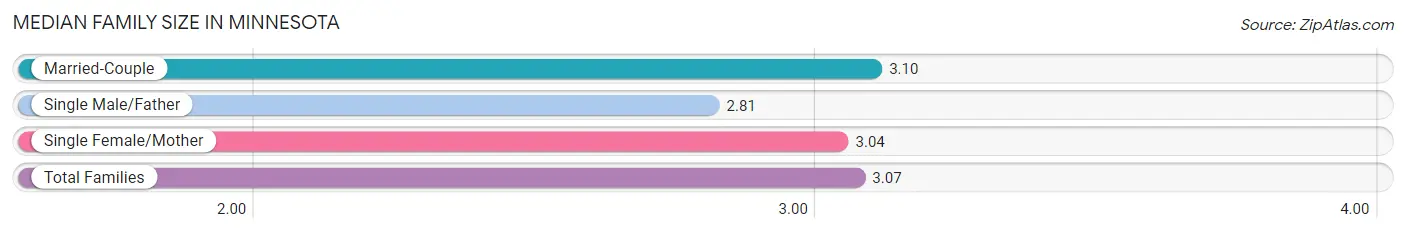
The median family size in Minnesota is 3.07 persons per family, with married-couple families (1,120,173 | 78.7%) accounting for the largest median family size of 3.1 persons per family. On the other hand, single male/father families (100,888 | 7.1%) represent the smallest median family size with 2.81 persons per family.
| Family Type | # Families | Family Size |
| Married-Couple | 1,120,173 (78.7%) | 3.10 |
| Single Male/Father | 100,888 (7.1%) | 2.81 |
| Single Female/Mother | 203,070 (14.3%) | 3.04 |
| Total Families | 1,424,131 (100.0%) | 3.07 |
Median Household Size in Minnesota
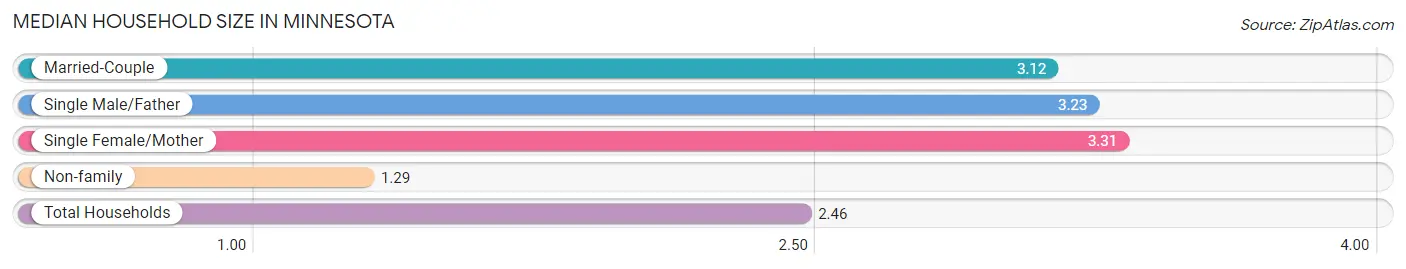
The median household size in Minnesota is 2.46 persons per household, with single female/mother households (203,070 | 9.0%) accounting for the largest median household size of 3.31 persons per household. non-family households (831,995 | 36.9%) represent the smallest median household size with 1.29 persons per household.
| Household Type | # Households | Household Size |
| Married-Couple | 1,120,173 (49.6%) | 3.12 |
| Single Male/Father | 100,888 (4.5%) | 3.23 |
| Single Female/Mother | 203,070 (9.0%) | 3.31 |
| Non-family | 831,995 (36.9%) | 1.29 |
| Total Households | 2,256,126 (100.0%) | 2.46 |
Household Size by Marriage Status in Minnesota
Out of a total of 2,256,126 households in Minnesota, 1,424,131 (63.1%) are family households, while 831,995 (36.9%) are nonfamily households. The most numerous type of family households are 2-person households, comprising 658,735, and the most common type of nonfamily households are 1-person households, comprising 655,568.
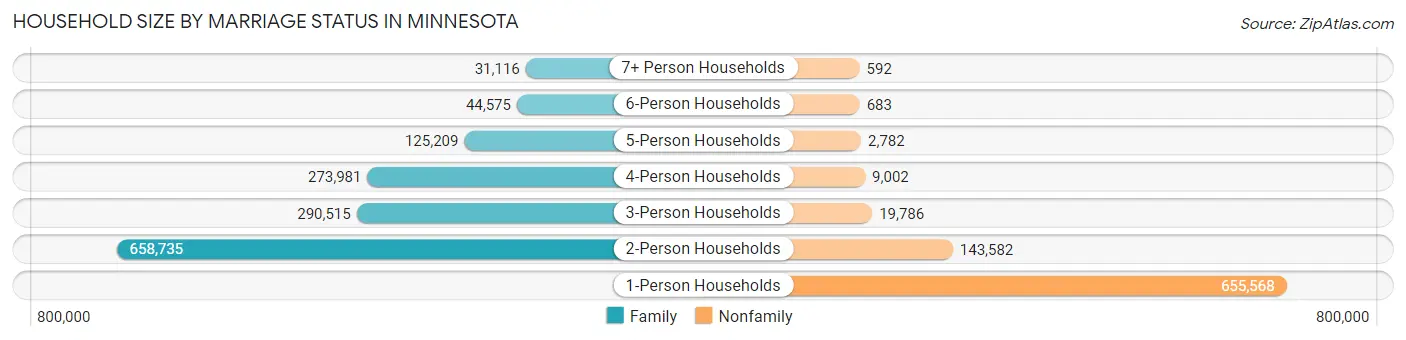
| Household Size | Family Households | Nonfamily Households |
| 1-Person Households | - | 655,568 (29.1%) |
| 2-Person Households | 658,735 (29.2%) | 143,582 (6.4%) |
| 3-Person Households | 290,515 (12.9%) | 19,786 (0.9%) |
| 4-Person Households | 273,981 (12.1%) | 9,002 (0.4%) |
| 5-Person Households | 125,209 (5.6%) | 2,782 (0.1%) |
| 6-Person Households | 44,575 (2.0%) | 683 (0.0%) |
| 7+ Person Households | 31,116 (1.4%) | 592 (0.0%) |
| Total | 1,424,131 (63.1%) | 831,995 (36.9%) |
Female Fertility in Minnesota
Fertility by Age in Minnesota
Average fertility rate in Minnesota is 57.0 births per 1,000 women. Women in the age bracket of 20 to 34 years have the highest fertility rate with 96.0 births per 1,000 women. Women in the age bracket of 20 to 34 years acount for 71.9% of all women with births.
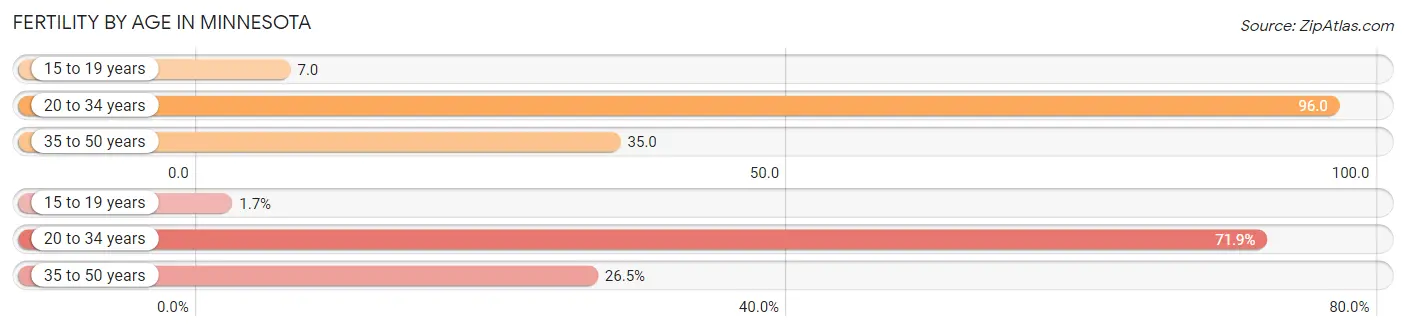
| Age Bracket | Women with Births | Births / 1,000 Women |
| 15 to 19 years | 1,204 (1.7%) | 7.0 |
| 20 to 34 years | 52,377 (71.9%) | 96.0 |
| 35 to 50 years | 19,274 (26.5%) | 35.0 |
| Total | 72,855 (100.0%) | 57.0 |
Fertility by Age by Marriage Status in Minnesota
75.3% of women with births (72,855) in Minnesota are married. The highest percentage of unmarried women with births falls into 15 to 19 years age bracket with 92.5% of them unmarried at the time of birth, while the lowest percentage of unmarried women with births belong to 35 to 50 years age bracket with 14.8% of them unmarried.
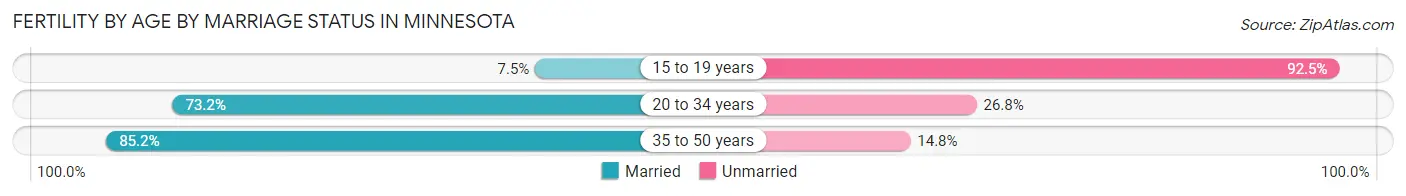
| Age Bracket | Married | Unmarried |
| 15 to 19 years | 90 (7.5%) | 1,114 (92.5%) |
| 20 to 34 years | 38,340 (73.2%) | 14,037 (26.8%) |
| 35 to 50 years | 16,421 (85.2%) | 2,853 (14.8%) |
| Total | 54,860 (75.3%) | 17,995 (24.7%) |
Fertility by Education in Minnesota
Average fertility rate in Minnesota is 57.0 births per 1,000 women. Women with the education attainment of graduate degree have the highest fertility rate of 73.0 births per 1,000 women, while women with the education attainment of less than high school have the lowest fertility at 37.0 births per 1,000 women. Women with the education attainment of college or associate's degree represent 30.1% of all women with births.
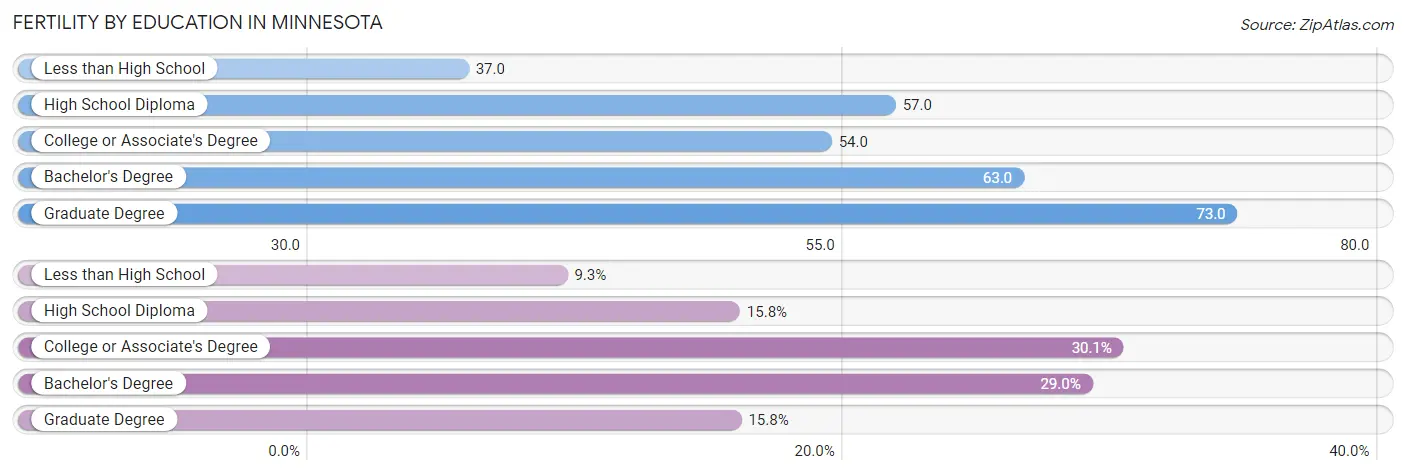
| Educational Attainment | Women with Births | Births / 1,000 Women |
| Less than High School | 6,779 (9.3%) | 37.0 |
| High School Diploma | 11,484 (15.8%) | 57.0 |
| College or Associate's Degree | 21,959 (30.1%) | 54.0 |
| Bachelor's Degree | 21,109 (29.0%) | 63.0 |
| Graduate Degree | 11,524 (15.8%) | 73.0 |
| Total | 72,855 (100.0%) | 57.0 |
Fertility by Education by Marriage Status in Minnesota
24.7% of women with births in Minnesota are unmarried. Women with the educational attainment of graduate degree are most likely to be married with 95.2% of them married at childbirth, while women with the educational attainment of less than high school are least likely to be married with 47.2% of them unmarried at childbirth.
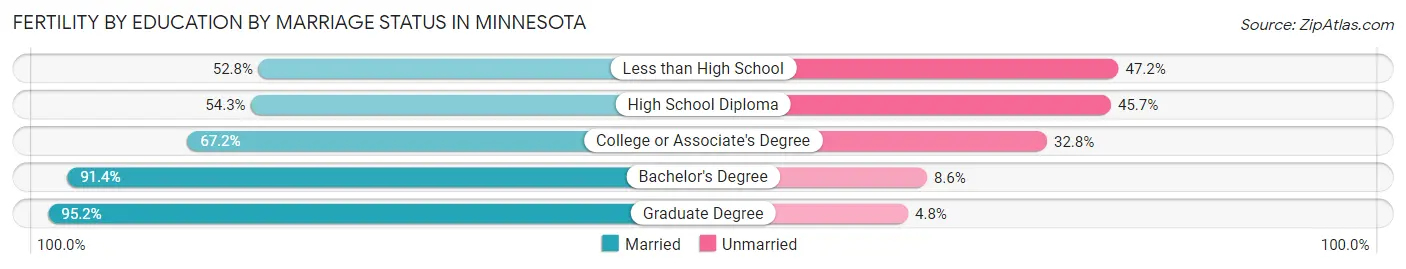
| Educational Attainment | Married | Unmarried |
| Less than High School | 3,579 (52.8%) | 3,200 (47.2%) |
| High School Diploma | 6,236 (54.3%) | 5,248 (45.7%) |
| College or Associate's Degree | 14,756 (67.2%) | 7,203 (32.8%) |
| Bachelor's Degree | 19,294 (91.4%) | 1,815 (8.6%) |
| Graduate Degree | 10,971 (95.2%) | 553 (4.8%) |
| Total | 54,860 (75.3%) | 17,995 (24.7%) |
Employment Characteristics in Minnesota
Employment by Class of Employer in Minnesota
Among the 2,934,581 employed individuals in Minnesota, private company employees (1,946,375 | 66.3%), not-for-profit organizations (346,094 | 11.8%), and local government employees (212,235 | 7.2%) make up the most common classes of employment.
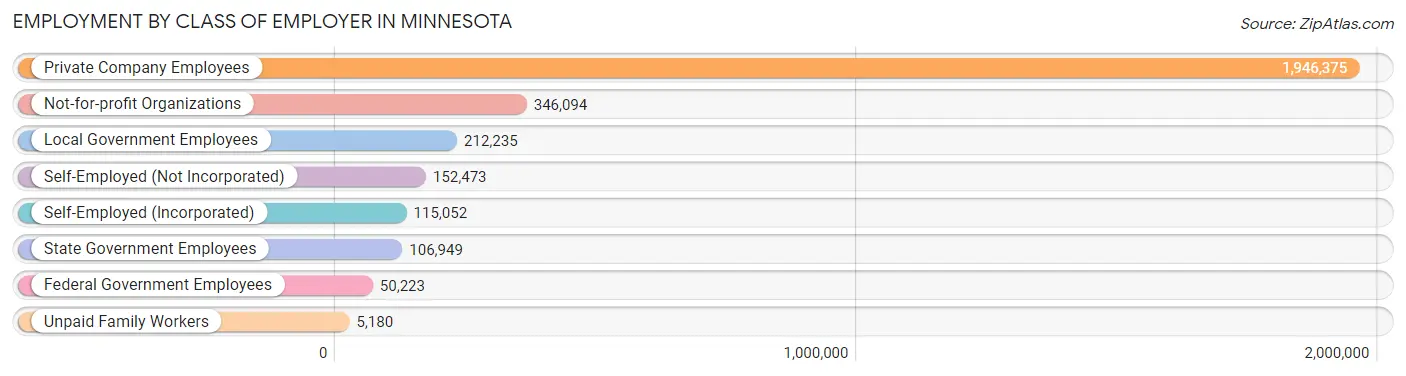
| Employer Class | # Employees | % Employees |
| Private Company Employees | 1,946,375 | 66.3% |
| Self-Employed (Incorporated) | 115,052 | 3.9% |
| Self-Employed (Not Incorporated) | 152,473 | 5.2% |
| Not-for-profit Organizations | 346,094 | 11.8% |
| Local Government Employees | 212,235 | 7.2% |
| State Government Employees | 106,949 | 3.6% |
| Federal Government Employees | 50,223 | 1.7% |
| Unpaid Family Workers | 5,180 | 0.2% |
| Total | 2,934,581 | 100.0% |
Employment Status by Age in Minnesota
According to the labor force statistics for Minnesota, out of the total population over 16 years of age (4,537,247), 68.7% or 3,117,089 individuals are in the labor force, with 4.0% or 124,684 of them unemployed. The age group with the highest labor force participation rate is 30 to 34 years, with 89.0% or 340,103 individuals in the labor force. Within the labor force, the 16 to 19 years age range has the highest percentage of unemployed individuals, with 9.8% or 15,452 of them being unemployed.
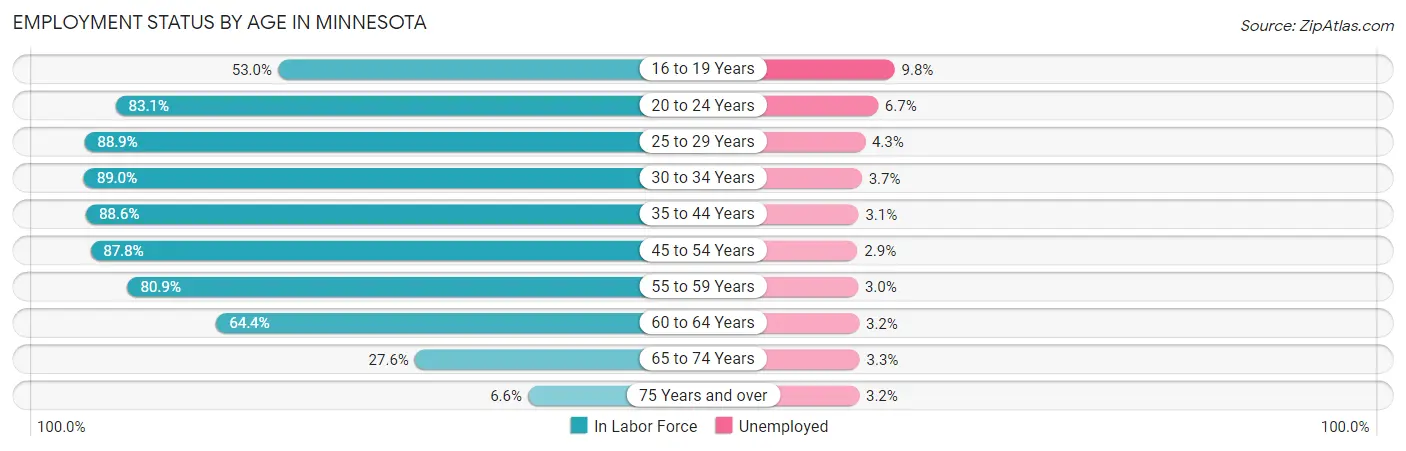
| Age Bracket | In Labor Force | Unemployed |
| 16 to 19 Years | 157,675 (53.0%) | 15,452 (9.8%) |
| 20 to 24 Years | 303,610 (83.1%) | 20,342 (6.7%) |
| 25 to 29 Years | 328,805 (88.9%) | 14,139 (4.3%) |
| 30 to 34 Years | 340,103 (89.0%) | 12,584 (3.7%) |
| 35 to 44 Years | 665,499 (88.6%) | 20,630 (3.1%) |
| 45 to 54 Years | 593,383 (87.8%) | 17,208 (2.9%) |
| 55 to 59 Years | 309,535 (80.9%) | 9,286 (3.0%) |
| 60 to 64 Years | 240,484 (64.4%) | 7,695 (3.2%) |
| 65 to 74 Years | 152,031 (27.6%) | 5,017 (3.3%) |
| 75 Years and over | 25,645 (6.6%) | 821 (3.2%) |
| Total | 3,117,089 (68.7%) | 124,684 (4.0%) |
Employment Status by Educational Attainment in Minnesota
According to labor force statistics for Minnesota, 84.4% of individuals (2,477,137) out of the total population between 25 and 64 years of age (2,934,996) are in the labor force, with 3.3% or 81,746 of them being unemployed. The group with the highest labor force participation rate are those with the educational attainment of bachelor's degree or higher, with 90.3% or 1,075,262 individuals in the labor force. Within the labor force, individuals with less than high school education have the highest percentage of unemployment, with 8.0% or 9,346 of them being unemployed.
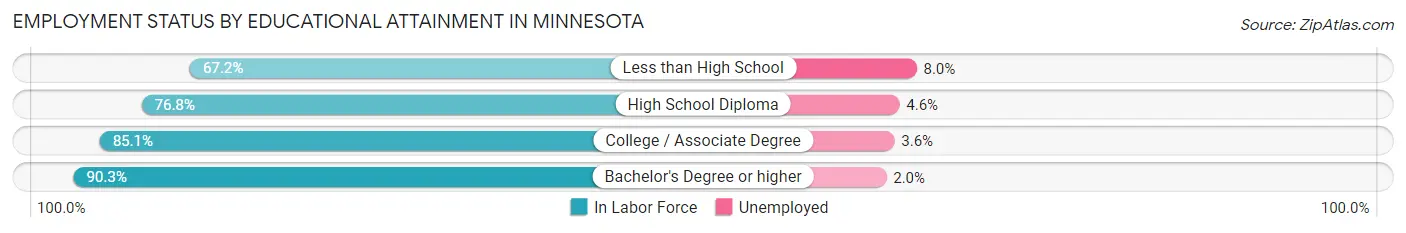
| Educational Attainment | In Labor Force | Unemployed |
| Less than High School | 116,822 (67.2%) | 13,907 (8.0%) |
| High School Diploma | 471,871 (76.8%) | 28,263 (4.6%) |
| College / Associate Degree | 813,532 (85.1%) | 34,415 (3.6%) |
| Bachelor's Degree or higher | 1,075,262 (90.3%) | 23,815 (2.0%) |
| Total | 2,477,137 (84.4%) | 96,855 (3.3%) |
Employment Occupations by Sex in Minnesota
Management, Business, Science and Arts Occupations
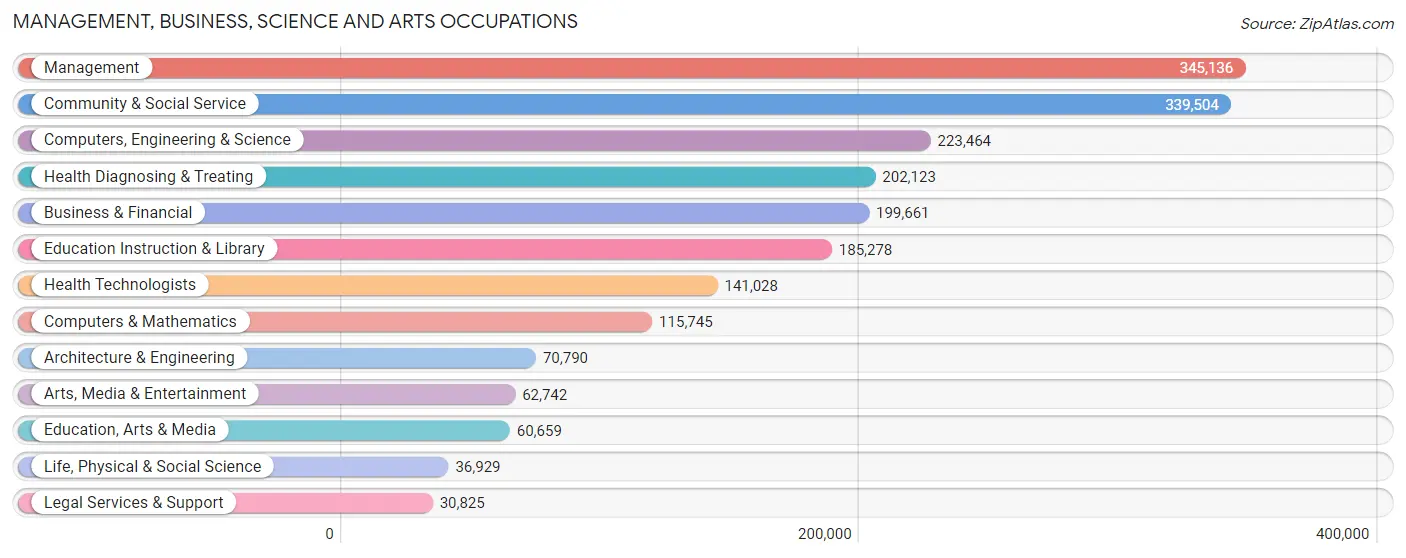
The most common Management, Business, Science and Arts occupations in Minnesota are Management (345,136 | 11.6%), Community & Social Service (339,504 | 11.4%), Computers, Engineering & Science (223,464 | 7.5%), Health Diagnosing & Treating (202,123 | 6.8%), and Business & Financial (199,661 | 6.7%).
Management, Business, Science and Arts Occupations by Sex
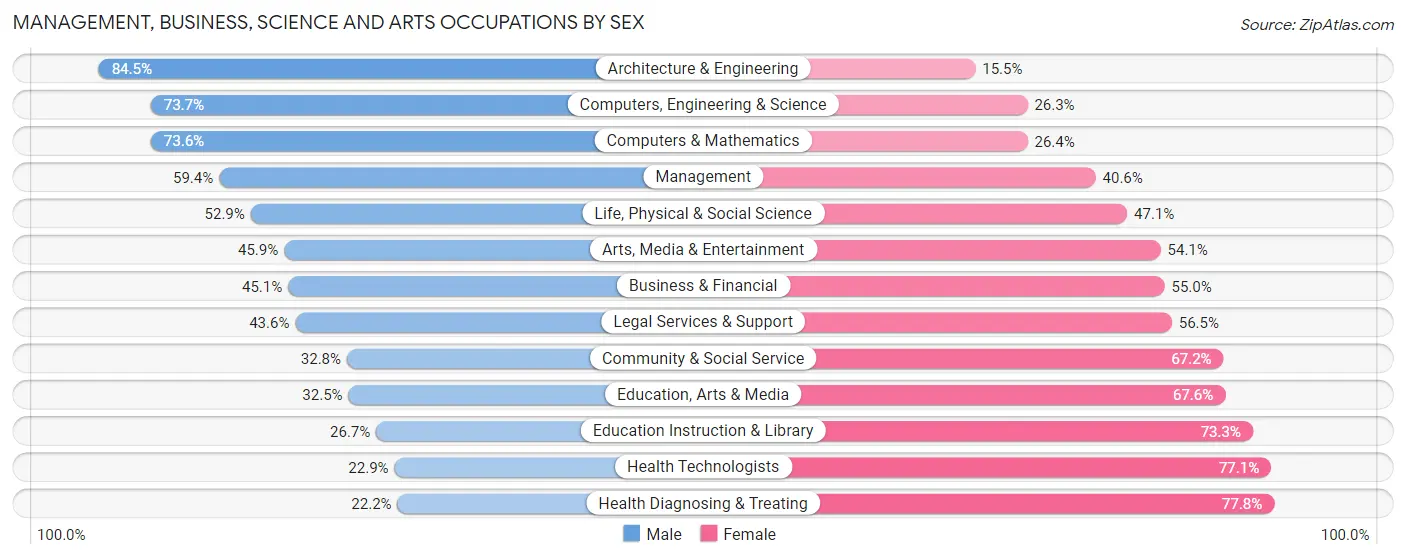
Within the Management, Business, Science and Arts occupations in Minnesota, the most male-oriented occupations are Architecture & Engineering (84.5%), Computers, Engineering & Science (73.7%), and Computers & Mathematics (73.6%), while the most female-oriented occupations are Health Diagnosing & Treating (77.8%), Health Technologists (77.1%), and Education Instruction & Library (73.3%).
| Occupation | Male | Female |
| Management | 205,166 (59.4%) | 139,970 (40.6%) |
| Business & Financial | 89,954 (45.1%) | 109,707 (54.9%) |
| Computers, Engineering & Science | 164,594 (73.7%) | 58,870 (26.3%) |
| Computers & Mathematics | 85,236 (73.6%) | 30,509 (26.4%) |
| Architecture & Engineering | 59,836 (84.5%) | 10,954 (15.5%) |
| Life, Physical & Social Science | 19,522 (52.9%) | 17,407 (47.1%) |
| Community & Social Service | 111,306 (32.8%) | 228,198 (67.2%) |
| Education, Arts & Media | 19,684 (32.5%) | 40,975 (67.5%) |
| Legal Services & Support | 13,424 (43.5%) | 17,401 (56.5%) |
| Education Instruction & Library | 49,410 (26.7%) | 135,868 (73.3%) |
| Arts, Media & Entertainment | 28,788 (45.9%) | 33,954 (54.1%) |
| Health Diagnosing & Treating | 44,925 (22.2%) | 157,198 (77.8%) |
| Health Technologists | 32,232 (22.9%) | 108,796 (77.1%) |
| Total (Category) | 615,945 (47.0%) | 693,943 (53.0%) |
| Total (Overall) | 1,565,541 (52.4%) | 1,423,611 (47.6%) |
Services Occupations
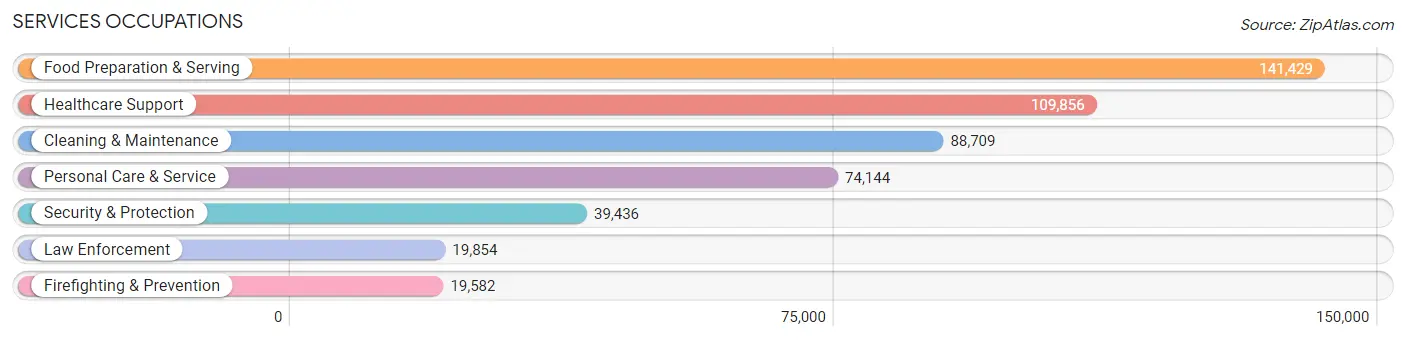
The most common Services occupations in Minnesota are Food Preparation & Serving (141,429 | 4.7%), Healthcare Support (109,856 | 3.7%), Cleaning & Maintenance (88,709 | 3.0%), Personal Care & Service (74,144 | 2.5%), and Security & Protection (39,436 | 1.3%).
Services Occupations by Sex
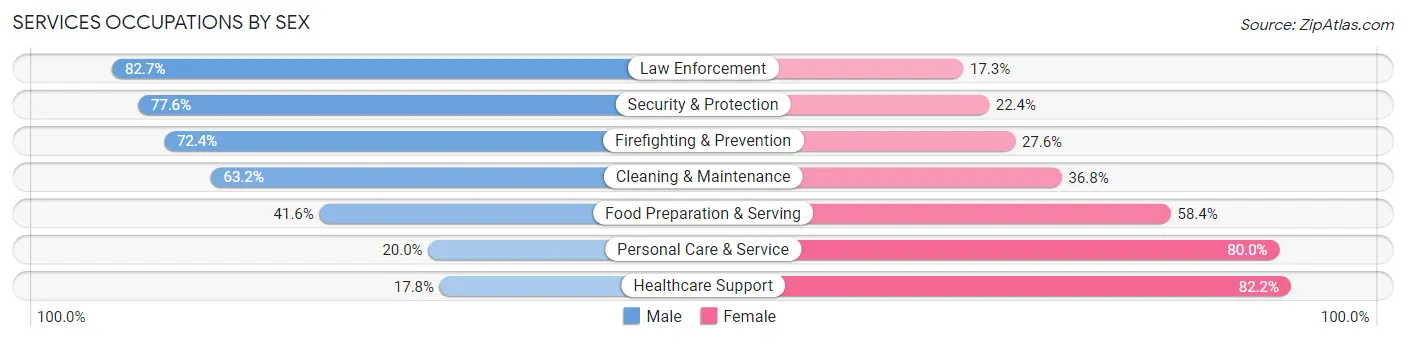
Within the Services occupations in Minnesota, the most male-oriented occupations are Law Enforcement (82.7%), Security & Protection (77.6%), and Firefighting & Prevention (72.4%), while the most female-oriented occupations are Healthcare Support (82.2%), Personal Care & Service (80.0%), and Food Preparation & Serving (58.4%).
| Occupation | Male | Female |
| Healthcare Support | 19,519 (17.8%) | 90,337 (82.2%) |
| Security & Protection | 30,591 (77.6%) | 8,845 (22.4%) |
| Firefighting & Prevention | 14,178 (72.4%) | 5,404 (27.6%) |
| Law Enforcement | 16,413 (82.7%) | 3,441 (17.3%) |
| Food Preparation & Serving | 58,813 (41.6%) | 82,616 (58.4%) |
| Cleaning & Maintenance | 56,050 (63.2%) | 32,659 (36.8%) |
| Personal Care & Service | 14,850 (20.0%) | 59,294 (80.0%) |
| Total (Category) | 179,823 (39.7%) | 273,751 (60.4%) |
| Total (Overall) | 1,565,541 (52.4%) | 1,423,611 (47.6%) |
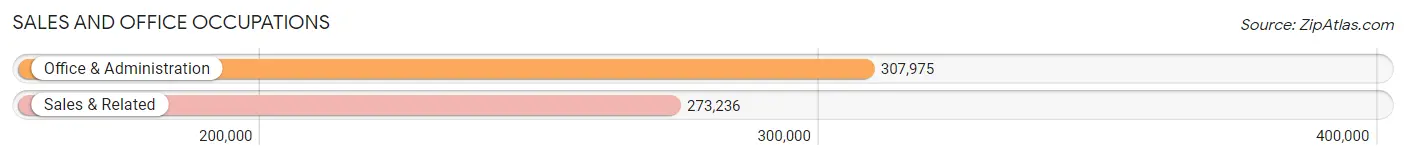
Sales and Office Occupations
The most common Sales and Office occupations in Minnesota are Office & Administration (307,975 | 10.3%), and Sales & Related (273,236 | 9.1%).
Sales and Office Occupations by Sex
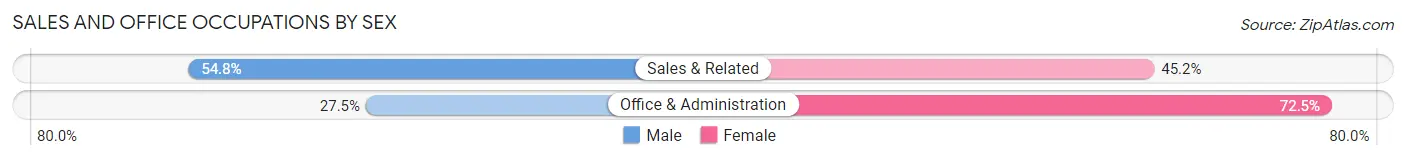
| Occupation | Male | Female |
| Sales & Related | 149,753 (54.8%) | 123,483 (45.2%) |
| Office & Administration | 84,682 (27.5%) | 223,293 (72.5%) |
| Total (Category) | 234,435 (40.3%) | 346,776 (59.7%) |
| Total (Overall) | 1,565,541 (52.4%) | 1,423,611 (47.6%) |
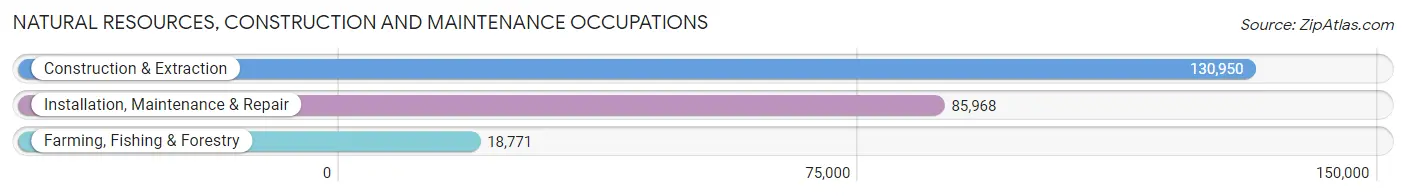
Natural Resources, Construction and Maintenance Occupations
The most common Natural Resources, Construction and Maintenance occupations in Minnesota are Construction & Extraction (130,950 | 4.4%), Installation, Maintenance & Repair (85,968 | 2.9%), and Farming, Fishing & Forestry (18,771 | 0.6%).
Natural Resources, Construction and Maintenance Occupations by Sex
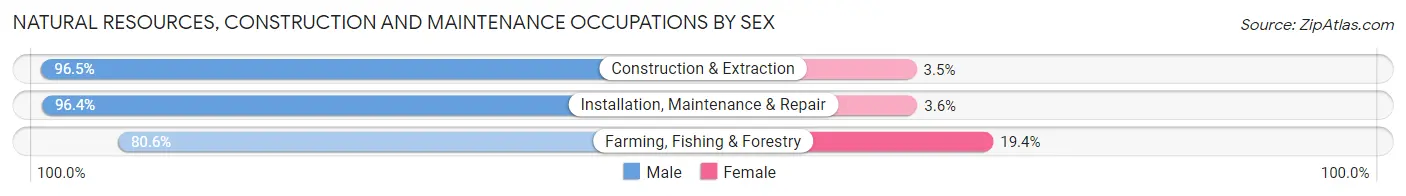
| Occupation | Male | Female |
| Farming, Fishing & Forestry | 15,124 (80.6%) | 3,647 (19.4%) |
| Construction & Extraction | 126,395 (96.5%) | 4,555 (3.5%) |
| Installation, Maintenance & Repair | 82,854 (96.4%) | 3,114 (3.6%) |
| Total (Category) | 224,373 (95.2%) | 11,316 (4.8%) |
| Total (Overall) | 1,565,541 (52.4%) | 1,423,611 (47.6%) |
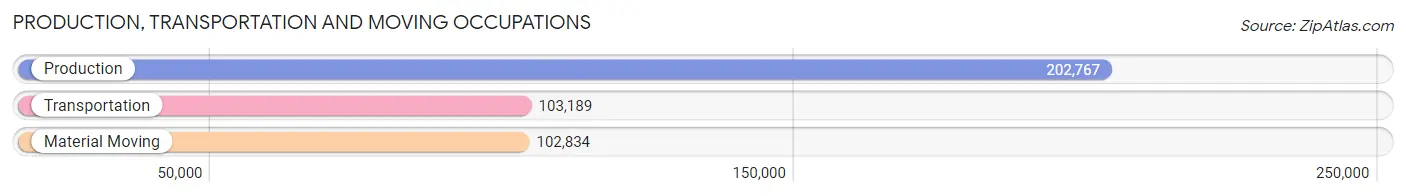
Production, Transportation and Moving Occupations
The most common Production, Transportation and Moving occupations in Minnesota are Production (202,767 | 6.8%), Transportation (103,189 | 3.5%), and Material Moving (102,834 | 3.4%).
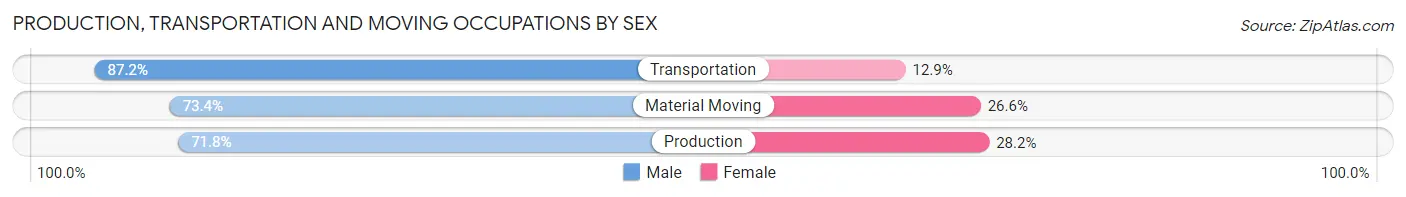
Production, Transportation and Moving Occupations by Sex
| Occupation | Male | Female |
| Production | 145,591 (71.8%) | 57,176 (28.2%) |
| Transportation | 89,933 (87.2%) | 13,256 (12.9%) |
| Material Moving | 75,441 (73.4%) | 27,393 (26.6%) |
| Total (Category) | 310,965 (76.1%) | 97,825 (23.9%) |
| Total (Overall) | 1,565,541 (52.4%) | 1,423,611 (47.6%) |
Employment Industries by Sex in Minnesota
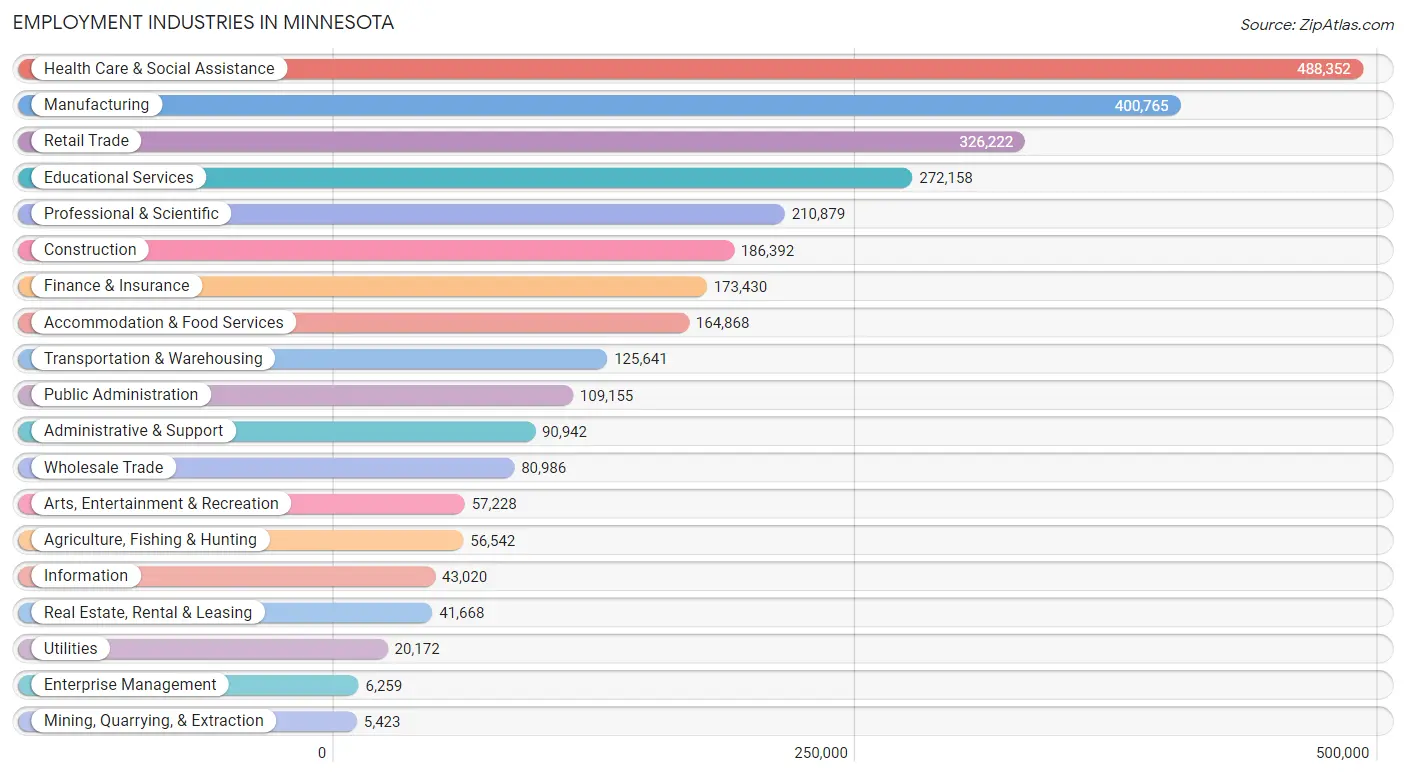
Employment Industries in Minnesota
The major employment industries in Minnesota include Health Care & Social Assistance (488,352 | 16.3%), Manufacturing (400,765 | 13.4%), Retail Trade (326,222 | 10.9%), Educational Services (272,158 | 9.1%), and Professional & Scientific (210,879 | 7.0%).
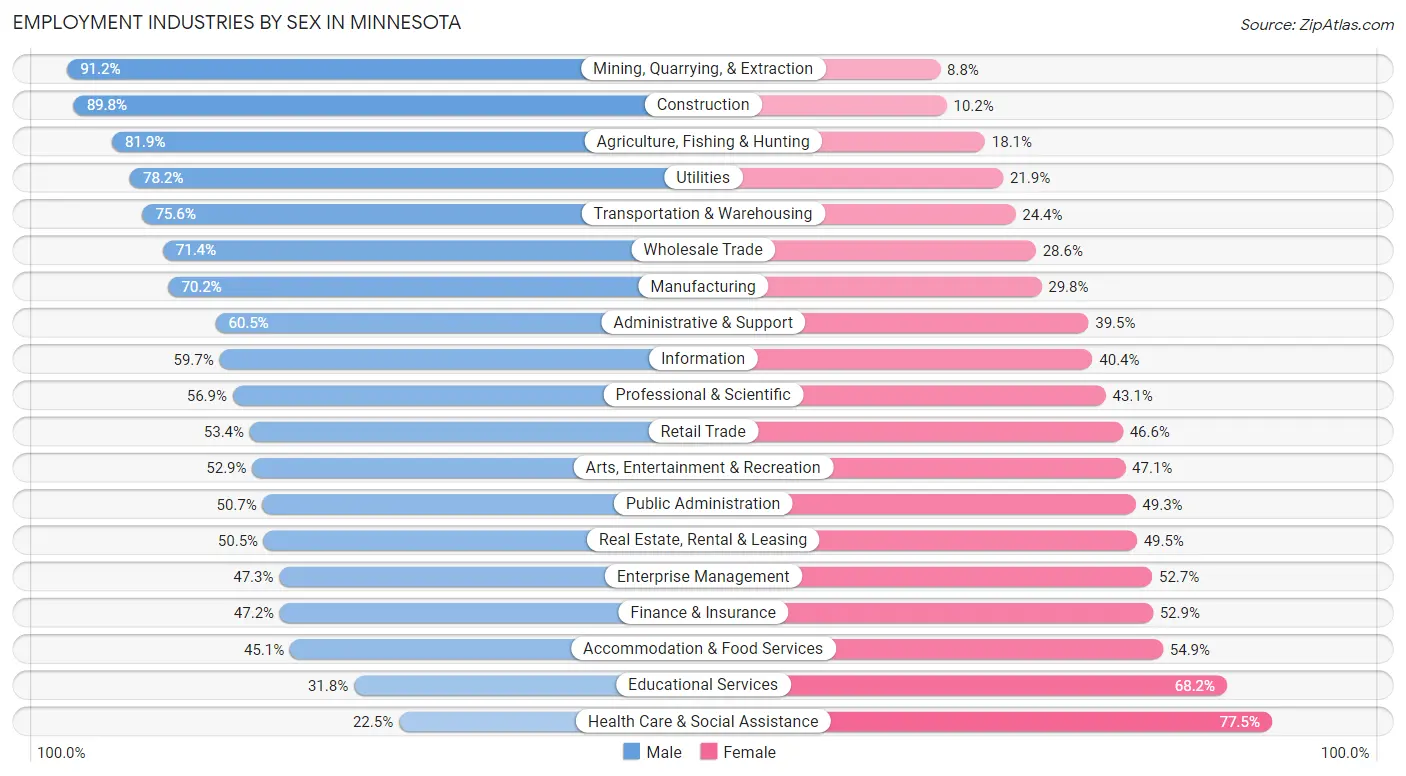
Employment Industries by Sex in Minnesota
The Minnesota industries that see more men than women are Mining, Quarrying, & Extraction (91.2%), Construction (89.8%), and Agriculture, Fishing & Hunting (81.9%), whereas the industries that tend to have a higher number of women are Health Care & Social Assistance (77.5%), Educational Services (68.2%), and Accommodation & Food Services (54.9%).
| Industry | Male | Female |
| Agriculture, Fishing & Hunting | 46,310 (81.9%) | 10,232 (18.1%) |
| Mining, Quarrying, & Extraction | 4,944 (91.2%) | 479 (8.8%) |
| Construction | 167,427 (89.8%) | 18,965 (10.2%) |
| Manufacturing | 281,403 (70.2%) | 119,362 (29.8%) |
| Wholesale Trade | 57,798 (71.4%) | 23,188 (28.6%) |
| Retail Trade | 174,095 (53.4%) | 152,127 (46.6%) |
| Transportation & Warehousing | 94,970 (75.6%) | 30,671 (24.4%) |
| Utilities | 15,765 (78.1%) | 4,407 (21.8%) |
| Information | 25,661 (59.7%) | 17,359 (40.4%) |
| Finance & Insurance | 81,768 (47.1%) | 91,662 (52.8%) |
| Real Estate, Rental & Leasing | 21,029 (50.5%) | 20,639 (49.5%) |
| Professional & Scientific | 119,981 (56.9%) | 90,898 (43.1%) |
| Enterprise Management | 2,960 (47.3%) | 3,299 (52.7%) |
| Administrative & Support | 55,007 (60.5%) | 35,935 (39.5%) |
| Educational Services | 86,590 (31.8%) | 185,568 (68.2%) |
| Health Care & Social Assistance | 109,942 (22.5%) | 378,410 (77.5%) |
| Arts, Entertainment & Recreation | 30,249 (52.9%) | 26,979 (47.1%) |
| Accommodation & Food Services | 74,296 (45.1%) | 90,572 (54.9%) |
| Public Administration | 55,387 (50.7%) | 53,768 (49.3%) |
| Total | 1,565,541 (52.4%) | 1,423,611 (47.6%) |
Education in Minnesota
School Enrollment in Minnesota
The most common levels of schooling among the 1,393,887 students in Minnesota are high school (305,254 | 21.9%), middle school (296,145 | 21.2%), and elementary school (285,473 | 20.5%).
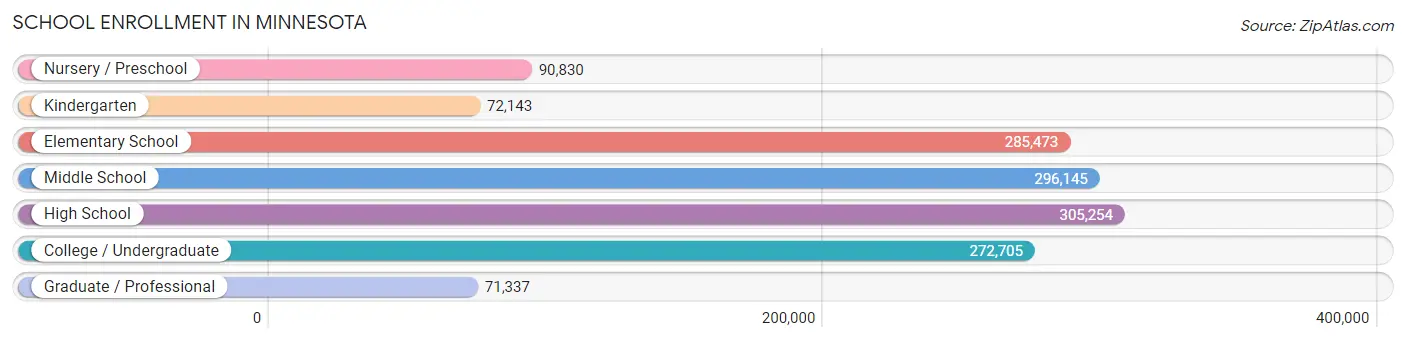
| School Level | # Students | % Students |
| Nursery / Preschool | 90,830 | 6.5% |
| Kindergarten | 72,143 | 5.2% |
| Elementary School | 285,473 | 20.5% |
| Middle School | 296,145 | 21.2% |
| High School | 305,254 | 21.9% |
| College / Undergraduate | 272,705 | 19.6% |
| Graduate / Professional | 71,337 | 5.1% |
| Total | 1,393,887 | 100.0% |
School Enrollment by Age by Funding Source in Minnesota
Out of a total of 1,393,887 students who are enrolled in schools in Minnesota, 218,840 (15.7%) attend a private institution, while the remaining 1,175,047 (84.3%) are enrolled in public schools. The age group of 3 to 4 year olds has the highest likelihood of being enrolled in private schools, with 22,713 (35.8% in the age bracket) enrolled. Conversely, the age group of 15 to 17 year olds has the lowest likelihood of being enrolled in a private school, with 201,704 (91.7% in the age bracket) attending a public institution.
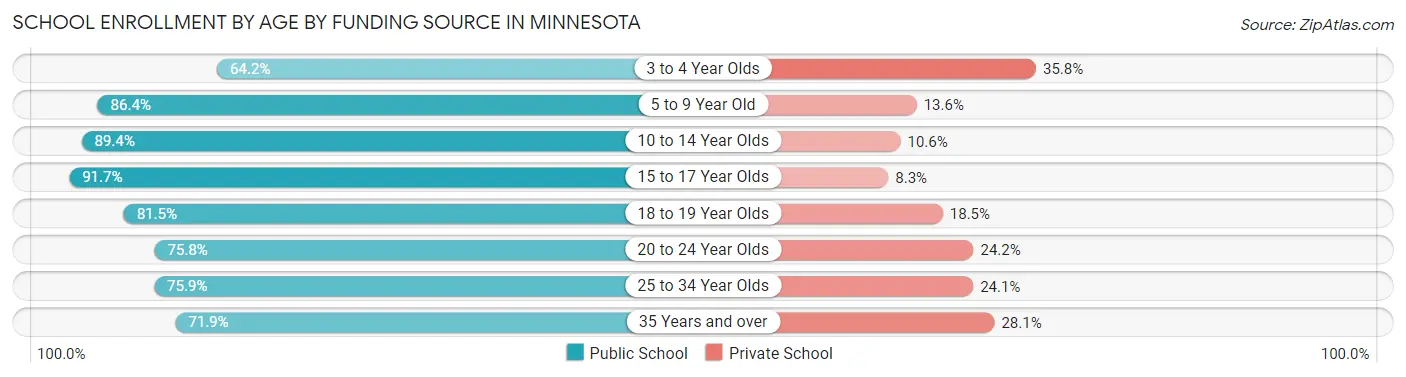
| Age Bracket | Public School | Private School |
| 3 to 4 Year Olds | 40,652 (64.2%) | 22,713 (35.8%) |
| 5 to 9 Year Old | 297,195 (86.4%) | 46,816 (13.6%) |
| 10 to 14 Year Olds | 328,089 (89.4%) | 38,901 (10.6%) |
| 15 to 17 Year Olds | 201,704 (91.7%) | 18,298 (8.3%) |
| 18 to 19 Year Olds | 93,290 (81.5%) | 21,138 (18.5%) |
| 20 to 24 Year Olds | 109,207 (75.8%) | 34,839 (24.2%) |
| 25 to 34 Year Olds | 59,000 (75.9%) | 18,769 (24.1%) |
| 35 Years and over | 45,503 (71.9%) | 17,773 (28.1%) |
| Total | 1,175,047 (84.3%) | 218,840 (15.7%) |
Educational Attainment by Field of Study in Minnesota
Business (309,775 | 18.9%), education (202,717 | 12.4%), science & technology (160,901 | 9.8%), social sciences (132,727 | 8.1%), and bio, nature & agricultural (117,563 | 7.2%) are the most common fields of study among 1,640,588 individuals in Minnesota who have obtained a bachelor's degree or higher.
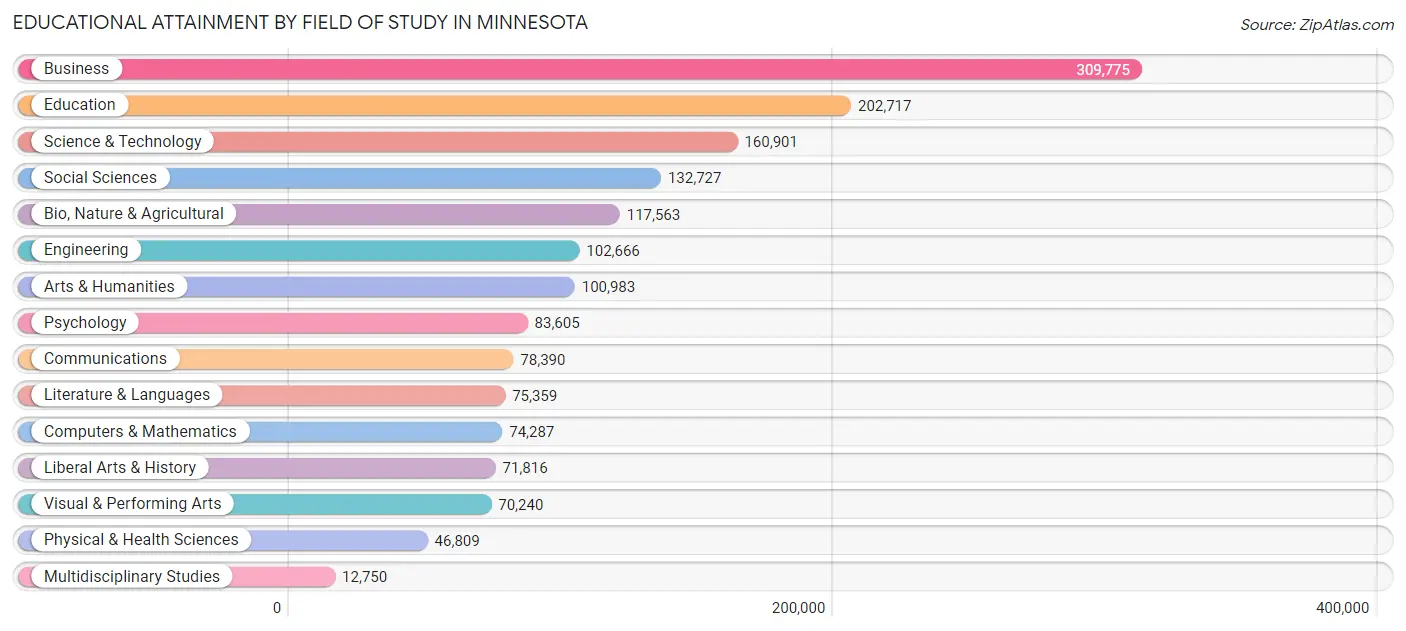
| Field of Study | # Graduates | % Graduates |
| Computers & Mathematics | 74,287 | 4.5% |
| Bio, Nature & Agricultural | 117,563 | 7.2% |
| Physical & Health Sciences | 46,809 | 2.9% |
| Psychology | 83,605 | 5.1% |
| Social Sciences | 132,727 | 8.1% |
| Engineering | 102,666 | 6.3% |
| Multidisciplinary Studies | 12,750 | 0.8% |
| Science & Technology | 160,901 | 9.8% |
| Business | 309,775 | 18.9% |
| Education | 202,717 | 12.4% |
| Literature & Languages | 75,359 | 4.6% |
| Liberal Arts & History | 71,816 | 4.4% |
| Visual & Performing Arts | 70,240 | 4.3% |
| Communications | 78,390 | 4.8% |
| Arts & Humanities | 100,983 | 6.2% |
| Total | 1,640,588 | 100.0% |
Transportation & Commute in Minnesota
Vehicle Availability by Sex in Minnesota
The most prevalent vehicle ownership categories in Minnesota are males with 2 vehicles (666,683, accounting for 43.6%) and females with 2 vehicles (585,810, making up 48.5%).
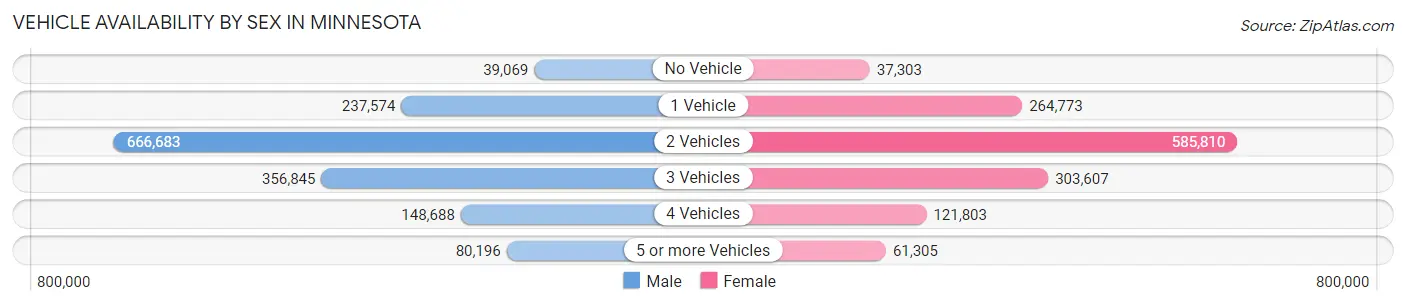
| Vehicles Available | Male | Female |
| No Vehicle | 39,069 (2.6%) | 37,303 (2.7%) |
| 1 Vehicle | 237,574 (15.5%) | 264,773 (19.3%) |
| 2 Vehicles | 666,683 (43.6%) | 585,810 (42.6%) |
| 3 Vehicles | 356,845 (23.3%) | 303,607 (22.1%) |
| 4 Vehicles | 148,688 (9.7%) | 121,803 (8.9%) |
| 5 or more Vehicles | 80,196 (5.2%) | 61,305 (4.5%) |
| Total | 1,529,055 (100.0%) | 1,374,601 (100.0%) |
Commute Time in Minnesota
The most frequently occuring commute durations in Minnesota are 15 to 19 minutes (402,861 commuters, 15.9%), 10 to 14 minutes (380,933 commuters, 15.0%), and 20 to 24 minutes (372,524 commuters, 14.7%).
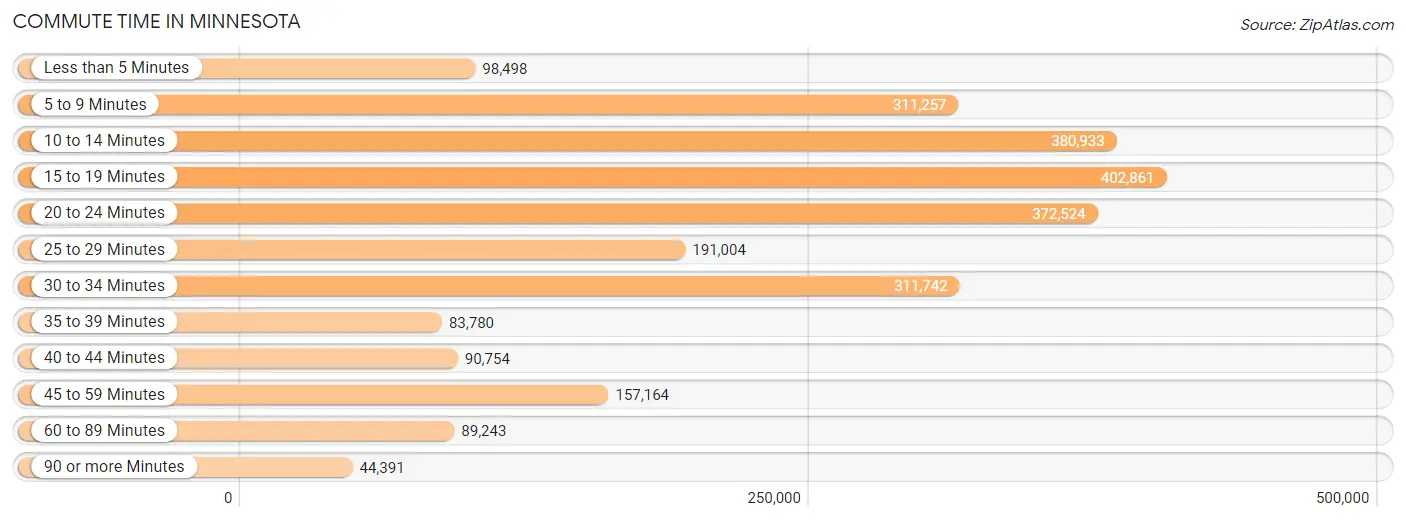
| Commute Time | # Commuters | % Commuters |
| Less than 5 Minutes | 98,498 | 3.9% |
| 5 to 9 Minutes | 311,257 | 12.3% |
| 10 to 14 Minutes | 380,933 | 15.0% |
| 15 to 19 Minutes | 402,861 | 15.9% |
| 20 to 24 Minutes | 372,524 | 14.7% |
| 25 to 29 Minutes | 191,004 | 7.5% |
| 30 to 34 Minutes | 311,742 | 12.3% |
| 35 to 39 Minutes | 83,780 | 3.3% |
| 40 to 44 Minutes | 90,754 | 3.6% |
| 45 to 59 Minutes | 157,164 | 6.2% |
| 60 to 89 Minutes | 89,243 | 3.5% |
| 90 or more Minutes | 44,391 | 1.8% |
Commute Time by Sex in Minnesota
The most common commute times in Minnesota are 15 to 19 minutes (206,237 commuters, 15.3%) for males and 15 to 19 minutes (196,624 commuters, 16.6%) for females.
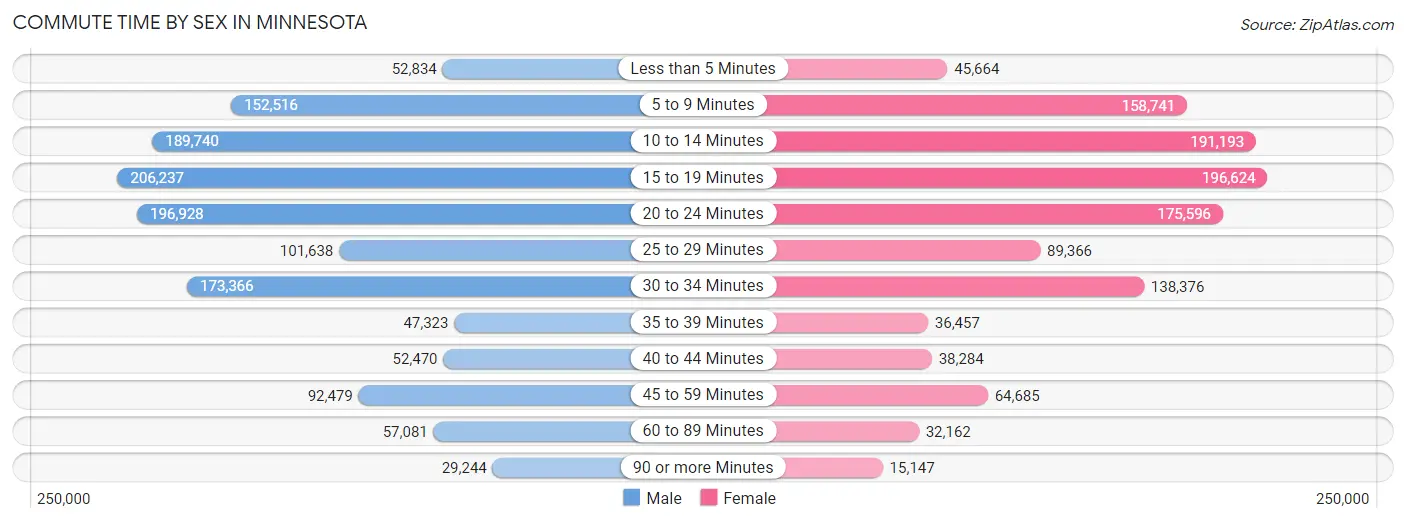
| Commute Time | Male | Female |
| Less than 5 Minutes | 52,834 (3.9%) | 45,664 (3.9%) |
| 5 to 9 Minutes | 152,516 (11.3%) | 158,741 (13.4%) |
| 10 to 14 Minutes | 189,740 (14.0%) | 191,193 (16.2%) |
| 15 to 19 Minutes | 206,237 (15.3%) | 196,624 (16.6%) |
| 20 to 24 Minutes | 196,928 (14.6%) | 175,596 (14.8%) |
| 25 to 29 Minutes | 101,638 (7.5%) | 89,366 (7.6%) |
| 30 to 34 Minutes | 173,366 (12.8%) | 138,376 (11.7%) |
| 35 to 39 Minutes | 47,323 (3.5%) | 36,457 (3.1%) |
| 40 to 44 Minutes | 52,470 (3.9%) | 38,284 (3.2%) |
| 45 to 59 Minutes | 92,479 (6.8%) | 64,685 (5.5%) |
| 60 to 89 Minutes | 57,081 (4.2%) | 32,162 (2.7%) |
| 90 or more Minutes | 29,244 (2.2%) | 15,147 (1.3%) |
Time of Departure to Work by Sex in Minnesota
The most frequent times of departure to work in Minnesota are 7:00 AM to 7:29 AM (191,094, 14.1%) for males and 7:00 AM to 7:29 AM (190,139, 16.1%) for females.
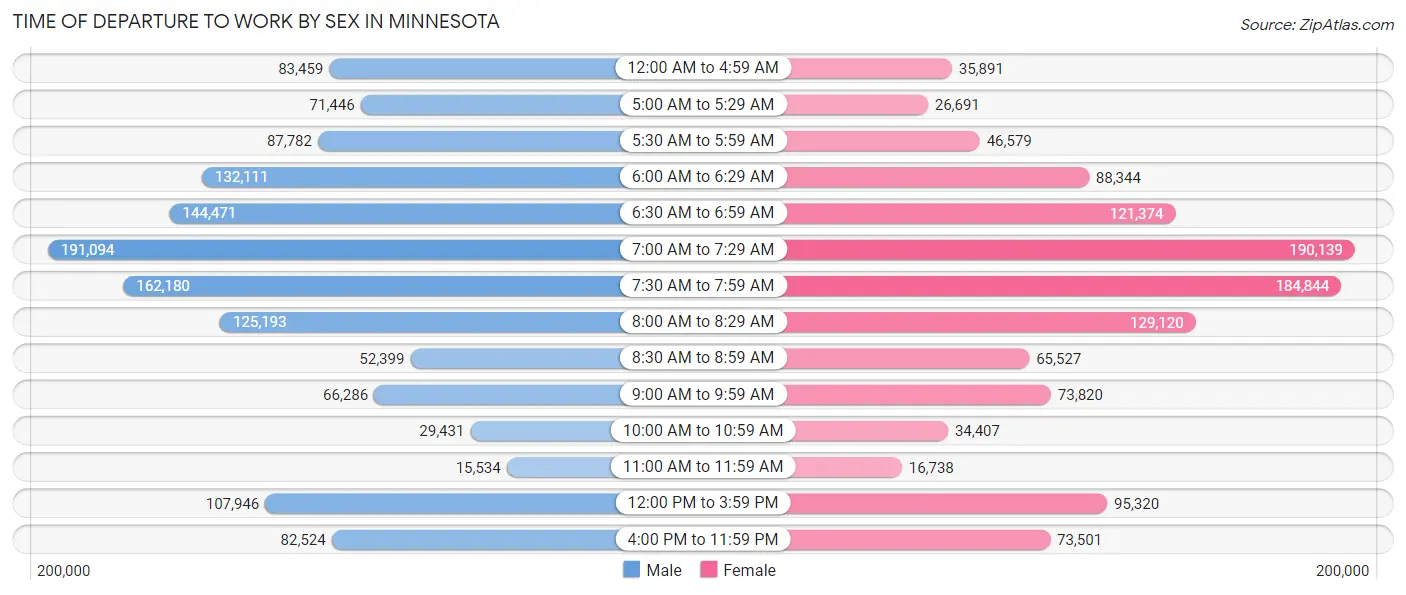
| Time of Departure | Male | Female |
| 12:00 AM to 4:59 AM | 83,459 (6.2%) | 35,891 (3.0%) |
| 5:00 AM to 5:29 AM | 71,446 (5.3%) | 26,691 (2.3%) |
| 5:30 AM to 5:59 AM | 87,782 (6.5%) | 46,579 (3.9%) |
| 6:00 AM to 6:29 AM | 132,111 (9.8%) | 88,344 (7.5%) |
| 6:30 AM to 6:59 AM | 144,471 (10.7%) | 121,374 (10.3%) |
| 7:00 AM to 7:29 AM | 191,094 (14.1%) | 190,139 (16.1%) |
| 7:30 AM to 7:59 AM | 162,180 (12.0%) | 184,844 (15.6%) |
| 8:00 AM to 8:29 AM | 125,193 (9.3%) | 129,120 (10.9%) |
| 8:30 AM to 8:59 AM | 52,399 (3.9%) | 65,527 (5.5%) |
| 9:00 AM to 9:59 AM | 66,286 (4.9%) | 73,820 (6.2%) |
| 10:00 AM to 10:59 AM | 29,431 (2.2%) | 34,407 (2.9%) |
| 11:00 AM to 11:59 AM | 15,534 (1.1%) | 16,738 (1.4%) |
| 12:00 PM to 3:59 PM | 107,946 (8.0%) | 95,320 (8.1%) |
| 4:00 PM to 11:59 PM | 82,524 (6.1%) | 73,501 (6.2%) |
| Total | 1,351,856 (100.0%) | 1,182,295 (100.0%) |
Housing Occupancy in Minnesota
Occupancy by Ownership in Minnesota
Of the total 2,256,126 dwellings in Minnesota, owner-occupied units account for 1,631,701 (72.3%), while renter-occupied units make up 624,425 (27.7%).
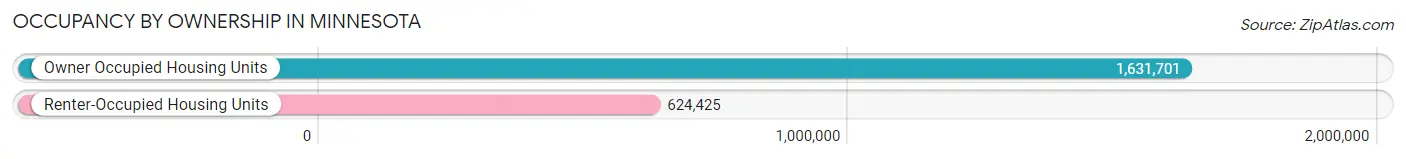
| Occupancy | # Housing Units | % Housing Units |
| Owner Occupied Housing Units | 1,631,701 | 72.3% |
| Renter-Occupied Housing Units | 624,425 | 27.7% |
| Total Occupied Housing Units | 2,256,126 | 100.0% |
Occupancy by Household Size in Minnesota
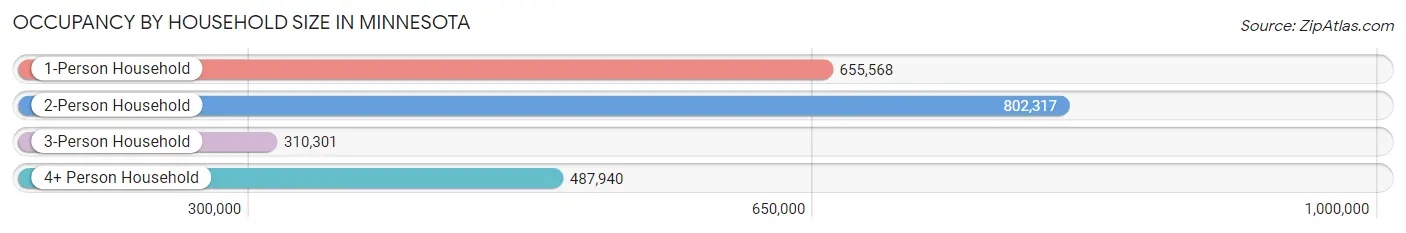
| Household Size | # Housing Units | % Housing Units |
| 1-Person Household | 655,568 | 29.1% |
| 2-Person Household | 802,317 | 35.6% |
| 3-Person Household | 310,301 | 13.8% |
| 4+ Person Household | 487,940 | 21.6% |
| Total Housing Units | 2,256,126 | 100.0% |
Occupancy by Ownership by Household Size in Minnesota
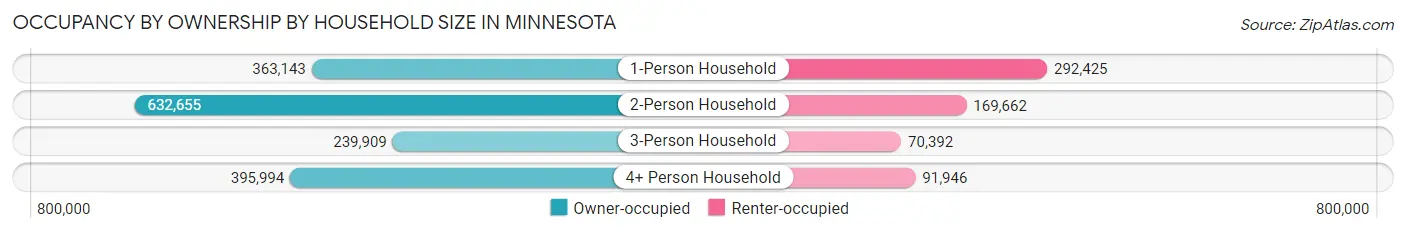
| Household Size | Owner-occupied | Renter-occupied |
| 1-Person Household | 363,143 (55.4%) | 292,425 (44.6%) |
| 2-Person Household | 632,655 (78.8%) | 169,662 (21.1%) |
| 3-Person Household | 239,909 (77.3%) | 70,392 (22.7%) |
| 4+ Person Household | 395,994 (81.2%) | 91,946 (18.8%) |
| Total Housing Units | 1,631,701 (72.3%) | 624,425 (27.7%) |
Occupancy by Educational Attainment in Minnesota
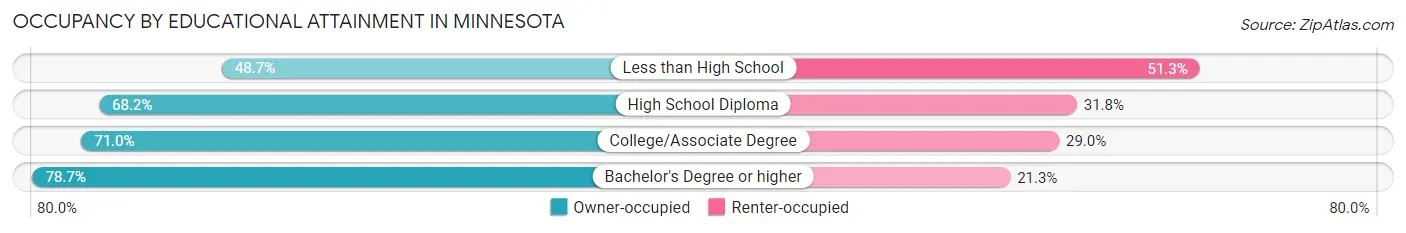
| Household Size | Owner-occupied | Renter-occupied |
| Less than High School | 57,930 (48.7%) | 60,983 (51.3%) |
| High School Diploma | 329,575 (68.2%) | 153,846 (31.8%) |
| College/Associate Degree | 531,846 (71.0%) | 217,215 (29.0%) |
| Bachelor's Degree or higher | 712,350 (78.7%) | 192,381 (21.3%) |
Occupancy by Age of Householder in Minnesota
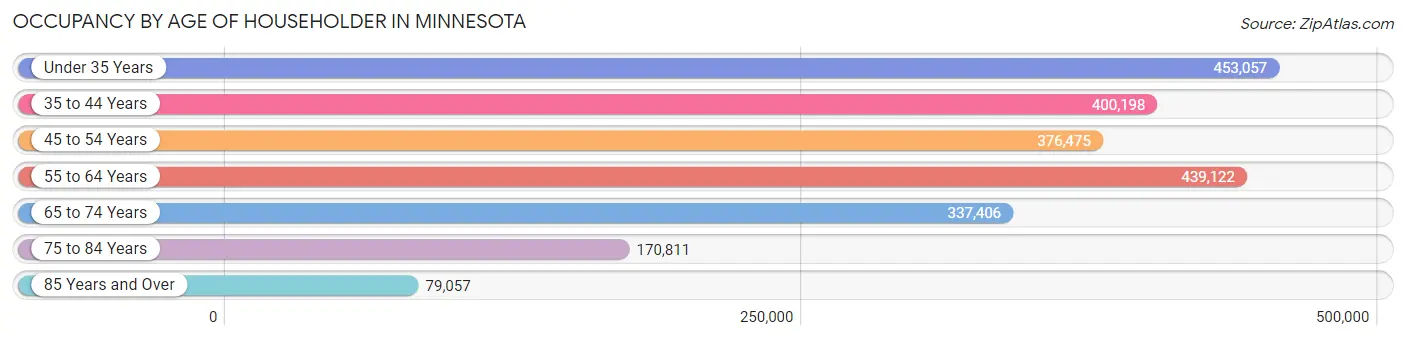
| Age Bracket | # Households | % Households |
| Under 35 Years | 453,057 | 20.1% |
| 35 to 44 Years | 400,198 | 17.7% |
| 45 to 54 Years | 376,475 | 16.7% |
| 55 to 64 Years | 439,122 | 19.5% |
| 65 to 74 Years | 337,406 | 15.0% |
| 75 to 84 Years | 170,811 | 7.6% |
| 85 Years and Over | 79,057 | 3.5% |
| Total | 2,256,126 | 100.0% |
Housing Finances in Minnesota
Median Income by Occupancy in Minnesota
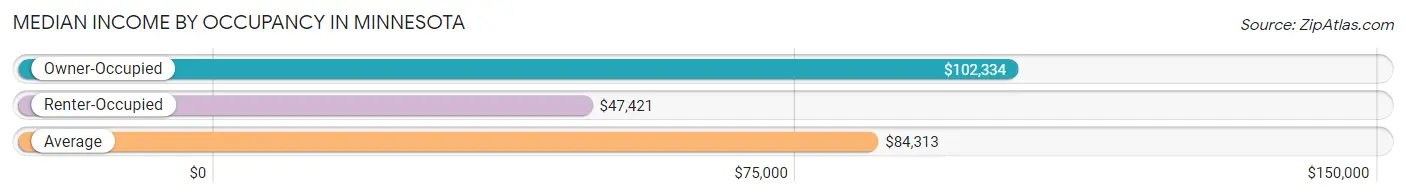
| Occupancy Type | # Households | Median Income |
| Owner-Occupied | 1,631,701 (72.3%) | $102,334 |
| Renter-Occupied | 624,425 (27.7%) | $47,421 |
| Average | 2,256,126 (100.0%) | $84,313 |
Occupancy by Householder Income Bracket in Minnesota
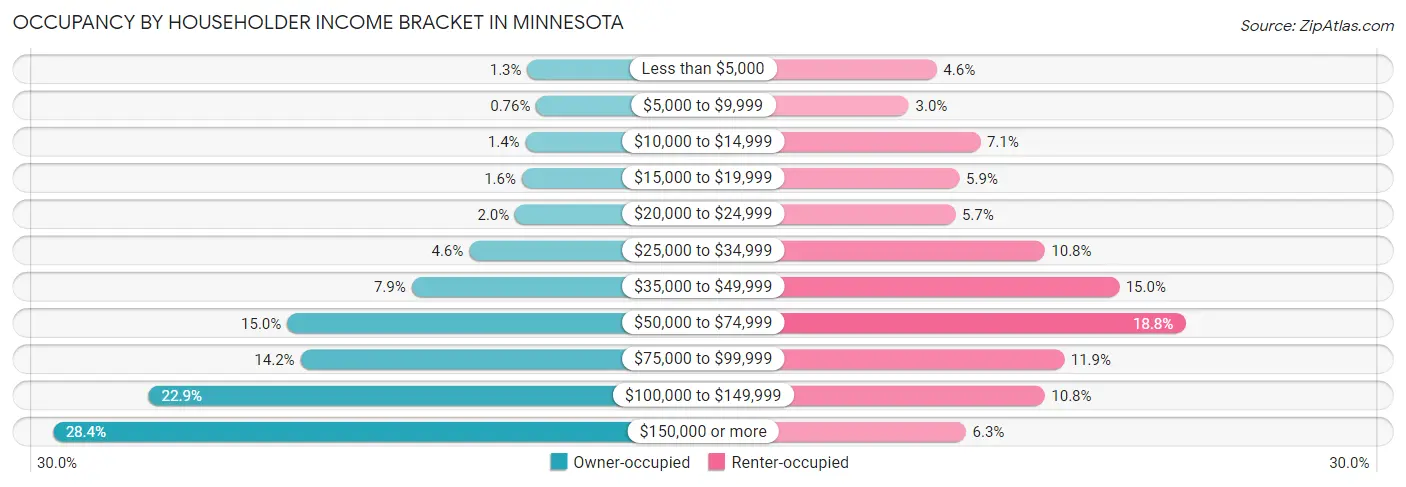
| Income Bracket | Owner-occupied | Renter-occupied |
| Less than $5,000 | 20,741 (1.3%) | 28,828 (4.6%) |
| $5,000 to $9,999 | 12,359 (0.8%) | 18,936 (3.0%) |
| $10,000 to $14,999 | 22,576 (1.4%) | 44,404 (7.1%) |
| $15,000 to $19,999 | 25,913 (1.6%) | 36,964 (5.9%) |
| $20,000 to $24,999 | 32,206 (2.0%) | 35,461 (5.7%) |
| $25,000 to $34,999 | 75,007 (4.6%) | 67,359 (10.8%) |
| $35,000 to $49,999 | 128,693 (7.9%) | 93,921 (15.0%) |
| $50,000 to $74,999 | 244,818 (15.0%) | 117,572 (18.8%) |
| $75,000 to $99,999 | 232,367 (14.2%) | 74,286 (11.9%) |
| $100,000 to $149,999 | 373,812 (22.9%) | 67,392 (10.8%) |
| $150,000 or more | 463,209 (28.4%) | 39,302 (6.3%) |
| Total | 1,631,701 (100.0%) | 624,425 (100.0%) |
Monthly Housing Cost Tiers in Minnesota
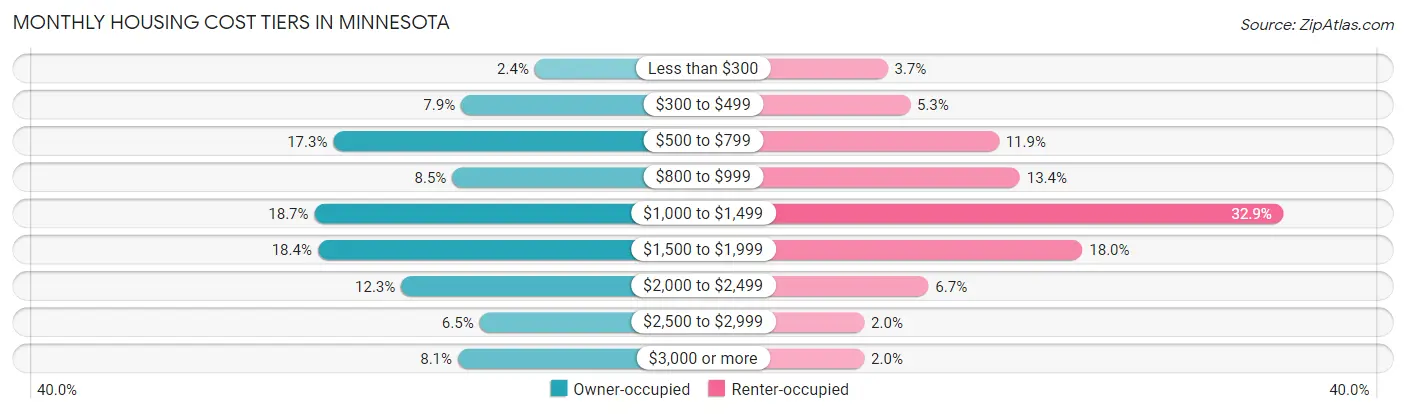
| Monthly Cost | Owner-occupied | Renter-occupied |
| Less than $300 | 39,631 (2.4%) | 23,054 (3.7%) |
| $300 to $499 | 128,283 (7.9%) | 33,355 (5.3%) |
| $500 to $799 | 281,736 (17.3%) | 74,172 (11.9%) |
| $800 to $999 | 138,814 (8.5%) | 83,842 (13.4%) |
| $1,000 to $1,499 | 304,432 (18.7%) | 205,198 (32.9%) |
| $1,500 to $1,999 | 300,477 (18.4%) | 112,653 (18.0%) |
| $2,000 to $2,499 | 200,201 (12.3%) | 41,849 (6.7%) |
| $2,500 to $2,999 | 106,060 (6.5%) | 12,332 (2.0%) |
| $3,000 or more | 132,067 (8.1%) | 12,272 (2.0%) |
| Total | 1,631,701 (100.0%) | 624,425 (100.0%) |
Physical Housing Characteristics in Minnesota
Housing Structures in Minnesota
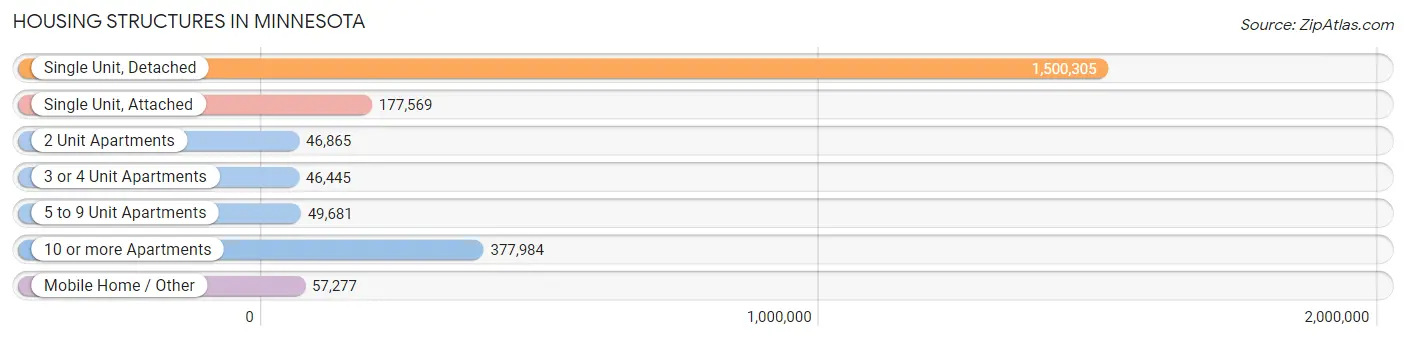
| Structure Type | # Housing Units | % Housing Units |
| Single Unit, Detached | 1,500,305 | 66.5% |
| Single Unit, Attached | 177,569 | 7.9% |
| 2 Unit Apartments | 46,865 | 2.1% |
| 3 or 4 Unit Apartments | 46,445 | 2.1% |
| 5 to 9 Unit Apartments | 49,681 | 2.2% |
| 10 or more Apartments | 377,984 | 16.8% |
| Mobile Home / Other | 57,277 | 2.5% |
| Total | 2,256,126 | 100.0% |
Housing Structures by Occupancy in Minnesota
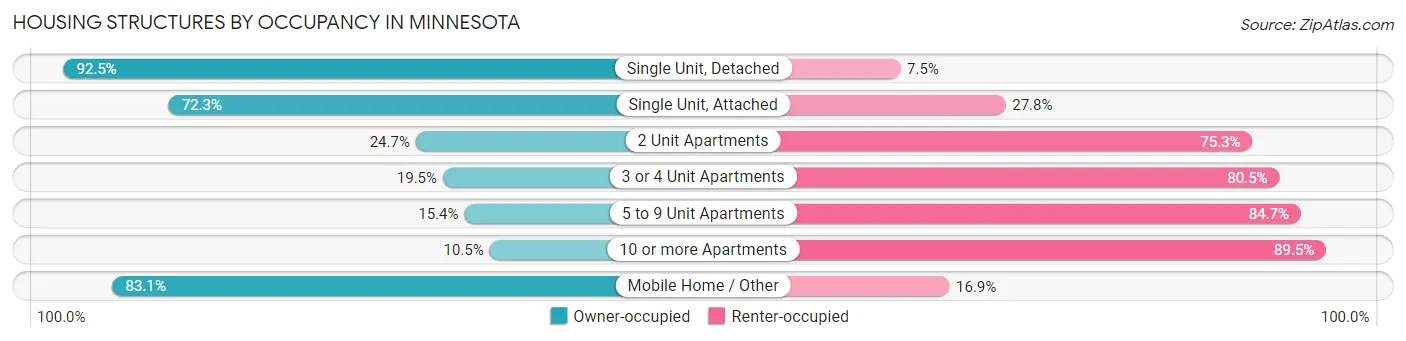
| Structure Type | Owner-occupied | Renter-occupied |
| Single Unit, Detached | 1,387,971 (92.5%) | 112,334 (7.5%) |
| Single Unit, Attached | 128,292 (72.3%) | 49,277 (27.8%) |
| 2 Unit Apartments | 11,571 (24.7%) | 35,294 (75.3%) |
| 3 or 4 Unit Apartments | 9,042 (19.5%) | 37,403 (80.5%) |
| 5 to 9 Unit Apartments | 7,624 (15.3%) | 42,057 (84.7%) |
| 10 or more Apartments | 39,620 (10.5%) | 338,364 (89.5%) |
| Mobile Home / Other | 47,581 (83.1%) | 9,696 (16.9%) |
| Total | 1,631,701 (72.3%) | 624,425 (27.7%) |
Housing Structures by Number of Rooms in Minnesota
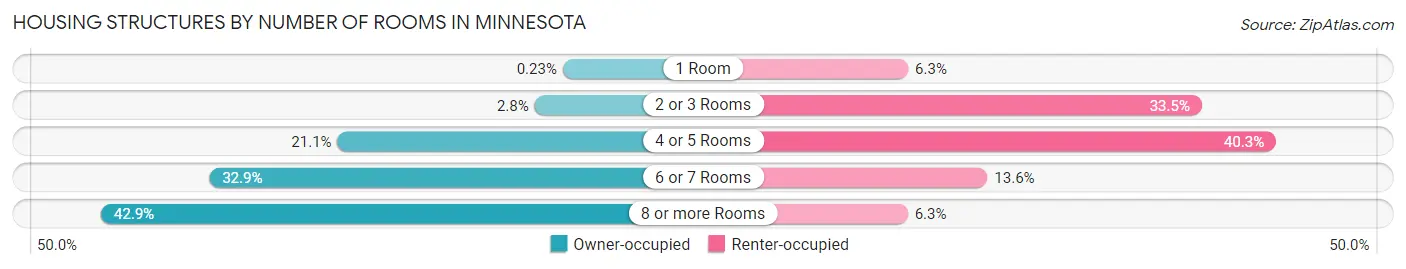
| Number of Rooms | Owner-occupied | Renter-occupied |
| 1 Room | 3,685 (0.2%) | 39,399 (6.3%) |
| 2 or 3 Rooms | 46,318 (2.8%) | 208,902 (33.5%) |
| 4 or 5 Rooms | 343,857 (21.1%) | 251,804 (40.3%) |
| 6 or 7 Rooms | 537,217 (32.9%) | 85,147 (13.6%) |
| 8 or more Rooms | 700,624 (42.9%) | 39,173 (6.3%) |
| Total | 1,631,701 (100.0%) | 624,425 (100.0%) |
Housing Structure by Heating Type in Minnesota
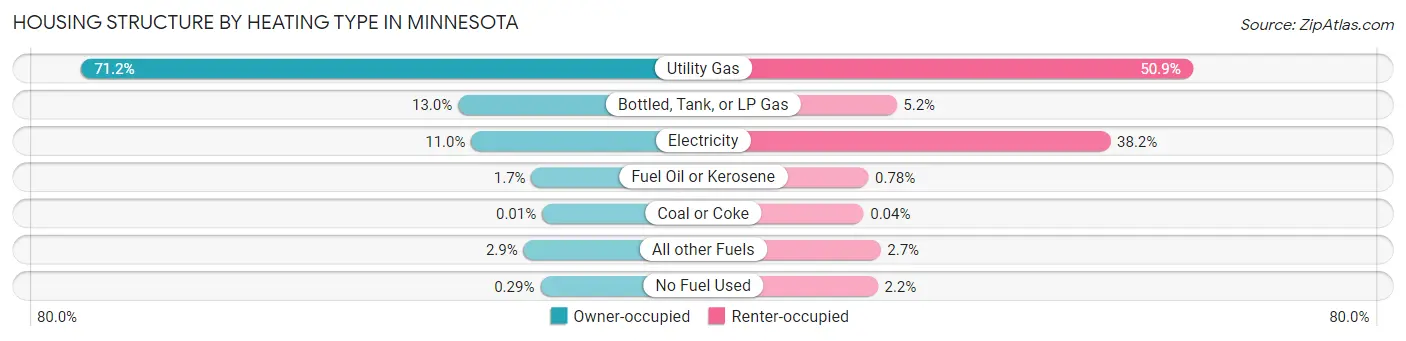
| Heating Type | Owner-occupied | Renter-occupied |
| Utility Gas | 1,162,379 (71.2%) | 317,947 (50.9%) |
| Bottled, Tank, or LP Gas | 212,047 (13.0%) | 32,188 (5.1%) |
| Electricity | 178,746 (11.0%) | 238,474 (38.2%) |
| Fuel Oil or Kerosene | 26,884 (1.7%) | 4,884 (0.8%) |
| Coal or Coke | 156 (0.0%) | 236 (0.0%) |
| All other Fuels | 46,752 (2.9%) | 16,724 (2.7%) |
| No Fuel Used | 4,737 (0.3%) | 13,972 (2.2%) |
| Total | 1,631,701 (100.0%) | 624,425 (100.0%) |
Household Vehicle Usage in Minnesota
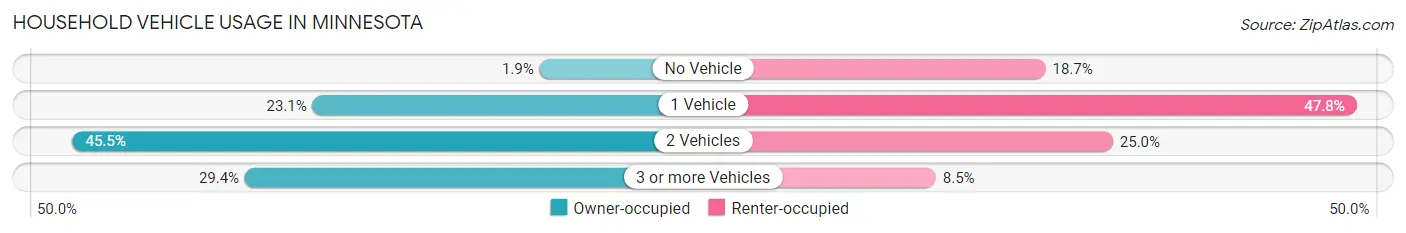
| Vehicles per Household | Owner-occupied | Renter-occupied |
| No Vehicle | 31,504 (1.9%) | 116,959 (18.7%) |
| 1 Vehicle | 377,205 (23.1%) | 298,240 (47.8%) |
| 2 Vehicles | 742,738 (45.5%) | 156,188 (25.0%) |
| 3 or more Vehicles | 480,254 (29.4%) | 53,038 (8.5%) |
| Total | 1,631,701 (100.0%) | 624,425 (100.0%) |
Real Estate & Mortgages in Minnesota
Real Estate and Mortgage Overview in Minnesota
| Characteristic | Without Mortgage | With Mortgage |
| Housing Units | 570,840 | 1,060,861 |
| Median Property Value | $261,700 | $298,700 |
| Median Household Income | $75,262 | $357,010 |
| Monthly Housing Costs | $639 | $129,093 |
| Real Estate Taxes | $2,813 | $16,204 |
Property Value by Mortgage Status in Minnesota
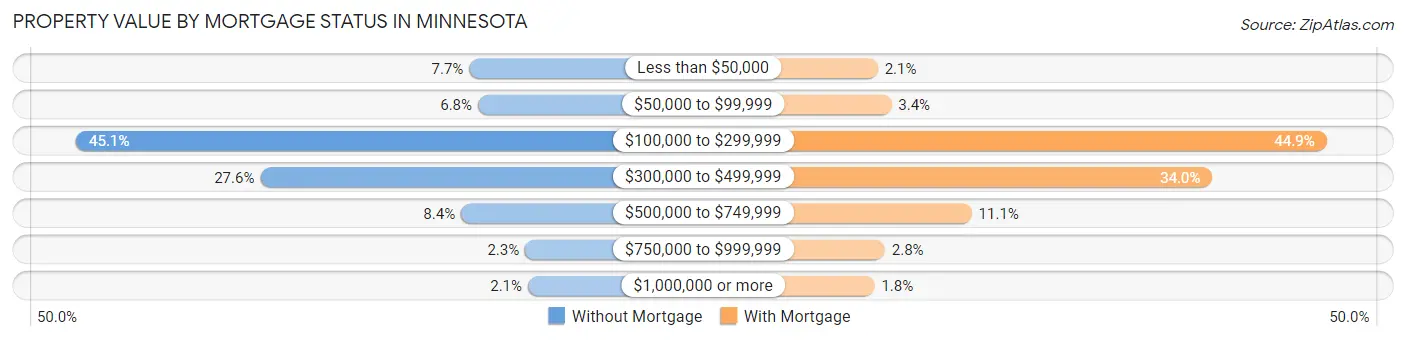
| Property Value | Without Mortgage | With Mortgage |
| Less than $50,000 | 43,753 (7.7%) | 22,334 (2.1%) |
| $50,000 to $99,999 | 38,984 (6.8%) | 36,123 (3.4%) |
| $100,000 to $299,999 | 257,401 (45.1%) | 475,955 (44.9%) |
| $300,000 to $499,999 | 157,344 (27.6%) | 360,423 (34.0%) |
| $500,000 to $749,999 | 48,163 (8.4%) | 117,372 (11.1%) |
| $750,000 to $999,999 | 13,366 (2.3%) | 29,553 (2.8%) |
| $1,000,000 or more | 11,829 (2.1%) | 19,101 (1.8%) |
| Total | 570,840 (100.0%) | 1,060,861 (100.0%) |
Household Income by Mortgage Status in Minnesota
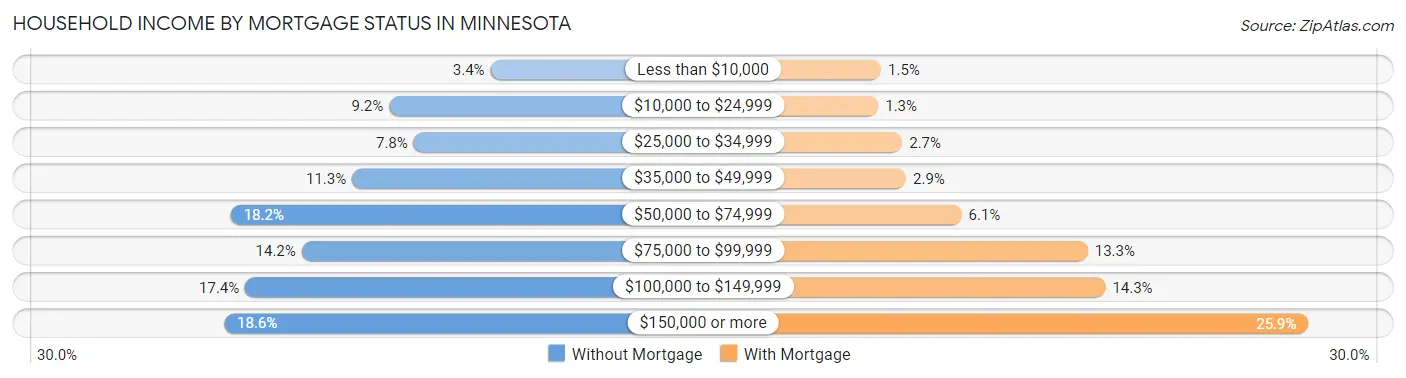
| Household Income | Without Mortgage | With Mortgage |
| Less than $10,000 | 19,313 (3.4%) | 15,513 (1.5%) |
| $10,000 to $24,999 | 52,324 (9.2%) | 13,787 (1.3%) |
| $25,000 to $34,999 | 44,373 (7.8%) | 28,371 (2.7%) |
| $35,000 to $49,999 | 64,433 (11.3%) | 30,634 (2.9%) |
| $50,000 to $74,999 | 103,998 (18.2%) | 64,260 (6.1%) |
| $75,000 to $99,999 | 80,885 (14.2%) | 140,820 (13.3%) |
| $100,000 to $149,999 | 99,315 (17.4%) | 151,482 (14.3%) |
| $150,000 or more | 106,199 (18.6%) | 274,497 (25.9%) |
| Total | 570,840 (100.0%) | 1,060,861 (100.0%) |
Property Value to Household Income Ratio in Minnesota
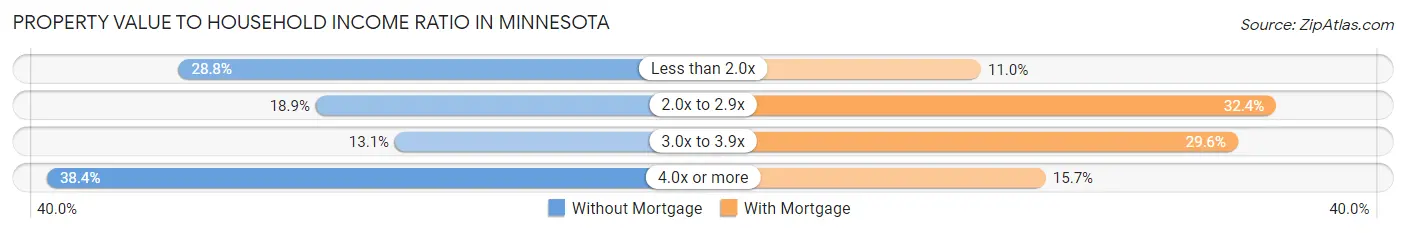
| Value-to-Income Ratio | Without Mortgage | With Mortgage |
| Less than 2.0x | 164,439 (28.8%) | 116,495 (11.0%) |
| 2.0x to 2.9x | 107,617 (18.9%) | 343,840 (32.4%) |
| 3.0x to 3.9x | 74,798 (13.1%) | 314,289 (29.6%) |
| 4.0x or more | 219,059 (38.4%) | 166,416 (15.7%) |
| Total | 570,840 (100.0%) | 1,060,861 (100.0%) |
Real Estate Taxes by Mortgage Status in Minnesota
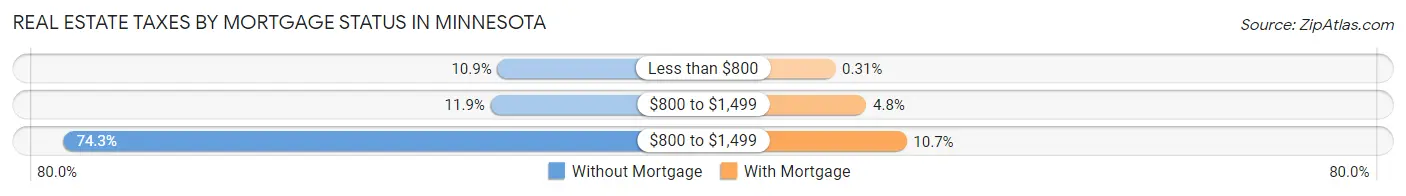
| Property Taxes | Without Mortgage | With Mortgage |
| Less than $800 | 62,216 (10.9%) | 3,286 (0.3%) |
| $800 to $1,499 | 67,951 (11.9%) | 51,223 (4.8%) |
| $800 to $1,499 | 424,106 (74.3%) | 113,691 (10.7%) |
| Total | 570,840 (100.0%) | 1,060,861 (100.0%) |
Health & Disability in Minnesota
Health Insurance Coverage by Age in Minnesota
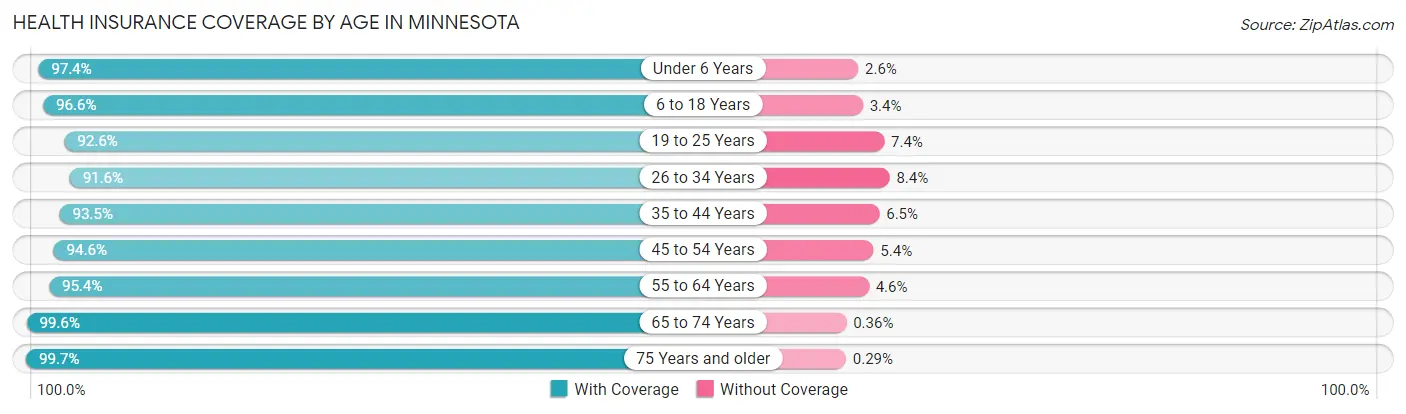
| Age Bracket | With Coverage | Without Coverage |
| Under 6 Years | 401,421 (97.4%) | 10,598 (2.6%) |
| 6 to 18 Years | 940,398 (96.6%) | 33,481 (3.4%) |
| 19 to 25 Years | 465,143 (92.6%) | 37,361 (7.4%) |
| 26 to 34 Years | 616,997 (91.6%) | 56,692 (8.4%) |
| 35 to 44 Years | 695,791 (93.5%) | 48,591 (6.5%) |
| 45 to 54 Years | 634,972 (94.6%) | 36,464 (5.4%) |
| 55 to 64 Years | 716,939 (95.4%) | 34,280 (4.6%) |
| 65 to 74 Years | 541,597 (99.6%) | 1,971 (0.4%) |
| 75 Years and older | 360,983 (99.7%) | 1,045 (0.3%) |
| Total | 5,374,241 (95.4%) | 260,483 (4.6%) |
Health Insurance Coverage by Citizenship Status in Minnesota
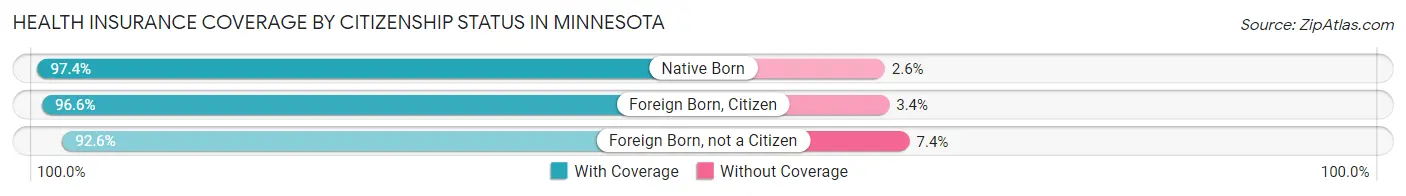
| Citizenship Status | With Coverage | Without Coverage |
| Native Born | 401,421 (97.4%) | 10,598 (2.6%) |
| Foreign Born, Citizen | 940,398 (96.6%) | 33,481 (3.4%) |
| Foreign Born, not a Citizen | 465,143 (92.6%) | 37,361 (7.4%) |
Health Insurance Coverage by Household Income in Minnesota
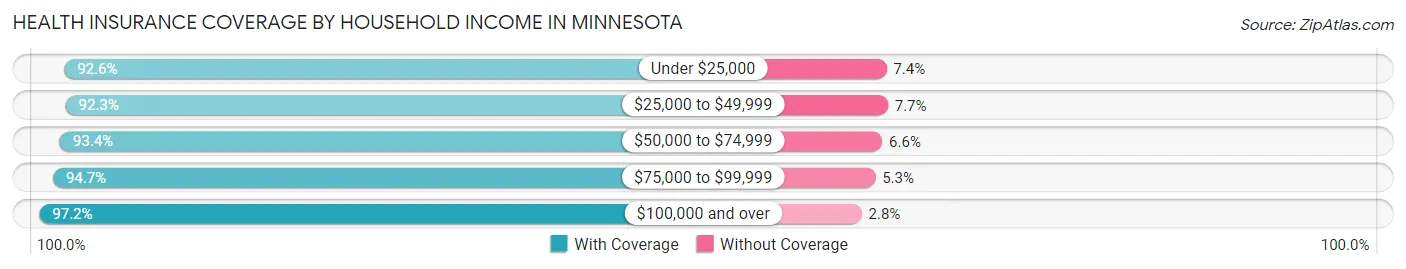
| Household Income | With Coverage | Without Coverage |
| Under $25,000 | 395,767 (92.6%) | 31,776 (7.4%) |
| $25,000 to $49,999 | 639,018 (92.3%) | 53,134 (7.7%) |
| $50,000 to $74,999 | 739,305 (93.4%) | 52,374 (6.6%) |
| $75,000 to $99,999 | 726,667 (94.7%) | 40,819 (5.3%) |
| $100,000 and over | 2,796,332 (97.2%) | 79,751 (2.8%) |
Public vs Private Health Insurance Coverage by Age in Minnesota
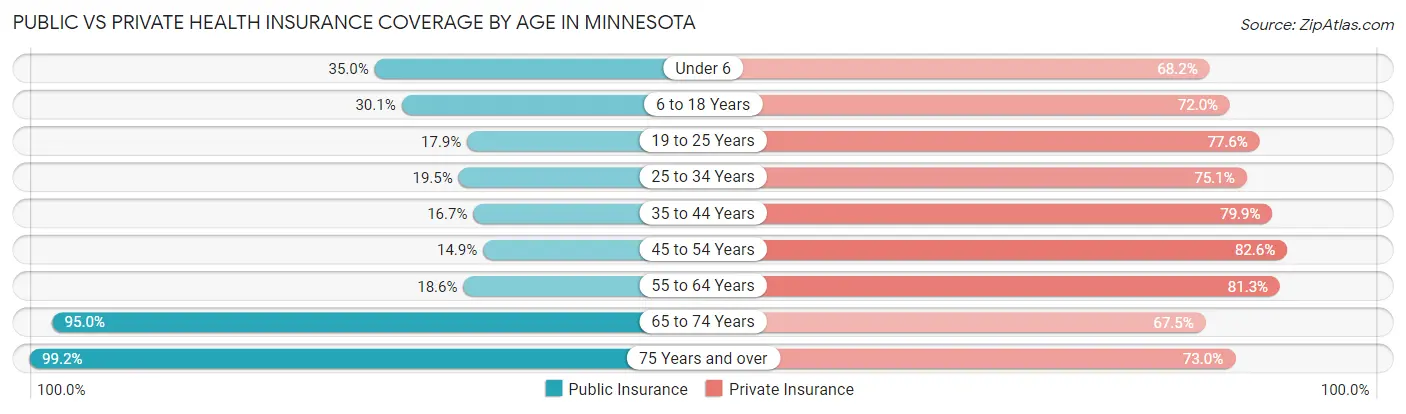
| Age Bracket | Public Insurance | Private Insurance |
| Under 6 | 144,383 (35.0%) | 281,148 (68.2%) |
| 6 to 18 Years | 292,643 (30.0%) | 701,547 (72.0%) |
| 19 to 25 Years | 89,733 (17.9%) | 389,731 (77.6%) |
| 25 to 34 Years | 131,025 (19.5%) | 506,068 (75.1%) |
| 35 to 44 Years | 124,501 (16.7%) | 594,783 (79.9%) |
| 45 to 54 Years | 100,142 (14.9%) | 554,878 (82.6%) |
| 55 to 64 Years | 139,532 (18.6%) | 610,779 (81.3%) |
| 65 to 74 Years | 516,228 (95.0%) | 366,954 (67.5%) |
| 75 Years and over | 358,948 (99.2%) | 264,236 (73.0%) |
| Total | 1,897,135 (33.7%) | 4,270,124 (75.8%) |
Disability Status by Sex by Age in Minnesota
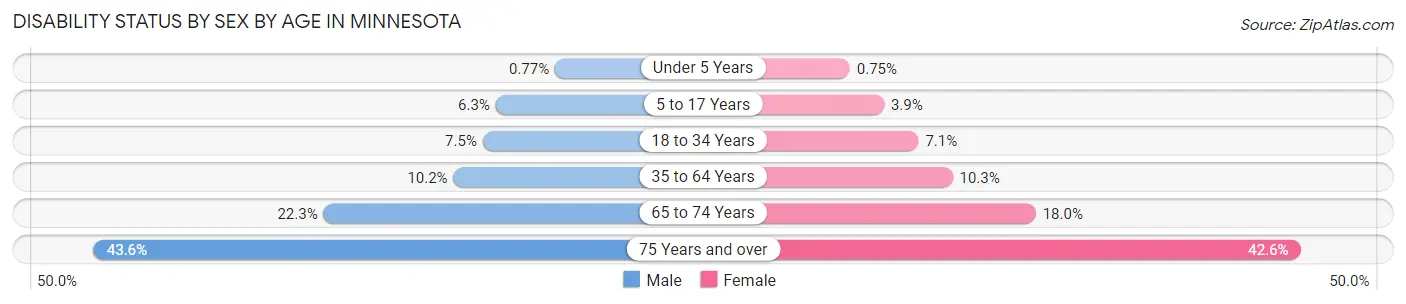
| Age Bracket | Male | Female |
| Under 5 Years | 1,348 (0.8%) | 1,248 (0.7%) |
| 5 to 17 Years | 31,027 (6.3%) | 18,418 (3.9%) |
| 18 to 34 Years | 47,908 (7.5%) | 43,874 (7.1%) |
| 35 to 64 Years | 112,099 (10.2%) | 109,879 (10.3%) |
| 65 to 74 Years | 58,873 (22.3%) | 50,232 (18.0%) |
| 75 Years and over | 66,854 (43.6%) | 88,768 (42.6%) |
Disability Class by Sex by Age in Minnesota
Disability Class: Hearing Difficulty
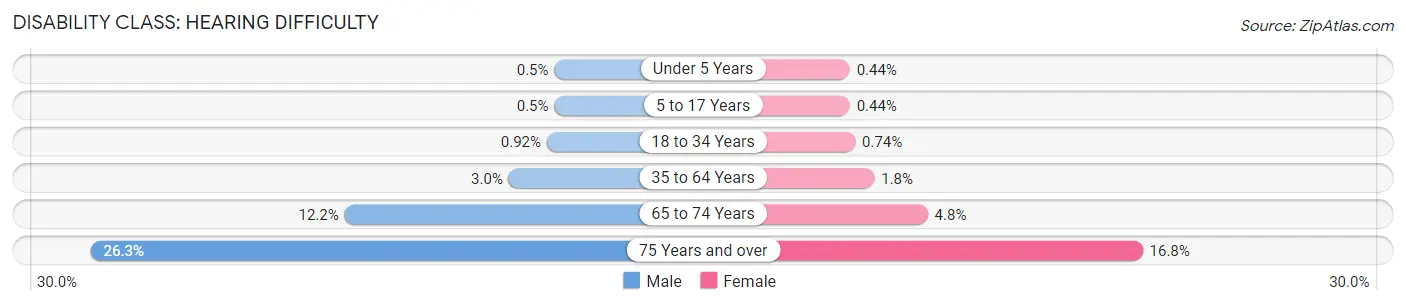
| Age Bracket | Male | Female |
| Under 5 Years | 874 (0.5%) | 740 (0.4%) |
| 5 to 17 Years | 2,477 (0.5%) | 2,073 (0.4%) |
| 18 to 34 Years | 5,887 (0.9%) | 4,566 (0.7%) |
| 35 to 64 Years | 33,433 (3.0%) | 19,310 (1.8%) |
| 65 to 74 Years | 32,201 (12.2%) | 13,335 (4.8%) |
| 75 Years and over | 40,384 (26.3%) | 34,937 (16.8%) |
Disability Class: Vision Difficulty
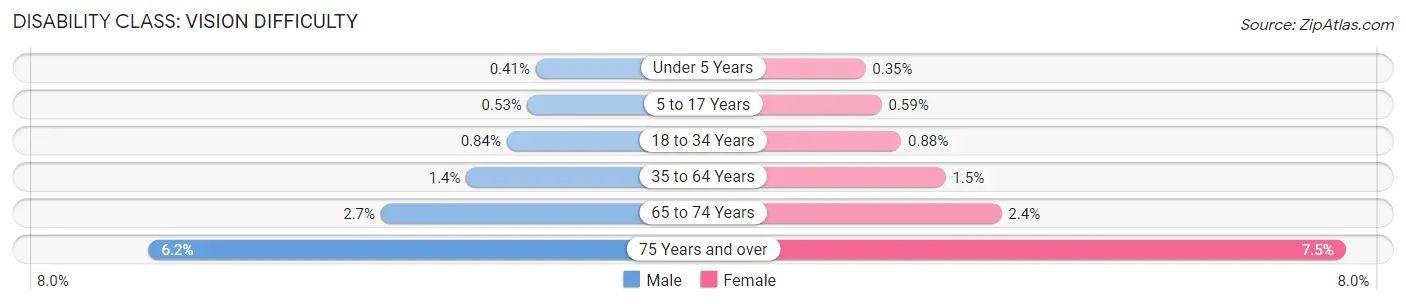
| Age Bracket | Male | Female |
| Under 5 Years | 706 (0.4%) | 588 (0.4%) |
| 5 to 17 Years | 2,619 (0.5%) | 2,803 (0.6%) |
| 18 to 34 Years | 5,370 (0.8%) | 5,425 (0.9%) |
| 35 to 64 Years | 15,873 (1.4%) | 16,440 (1.5%) |
| 65 to 74 Years | 7,154 (2.7%) | 6,628 (2.4%) |
| 75 Years and over | 9,458 (6.2%) | 15,593 (7.5%) |
Disability Class: Cognitive Difficulty
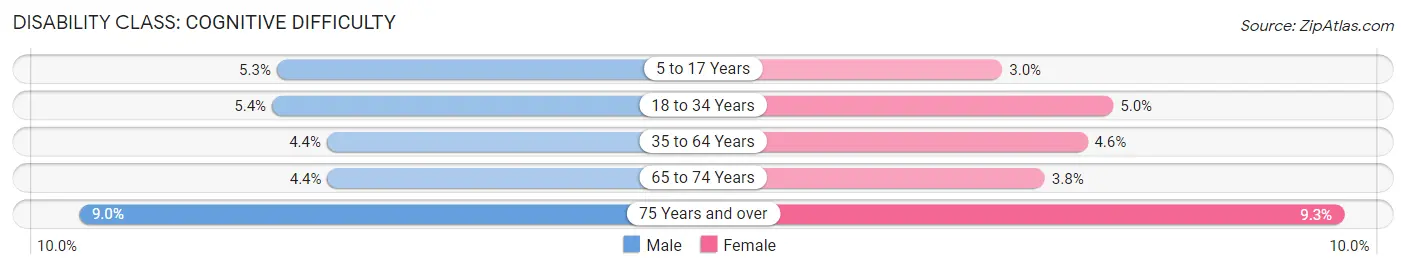
| Age Bracket | Male | Female |
| 5 to 17 Years | 26,258 (5.3%) | 14,034 (3.0%) |
| 18 to 34 Years | 34,644 (5.4%) | 31,044 (5.0%) |
| 35 to 64 Years | 48,191 (4.4%) | 48,732 (4.6%) |
| 65 to 74 Years | 11,589 (4.4%) | 10,534 (3.8%) |
| 75 Years and over | 13,791 (9.0%) | 19,451 (9.3%) |
Disability Class: Ambulatory Difficulty
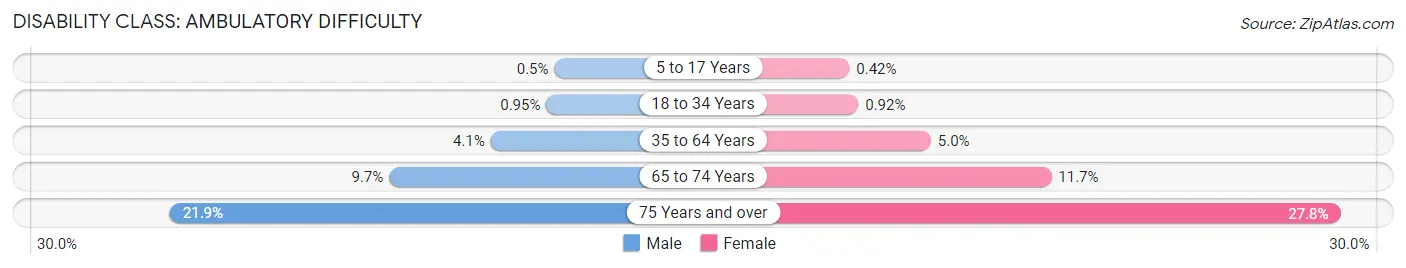
| Age Bracket | Male | Female |
| 5 to 17 Years | 2,444 (0.5%) | 1,998 (0.4%) |
| 18 to 34 Years | 6,088 (0.9%) | 5,676 (0.9%) |
| 35 to 64 Years | 44,441 (4.1%) | 53,034 (5.0%) |
| 65 to 74 Years | 25,640 (9.7%) | 32,562 (11.7%) |
| 75 Years and over | 33,623 (21.9%) | 57,906 (27.8%) |
Disability Class: Self-Care Difficulty
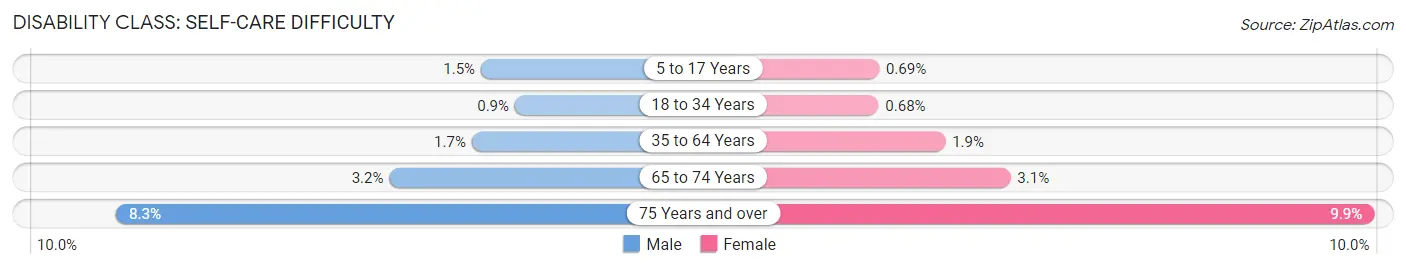
| Age Bracket | Male | Female |
| 5 to 17 Years | 7,551 (1.5%) | 3,265 (0.7%) |
| 18 to 34 Years | 5,782 (0.9%) | 4,205 (0.7%) |
| 35 to 64 Years | 18,644 (1.7%) | 20,525 (1.9%) |
| 65 to 74 Years | 8,531 (3.2%) | 8,740 (3.1%) |
| 75 Years and over | 12,741 (8.3%) | 20,600 (9.9%) |
Technology Access in Minnesota
Computing Device Access in Minnesota
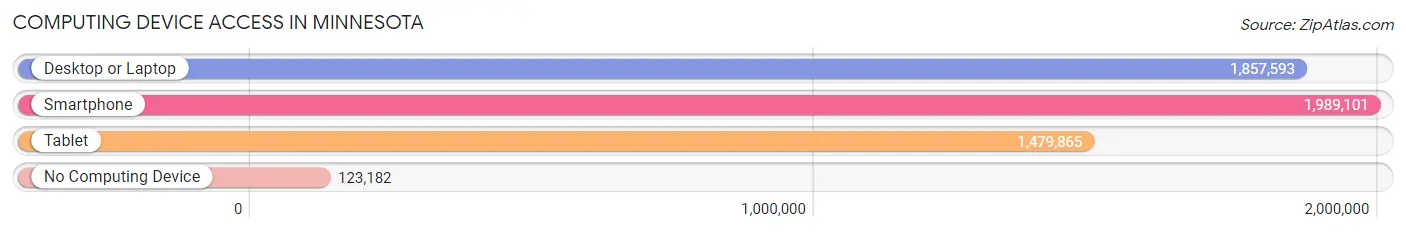
| Device Type | # Households | % Households |
| Desktop or Laptop | 1,857,593 | 82.3% |
| Smartphone | 1,989,101 | 88.2% |
| Tablet | 1,479,865 | 65.6% |
| No Computing Device | 123,182 | 5.5% |
| Total | 2,256,126 | 100.0% |
Internet Access in Minnesota
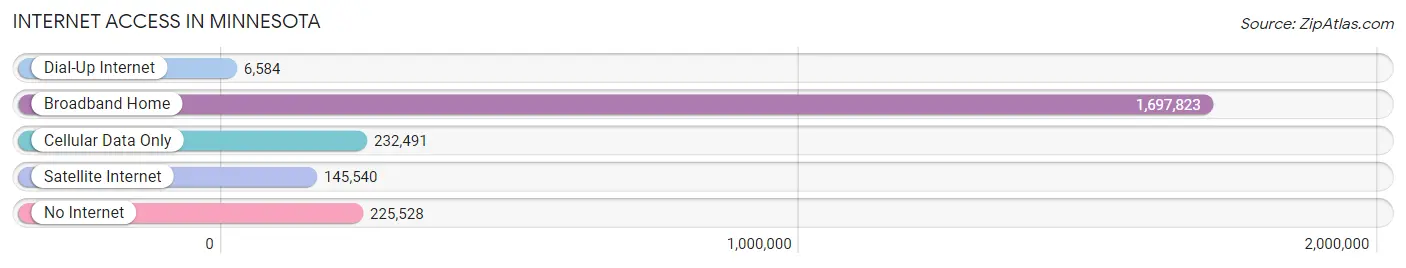
| Internet Type | # Households | % Households |
| Dial-Up Internet | 6,584 | 0.3% |
| Broadband Home | 1,697,823 | 75.2% |
| Cellular Data Only | 232,491 | 10.3% |
| Satellite Internet | 145,540 | 6.5% |
| No Internet | 225,528 | 10.0% |
| Total | 2,256,126 | 100.0% |
Minnesota Summary
Minnesota is a state located in the Midwestern United States. It is bordered by Wisconsin to the east, Iowa to the south, North Dakota and South Dakota to the west, and the Canadian provinces of Ontario and Manitoba to the north. Minnesota was admitted to the Union as the 32nd state on May 11, 1858. The state has a population of 5.6 million people, making it the 21st most populous state in the United States.
Geography
Minnesota is the 12th largest state in the United States, with an area of 86,943 square miles. It is the northernmost of the contiguous United States, and is bordered by Lake Superior and the Canadian provinces of Ontario and Manitoba to the north, Wisconsin to the east, Iowa to the south, and North Dakota and South Dakota to the west. The state is divided into 87 counties and contains 87 state parks and forests. The highest point in Minnesota is Eagle Mountain, at 2,301 feet above sea level. The state's lowest point is Lake Superior, at 602 feet above sea level.
The landscape of Minnesota is diverse, with rolling hills, prairies, forests, and lakes. The state is home to the Boundary Waters Canoe Area Wilderness, the largest wilderness area east of the Mississippi River. The state also contains the Mississippi National River and Recreation Area, a 72-mile stretch of the Mississippi River that is managed by the National Park Service.
Economy
Minnesota has a diversified economy, with a mix of industries including manufacturing, agriculture, finance, and technology. The state is home to 19 Fortune 500 companies, including 3M, Target, and UnitedHealth Group.
Agriculture is an important part of the state's economy, with the state ranking first in the nation in the production of sugar beets, sweet corn, and green peas. The state is also a major producer of soybeans, wheat, and dairy products.
Manufacturing is also an important part of the state's economy, with the state ranking first in the nation in the production of medical devices, and second in the production of computer and electronic products.
Demographics
As of 2019, the population of Minnesota was estimated to be 5.6 million people. The state is home to a diverse population, with the largest racial groups being white (81.2%), black or African American (5.9%), and Hispanic or Latino (5.2%).
The median household income in Minnesota is $68,388, and the median home value is $223,400. The state has a poverty rate of 10.2%, and the unemployment rate is 3.2%.
Conclusion
Minnesota is a state located in the Midwestern United States. It is bordered by Wisconsin to the east, Iowa to the south, North Dakota and South Dakota to the west, and the Canadian provinces of Ontario and Manitoba to the north. The state has a population of 5.6 million people, and is home to a diverse population. The state has a diversified economy, with a mix of industries including manufacturing, agriculture, finance, and technology. Minnesota is also home to 19 Fortune 500 companies, and is a major producer of agricultural products.
Common Questions
When was Minnesota Incorporated?
Minnesota was Incorporated into the Union on May 11, 1858.
What is the Total Area of Minnesota?
Total Area of Minnesota is 86,935 Square Miles.
What is the Total Land Area of Minnesota?
Total Land Area of Minnesota is 79,607 Square Miles.
What is the Total Water Area of Minnesota?
Total Water Area of Minnesota is 7,328 Square Miles.
What is the Average Elevation in Minnesota?
Average Elevation in Minnesota is 1,200 Feet.
What is the Highest Elevation in Minnesota?
Highest Elevation in Minnesota is 2,301 Feet.
What is the Lowest Elevation in Minnesota?
Lowest Elevation in Minnesota is 602 Feet.
What is the Population Density in Minnesota?
Population Density in Minnesota is 71.5 People per Square Mile.
What is Per Capita Income in Minnesota?
Per Capita income in Minnesota is $44,947.
What is the Median Family Income in Minnesota?
Median Family Income in Minnesota is $107,072.
What is the Median Household income in Minnesota?
Median Household Income in Minnesota is $84,313.
What is Income or Wage Gap in Minnesota?
Income or Wage Gap in Minnesota is 26.2%.
Women in Minnesota earn 73.8 cents for every dollar earned by a man.
What is Family Income Deficit in Minnesota?
Family Income Deficit in Minnesota is $10,624.
Families that are below poverty line in Minnesota earn $10,624 less on average than the poverty threshold level.
What is Inequality or Gini Index in Minnesota?
Inequality or Gini Index in Minnesota is 0.45.
What is the Total Population of Minnesota?
Total Population of Minnesota is 5,695,292.
What is the Total Male Population of Minnesota?
Total Male Population of Minnesota is 2,857,964.
What is the Total Female Population of Minnesota?
Total Female Population of Minnesota is 2,837,328.
What is the Ratio of Males per 100 Females in Minnesota?
There are 100.73 Males per 100 Females in Minnesota.
What is the Ratio of Females per 100 Males in Minnesota?
There are 99.28 Females per 100 Males in Minnesota.
What is the Median Population Age in Minnesota?
Median Population Age in Minnesota is 38.5 Years.
What is the Average Family Size in Minnesota
Average Family Size in Minnesota is 3.1 People.
What is the Average Household Size in Minnesota
Average Household Size in Minnesota is 2.5 People.
How Large is the Labor Force in Minnesota?
There are 3,117,089 People in the Labor Forcein in Minnesota.
What is the Percentage of People in the Labor Force in Minnesota?
68.7% of People are in the Labor Force in Minnesota.
What is the Unemployment Rate in Minnesota?
Unemployment Rate in Minnesota is 4.0%.