Cities with the Most Immigrants from Venezuela in the United States
RELATED REPORTS & OPTIONS
Venezuela
United States
Compare Cities
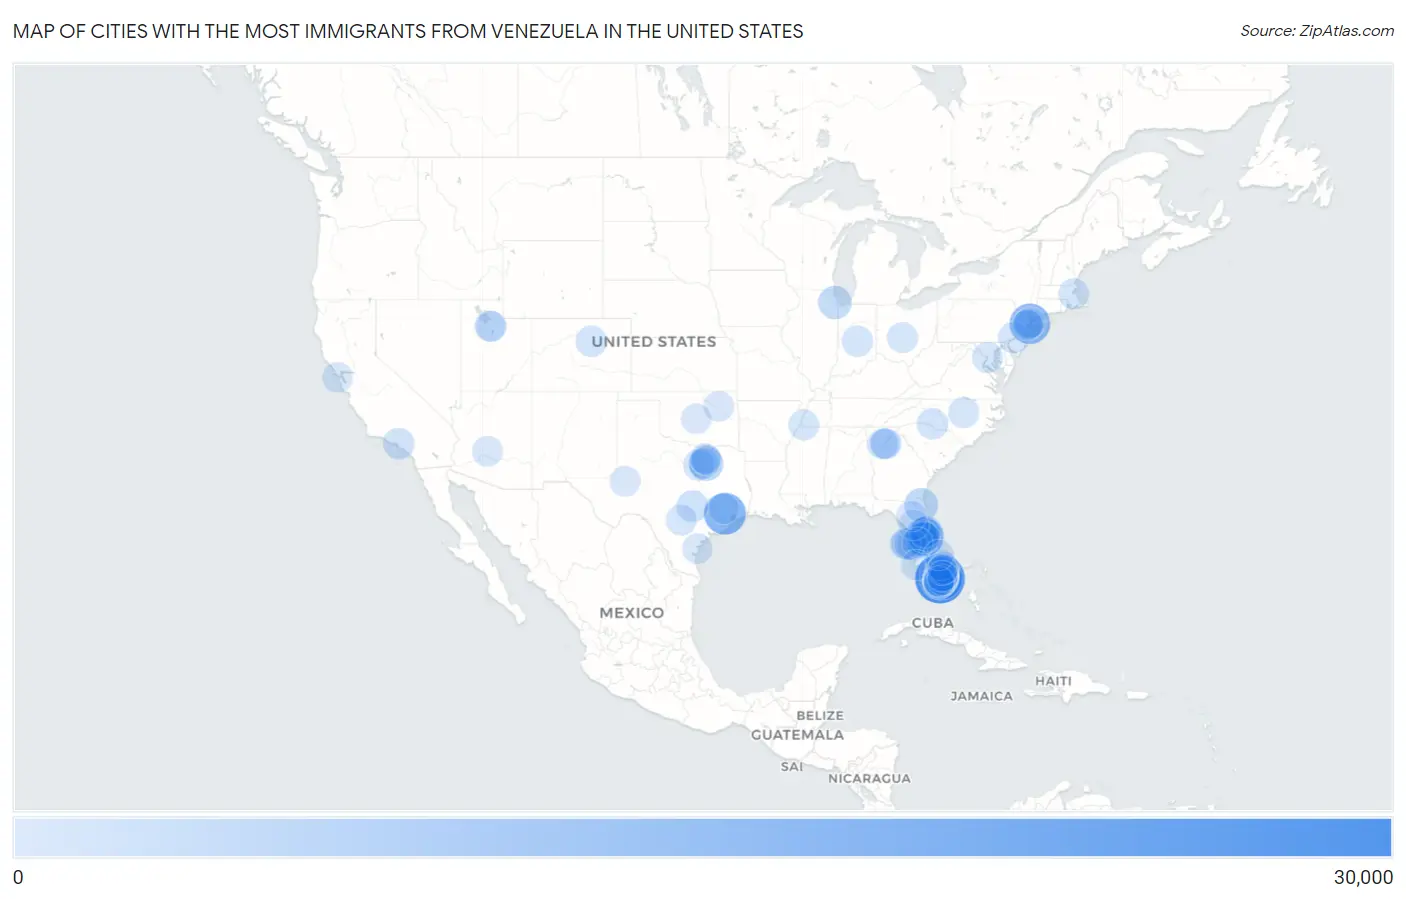
Map of Cities with the Most Immigrants from Venezuela in the United States
0
30,000
Cities with the Most Immigrants from Venezuela in the United States
| City | Venezuela | vs State | vs National | |
| 1. | Doral | 26,608 | 262,042(10.15%)#1 | 519,103(5.13%)#1 |
| 2. | Miami | 16,537 | 262,042(6.31%)#2 | 519,103(3.19%)#2 |
| 3. | Houston | 16,008 | 72,413(22.11%)#1 | 519,103(3.08%)#3 |
| 4. | New York | 14,040 | 19,652(71.44%)#1 | 519,103(2.70%)#4 |
| 5. | Orlando | 11,141 | 262,042(4.25%)#3 | 519,103(2.15%)#5 |
| 6. | Weston | 9,564 | 262,042(3.65%)#4 | 519,103(1.84%)#6 |
| 7. | Kissimmee | 7,613 | 262,042(2.91%)#5 | 519,103(1.47%)#7 |
| 8. | Pembroke Pines | 7,134 | 262,042(2.72%)#6 | 519,103(1.37%)#8 |
| 9. | Fountainebleau | 6,149 | 262,042(2.35%)#7 | 519,103(1.18%)#9 |
| 10. | Dallas | 5,603 | 72,413(7.74%)#2 | 519,103(1.08%)#10 |
| 11. | Jacksonville | 5,007 | 262,042(1.91%)#8 | 519,103(0.96%)#11 |
| 12. | Chicago | 4,509 | 9,688(46.54%)#1 | 519,103(0.87%)#12 |
| 13. | Hollywood | 3,620 | 262,042(1.38%)#9 | 519,103(0.70%)#13 |
| 14. | Four Corners | 3,440 | 262,042(1.31%)#10 | 519,103(0.66%)#14 |
| 15. | Davie | 3,408 | 262,042(1.30%)#11 | 519,103(0.66%)#15 |
| 16. | The Hammocks | 3,390 | 262,042(1.29%)#12 | 519,103(0.65%)#16 |
| 17. | Sunrise | 3,343 | 262,042(1.28%)#13 | 519,103(0.64%)#17 |
| 18. | Coral Springs | 3,110 | 262,042(1.19%)#14 | 519,103(0.60%)#18 |
| 19. | Miami Beach | 2,878 | 262,042(1.10%)#15 | 519,103(0.55%)#19 |
| 20. | Miramar | 2,751 | 262,042(1.05%)#16 | 519,103(0.53%)#20 |
| 21. | Country Club | 2,740 | 262,042(1.05%)#17 | 519,103(0.53%)#21 |
| 22. | Hialeah | 2,683 | 262,042(1.02%)#18 | 519,103(0.52%)#22 |
| 23. | Town N Country | 2,586 | 262,042(0.99%)#19 | 519,103(0.50%)#23 |
| 24. | Austin | 2,549 | 72,413(3.52%)#3 | 519,103(0.49%)#24 |
| 25. | Coral Gables | 2,427 | 262,042(0.93%)#20 | 519,103(0.47%)#25 |
| 26. | Aventura | 2,393 | 262,042(0.91%)#21 | 519,103(0.46%)#26 |
| 27. | Los Angeles | 2,277 | 16,998(13.40%)#1 | 519,103(0.44%)#27 |
| 28. | Tampa | 2,271 | 262,042(0.87%)#22 | 519,103(0.44%)#28 |
| 29. | Pompano Beach | 2,210 | 262,042(0.84%)#23 | 519,103(0.43%)#29 |
| 30. | Sanford | 2,003 | 262,042(0.76%)#24 | 519,103(0.39%)#30 |
| 31. | Horizon West | 1,992 | 262,042(0.76%)#25 | 519,103(0.38%)#31 |
| 32. | Charlotte | 1,943 | 9,986(19.46%)#1 | 519,103(0.37%)#32 |
| 33. | Philadelphia | 1,873 | 5,742(32.62%)#1 | 519,103(0.36%)#33 |
| 34. | Alafaya | 1,865 | 262,042(0.71%)#26 | 519,103(0.36%)#34 |
| 35. | Denver | 1,850 | 4,829(38.31%)#1 | 519,103(0.36%)#35 |
| 36. | Fort Lauderdale | 1,839 | 262,042(0.70%)#27 | 519,103(0.35%)#36 |
| 37. | Tamiami | 1,820 | 262,042(0.69%)#28 | 519,103(0.35%)#37 |
| 38. | Tamarac | 1,797 | 262,042(0.69%)#29 | 519,103(0.35%)#38 |
| 39. | Hallandale Beach | 1,684 | 262,042(0.64%)#30 | 519,103(0.32%)#39 |
| 40. | Meadow Woods | 1,683 | 262,042(0.64%)#31 | 519,103(0.32%)#40 |
| 41. | Kendale Lakes | 1,615 | 262,042(0.62%)#32 | 519,103(0.31%)#41 |
| 42. | Hunters Creek | 1,592 | 262,042(0.61%)#33 | 519,103(0.31%)#42 |
| 43. | Indianapolis | 1,579 | 6,718(23.50%)#1 | 519,103(0.30%)#43 |
| 44. | Fort Worth | 1,549 | 72,413(2.14%)#4 | 519,103(0.30%)#44 |
| 45. | North Miami | 1,526 | 262,042(0.58%)#34 | 519,103(0.29%)#45 |
| 46. | Kendall | 1,515 | 262,042(0.58%)#35 | 519,103(0.29%)#46 |
| 47. | Kendall West | 1,514 | 262,042(0.58%)#36 | 519,103(0.29%)#47 |
| 48. | Cutler Bay | 1,476 | 262,042(0.56%)#37 | 519,103(0.28%)#48 |
| 49. | Sunny Isles Beach | 1,389 | 262,042(0.53%)#38 | 519,103(0.27%)#49 |
| 50. | Brandon | 1,355 | 262,042(0.52%)#39 | 519,103(0.26%)#50 |
| 51. | Ives Estates | 1,347 | 262,042(0.51%)#40 | 519,103(0.26%)#51 |
| 52. | Raleigh | 1,295 | 9,986(12.97%)#2 | 519,103(0.25%)#52 |
| 53. | West Jordan | 1,290 | 8,804(14.65%)#1 | 519,103(0.25%)#53 |
| 54. | Boynton Beach | 1,283 | 262,042(0.49%)#41 | 519,103(0.25%)#54 |
| 55. | Columbus | 1,264 | 3,920(32.24%)#1 | 519,103(0.24%)#55 |
| 56. | Memphis | 1,248 | 5,936(21.02%)#1 | 519,103(0.24%)#56 |
| 57. | San Antonio | 1,238 | 72,413(1.71%)#5 | 519,103(0.24%)#57 |
| 58. | Boston | 1,193 | 5,265(22.66%)#1 | 519,103(0.23%)#58 |
| 59. | Bay Harbor Islands | 1,192 | 262,042(0.45%)#42 | 519,103(0.23%)#59 |
| 60. | Duluth | 1,179 | 19,012(6.20%)#1 | 519,103(0.23%)#60 |
| 61. | Washington | 1,166 | 1,166(100.00%)#1 | 519,103(0.22%)#61 |
| 62. | Deerfield Beach | 1,163 | 262,042(0.44%)#43 | 519,103(0.22%)#62 |
| 63. | The Woodlands | 1,122 | 72,413(1.55%)#6 | 519,103(0.22%)#63 |
| 64. | Westchester | 1,117 | 262,042(0.43%)#44 | 519,103(0.22%)#64 |
| 65. | Clearwater | 1,116 | 262,042(0.43%)#45 | 519,103(0.21%)#65 |
| 66. | Irving | 1,095 | 72,413(1.51%)#7 | 519,103(0.21%)#66 |
| 67. | Phoenix | 1,065 | 2,657(40.08%)#1 | 519,103(0.21%)#67 |
| 68. | The Crossings | 1,029 | 262,042(0.39%)#46 | 519,103(0.20%)#68 |
| 69. | West Odessa | 1,027 | 72,413(1.42%)#8 | 519,103(0.20%)#69 |
| 70. | Frisco | 992 | 72,413(1.37%)#9 | 519,103(0.19%)#70 |
| 71. | Union City | 984 | 12,929(7.61%)#1 | 519,103(0.19%)#71 |
| 72. | San Francisco | 981 | 16,998(5.77%)#2 | 519,103(0.19%)#72 |
| 73. | Homestead | 976 | 262,042(0.37%)#47 | 519,103(0.19%)#73 |
| 74. | Dania Beach | 951 | 262,042(0.36%)#48 | 519,103(0.18%)#74 |
| 75. | Oakland Park | 940 | 262,042(0.36%)#49 | 519,103(0.18%)#75 |
| 76. | Miami Gardens | 935 | 262,042(0.36%)#50 | 519,103(0.18%)#76 |
| 77. | Tulsa | 925 | 3,010(30.73%)#1 | 519,103(0.18%)#77 |
| 78. | Oklahoma City | 898 | 3,010(29.83%)#2 | 519,103(0.17%)#78 |
| 79. | Plano | 879 | 72,413(1.21%)#10 | 519,103(0.17%)#79 |
| 80. | Altamonte Springs | 870 | 262,042(0.33%)#51 | 519,103(0.17%)#80 |
| 81. | Ojus | 855 | 262,042(0.33%)#52 | 519,103(0.16%)#81 |
| 82. | Corpus Christi | 851 | 72,413(1.18%)#11 | 519,103(0.16%)#82 |
| 83. | Sweetwater | 841 | 262,042(0.32%)#53 | 519,103(0.16%)#83 |
| 84. | North Miami Beach | 820 | 262,042(0.31%)#54 | 519,103(0.16%)#84 |
| 85. | Ocala | 813 | 262,042(0.31%)#55 | 519,103(0.16%)#85 |
| 86. | Jersey City | 797 | 12,929(6.16%)#2 | 519,103(0.15%)#86 |
| 87. | Princeton | 777 | 262,042(0.30%)#56 | 519,103(0.15%)#87 |
| 88. | Roswell | 760 | 19,012(4.00%)#2 | 519,103(0.15%)#88 |
| 89. | Gainesville | 742 | 262,042(0.28%)#57 | 519,103(0.14%)#89 |
| 90. | Sandy | 742 | 8,804(8.43%)#2 | 519,103(0.14%)#90 |
| 91. | Key Biscayne | 741 | 262,042(0.28%)#58 | 519,103(0.14%)#91 |
| 92. | Elizabeth | 725 | 12,929(5.61%)#3 | 519,103(0.14%)#92 |
| 93. | Johns Creek | 714 | 19,012(3.76%)#3 | 519,103(0.14%)#93 |
| 94. | Lakeland | 694 | 262,042(0.26%)#59 | 519,103(0.13%)#94 |
| 95. | Wellington | 684 | 262,042(0.26%)#60 | 519,103(0.13%)#95 |
| 96. | Cape Coral | 683 | 262,042(0.26%)#61 | 519,103(0.13%)#96 |
| 97. | Delray Beach | 671 | 262,042(0.26%)#62 | 519,103(0.13%)#97 |
| 98. | Three Lakes | 669 | 262,042(0.26%)#63 | 519,103(0.13%)#98 |
| 99. | Port St Lucie | 666 | 262,042(0.25%)#64 | 519,103(0.13%)#99 |
| 100. | Boca Raton | 663 | 262,042(0.25%)#65 | 519,103(0.13%)#100 |
Common Questions
What are the Top 10 Cities with the Most Immigrants from Venezuela in the United States?
Top 10 Cities with the Most Immigrants from Venezuela in the United States are:
What city has the Most Immigrants from Venezuela in the United States?
Doral has the Most Immigrants from Venezuela in the United States with 26,608.
What is the Total Immigrants from Venezuela in the United States?
Total Immigrants from Venezuela in the United States is 519,103.