Cities with the Lowest Poverty Level Among Single Mothers in the United States
RELATED REPORTS & OPTIONS
Lowest Poverty | Single Mother
United States
Compare Cities
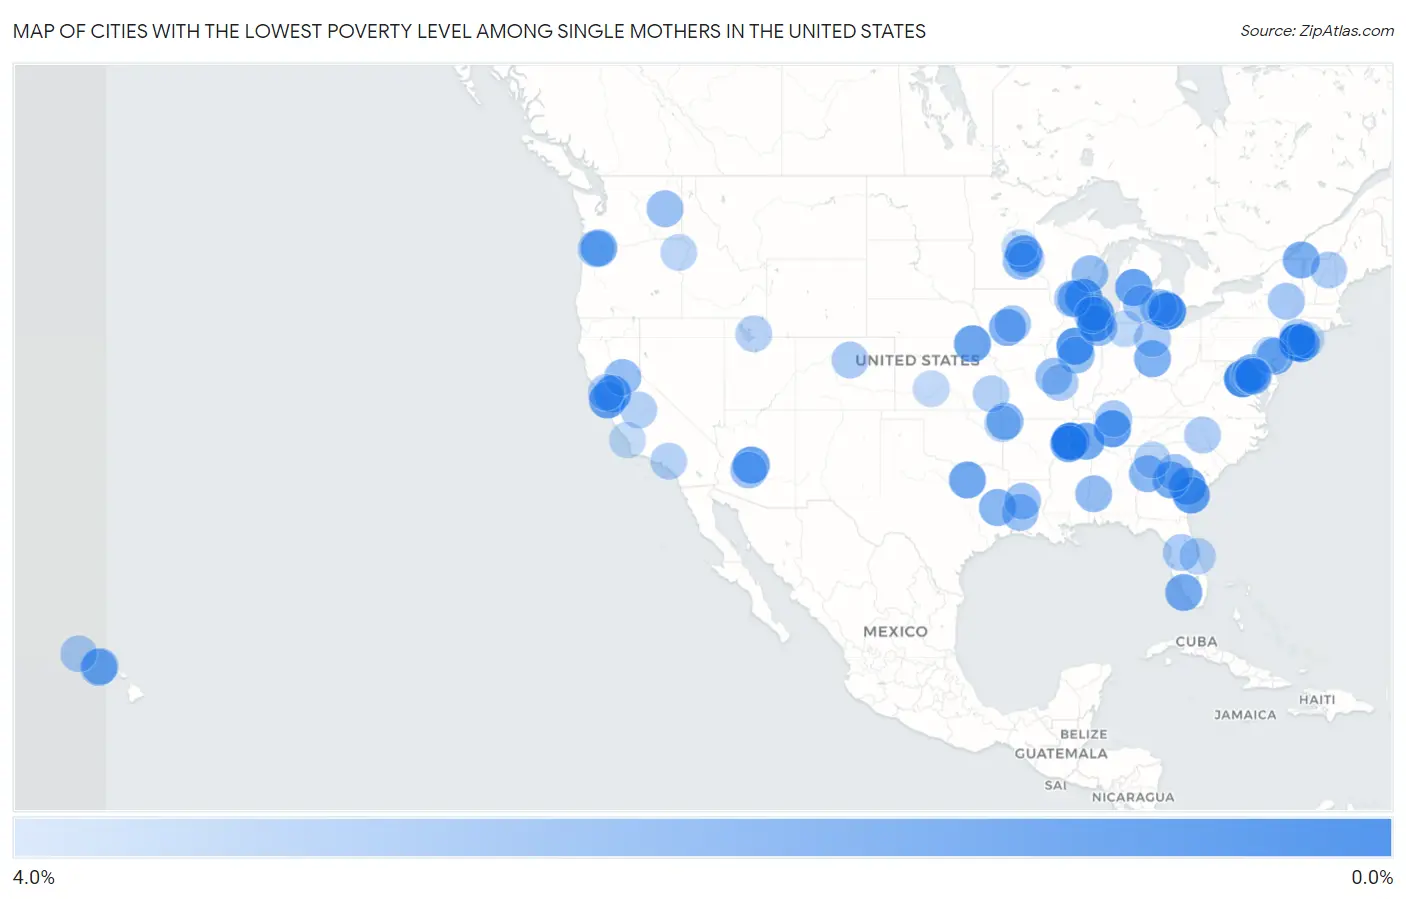
Map of Cities with the Lowest Poverty Level Among Single Mothers in the United States
4.0%
0.0%
Cities with the Lowest Poverty Level Among Single Mothers in the United States
| City | Single Mother Poverty | vs State | vs National | |
| 1. | Elmont | 0.48% | 32.6%(-32.1)#1 | 33.1%(-32.7)#1 |
| 2. | Grosse Pointe Park | 0.56% | 35.5%(-35.0)#1 | 33.1%(-32.6)#2 |
| 3. | Linton Hall | 0.61% | 29.6%(-29.0)#1 | 33.1%(-32.5)#3 |
| 4. | Arlington | 0.70% | 36.6%(-35.9)#1 | 33.1%(-32.4)#4 |
| 5. | North Valley Stream | 1.0% | 32.6%(-31.6)#2 | 33.1%(-32.1)#5 |
| 6. | Mackinaw | 1.0% | 32.4%(-31.3)#1 | 33.1%(-32.1)#6 |
| 7. | Johnson Creek | 1.1% | 29.8%(-28.7)#1 | 33.1%(-32.1)#7 |
| 8. | Clayton | 1.2% | 29.2%(-28.0)#1 | 33.1%(-32.0)#8 |
| 9. | Lakeland | 1.2% | 36.6%(-35.4)#2 | 33.1%(-32.0)#9 |
| 10. | Brentwood | 1.2% | 36.6%(-35.4)#3 | 33.1%(-31.9)#10 |
| 11. | Newington | 1.3% | 33.4%(-32.1)#1 | 33.1%(-31.9)#11 |
| 12. | Pooler | 1.3% | 33.4%(-32.1)#2 | 33.1%(-31.9)#12 |
| 13. | Canadian Lakes | 1.3% | 35.5%(-34.2)#2 | 33.1%(-31.8)#13 |
| 14. | Forest Lake | 1.4% | 26.5%(-25.2)#1 | 33.1%(-31.8)#14 |
| 15. | East Massapequa | 1.4% | 32.6%(-31.2)#3 | 33.1%(-31.8)#15 |
| 16. | Foster City | 1.4% | 29.2%(-27.8)#2 | 33.1%(-31.8)#16 |
| 17. | Anthem | 1.4% | 31.3%(-29.9)#1 | 33.1%(-31.7)#17 |
| 18. | Hickman | 1.5% | 29.1%(-27.6)#1 | 33.1%(-31.7)#18 |
| 19. | Coppell | 1.5% | 35.8%(-34.3)#1 | 33.1%(-31.6)#19 |
| 20. | Bethel Springs | 1.6% | 36.6%(-35.0)#4 | 33.1%(-31.6)#20 |
| 21. | Lely Resort | 1.6% | 30.7%(-29.1)#1 | 33.1%(-31.5)#21 |
| 22. | Davisboro | 1.6% | 33.4%(-31.7)#3 | 33.1%(-31.5)#22 |
| 23. | Germantown | 1.7% | 36.6%(-34.9)#5 | 33.1%(-31.5)#23 |
| 24. | Ardmore | 1.7% | 34.2%(-32.5)#1 | 33.1%(-31.4)#24 |
| 25. | Champlain | 1.8% | 32.6%(-30.8)#4 | 33.1%(-31.4)#25 |
| 26. | Earlham | 1.8% | 32.4%(-30.6)#1 | 33.1%(-31.3)#26 |
| 27. | Deerfield | 1.8% | 32.4%(-30.6)#2 | 33.1%(-31.3)#27 |
| 28. | Enon | 1.8% | 38.7%(-36.9)#1 | 33.1%(-31.3)#28 |
| 29. | Mcfarland | 1.9% | 29.8%(-27.9)#2 | 33.1%(-31.2)#29 |
| 30. | Centerton | 1.9% | 39.8%(-37.9)#1 | 33.1%(-31.2)#30 |
| 31. | Hudson | 1.9% | 35.8%(-33.9)#2 | 33.1%(-31.2)#31 |
| 32. | Hawthorne Borough | 2.0% | 29.5%(-27.5)#1 | 33.1%(-31.2)#32 |
| 33. | Burr Ridge | 2.0% | 32.4%(-30.4)#3 | 33.1%(-31.1)#33 |
| 34. | Hampton | 2.0% | 33.4%(-31.4)#4 | 33.1%(-31.1)#34 |
| 35. | Colesville | 2.1% | 23.8%(-21.7)#1 | 33.1%(-31.1)#35 |
| 36. | Roslyn | 2.1% | 34.2%(-32.0)#2 | 33.1%(-31.0)#36 |
| 37. | Lake Hiawatha | 2.1% | 29.5%(-27.3)#2 | 33.1%(-31.0)#37 |
| 38. | Pennington | 2.2% | 42.7%(-40.5)#1 | 33.1%(-31.0)#38 |
| 39. | Mendota Heights | 2.2% | 26.5%(-24.3)#2 | 33.1%(-30.9)#39 |
| 40. | Little Chute | 2.2% | 29.8%(-27.6)#3 | 33.1%(-30.9)#40 |
| 41. | Mount Pulaski | 2.2% | 32.4%(-30.2)#4 | 33.1%(-30.9)#41 |
| 42. | Flossmoor | 2.2% | 32.4%(-30.2)#5 | 33.1%(-30.9)#42 |
| 43. | Ocean Pointe | 2.2% | 25.5%(-23.3)#1 | 33.1%(-30.9)#43 |
| 44. | Berwyn Heights | 2.2% | 23.8%(-21.6)#2 | 33.1%(-30.9)#44 |
| 45. | Rocklin | 2.2% | 29.2%(-26.9)#3 | 33.1%(-30.9)#45 |
| 46. | Fort Polk South | 2.3% | 45.2%(-42.9)#1 | 33.1%(-30.8)#46 |
| 47. | Harrington | 2.3% | 28.2%(-25.9)#1 | 33.1%(-30.8)#47 |
| 48. | Bethany | 2.3% | 29.9%(-27.6)#1 | 33.1%(-30.8)#48 |
| 49. | Lemont | 2.3% | 32.4%(-30.0)#6 | 33.1%(-30.8)#49 |
| 50. | Flint Hill | 2.4% | 33.6%(-31.3)#1 | 33.1%(-30.8)#50 |
| 51. | Wixom | 2.4% | 35.5%(-33.2)#3 | 33.1%(-30.8)#51 |
| 52. | Lansdowne Borough | 2.4% | 34.2%(-31.8)#3 | 33.1%(-30.8)#52 |
| 53. | Youngtown | 2.4% | 31.3%(-28.9)#2 | 33.1%(-30.7)#53 |
| 54. | Vienna Bend | 2.4% | 45.2%(-42.8)#2 | 33.1%(-30.7)#54 |
| 55. | Rutherford Borough | 2.4% | 29.5%(-27.0)#3 | 33.1%(-30.7)#55 |
| 56. | Grand Ledge | 2.5% | 35.5%(-33.1)#4 | 33.1%(-30.7)#56 |
| 57. | Harlem | 2.5% | 33.4%(-30.9)#5 | 33.1%(-30.7)#57 |
| 58. | Grimes | 2.5% | 32.4%(-29.9)#2 | 33.1%(-30.6)#58 |
| 59. | Canajoharie | 2.5% | 32.6%(-30.1)#5 | 33.1%(-30.6)#59 |
| 60. | Liberty Triangle | 2.5% | 30.7%(-28.2)#2 | 33.1%(-30.6)#60 |
| 61. | Libertyville | 2.5% | 32.4%(-29.8)#7 | 33.1%(-30.6)#61 |
| 62. | Aiea | 2.6% | 25.5%(-22.9)#2 | 33.1%(-30.6)#62 |
| 63. | Cornelius | 2.6% | 29.9%(-27.4)#2 | 33.1%(-30.6)#63 |
| 64. | Verona | 2.6% | 29.8%(-27.2)#4 | 33.1%(-30.5)#64 |
| 65. | Barrington | 2.6% | 32.4%(-29.7)#8 | 33.1%(-30.5)#65 |
| 66. | Golden | 2.6% | 26.4%(-23.8)#1 | 33.1%(-30.5)#66 |
| 67. | Mascotte | 2.6% | 30.7%(-28.1)#3 | 33.1%(-30.5)#67 |
| 68. | Cross Plains | 2.6% | 36.6%(-34.0)#6 | 33.1%(-30.5)#68 |
| 69. | West Mayfield Borough | 2.6% | 34.2%(-31.5)#4 | 33.1%(-30.5)#69 |
| 70. | Lancaster | 2.7% | 23.7%(-21.0)#1 | 33.1%(-30.5)#70 |
| 71. | Sunset Hills | 2.7% | 33.6%(-30.9)#2 | 33.1%(-30.5)#71 |
| 72. | Pandora | 2.7% | 38.7%(-36.0)#2 | 33.1%(-30.4)#72 |
| 73. | Scarsdale | 2.7% | 32.6%(-29.8)#6 | 33.1%(-30.4)#73 |
| 74. | Granite Quarry | 2.7% | 35.6%(-32.9)#1 | 33.1%(-30.4)#74 |
| 75. | Kilauea | 2.7% | 25.5%(-22.7)#3 | 33.1%(-30.4)#75 |
| 76. | La Harpe | 2.8% | 31.9%(-29.2)#1 | 33.1%(-30.4)#76 |
| 77. | Pinole | 2.8% | 29.2%(-26.4)#4 | 33.1%(-30.3)#77 |
| 78. | Madera Acres | 2.8% | 29.2%(-26.4)#5 | 33.1%(-30.3)#78 |
| 79. | Vincent | 2.8% | 29.2%(-26.4)#6 | 33.1%(-30.3)#79 |
| 80. | Washington Terrace | 2.8% | 24.8%(-22.0)#1 | 33.1%(-30.3)#80 |
| 81. | Oak Park Heights | 2.8% | 26.5%(-23.7)#3 | 33.1%(-30.3)#81 |
| 82. | Flowery Branch | 2.9% | 33.4%(-30.5)#6 | 33.1%(-30.3)#82 |
| 83. | Falls Church | 2.9% | 29.6%(-26.8)#2 | 33.1%(-30.2)#83 |
| 84. | Cocoa | 2.9% | 30.7%(-27.8)#4 | 33.1%(-30.2)#84 |
| 85. | Gentry | 2.9% | 39.8%(-36.9)#2 | 33.1%(-30.2)#85 |
| 86. | Cleona Borough | 2.9% | 34.2%(-31.2)#5 | 33.1%(-30.2)#86 |
| 87. | Joseph | 2.9% | 29.9%(-27.0)#3 | 33.1%(-30.2)#87 |
| 88. | Milford | 3.0% | 35.1%(-32.1)#1 | 33.1%(-30.1)#88 |
| 89. | Lionville | 3.0% | 34.2%(-31.2)#6 | 33.1%(-30.1)#89 |
| 90. | Center Line | 3.0% | 35.5%(-32.5)#5 | 33.1%(-30.1)#90 |
| 91. | Rose Hill Cdp Fairfax County | 3.0% | 29.6%(-26.6)#3 | 33.1%(-30.1)#91 |
| 92. | Bloomsbury Borough | 3.0% | 29.5%(-26.5)#4 | 33.1%(-30.1)#92 |
| 93. | Burdett | 3.0% | 31.9%(-28.9)#2 | 33.1%(-30.1)#93 |
| 94. | North Kensington | 3.0% | 23.8%(-20.7)#3 | 33.1%(-30.1)#94 |
| 95. | Peppermill Village | 3.1% | 23.8%(-20.7)#4 | 33.1%(-30.1)#95 |
| 96. | Lake Grove | 3.1% | 32.6%(-29.5)#7 | 33.1%(-30.1)#96 |
| 97. | Los Osos | 3.1% | 29.2%(-26.1)#7 | 33.1%(-30.1)#97 |
| 98. | Rockcreek | 3.1% | 29.9%(-26.9)#4 | 33.1%(-30.1)#98 |
| 99. | Lake Arbor | 3.1% | 23.8%(-20.6)#5 | 33.1%(-30.0)#99 |
| 100. | Cambridge | 3.1% | 26.5%(-23.4)#4 | 33.1%(-30.0)#100 |
Common Questions
What are the Top 10 Cities with the Lowest Poverty Level Among Single Mothers in the United States?
Top 10 Cities with the Lowest Poverty Level Among Single Mothers in the United States are:
#1
0.48%
#2
0.56%
#3
0.61%
#4
0.70%
#5
1.0%
#6
1.0%
#7
1.1%
#8
1.2%
#9
1.2%
#10
1.2%
What city has the Lowest Poverty Level Among Single Mothers in the United States?
Elmont has the Lowest Poverty Level Among Single Mothers in the United States with 0.48%.
What is the Poverty Level Among Single Mothers in the United States?
Poverty Level Among Single Mothers in the United States is 33.1%.