Sumter County, SC Map & Demographics
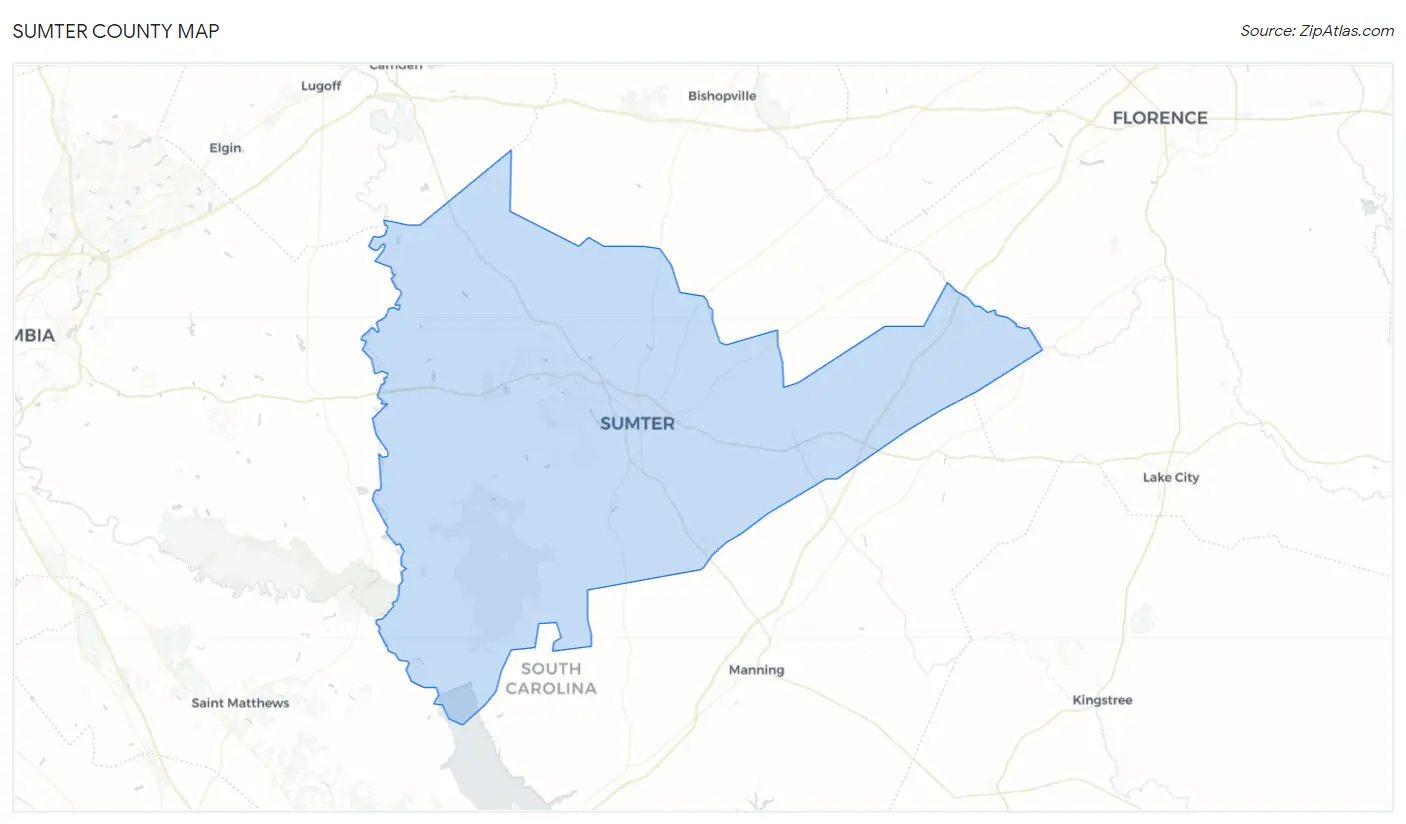
Sumter County Map
Sumter County Overview
$28,319
PER CAPITA INCOME
$67,811
AVG FAMILY INCOME
$53,970
AVG HOUSEHOLD INCOME
27.8%
WAGE / INCOME GAP [ % ]
72.2¢/ $1
WAGE / INCOME GAP [ $ ]
$10,264
FAMILY INCOME DEFICIT
0.46
INEQUALITY / GINI INDEX
105,199
TOTAL POPULATION
51,138
MALE POPULATION
54,061
FEMALE POPULATION
94.59
MALES / 100 FEMALES
105.72
FEMALES / 100 MALES
36.9
MEDIAN AGE
3.2
AVG FAMILY SIZE
2.5
AVG HOUSEHOLD SIZE
49,031
LABOR FORCE [ PEOPLE ]
59.1%
PERCENT IN LABOR FORCE
7.2%
UNEMPLOYMENT RATE
Sumter County Area Codes
Income in Sumter County
Income Overview in Sumter County
Per Capita Income in Sumter County is $28,319, while median incomes of families and households are $67,811 and $53,970 respectively.
| Characteristic | Number | Measure |
| Per Capita Income | 105,199 | $28,319 |
| Median Family Income | 26,763 | $67,811 |
| Mean Family Income | 26,763 | $84,720 |
| Median Household Income | 40,917 | $53,970 |
| Mean Household Income | 40,917 | $70,528 |
| Income Deficit | 26,763 | $10,264 |
| Wage / Income Gap (%) | 105,199 | 27.84% |
| Wage / Income Gap ($) | 105,199 | 72.16¢ per $1 |
| Gini / Inequality Index | 105,199 | 0.46 |
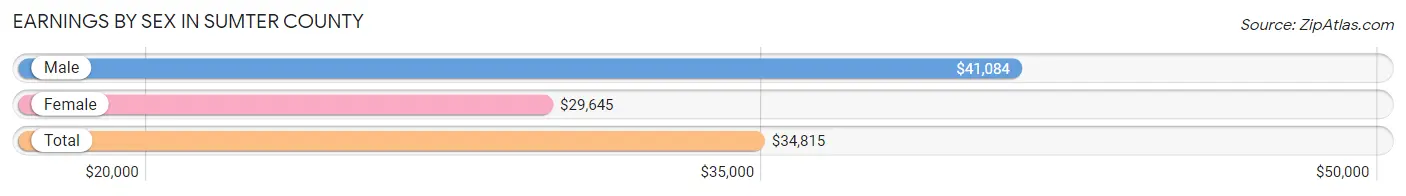
Earnings by Sex in Sumter County
Average Earnings in Sumter County are $34,815, $41,084 for men and $29,645 for women, a difference of 27.8%.
| Sex | Number | Average Earnings |
| Male | 26,194 (51.8%) | $41,084 |
| Female | 24,407 (48.2%) | $29,645 |
| Total | 50,601 (100.0%) | $34,815 |
Earnings by Sex by Income Bracket in Sumter County
The most common earnings brackets in Sumter County are $100,000+ for men (2,536 | 9.7%) and $25,000 to $29,999 for women (2,447 | 10.0%).
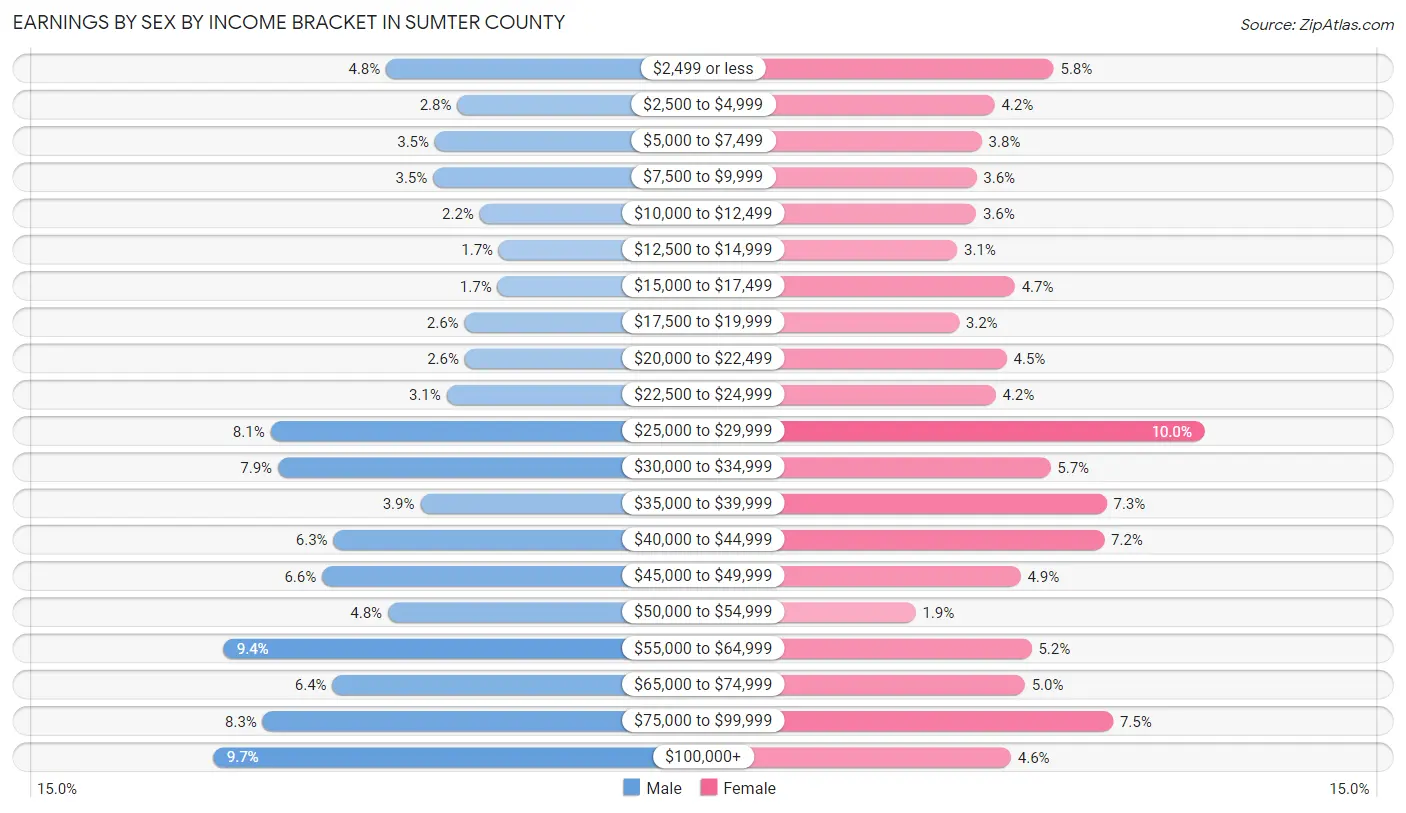
| Income | Male | Female |
| $2,499 or less | 1,268 (4.8%) | 1,417 (5.8%) |
| $2,500 to $4,999 | 743 (2.8%) | 1,013 (4.2%) |
| $5,000 to $7,499 | 908 (3.5%) | 925 (3.8%) |
| $7,500 to $9,999 | 922 (3.5%) | 888 (3.6%) |
| $10,000 to $12,499 | 578 (2.2%) | 885 (3.6%) |
| $12,500 to $14,999 | 437 (1.7%) | 757 (3.1%) |
| $15,000 to $17,499 | 447 (1.7%) | 1,151 (4.7%) |
| $17,500 to $19,999 | 692 (2.6%) | 769 (3.2%) |
| $20,000 to $22,499 | 689 (2.6%) | 1,095 (4.5%) |
| $22,500 to $24,999 | 822 (3.1%) | 1,020 (4.2%) |
| $25,000 to $29,999 | 2,119 (8.1%) | 2,447 (10.0%) |
| $30,000 to $34,999 | 2,064 (7.9%) | 1,396 (5.7%) |
| $35,000 to $39,999 | 1,016 (3.9%) | 1,781 (7.3%) |
| $40,000 to $44,999 | 1,656 (6.3%) | 1,764 (7.2%) |
| $45,000 to $49,999 | 1,740 (6.6%) | 1,191 (4.9%) |
| $50,000 to $54,999 | 1,255 (4.8%) | 471 (1.9%) |
| $55,000 to $64,999 | 2,461 (9.4%) | 1,266 (5.2%) |
| $65,000 to $74,999 | 1,664 (6.4%) | 1,221 (5.0%) |
| $75,000 to $99,999 | 2,177 (8.3%) | 1,826 (7.5%) |
| $100,000+ | 2,536 (9.7%) | 1,124 (4.6%) |
| Total | 26,194 (100.0%) | 24,407 (100.0%) |
Earnings by Sex by Educational Attainment in Sumter County
Average earnings in Sumter County are $46,313 for men and $34,422 for women, a difference of 25.7%. Men with an educational attainment of graduate degree enjoy the highest average annual earnings of $88,958, while those with less than high school education earn the least with $29,533. Women with an educational attainment of graduate degree earn the most with the average annual earnings of $61,533, while those with less than high school education have the smallest earnings of $21,488.
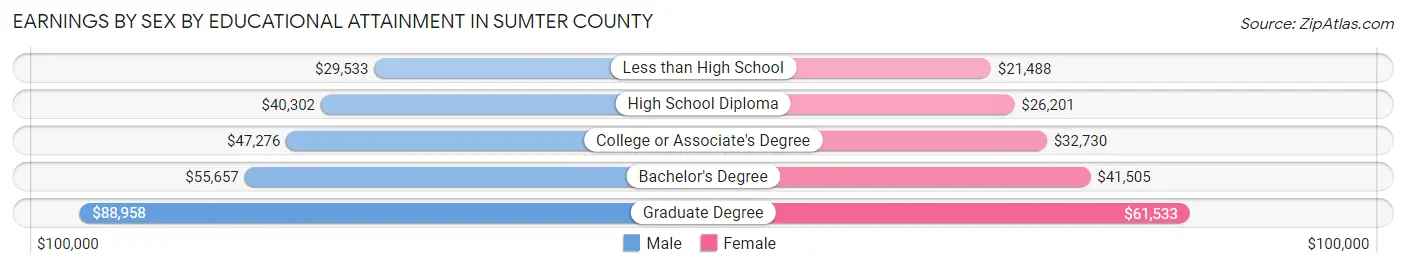
| Educational Attainment | Male Income | Female Income |
| Less than High School | $29,533 | $21,488 |
| High School Diploma | $40,302 | $26,201 |
| College or Associate's Degree | $47,276 | $32,730 |
| Bachelor's Degree | $55,657 | $41,505 |
| Graduate Degree | $88,958 | $61,533 |
| Total | $46,313 | $34,422 |
Family Income in Sumter County
Family Income Brackets in Sumter County
According to the Sumter County family income data, there are 5,460 families falling into the $50,000 to $74,999 income range, which is the most common income bracket and makes up 20.4% of all families. Conversely, the $10,000 to $14,999 income bracket is the least frequent group with only 803 families (3.0%) belonging to this category.
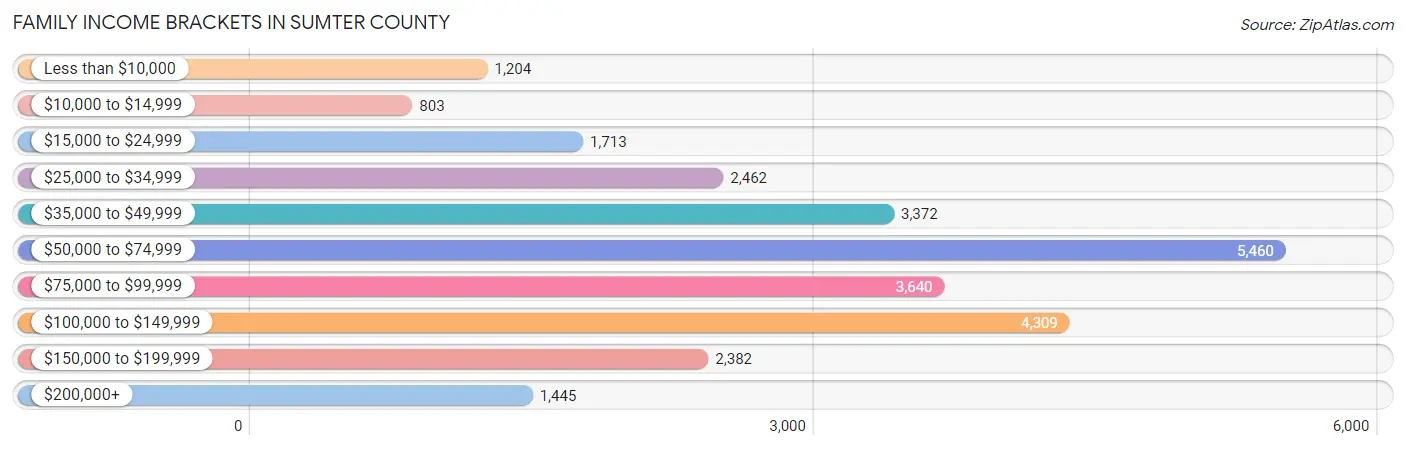
| Income Bracket | # Families | % Families |
| Less than $10,000 | 1,204 | 4.5% |
| $10,000 to $14,999 | 803 | 3.0% |
| $15,000 to $24,999 | 1,713 | 6.4% |
| $25,000 to $34,999 | 2,462 | 9.2% |
| $35,000 to $49,999 | 3,372 | 12.6% |
| $50,000 to $74,999 | 5,460 | 20.4% |
| $75,000 to $99,999 | 3,640 | 13.6% |
| $100,000 to $149,999 | 4,309 | 16.1% |
| $150,000 to $199,999 | 2,382 | 8.9% |
| $200,000+ | 1,445 | 5.4% |
Family Income by Famaliy Size in Sumter County
6-person families (489 | 1.8%) account for the highest median family income in Sumter County with $123,711 per family, while 2-person families (12,786 | 47.8%) have the highest median income of $31,554 per family member.
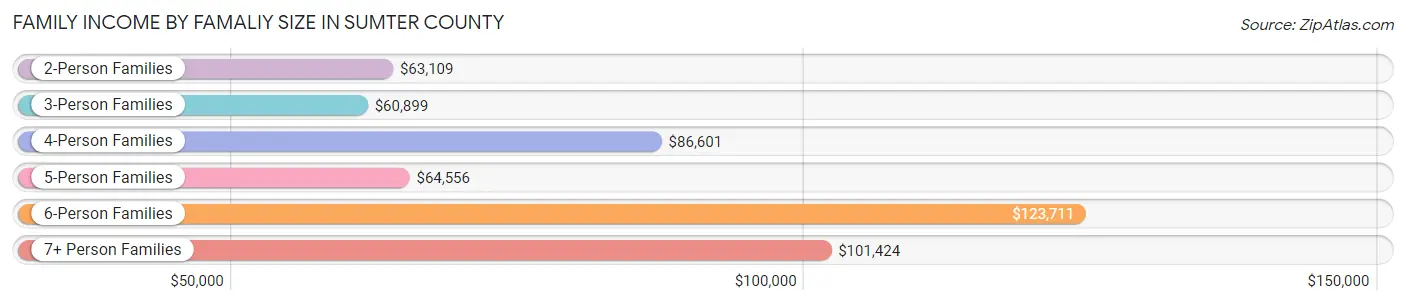
| Income Bracket | # Families | Median Income |
| 2-Person Families | 12,786 (47.8%) | $63,109 |
| 3-Person Families | 6,863 (25.6%) | $60,899 |
| 4-Person Families | 4,678 (17.5%) | $86,601 |
| 5-Person Families | 1,568 (5.9%) | $64,556 |
| 6-Person Families | 489 (1.8%) | $123,711 |
| 7+ Person Families | 379 (1.4%) | $101,424 |
| Total | 26,763 (100.0%) | $67,811 |
Family Income by Number of Earners in Sumter County
The median family income in Sumter County is $67,811, with families comprising 3+ earners (2,366) having the highest median family income of $123,632, while families with no earners (4,279) have the lowest median family income of $33,037, accounting for 8.8% and 16.0% of families, respectively.
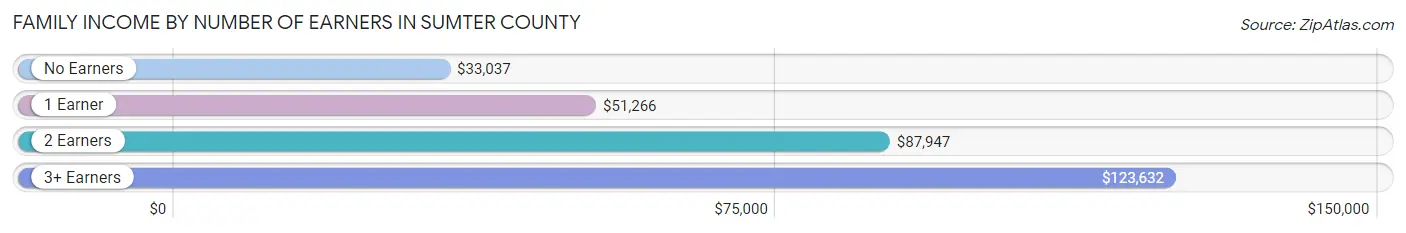
| Number of Earners | # Families | Median Income |
| No Earners | 4,279 (16.0%) | $33,037 |
| 1 Earner | 10,035 (37.5%) | $51,266 |
| 2 Earners | 10,083 (37.7%) | $87,947 |
| 3+ Earners | 2,366 (8.8%) | $123,632 |
| Total | 26,763 (100.0%) | $67,811 |
Household Income in Sumter County
Household Income Brackets in Sumter County
With 7,733 households falling in the category, the $50,000 to $74,999 income range is the most frequent in Sumter County, accounting for 18.9% of all households. In contrast, only 1,678 households (4.1%) fall into the $200,000+ income bracket, making it the least populous group.
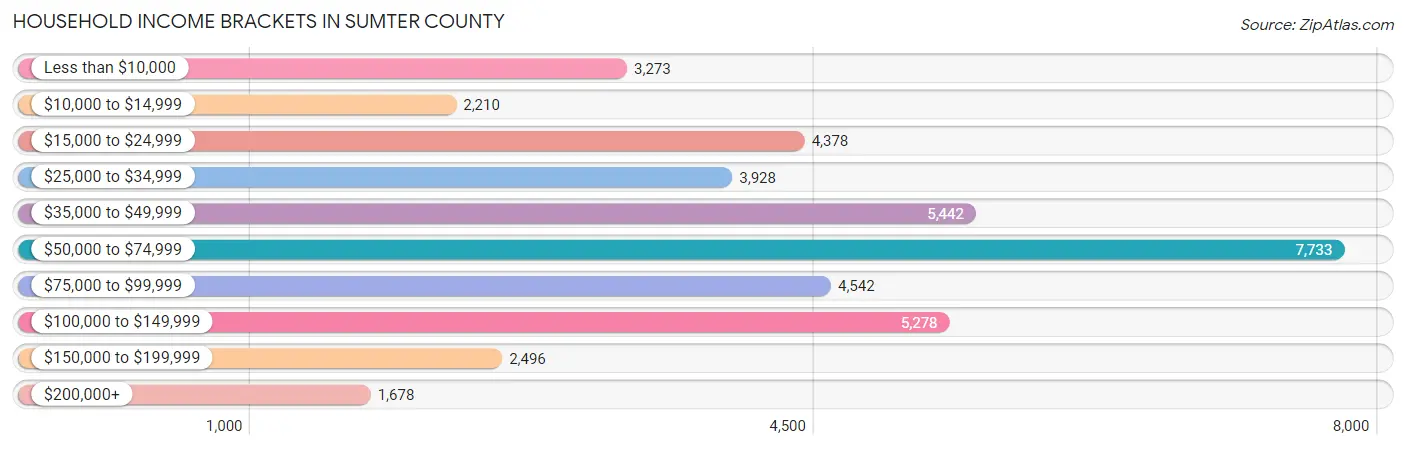
| Income Bracket | # Households | % Households |
| Less than $10,000 | 3,273 | 8.0% |
| $10,000 to $14,999 | 2,210 | 5.4% |
| $15,000 to $24,999 | 4,378 | 10.7% |
| $25,000 to $34,999 | 3,928 | 9.6% |
| $35,000 to $49,999 | 5,442 | 13.3% |
| $50,000 to $74,999 | 7,733 | 18.9% |
| $75,000 to $99,999 | 4,542 | 11.1% |
| $100,000 to $149,999 | 5,278 | 12.9% |
| $150,000 to $199,999 | 2,496 | 6.1% |
| $200,000+ | 1,678 | 4.1% |
Household Income by Householder Age in Sumter County
The median household income in Sumter County is $53,970, with the highest median household income of $62,405 found in the 25 to 44 years age bracket for the primary householder. A total of 12,444 households (30.4%) fall into this category. Meanwhile, the 15 to 24 years age bracket for the primary householder has the lowest median household income of $36,473, with 2,664 households (6.5%) in this group.
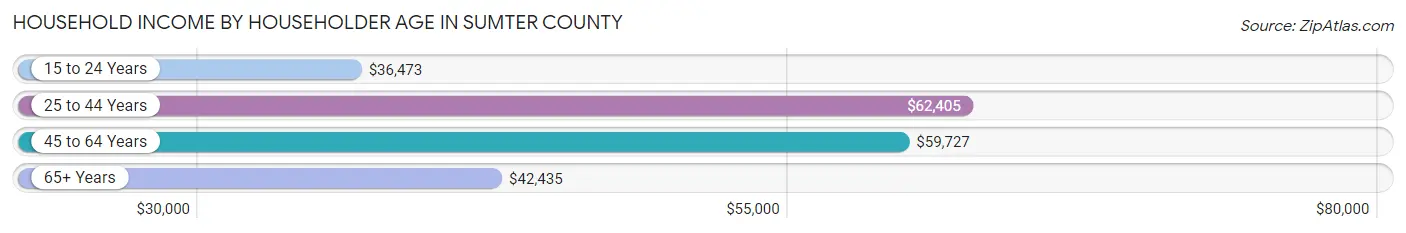
| Income Bracket | # Households | Median Income |
| 15 to 24 Years | 2,664 (6.5%) | $36,473 |
| 25 to 44 Years | 12,444 (30.4%) | $62,405 |
| 45 to 64 Years | 14,150 (34.6%) | $59,727 |
| 65+ Years | 11,659 (28.5%) | $42,435 |
| Total | 40,917 (100.0%) | $53,970 |
Poverty in Sumter County
Income Below Poverty by Sex and Age in Sumter County
With 14.6% poverty level for males and 18.1% for females among the residents of Sumter County, 15 year old males and under 5 year old females are the most vulnerable to poverty, with 212 males (27.4%) and 761 females (24.2%) in their respective age groups living below the poverty level.
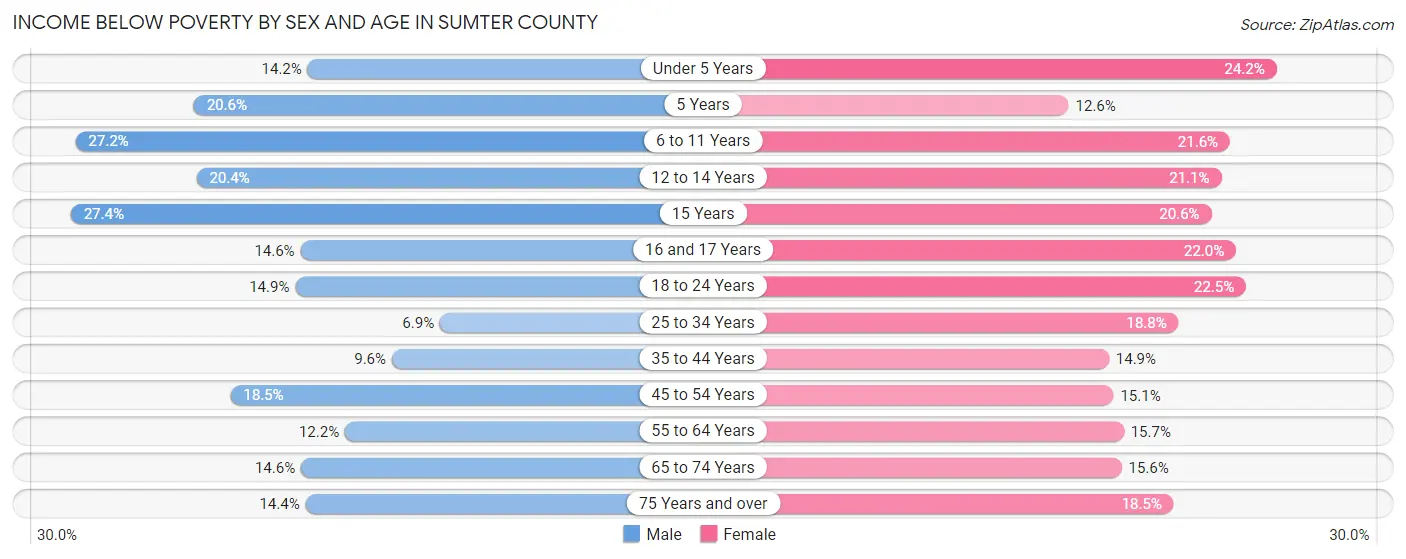
| Age Bracket | Male | Female |
| Under 5 Years | 517 (14.2%) | 761 (24.2%) |
| 5 Years | 171 (20.6%) | 110 (12.6%) |
| 6 to 11 Years | 1,134 (27.2%) | 845 (21.6%) |
| 12 to 14 Years | 415 (20.4%) | 406 (21.1%) |
| 15 Years | 212 (27.4%) | 128 (20.6%) |
| 16 and 17 Years | 196 (14.6%) | 319 (22.0%) |
| 18 to 24 Years | 747 (14.9%) | 1,082 (22.5%) |
| 25 to 34 Years | 488 (6.9%) | 1,310 (18.8%) |
| 35 to 44 Years | 532 (9.6%) | 936 (14.9%) |
| 45 to 54 Years | 986 (18.5%) | 948 (15.1%) |
| 55 to 64 Years | 748 (12.2%) | 1,099 (15.7%) |
| 65 to 74 Years | 704 (14.6%) | 881 (15.6%) |
| 75 Years and over | 387 (14.4%) | 758 (18.5%) |
| Total | 7,237 (14.6%) | 9,583 (18.1%) |
Income Above Poverty by Sex and Age in Sumter County
According to the poverty statistics in Sumter County, males aged 25 to 34 years and females aged 5 years are the age groups that are most secure financially, with 93.1% of males and 87.4% of females in these age groups living above the poverty line.
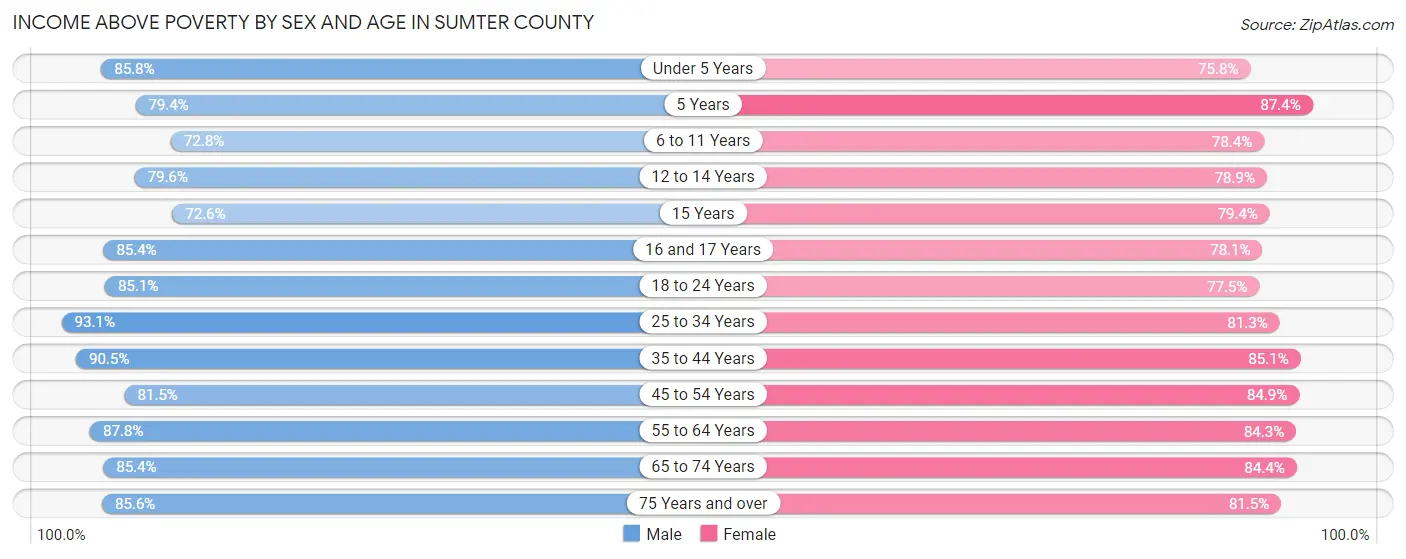
| Age Bracket | Male | Female |
| Under 5 Years | 3,113 (85.8%) | 2,382 (75.8%) |
| 5 Years | 660 (79.4%) | 761 (87.4%) |
| 6 to 11 Years | 3,040 (72.8%) | 3,066 (78.4%) |
| 12 to 14 Years | 1,616 (79.6%) | 1,515 (78.9%) |
| 15 Years | 561 (72.6%) | 494 (79.4%) |
| 16 and 17 Years | 1,143 (85.4%) | 1,134 (78.0%) |
| 18 to 24 Years | 4,255 (85.1%) | 3,724 (77.5%) |
| 25 to 34 Years | 6,614 (93.1%) | 5,677 (81.2%) |
| 35 to 44 Years | 5,036 (90.4%) | 5,360 (85.1%) |
| 45 to 54 Years | 4,332 (81.5%) | 5,319 (84.9%) |
| 55 to 64 Years | 5,405 (87.8%) | 5,901 (84.3%) |
| 65 to 74 Years | 4,116 (85.4%) | 4,774 (84.4%) |
| 75 Years and over | 2,308 (85.6%) | 3,344 (81.5%) |
| Total | 42,199 (85.4%) | 43,451 (81.9%) |
Income Below Poverty Among Married-Couple Families in Sumter County
The poverty statistics for married-couple families in Sumter County show that 5.6% or 1,011 of the total 17,938 families live below the poverty line. Families with 3 or 4 children have the highest poverty rate of 11.2%, comprising of 101 families. On the other hand, families with 5 or more children have the lowest poverty rate of 0.0%, which includes 0 families.
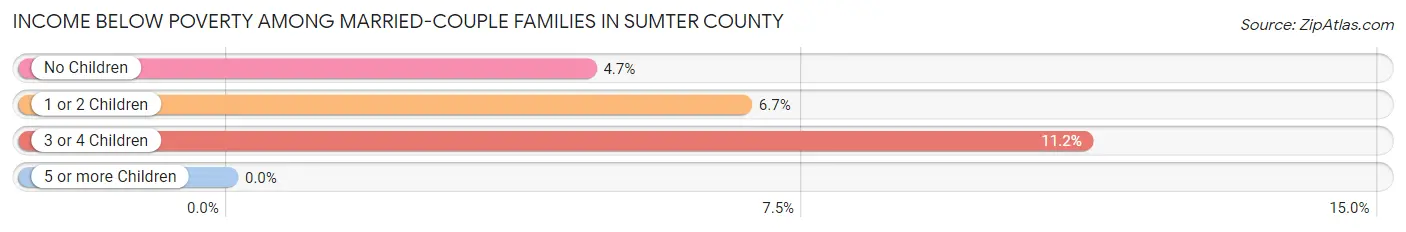
| Children | Above Poverty | Below Poverty |
| No Children | 10,675 (95.3%) | 524 (4.7%) |
| 1 or 2 Children | 5,367 (93.3%) | 386 (6.7%) |
| 3 or 4 Children | 803 (88.8%) | 101 (11.2%) |
| 5 or more Children | 82 (100.0%) | 0 (0.0%) |
| Total | 16,927 (94.4%) | 1,011 (5.6%) |
Income Below Poverty Among Single-Parent Households in Sumter County
According to the poverty data in Sumter County, 21.8% or 432 single-father households and 28.8% or 1,968 single-mother households are living below the poverty line. Among single-father households, those with 1 or 2 children have the highest poverty rate, with 331 households (47.3%) experiencing poverty. Likewise, among single-mother households, those with 3 or 4 children have the highest poverty rate, with 363 households (52.4%) falling below the poverty line.
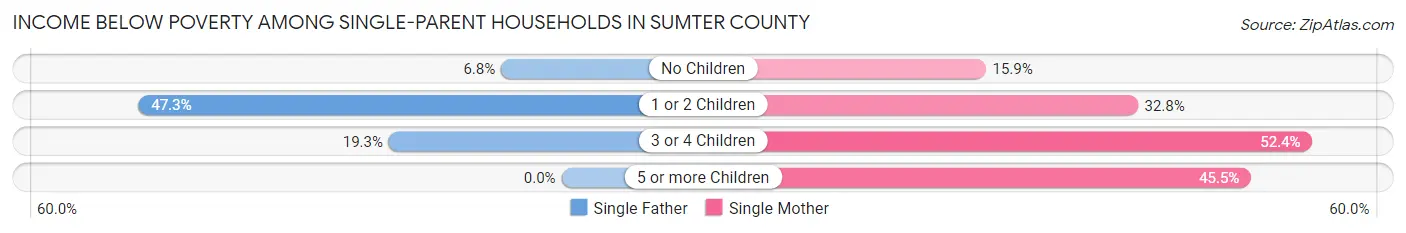
| Children | Single Father | Single Mother |
| No Children | 79 (6.8%) | 399 (15.9%) |
| 1 or 2 Children | 331 (47.3%) | 1,160 (32.8%) |
| 3 or 4 Children | 22 (19.3%) | 363 (52.4%) |
| 5 or more Children | 0 (0.0%) | 46 (45.5%) |
| Total | 432 (21.8%) | 1,968 (28.8%) |
Income Below Poverty Among Married-Couple vs Single-Parent Households in Sumter County
The poverty data for Sumter County shows that 1,011 of the married-couple family households (5.6%) and 2,400 of the single-parent households (27.2%) are living below the poverty level. Within the married-couple family households, those with 3 or 4 children have the highest poverty rate, with 101 households (11.2%) falling below the poverty line. Among the single-parent households, those with 3 or 4 children have the highest poverty rate, with 385 household (47.7%) living below poverty.
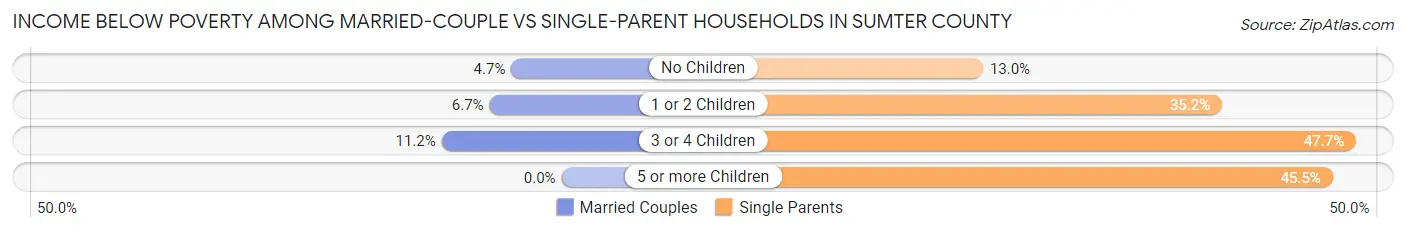
| Children | Married-Couple Families | Single-Parent Households |
| No Children | 524 (4.7%) | 478 (13.0%) |
| 1 or 2 Children | 386 (6.7%) | 1,491 (35.2%) |
| 3 or 4 Children | 101 (11.2%) | 385 (47.7%) |
| 5 or more Children | 0 (0.0%) | 46 (45.5%) |
| Total | 1,011 (5.6%) | 2,400 (27.2%) |
Race in Sumter County
The most populous races in Sumter County are Black / African American (48,246 | 45.9%), White / Caucasian (47,752 | 45.4%), and Two or more Races (5,423 | 5.1%).
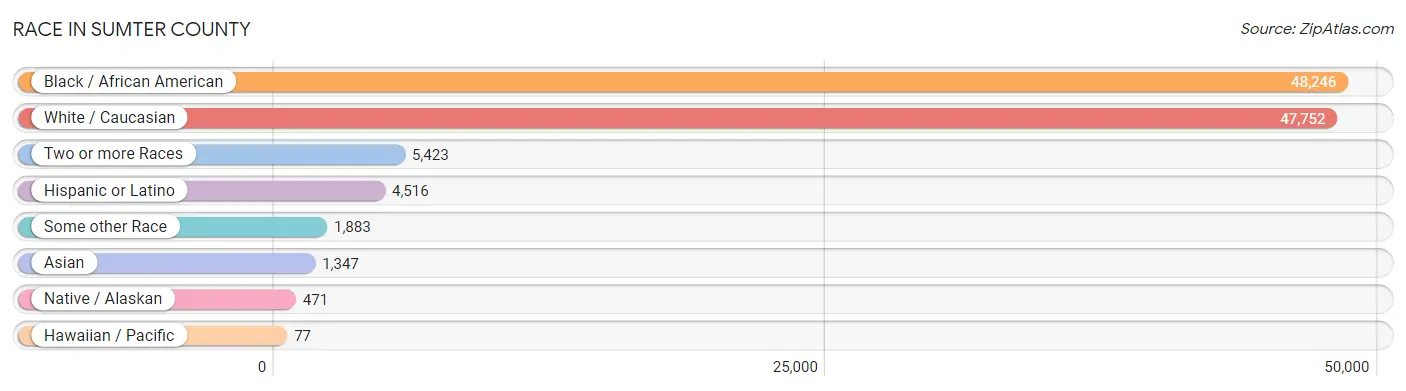
| Race | # Population | % Population |
| Asian | 1,347 | 1.3% |
| Black / African American | 48,246 | 45.9% |
| Hawaiian / Pacific | 77 | 0.1% |
| Hispanic or Latino | 4,516 | 4.3% |
| Native / Alaskan | 471 | 0.4% |
| White / Caucasian | 47,752 | 45.4% |
| Two or more Races | 5,423 | 5.1% |
| Some other Race | 1,883 | 1.8% |
| Total | 105,199 | 100.0% |
Ancestry in Sumter County
The most populous ancestries reported in Sumter County are English (7,239 | 6.9%), American (6,708 | 6.4%), German (6,105 | 5.8%), Irish (5,354 | 5.1%), and Mexican (2,608 | 2.5%), together accounting for 26.6% of all Sumter County residents.
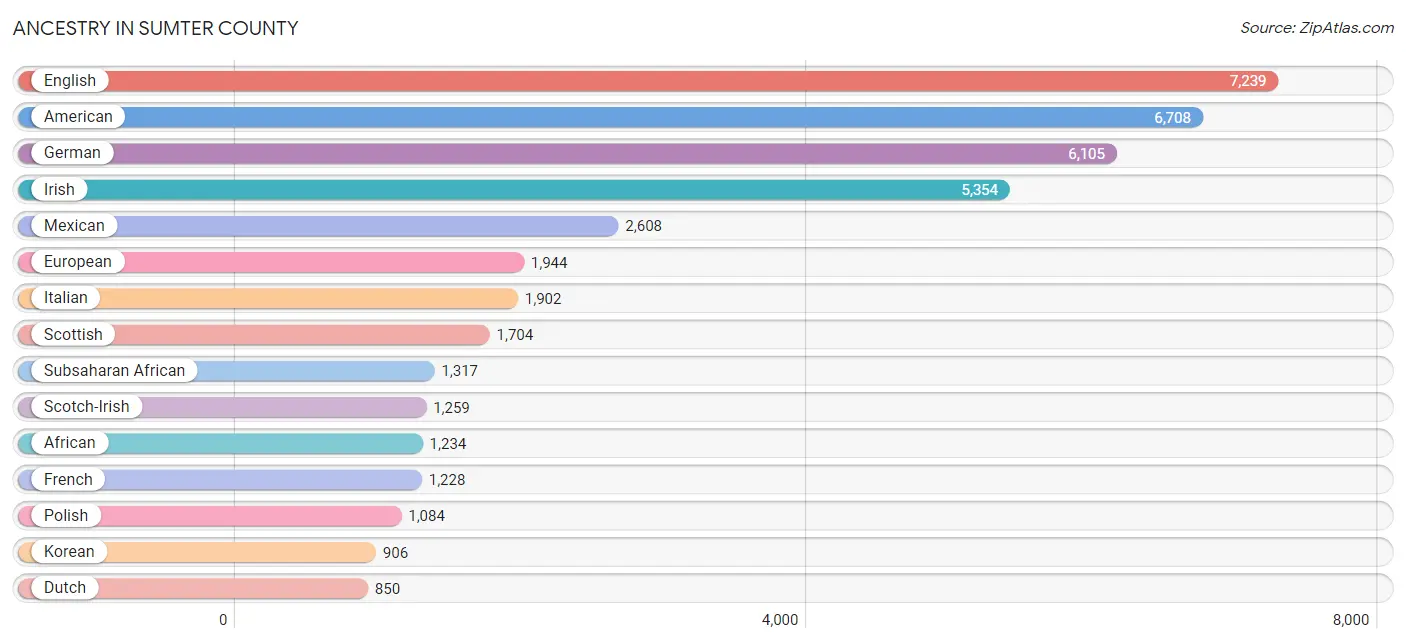
| Ancestry | # Population | % Population |
| African | 1,234 | 1.2% |
| American | 6,708 | 6.4% |
| Arab | 46 | 0.0% |
| Armenian | 19 | 0.0% |
| Austrian | 43 | 0.0% |
| Bahamian | 21 | 0.0% |
| Bangladeshi | 22 | 0.0% |
| Belgian | 16 | 0.0% |
| Bhutanese | 107 | 0.1% |
| Blackfeet | 23 | 0.0% |
| Brazilian | 33 | 0.0% |
| British | 378 | 0.4% |
| British West Indian | 19 | 0.0% |
| Burmese | 60 | 0.1% |
| Cajun | 37 | 0.0% |
| Canadian | 163 | 0.2% |
| Celtic | 17 | 0.0% |
| Central American | 456 | 0.4% |
| Central American Indian | 58 | 0.1% |
| Cherokee | 327 | 0.3% |
| Choctaw | 18 | 0.0% |
| Colombian | 42 | 0.0% |
| Costa Rican | 12 | 0.0% |
| Creek | 23 | 0.0% |
| Croatian | 34 | 0.0% |
| Crow | 5 | 0.0% |
| Cuban | 247 | 0.2% |
| Czech | 102 | 0.1% |
| Czechoslovakian | 9 | 0.0% |
| Danish | 115 | 0.1% |
| Dominican | 1 | 0.0% |
| Dutch | 850 | 0.8% |
| Eastern European | 58 | 0.1% |
| English | 7,239 | 6.9% |
| European | 1,944 | 1.8% |
| Finnish | 169 | 0.2% |
| French | 1,228 | 1.2% |
| French Canadian | 143 | 0.1% |
| German | 6,105 | 5.8% |
| Greek | 102 | 0.1% |
| Guatemalan | 9 | 0.0% |
| Haitian | 12 | 0.0% |
| Honduran | 21 | 0.0% |
| Houma | 55 | 0.1% |
| Hungarian | 34 | 0.0% |
| Indian (Asian) | 208 | 0.2% |
| Irish | 5,354 | 5.1% |
| Iroquois | 54 | 0.1% |
| Italian | 1,902 | 1.8% |
| Jamaican | 161 | 0.2% |
| Japanese | 6 | 0.0% |
| Korean | 906 | 0.9% |
| Laotian | 37 | 0.0% |
| Lebanese | 29 | 0.0% |
| Lithuanian | 26 | 0.0% |
| Lumbee | 12 | 0.0% |
| Malaysian | 178 | 0.2% |
| Maltese | 8 | 0.0% |
| Mexican | 2,608 | 2.5% |
| Mexican American Indian | 318 | 0.3% |
| Native Hawaiian | 18 | 0.0% |
| Nigerian | 74 | 0.1% |
| Northern European | 286 | 0.3% |
| Norwegian | 399 | 0.4% |
| Pakistani | 88 | 0.1% |
| Panamanian | 390 | 0.4% |
| Pennsylvania German | 4 | 0.0% |
| Peruvian | 47 | 0.0% |
| Polish | 1,084 | 1.0% |
| Portuguese | 259 | 0.3% |
| Puerto Rican | 651 | 0.6% |
| Romanian | 174 | 0.2% |
| Russian | 210 | 0.2% |
| Salvadoran | 24 | 0.0% |
| Samoan | 86 | 0.1% |
| Scandinavian | 150 | 0.1% |
| Scotch-Irish | 1,259 | 1.2% |
| Scottish | 1,704 | 1.6% |
| Serbian | 53 | 0.1% |
| Sioux | 19 | 0.0% |
| Slovak | 23 | 0.0% |
| Slovene | 9 | 0.0% |
| South American | 98 | 0.1% |
| Spanish | 78 | 0.1% |
| Sri Lankan | 311 | 0.3% |
| Subsaharan African | 1,317 | 1.3% |
| Swedish | 474 | 0.4% |
| Swiss | 32 | 0.0% |
| Syrian | 17 | 0.0% |
| Thai | 321 | 0.3% |
| Trinidadian and Tobagonian | 27 | 0.0% |
| Turkish | 288 | 0.3% |
| Ukrainian | 25 | 0.0% |
| Venezuelan | 9 | 0.0% |
| Welsh | 235 | 0.2% |
| West Indian | 11 | 0.0% |
| Yugoslavian | 32 | 0.0% | View All 97 Rows |
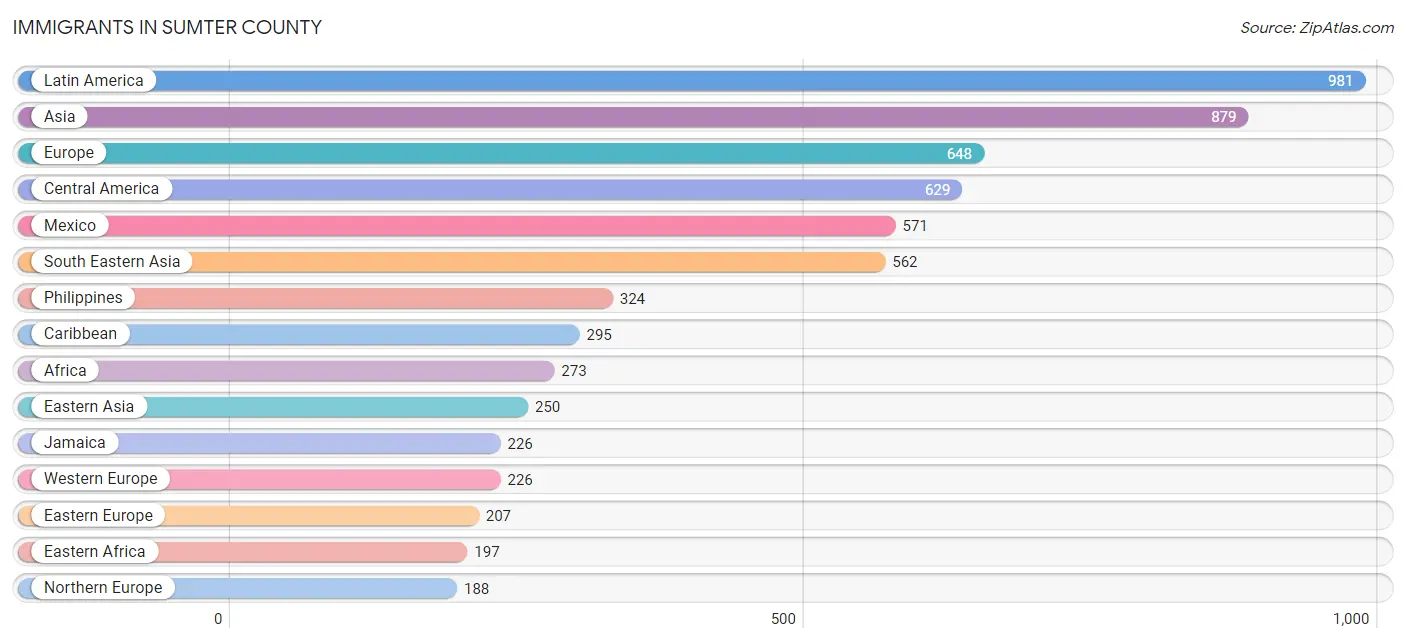
Immigrants in Sumter County
The most numerous immigrant groups reported in Sumter County came from Latin America (981 | 0.9%), Asia (879 | 0.8%), Europe (648 | 0.6%), Central America (629 | 0.6%), and Mexico (571 | 0.5%), together accounting for 3.5% of all Sumter County residents.
| Immigration Origin | # Population | % Population |
| Africa | 273 | 0.3% |
| Asia | 879 | 0.8% |
| Austria | 1 | 0.0% |
| Azores | 8 | 0.0% |
| Bosnia and Herzegovina | 32 | 0.0% |
| Brazil | 6 | 0.0% |
| Canada | 105 | 0.1% |
| Caribbean | 295 | 0.3% |
| Central America | 629 | 0.6% |
| China | 177 | 0.2% |
| Colombia | 20 | 0.0% |
| Costa Rica | 6 | 0.0% |
| Cuba | 9 | 0.0% |
| Dominica | 26 | 0.0% |
| Eastern Africa | 197 | 0.2% |
| Eastern Asia | 250 | 0.2% |
| Eastern Europe | 207 | 0.2% |
| El Salvador | 24 | 0.0% |
| England | 175 | 0.2% |
| Europe | 648 | 0.6% |
| France | 50 | 0.1% |
| Germany | 175 | 0.2% |
| Guatemala | 9 | 0.0% |
| India | 26 | 0.0% |
| Indonesia | 37 | 0.0% |
| Italy | 19 | 0.0% |
| Jamaica | 226 | 0.2% |
| Japan | 16 | 0.0% |
| Kenya | 164 | 0.2% |
| Korea | 57 | 0.1% |
| Laos | 42 | 0.0% |
| Latin America | 981 | 0.9% |
| Lebanon | 19 | 0.0% |
| Mexico | 571 | 0.5% |
| Nigeria | 22 | 0.0% |
| Northern Europe | 188 | 0.2% |
| Oceania | 45 | 0.0% |
| Panama | 19 | 0.0% |
| Peru | 22 | 0.0% |
| Philippines | 324 | 0.3% |
| Poland | 21 | 0.0% |
| Portugal | 8 | 0.0% |
| Romania | 68 | 0.1% |
| Russia | 86 | 0.1% |
| South America | 57 | 0.1% |
| South Central Asia | 26 | 0.0% |
| South Eastern Asia | 562 | 0.5% |
| Southern Europe | 27 | 0.0% |
| Sweden | 13 | 0.0% |
| Syria | 9 | 0.0% |
| Taiwan | 12 | 0.0% |
| Thailand | 16 | 0.0% |
| Trinidad and Tobago | 15 | 0.0% |
| Venezuela | 9 | 0.0% |
| Vietnam | 143 | 0.1% |
| Western Africa | 22 | 0.0% |
| Western Asia | 41 | 0.0% |
| Western Europe | 226 | 0.2% |
| Yemen | 13 | 0.0% | View All 59 Rows |
Sex and Age in Sumter County
Sex and Age in Sumter County
The most populous age groups in Sumter County are 20 to 24 Years (4,149 | 8.1%) for men and 20 to 24 Years (3,864 | 7.1%) for women.
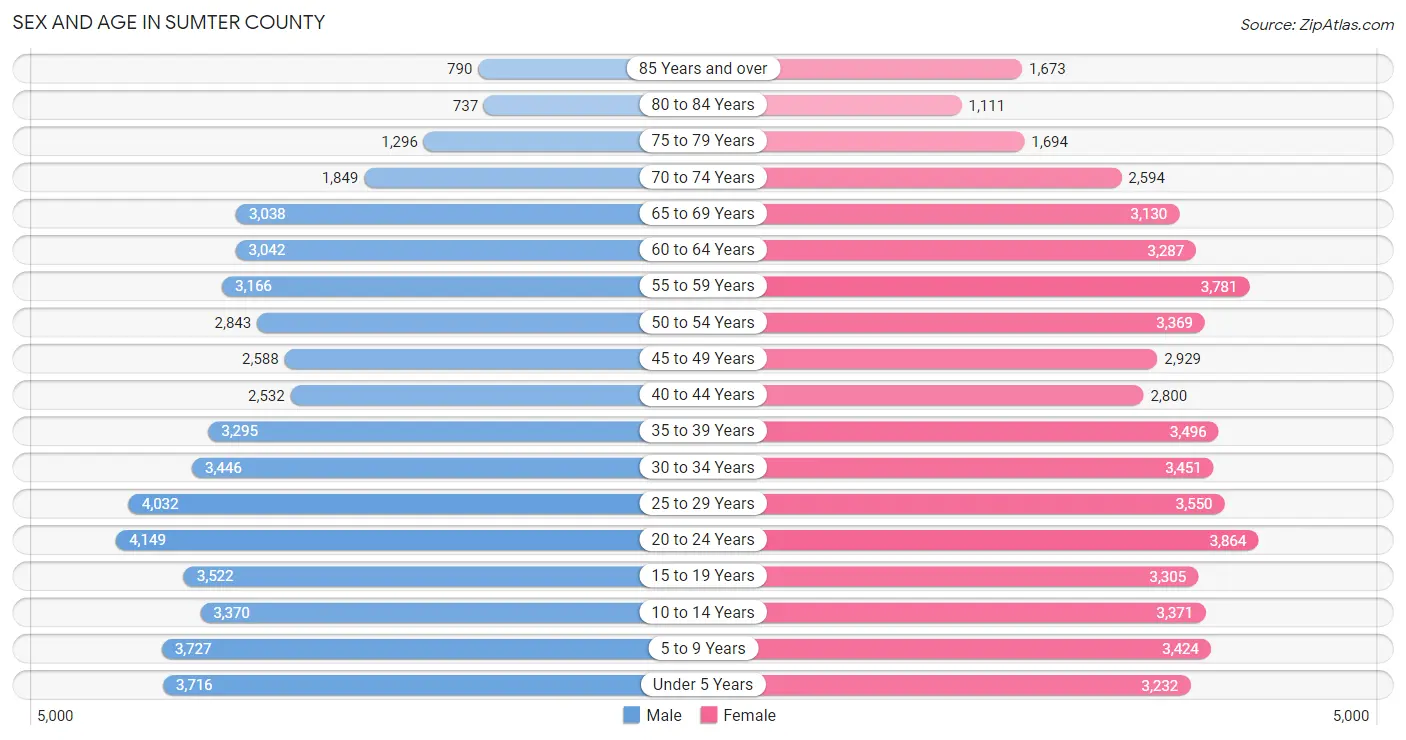
| Age Bracket | Male | Female |
| Under 5 Years | 3,716 (7.3%) | 3,232 (6.0%) |
| 5 to 9 Years | 3,727 (7.3%) | 3,424 (6.3%) |
| 10 to 14 Years | 3,370 (6.6%) | 3,371 (6.2%) |
| 15 to 19 Years | 3,522 (6.9%) | 3,305 (6.1%) |
| 20 to 24 Years | 4,149 (8.1%) | 3,864 (7.1%) |
| 25 to 29 Years | 4,032 (7.9%) | 3,550 (6.6%) |
| 30 to 34 Years | 3,446 (6.7%) | 3,451 (6.4%) |
| 35 to 39 Years | 3,295 (6.4%) | 3,496 (6.5%) |
| 40 to 44 Years | 2,532 (5.0%) | 2,800 (5.2%) |
| 45 to 49 Years | 2,588 (5.1%) | 2,929 (5.4%) |
| 50 to 54 Years | 2,843 (5.6%) | 3,369 (6.2%) |
| 55 to 59 Years | 3,166 (6.2%) | 3,781 (7.0%) |
| 60 to 64 Years | 3,042 (5.9%) | 3,287 (6.1%) |
| 65 to 69 Years | 3,038 (5.9%) | 3,130 (5.8%) |
| 70 to 74 Years | 1,849 (3.6%) | 2,594 (4.8%) |
| 75 to 79 Years | 1,296 (2.5%) | 1,694 (3.1%) |
| 80 to 84 Years | 737 (1.4%) | 1,111 (2.1%) |
| 85 Years and over | 790 (1.5%) | 1,673 (3.1%) |
| Total | 51,138 (100.0%) | 54,061 (100.0%) |
Families and Households in Sumter County
Median Family Size in Sumter County
The median family size in Sumter County is 3.18 persons per family, with single female/mother families (6,841 | 25.6%) accounting for the largest median family size of 3.43 persons per family. On the other hand, single male/father families (1,984 | 7.4%) represent the smallest median family size with 2.84 persons per family.
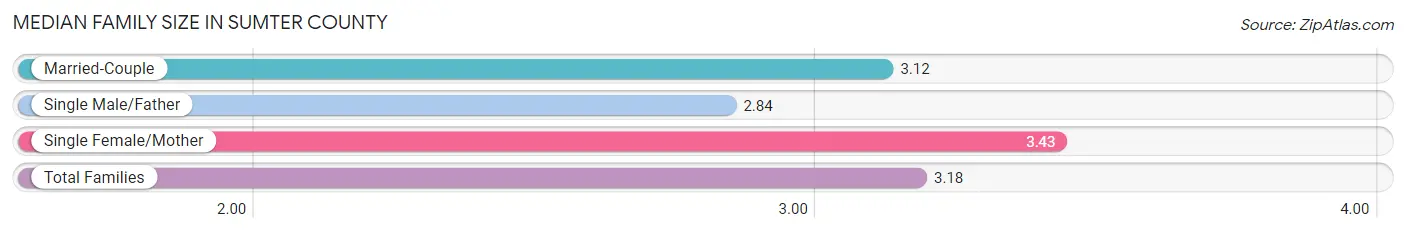
| Family Type | # Families | Family Size |
| Married-Couple | 17,938 (67.0%) | 3.12 |
| Single Male/Father | 1,984 (7.4%) | 2.84 |
| Single Female/Mother | 6,841 (25.6%) | 3.43 |
| Total Families | 26,763 (100.0%) | 3.18 |
Median Household Size in Sumter County
The median household size in Sumter County is 2.51 persons per household, with single female/mother households (6,841 | 16.7%) accounting for the largest median household size of 3.55 persons per household. non-family households (14,154 | 34.6%) represent the smallest median household size with 1.11 persons per household.
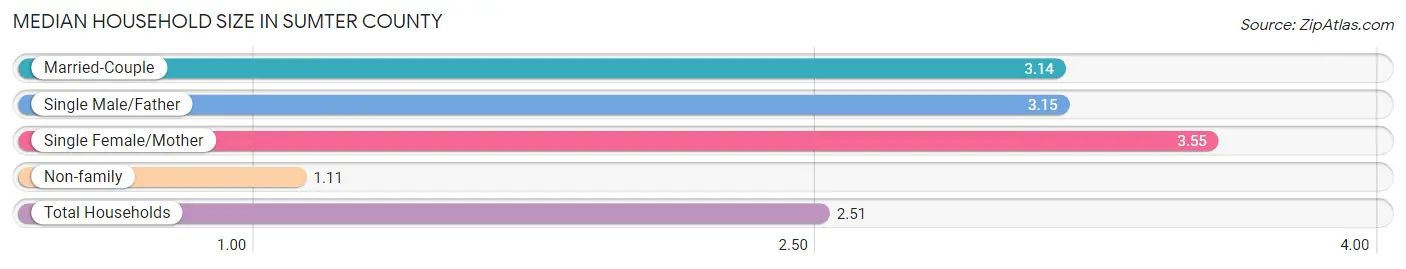
| Household Type | # Households | Household Size |
| Married-Couple | 17,938 (43.8%) | 3.14 |
| Single Male/Father | 1,984 (4.9%) | 3.15 |
| Single Female/Mother | 6,841 (16.7%) | 3.55 |
| Non-family | 14,154 (34.6%) | 1.11 |
| Total Households | 40,917 (100.0%) | 2.51 |
Household Size by Marriage Status in Sumter County
Out of a total of 40,917 households in Sumter County, 26,763 (65.4%) are family households, while 14,154 (34.6%) are nonfamily households. The most numerous type of family households are 2-person households, comprising 11,954, and the most common type of nonfamily households are 1-person households, comprising 12,786.
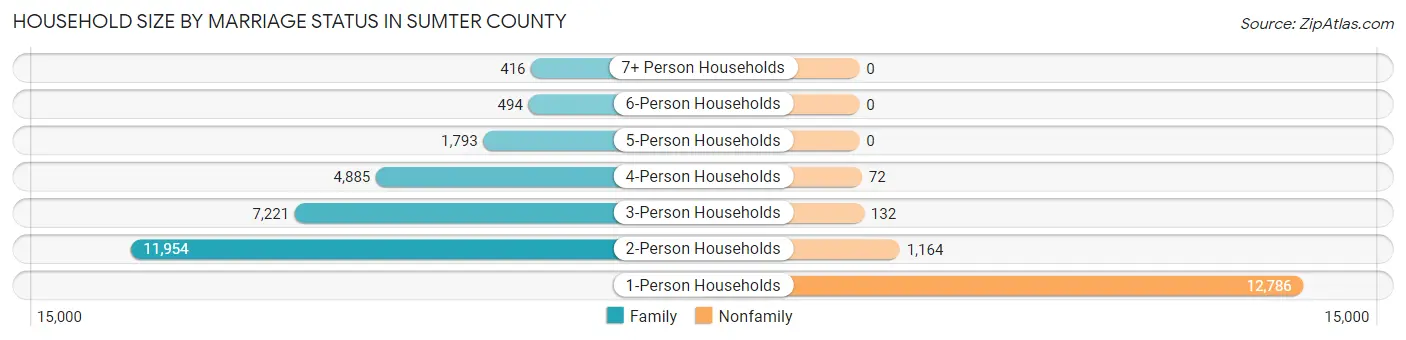
| Household Size | Family Households | Nonfamily Households |
| 1-Person Households | - | 12,786 (31.2%) |
| 2-Person Households | 11,954 (29.2%) | 1,164 (2.8%) |
| 3-Person Households | 7,221 (17.6%) | 132 (0.3%) |
| 4-Person Households | 4,885 (11.9%) | 72 (0.2%) |
| 5-Person Households | 1,793 (4.4%) | 0 (0.0%) |
| 6-Person Households | 494 (1.2%) | 0 (0.0%) |
| 7+ Person Households | 416 (1.0%) | 0 (0.0%) |
| Total | 26,763 (65.4%) | 14,154 (34.6%) |
Female Fertility in Sumter County
Fertility by Age in Sumter County
Average fertility rate in Sumter County is 66.0 births per 1,000 women. Women in the age bracket of 20 to 34 years have the highest fertility rate with 142.0 births per 1,000 women. Women in the age bracket of 20 to 34 years acount for 96.5% of all women with births.
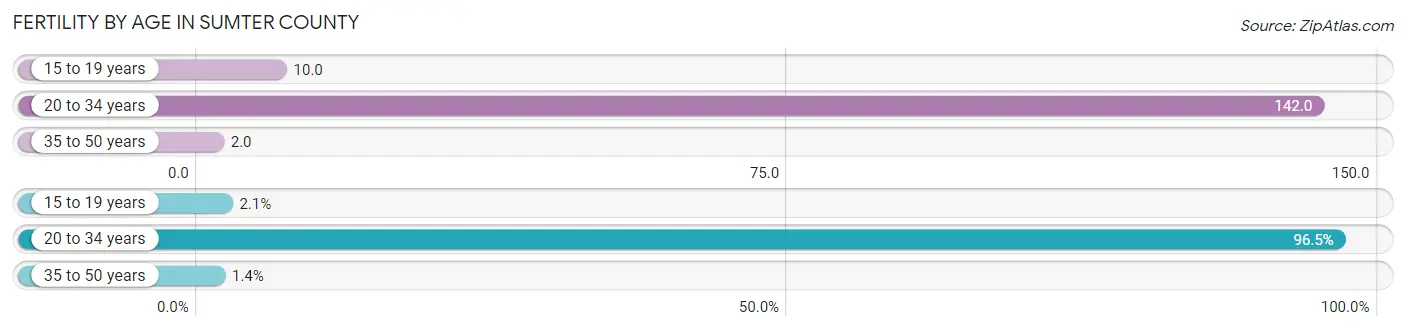
| Age Bracket | Women with Births | Births / 1,000 Women |
| 15 to 19 years | 33 (2.1%) | 10.0 |
| 20 to 34 years | 1,541 (96.5%) | 142.0 |
| 35 to 50 years | 23 (1.4%) | 2.0 |
| Total | 1,597 (100.0%) | 66.0 |
Fertility by Age by Marriage Status in Sumter County
46.3% of women with births (1,597) in Sumter County are married. The highest percentage of unmarried women with births falls into 15 to 19 years age bracket with 69.7% of them unmarried at the time of birth, while the lowest percentage of unmarried women with births belong to 35 to 50 years age bracket with 0.0% of them unmarried.
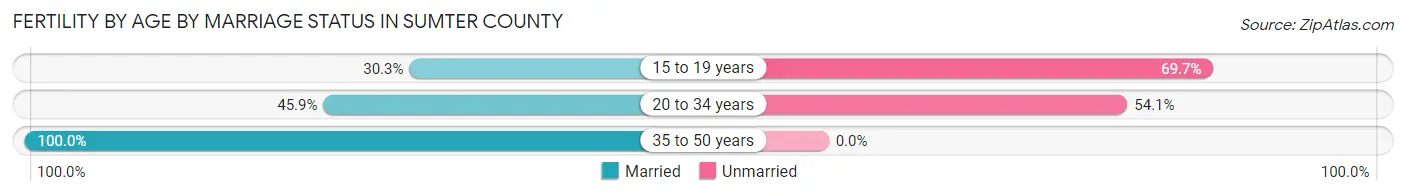
| Age Bracket | Married | Unmarried |
| 15 to 19 years | 10 (30.3%) | 23 (69.7%) |
| 20 to 34 years | 707 (45.9%) | 834 (54.1%) |
| 35 to 50 years | 23 (100.0%) | 0 (0.0%) |
| Total | 739 (46.3%) | 858 (53.7%) |
Fertility by Education in Sumter County
Average fertility rate in Sumter County is 66.0 births per 1,000 women. Women with the education attainment of college or associate's degree have the highest fertility rate of 87.0 births per 1,000 women, while women with the education attainment of graduate degree have the lowest fertility at 28.0 births per 1,000 women. Women with the education attainment of college or associate's degree represent 49.2% of all women with births.
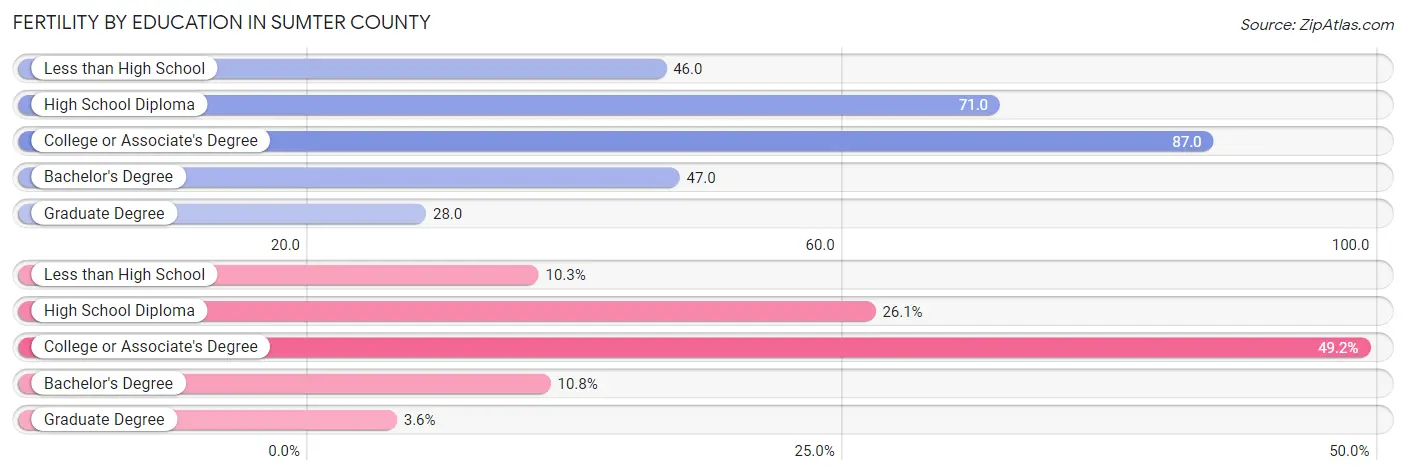
| Educational Attainment | Women with Births | Births / 1,000 Women |
| Less than High School | 164 (10.3%) | 46.0 |
| High School Diploma | 416 (26.1%) | 71.0 |
| College or Associate's Degree | 786 (49.2%) | 87.0 |
| Bachelor's Degree | 173 (10.8%) | 47.0 |
| Graduate Degree | 58 (3.6%) | 28.0 |
| Total | 1,597 (100.0%) | 66.0 |
Fertility by Education by Marriage Status in Sumter County
53.7% of women with births in Sumter County are unmarried. Women with the educational attainment of graduate degree are most likely to be married with 100.0% of them married at childbirth, while women with the educational attainment of high school diploma are least likely to be married with 71.6% of them unmarried at childbirth.
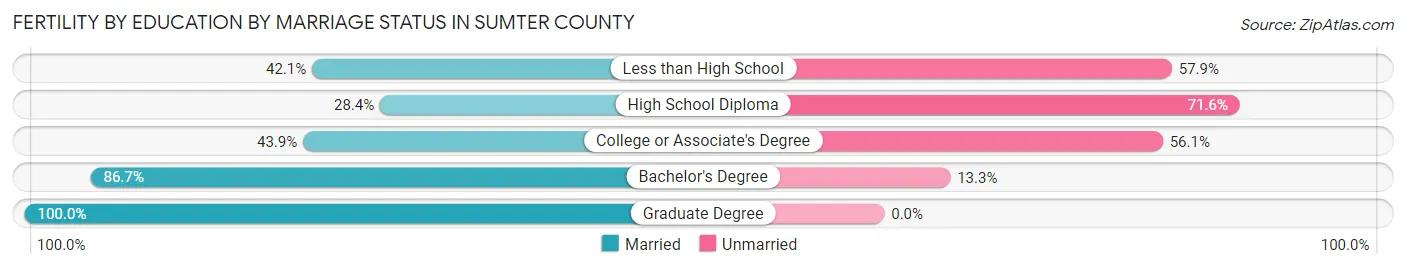
| Educational Attainment | Married | Unmarried |
| Less than High School | 69 (42.1%) | 95 (57.9%) |
| High School Diploma | 118 (28.4%) | 298 (71.6%) |
| College or Associate's Degree | 345 (43.9%) | 441 (56.1%) |
| Bachelor's Degree | 150 (86.7%) | 23 (13.3%) |
| Graduate Degree | 58 (100.0%) | 0 (0.0%) |
| Total | 739 (46.3%) | 858 (53.7%) |
Employment Characteristics in Sumter County
Employment by Class of Employer in Sumter County
Among the 45,080 employed individuals in Sumter County, private company employees (26,067 | 57.8%), federal government employees (6,231 | 13.8%), and not-for-profit organizations (3,692 | 8.2%) make up the most common classes of employment.
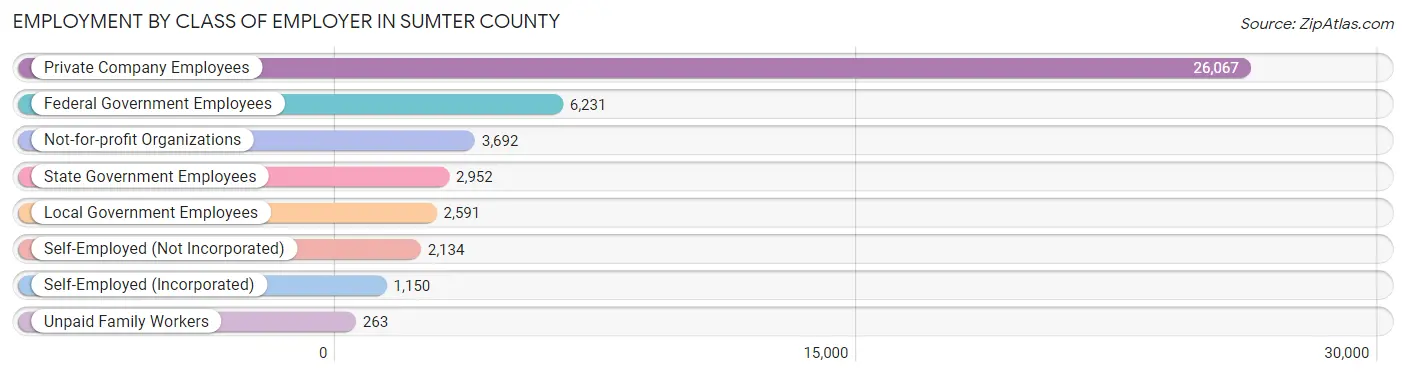
| Employer Class | # Employees | % Employees |
| Private Company Employees | 26,067 | 57.8% |
| Self-Employed (Incorporated) | 1,150 | 2.5% |
| Self-Employed (Not Incorporated) | 2,134 | 4.7% |
| Not-for-profit Organizations | 3,692 | 8.2% |
| Local Government Employees | 2,591 | 5.8% |
| State Government Employees | 2,952 | 6.6% |
| Federal Government Employees | 6,231 | 13.8% |
| Unpaid Family Workers | 263 | 0.6% |
| Total | 45,080 | 100.0% |
Employment Status by Age in Sumter County
According to the labor force statistics for Sumter County, out of the total population over 16 years of age (82,962), 59.1% or 49,031 individuals are in the labor force, with 7.2% or 3,530 of them unemployed. The age group with the highest labor force participation rate is 25 to 29 years, with 84.3% or 6,392 individuals in the labor force. Within the labor force, the 16 to 19 years age range has the highest percentage of unemployed individuals, with 17.0% or 289 of them being unemployed.
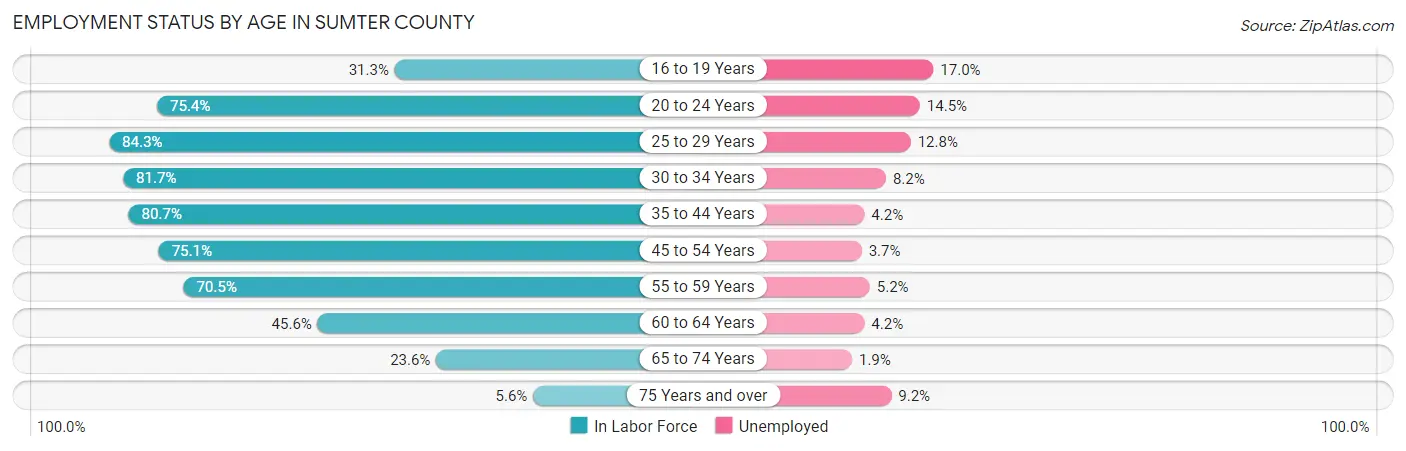
| Age Bracket | In Labor Force | Unemployed |
| 16 to 19 Years | 1,700 (31.3%) | 289 (17.0%) |
| 20 to 24 Years | 6,042 (75.4%) | 876 (14.5%) |
| 25 to 29 Years | 6,392 (84.3%) | 818 (12.8%) |
| 30 to 34 Years | 5,635 (81.7%) | 462 (8.2%) |
| 35 to 44 Years | 9,783 (80.7%) | 411 (4.2%) |
| 45 to 54 Years | 8,808 (75.1%) | 326 (3.7%) |
| 55 to 59 Years | 4,898 (70.5%) | 255 (5.2%) |
| 60 to 64 Years | 2,886 (45.6%) | 121 (4.2%) |
| 65 to 74 Years | 2,504 (23.6%) | 48 (1.9%) |
| 75 Years and over | 409 (5.6%) | 38 (9.2%) |
| Total | 49,031 (59.1%) | 3,530 (7.2%) |
Employment Status by Educational Attainment in Sumter County
According to labor force statistics for Sumter County, 74.4% of individuals (38,396) out of the total population between 25 and 64 years of age (51,607) are in the labor force, with 6.1% or 2,342 of them being unemployed. The group with the highest labor force participation rate are those with the educational attainment of bachelor's degree or higher, with 83.6% or 10,183 individuals in the labor force. Within the labor force, individuals with high school diploma education have the highest percentage of unemployment, with 8.4% or 936 of them being unemployed.
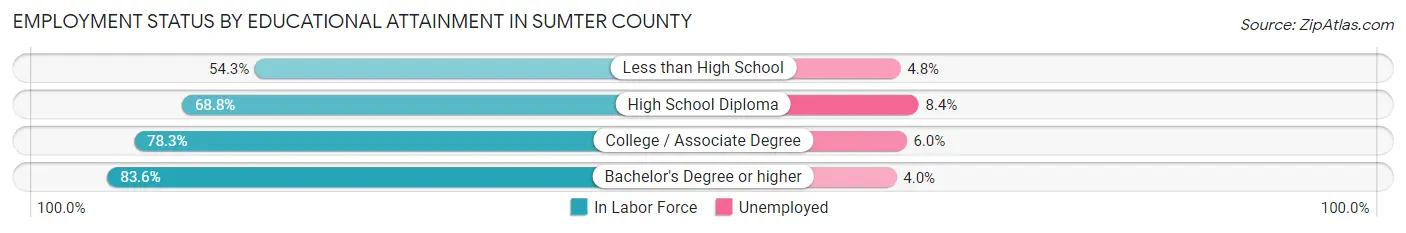
| Educational Attainment | In Labor Force | Unemployed |
| Less than High School | 2,504 (54.3%) | 221 (4.8%) |
| High School Diploma | 11,140 (68.8%) | 1,360 (8.4%) |
| College / Associate Degree | 14,581 (78.3%) | 1,117 (6.0%) |
| Bachelor's Degree or higher | 10,183 (83.6%) | 487 (4.0%) |
| Total | 38,396 (74.4%) | 3,148 (6.1%) |
Employment Occupations by Sex in Sumter County
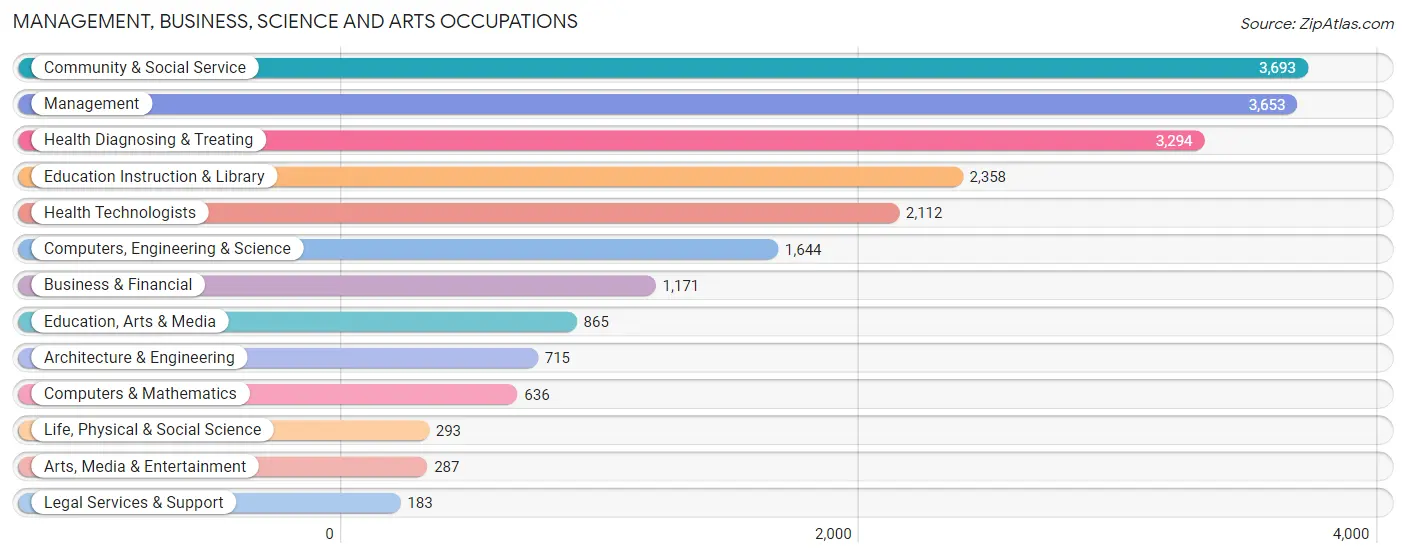
Management, Business, Science and Arts Occupations
The most common Management, Business, Science and Arts occupations in Sumter County are Community & Social Service (3,693 | 8.8%), Management (3,653 | 8.7%), Health Diagnosing & Treating (3,294 | 7.8%), Education Instruction & Library (2,358 | 5.6%), and Health Technologists (2,112 | 5.0%).
Management, Business, Science and Arts Occupations by Sex
Within the Management, Business, Science and Arts occupations in Sumter County, the most male-oriented occupations are Architecture & Engineering (91.3%), Computers, Engineering & Science (83.5%), and Computers & Mathematics (79.6%), while the most female-oriented occupations are Health Technologists (87.2%), Health Diagnosing & Treating (86.0%), and Education Instruction & Library (80.5%).

| Occupation | Male | Female |
| Management | 1,798 (49.2%) | 1,855 (50.8%) |
| Business & Financial | 456 (38.9%) | 715 (61.1%) |
| Computers, Engineering & Science | 1,372 (83.5%) | 272 (16.6%) |
| Computers & Mathematics | 506 (79.6%) | 130 (20.4%) |
| Architecture & Engineering | 653 (91.3%) | 62 (8.7%) |
| Life, Physical & Social Science | 213 (72.7%) | 80 (27.3%) |
| Community & Social Service | 893 (24.2%) | 2,800 (75.8%) |
| Education, Arts & Media | 196 (22.7%) | 669 (77.3%) |
| Legal Services & Support | 91 (49.7%) | 92 (50.3%) |
| Education Instruction & Library | 460 (19.5%) | 1,898 (80.5%) |
| Arts, Media & Entertainment | 146 (50.9%) | 141 (49.1%) |
| Health Diagnosing & Treating | 460 (14.0%) | 2,834 (86.0%) |
| Health Technologists | 271 (12.8%) | 1,841 (87.2%) |
| Total (Category) | 4,979 (37.0%) | 8,476 (63.0%) |
| Total (Overall) | 20,550 (48.9%) | 21,480 (51.1%) |
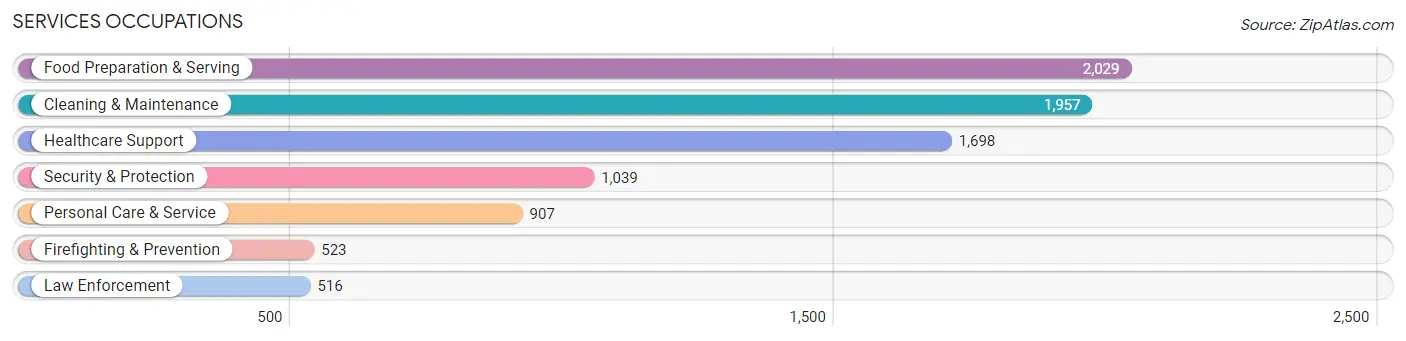
Services Occupations
The most common Services occupations in Sumter County are Food Preparation & Serving (2,029 | 4.8%), Cleaning & Maintenance (1,957 | 4.7%), Healthcare Support (1,698 | 4.0%), Security & Protection (1,039 | 2.5%), and Personal Care & Service (907 | 2.2%).
Services Occupations by Sex
Within the Services occupations in Sumter County, the most male-oriented occupations are Firefighting & Prevention (82.2%), Security & Protection (80.1%), and Law Enforcement (77.9%), while the most female-oriented occupations are Healthcare Support (91.6%), Personal Care & Service (81.4%), and Food Preparation & Serving (64.2%).
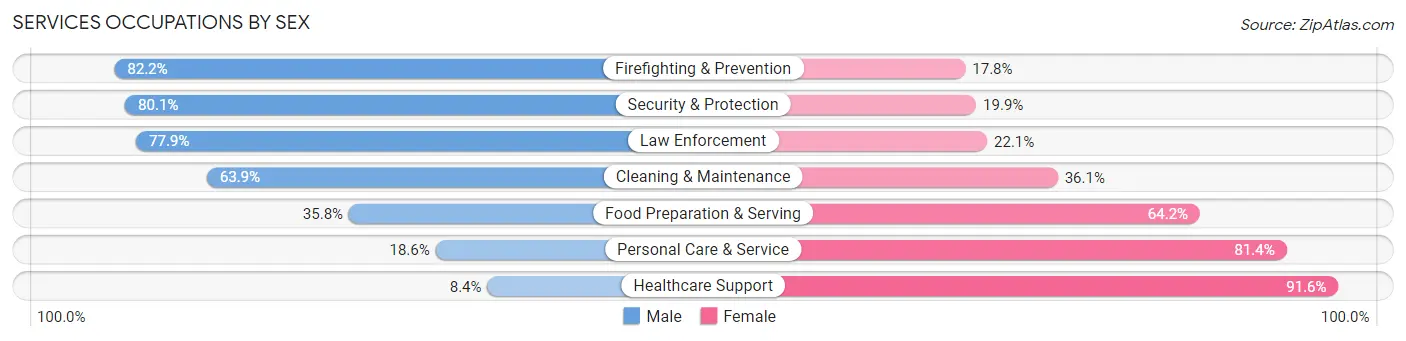
| Occupation | Male | Female |
| Healthcare Support | 142 (8.4%) | 1,556 (91.6%) |
| Security & Protection | 832 (80.1%) | 207 (19.9%) |
| Firefighting & Prevention | 430 (82.2%) | 93 (17.8%) |
| Law Enforcement | 402 (77.9%) | 114 (22.1%) |
| Food Preparation & Serving | 726 (35.8%) | 1,303 (64.2%) |
| Cleaning & Maintenance | 1,251 (63.9%) | 706 (36.1%) |
| Personal Care & Service | 169 (18.6%) | 738 (81.4%) |
| Total (Category) | 3,120 (40.9%) | 4,510 (59.1%) |
| Total (Overall) | 20,550 (48.9%) | 21,480 (51.1%) |
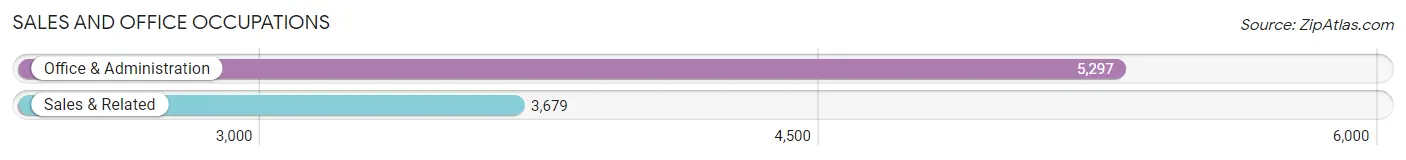
Sales and Office Occupations
The most common Sales and Office occupations in Sumter County are Office & Administration (5,297 | 12.6%), and Sales & Related (3,679 | 8.7%).
Sales and Office Occupations by Sex
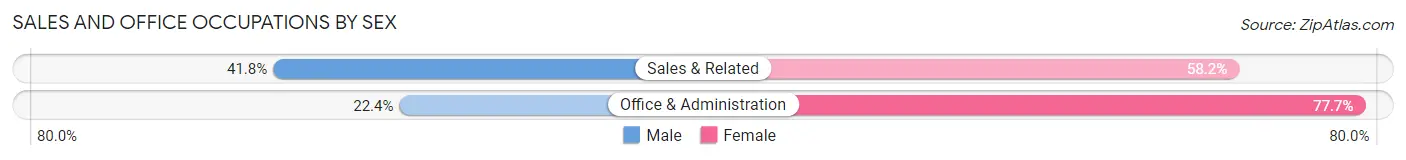
| Occupation | Male | Female |
| Sales & Related | 1,537 (41.8%) | 2,142 (58.2%) |
| Office & Administration | 1,184 (22.4%) | 4,113 (77.6%) |
| Total (Category) | 2,721 (30.3%) | 6,255 (69.7%) |
| Total (Overall) | 20,550 (48.9%) | 21,480 (51.1%) |
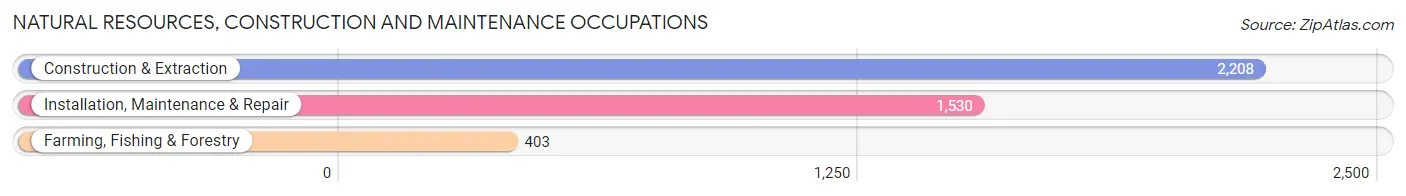
Natural Resources, Construction and Maintenance Occupations
The most common Natural Resources, Construction and Maintenance occupations in Sumter County are Construction & Extraction (2,208 | 5.2%), Installation, Maintenance & Repair (1,530 | 3.6%), and Farming, Fishing & Forestry (403 | 1.0%).
Natural Resources, Construction and Maintenance Occupations by Sex
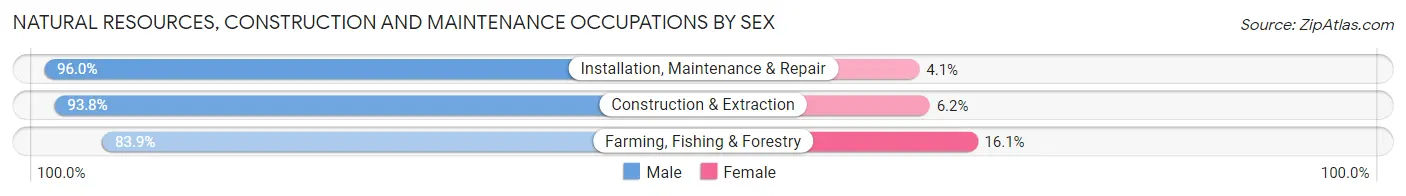
| Occupation | Male | Female |
| Farming, Fishing & Forestry | 338 (83.9%) | 65 (16.1%) |
| Construction & Extraction | 2,071 (93.8%) | 137 (6.2%) |
| Installation, Maintenance & Repair | 1,468 (96.0%) | 62 (4.1%) |
| Total (Category) | 3,877 (93.6%) | 264 (6.4%) |
| Total (Overall) | 20,550 (48.9%) | 21,480 (51.1%) |
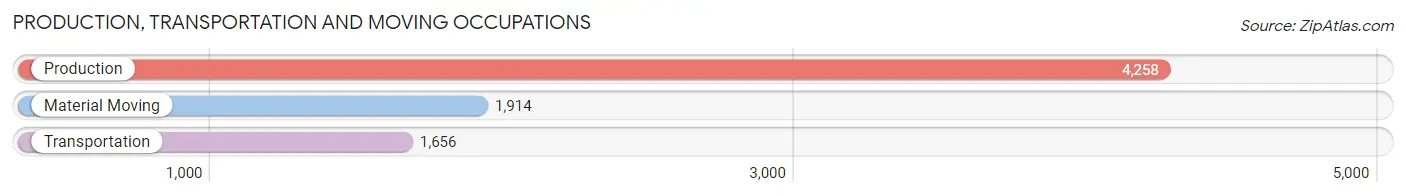
Production, Transportation and Moving Occupations
The most common Production, Transportation and Moving occupations in Sumter County are Production (4,258 | 10.1%), Material Moving (1,914 | 4.5%), and Transportation (1,656 | 3.9%).
Production, Transportation and Moving Occupations by Sex
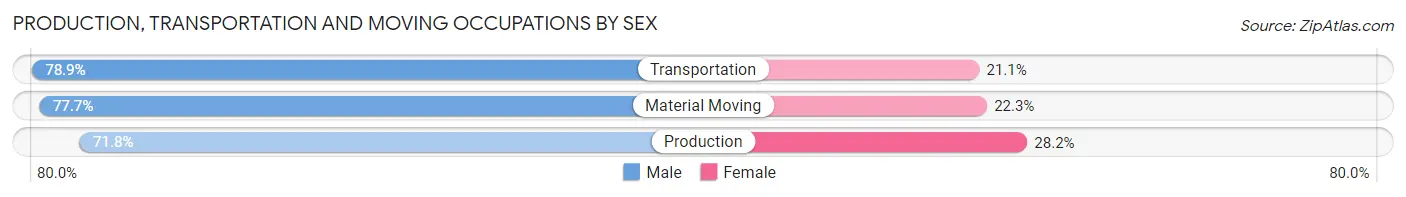
| Occupation | Male | Female |
| Production | 3,059 (71.8%) | 1,199 (28.2%) |
| Transportation | 1,306 (78.9%) | 350 (21.1%) |
| Material Moving | 1,488 (77.7%) | 426 (22.3%) |
| Total (Category) | 5,853 (74.8%) | 1,975 (25.2%) |
| Total (Overall) | 20,550 (48.9%) | 21,480 (51.1%) |
Employment Industries by Sex in Sumter County
Employment Industries in Sumter County
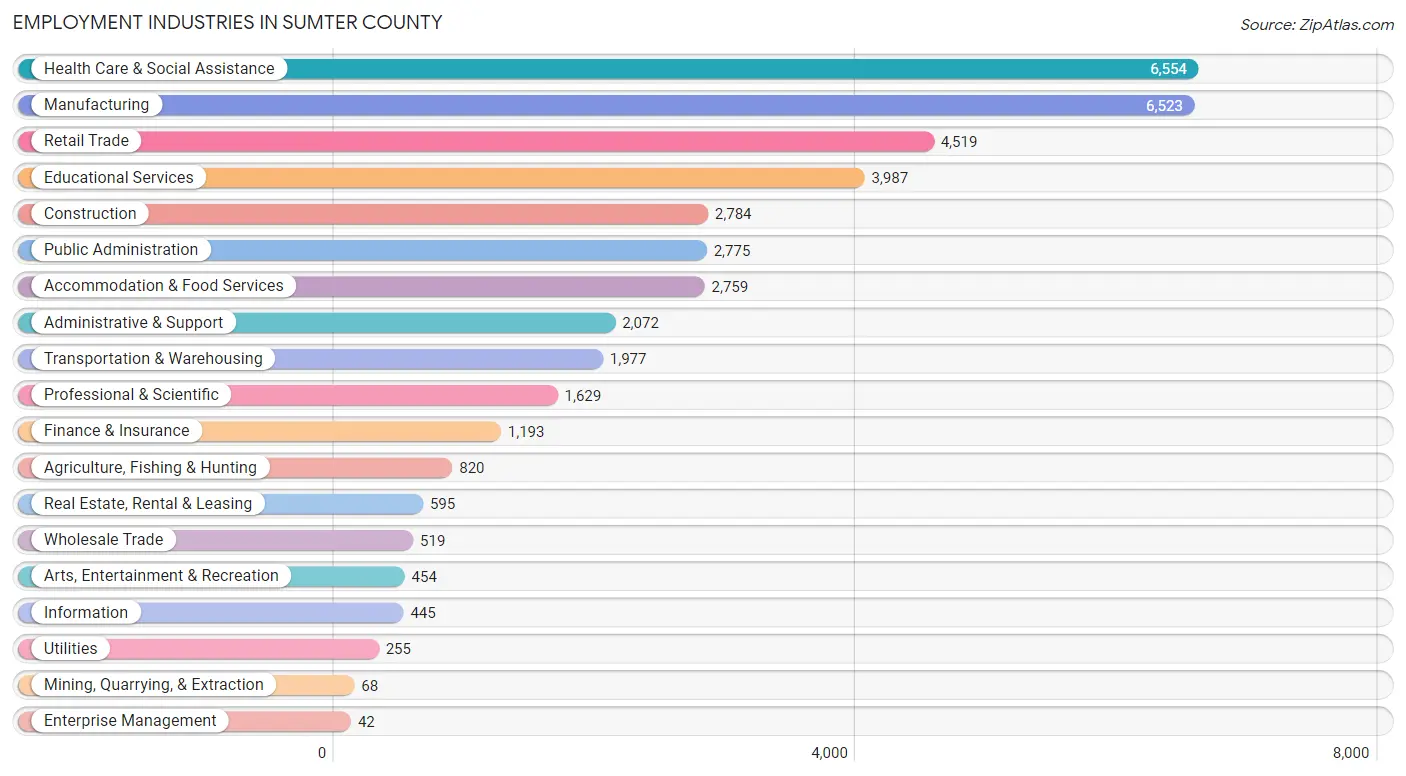
The major employment industries in Sumter County include Health Care & Social Assistance (6,554 | 15.6%), Manufacturing (6,523 | 15.5%), Retail Trade (4,519 | 10.7%), Educational Services (3,987 | 9.5%), and Construction (2,784 | 6.6%).
Employment Industries by Sex in Sumter County
The Sumter County industries that see more men than women are Enterprise Management (100.0%), Mining, Quarrying, & Extraction (92.6%), and Construction (87.9%), whereas the industries that tend to have a higher number of women are Health Care & Social Assistance (86.2%), Finance & Insurance (80.2%), and Educational Services (68.9%).
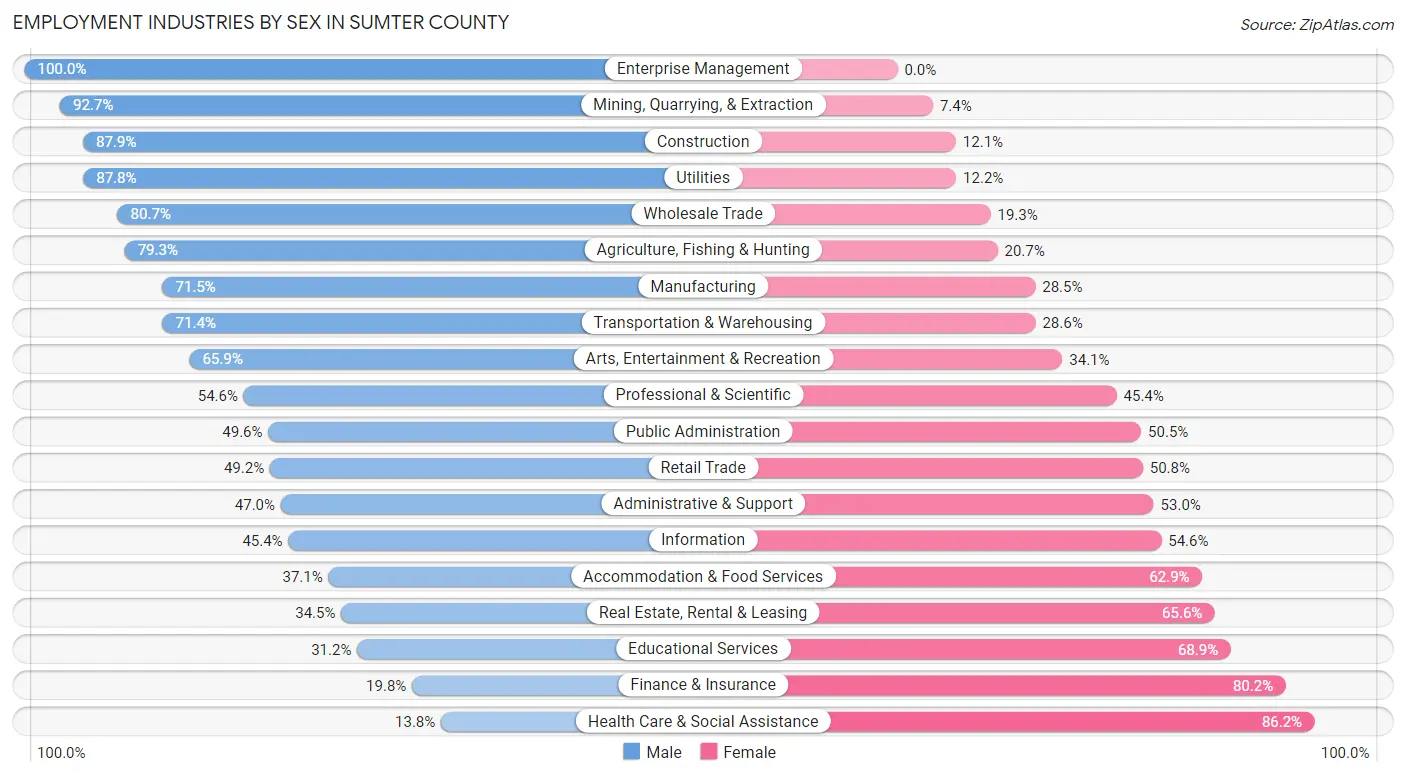
| Industry | Male | Female |
| Agriculture, Fishing & Hunting | 650 (79.3%) | 170 (20.7%) |
| Mining, Quarrying, & Extraction | 63 (92.6%) | 5 (7.3%) |
| Construction | 2,447 (87.9%) | 337 (12.1%) |
| Manufacturing | 4,662 (71.5%) | 1,861 (28.5%) |
| Wholesale Trade | 419 (80.7%) | 100 (19.3%) |
| Retail Trade | 2,224 (49.2%) | 2,295 (50.8%) |
| Transportation & Warehousing | 1,412 (71.4%) | 565 (28.6%) |
| Utilities | 224 (87.8%) | 31 (12.2%) |
| Information | 202 (45.4%) | 243 (54.6%) |
| Finance & Insurance | 236 (19.8%) | 957 (80.2%) |
| Real Estate, Rental & Leasing | 205 (34.4%) | 390 (65.5%) |
| Professional & Scientific | 890 (54.6%) | 739 (45.4%) |
| Enterprise Management | 42 (100.0%) | 0 (0.0%) |
| Administrative & Support | 973 (47.0%) | 1,099 (53.0%) |
| Educational Services | 1,242 (31.1%) | 2,745 (68.9%) |
| Health Care & Social Assistance | 904 (13.8%) | 5,650 (86.2%) |
| Arts, Entertainment & Recreation | 299 (65.9%) | 155 (34.1%) |
| Accommodation & Food Services | 1,023 (37.1%) | 1,736 (62.9%) |
| Public Administration | 1,375 (49.5%) | 1,400 (50.4%) |
| Total | 20,550 (48.9%) | 21,480 (51.1%) |
Education in Sumter County
School Enrollment in Sumter County
The most common levels of schooling among the 25,782 students in Sumter County are elementary school (5,867 | 22.8%), high school (5,674 | 22.0%), and middle school (5,177 | 20.1%).
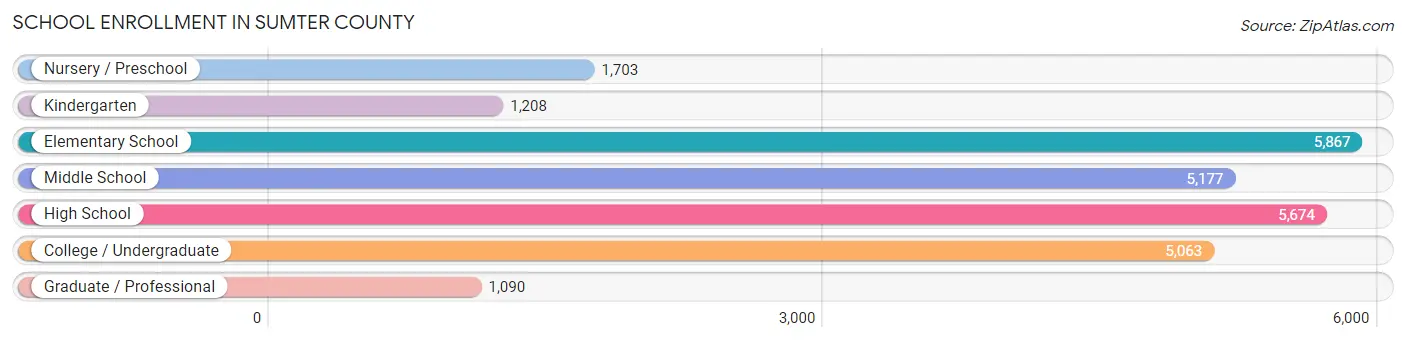
| School Level | # Students | % Students |
| Nursery / Preschool | 1,703 | 6.6% |
| Kindergarten | 1,208 | 4.7% |
| Elementary School | 5,867 | 22.8% |
| Middle School | 5,177 | 20.1% |
| High School | 5,674 | 22.0% |
| College / Undergraduate | 5,063 | 19.6% |
| Graduate / Professional | 1,090 | 4.2% |
| Total | 25,782 | 100.0% |
School Enrollment by Age by Funding Source in Sumter County
Out of a total of 25,782 students who are enrolled in schools in Sumter County, 4,099 (15.9%) attend a private institution, while the remaining 21,683 (84.1%) are enrolled in public schools. The age group of 3 to 4 year olds has the highest likelihood of being enrolled in private schools, with 372 (33.2% in the age bracket) enrolled. Conversely, the age group of 18 to 19 year olds has the lowest likelihood of being enrolled in a private school, with 1,642 (91.6% in the age bracket) attending a public institution.
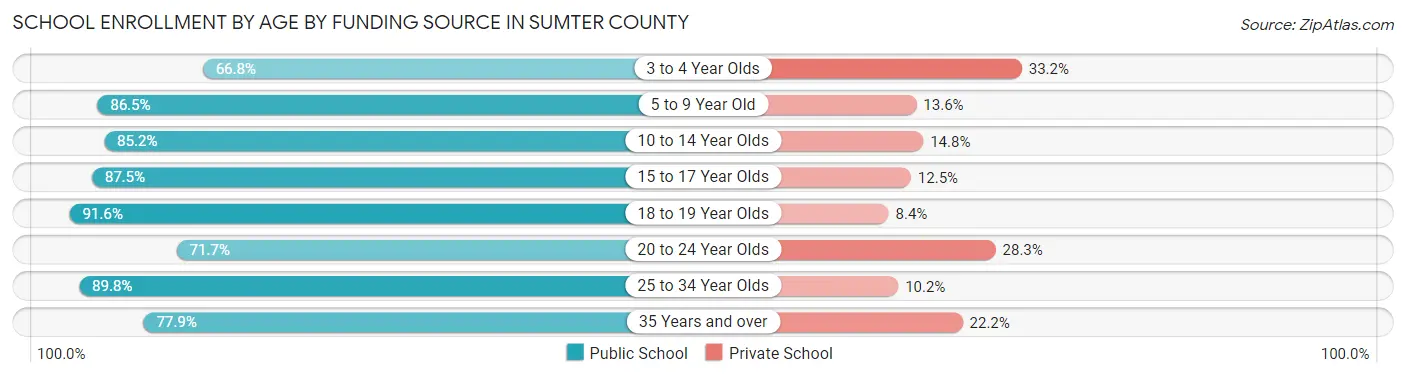
| Age Bracket | Public School | Private School |
| 3 to 4 Year Olds | 749 (66.8%) | 372 (33.2%) |
| 5 to 9 Year Old | 5,821 (86.5%) | 912 (13.6%) |
| 10 to 14 Year Olds | 5,542 (85.2%) | 964 (14.8%) |
| 15 to 17 Year Olds | 3,597 (87.5%) | 515 (12.5%) |
| 18 to 19 Year Olds | 1,642 (91.6%) | 150 (8.4%) |
| 20 to 24 Year Olds | 1,434 (71.7%) | 566 (28.3%) |
| 25 to 34 Year Olds | 1,238 (89.8%) | 140 (10.2%) |
| 35 Years and over | 1,666 (77.8%) | 474 (22.2%) |
| Total | 21,683 (84.1%) | 4,099 (15.9%) |
Educational Attainment by Field of Study in Sumter County
Business (3,847 | 22.1%), education (2,497 | 14.4%), science & technology (2,242 | 12.9%), arts & humanities (1,535 | 8.8%), and social sciences (1,119 | 6.4%) are the most common fields of study among 17,388 individuals in Sumter County who have obtained a bachelor's degree or higher.
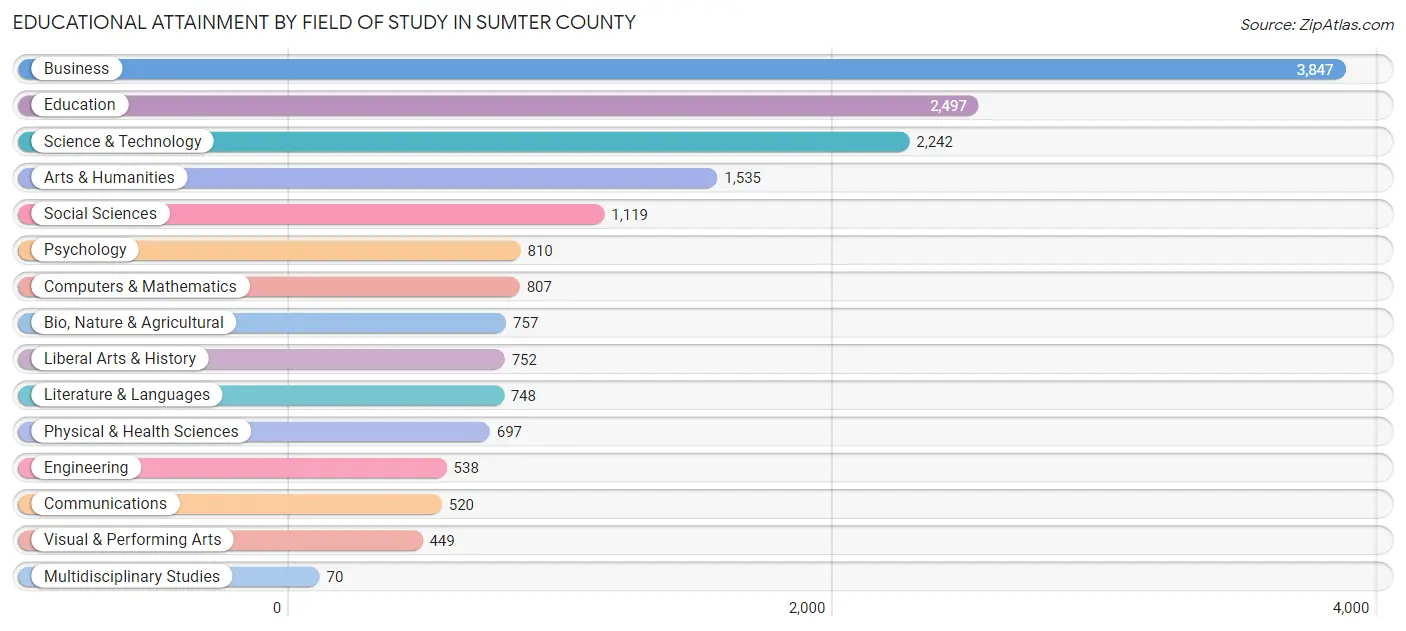
| Field of Study | # Graduates | % Graduates |
| Computers & Mathematics | 807 | 4.6% |
| Bio, Nature & Agricultural | 757 | 4.3% |
| Physical & Health Sciences | 697 | 4.0% |
| Psychology | 810 | 4.7% |
| Social Sciences | 1,119 | 6.4% |
| Engineering | 538 | 3.1% |
| Multidisciplinary Studies | 70 | 0.4% |
| Science & Technology | 2,242 | 12.9% |
| Business | 3,847 | 22.1% |
| Education | 2,497 | 14.4% |
| Literature & Languages | 748 | 4.3% |
| Liberal Arts & History | 752 | 4.3% |
| Visual & Performing Arts | 449 | 2.6% |
| Communications | 520 | 3.0% |
| Arts & Humanities | 1,535 | 8.8% |
| Total | 17,388 | 100.0% |
Transportation & Commute in Sumter County
Vehicle Availability by Sex in Sumter County
The most prevalent vehicle ownership categories in Sumter County are males with 2 vehicles (8,966, accounting for 39.2%) and females with 2 vehicles (7,682, making up 41.6%).
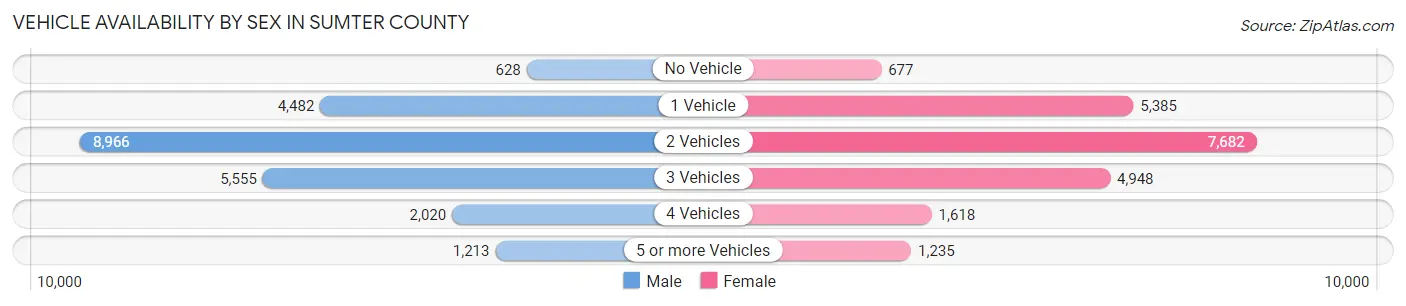
| Vehicles Available | Male | Female |
| No Vehicle | 628 (2.8%) | 677 (3.1%) |
| 1 Vehicle | 4,482 (19.6%) | 5,385 (25.0%) |
| 2 Vehicles | 8,966 (39.2%) | 7,682 (35.7%) |
| 3 Vehicles | 5,555 (24.3%) | 4,948 (23.0%) |
| 4 Vehicles | 2,020 (8.8%) | 1,618 (7.5%) |
| 5 or more Vehicles | 1,213 (5.3%) | 1,235 (5.7%) |
| Total | 22,864 (100.0%) | 21,545 (100.0%) |
Commute Time in Sumter County
The most frequently occuring commute durations in Sumter County are 15 to 19 minutes (10,036 commuters, 23.2%), 10 to 14 minutes (8,921 commuters, 20.6%), and 20 to 24 minutes (6,134 commuters, 14.2%).
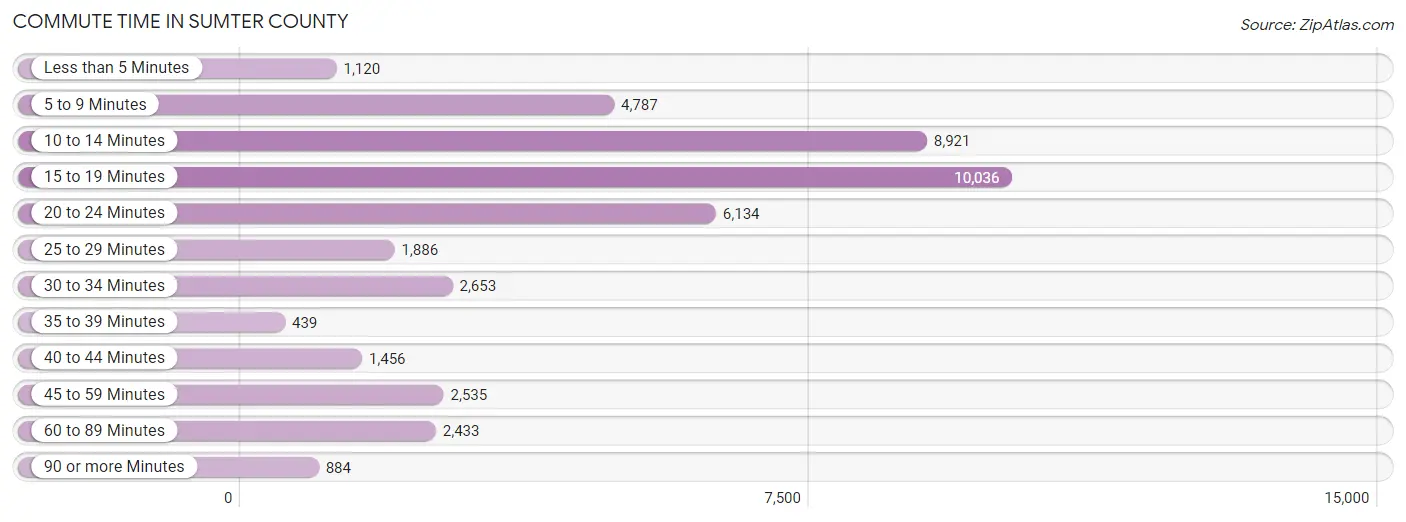
| Commute Time | # Commuters | % Commuters |
| Less than 5 Minutes | 1,120 | 2.6% |
| 5 to 9 Minutes | 4,787 | 11.1% |
| 10 to 14 Minutes | 8,921 | 20.6% |
| 15 to 19 Minutes | 10,036 | 23.2% |
| 20 to 24 Minutes | 6,134 | 14.2% |
| 25 to 29 Minutes | 1,886 | 4.4% |
| 30 to 34 Minutes | 2,653 | 6.1% |
| 35 to 39 Minutes | 439 | 1.0% |
| 40 to 44 Minutes | 1,456 | 3.4% |
| 45 to 59 Minutes | 2,535 | 5.9% |
| 60 to 89 Minutes | 2,433 | 5.6% |
| 90 or more Minutes | 884 | 2.0% |
Commute Time by Sex in Sumter County
The most common commute times in Sumter County are 15 to 19 minutes (5,020 commuters, 22.2%) for males and 15 to 19 minutes (5,016 commuters, 24.3%) for females.
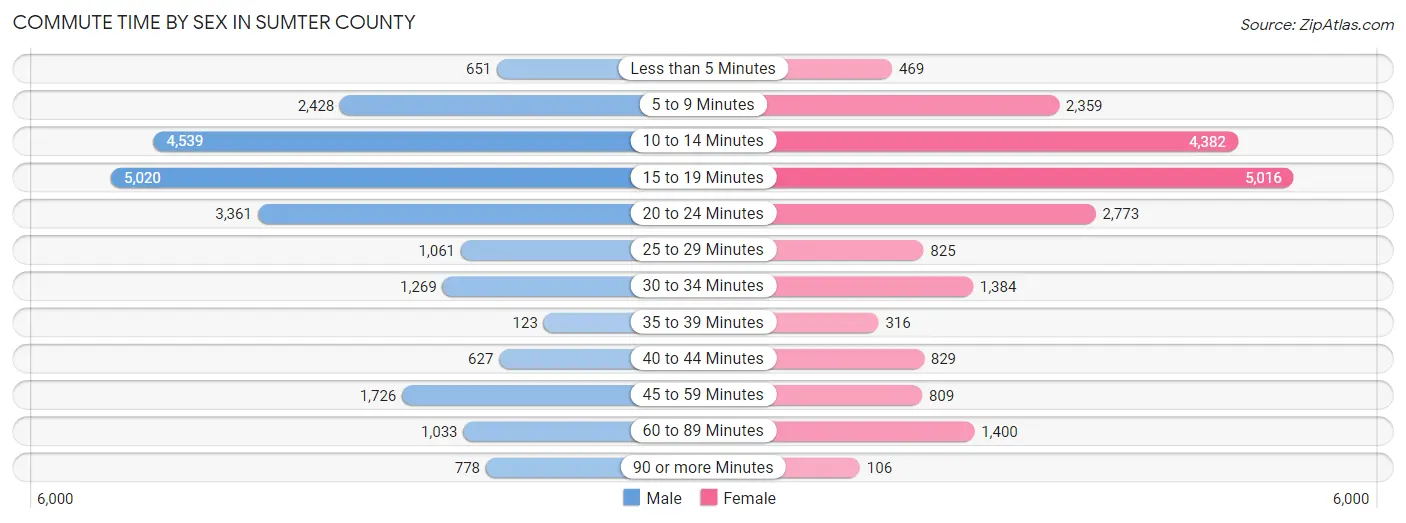
| Commute Time | Male | Female |
| Less than 5 Minutes | 651 (2.9%) | 469 (2.3%) |
| 5 to 9 Minutes | 2,428 (10.7%) | 2,359 (11.4%) |
| 10 to 14 Minutes | 4,539 (20.1%) | 4,382 (21.2%) |
| 15 to 19 Minutes | 5,020 (22.2%) | 5,016 (24.3%) |
| 20 to 24 Minutes | 3,361 (14.9%) | 2,773 (13.4%) |
| 25 to 29 Minutes | 1,061 (4.7%) | 825 (4.0%) |
| 30 to 34 Minutes | 1,269 (5.6%) | 1,384 (6.7%) |
| 35 to 39 Minutes | 123 (0.5%) | 316 (1.5%) |
| 40 to 44 Minutes | 627 (2.8%) | 829 (4.0%) |
| 45 to 59 Minutes | 1,726 (7.6%) | 809 (3.9%) |
| 60 to 89 Minutes | 1,033 (4.6%) | 1,400 (6.8%) |
| 90 or more Minutes | 778 (3.4%) | 106 (0.5%) |
Time of Departure to Work by Sex in Sumter County
The most frequent times of departure to work in Sumter County are 6:30 AM to 6:59 AM (3,556, 15.7%) for males and 7:00 AM to 7:29 AM (3,099, 15.0%) for females.
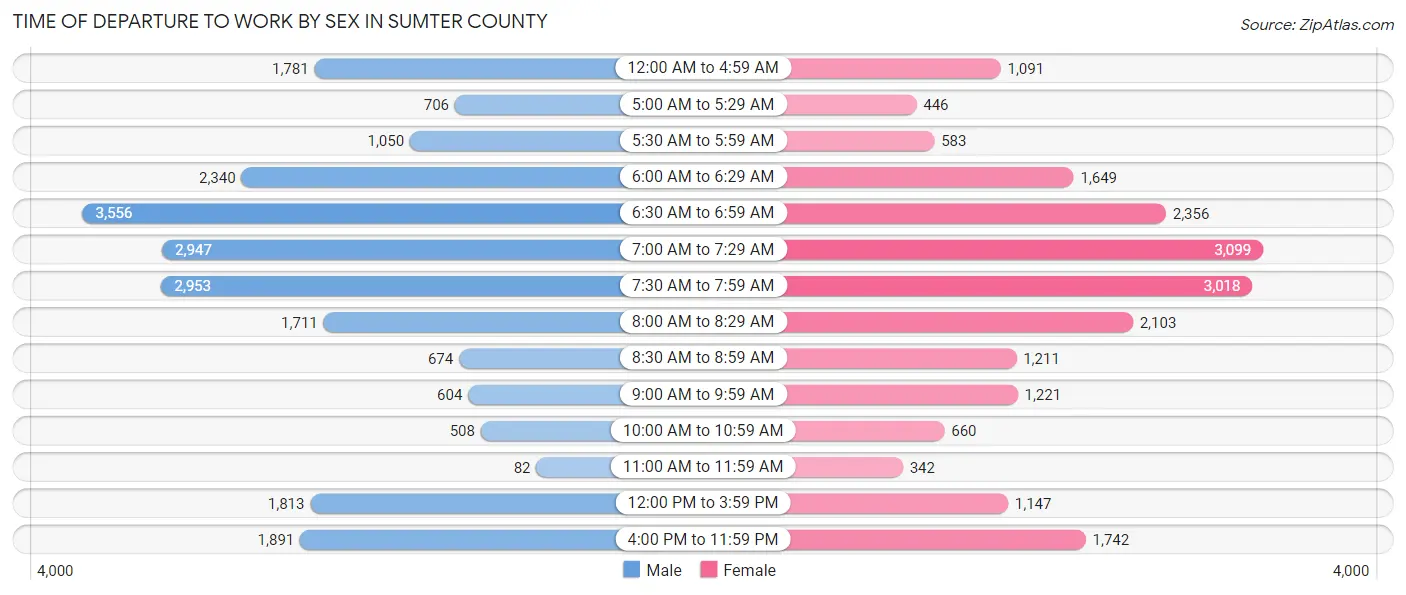
| Time of Departure | Male | Female |
| 12:00 AM to 4:59 AM | 1,781 (7.9%) | 1,091 (5.3%) |
| 5:00 AM to 5:29 AM | 706 (3.1%) | 446 (2.2%) |
| 5:30 AM to 5:59 AM | 1,050 (4.6%) | 583 (2.8%) |
| 6:00 AM to 6:29 AM | 2,340 (10.3%) | 1,649 (8.0%) |
| 6:30 AM to 6:59 AM | 3,556 (15.7%) | 2,356 (11.4%) |
| 7:00 AM to 7:29 AM | 2,947 (13.0%) | 3,099 (15.0%) |
| 7:30 AM to 7:59 AM | 2,953 (13.1%) | 3,018 (14.6%) |
| 8:00 AM to 8:29 AM | 1,711 (7.6%) | 2,103 (10.2%) |
| 8:30 AM to 8:59 AM | 674 (3.0%) | 1,211 (5.9%) |
| 9:00 AM to 9:59 AM | 604 (2.7%) | 1,221 (5.9%) |
| 10:00 AM to 10:59 AM | 508 (2.2%) | 660 (3.2%) |
| 11:00 AM to 11:59 AM | 82 (0.4%) | 342 (1.7%) |
| 12:00 PM to 3:59 PM | 1,813 (8.0%) | 1,147 (5.6%) |
| 4:00 PM to 11:59 PM | 1,891 (8.4%) | 1,742 (8.4%) |
| Total | 22,616 (100.0%) | 20,668 (100.0%) |
Housing Occupancy in Sumter County
Occupancy by Ownership in Sumter County
Of the total 40,917 dwellings in Sumter County, owner-occupied units account for 27,028 (66.1%), while renter-occupied units make up 13,889 (33.9%).
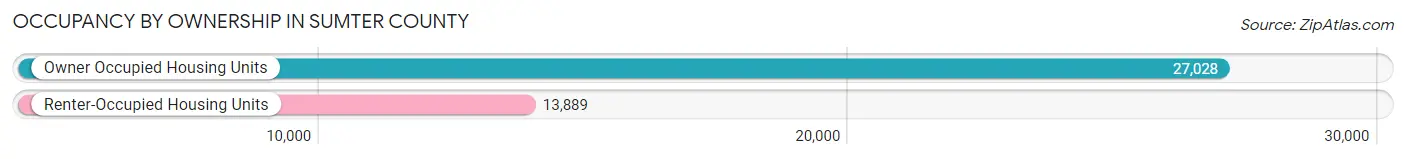
| Occupancy | # Housing Units | % Housing Units |
| Owner Occupied Housing Units | 27,028 | 66.1% |
| Renter-Occupied Housing Units | 13,889 | 33.9% |
| Total Occupied Housing Units | 40,917 | 100.0% |
Occupancy by Household Size in Sumter County
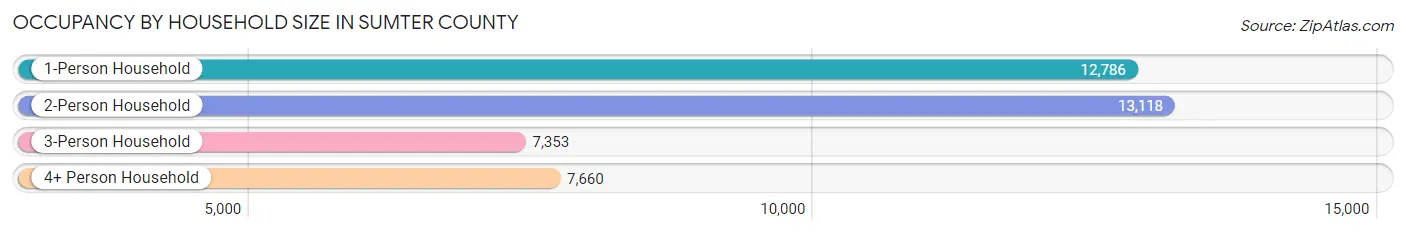
| Household Size | # Housing Units | % Housing Units |
| 1-Person Household | 12,786 | 31.2% |
| 2-Person Household | 13,118 | 32.1% |
| 3-Person Household | 7,353 | 18.0% |
| 4+ Person Household | 7,660 | 18.7% |
| Total Housing Units | 40,917 | 100.0% |
Occupancy by Ownership by Household Size in Sumter County
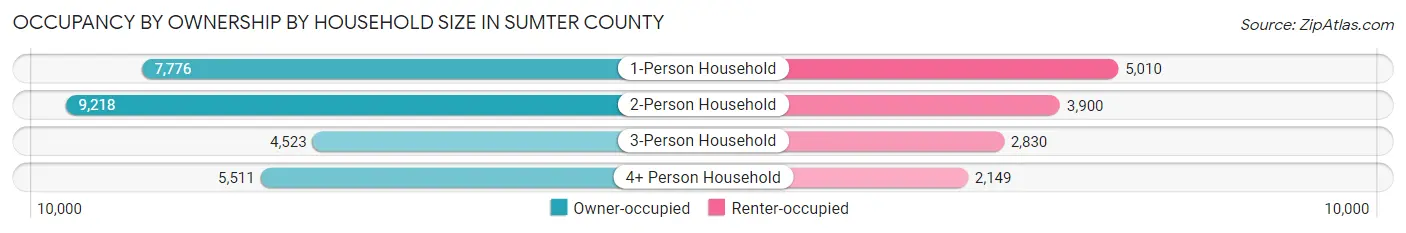
| Household Size | Owner-occupied | Renter-occupied |
| 1-Person Household | 7,776 (60.8%) | 5,010 (39.2%) |
| 2-Person Household | 9,218 (70.3%) | 3,900 (29.7%) |
| 3-Person Household | 4,523 (61.5%) | 2,830 (38.5%) |
| 4+ Person Household | 5,511 (72.0%) | 2,149 (28.1%) |
| Total Housing Units | 27,028 (66.1%) | 13,889 (33.9%) |
Occupancy by Educational Attainment in Sumter County
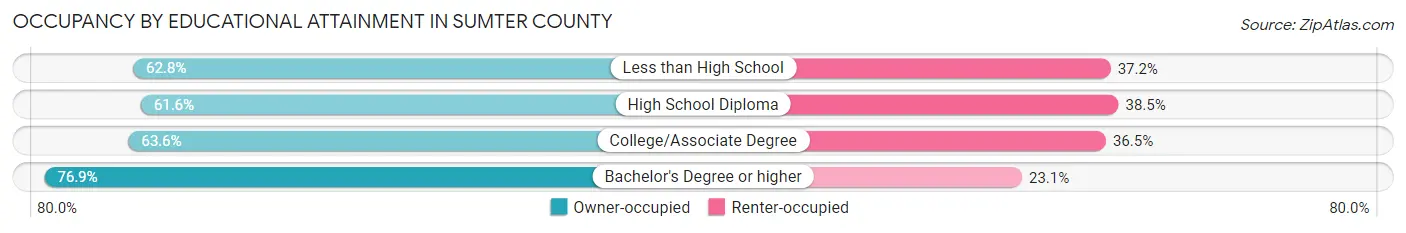
| Household Size | Owner-occupied | Renter-occupied |
| Less than High School | 2,552 (62.8%) | 1,512 (37.2%) |
| High School Diploma | 7,516 (61.6%) | 4,695 (38.5%) |
| College/Associate Degree | 9,450 (63.5%) | 5,421 (36.4%) |
| Bachelor's Degree or higher | 7,510 (76.9%) | 2,261 (23.1%) |
Occupancy by Age of Householder in Sumter County
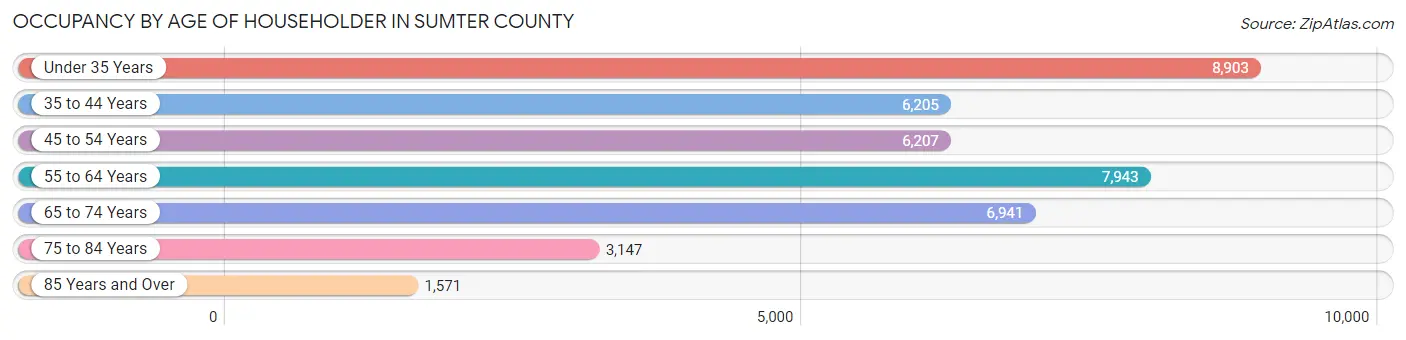
| Age Bracket | # Households | % Households |
| Under 35 Years | 8,903 | 21.8% |
| 35 to 44 Years | 6,205 | 15.2% |
| 45 to 54 Years | 6,207 | 15.2% |
| 55 to 64 Years | 7,943 | 19.4% |
| 65 to 74 Years | 6,941 | 17.0% |
| 75 to 84 Years | 3,147 | 7.7% |
| 85 Years and Over | 1,571 | 3.8% |
| Total | 40,917 | 100.0% |
Housing Finances in Sumter County
Median Income by Occupancy in Sumter County
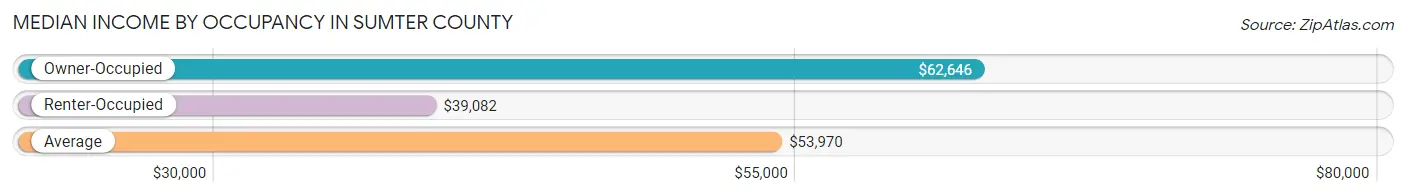
| Occupancy Type | # Households | Median Income |
| Owner-Occupied | 27,028 (66.1%) | $62,646 |
| Renter-Occupied | 13,889 (33.9%) | $39,082 |
| Average | 40,917 (100.0%) | $53,970 |
Occupancy by Householder Income Bracket in Sumter County
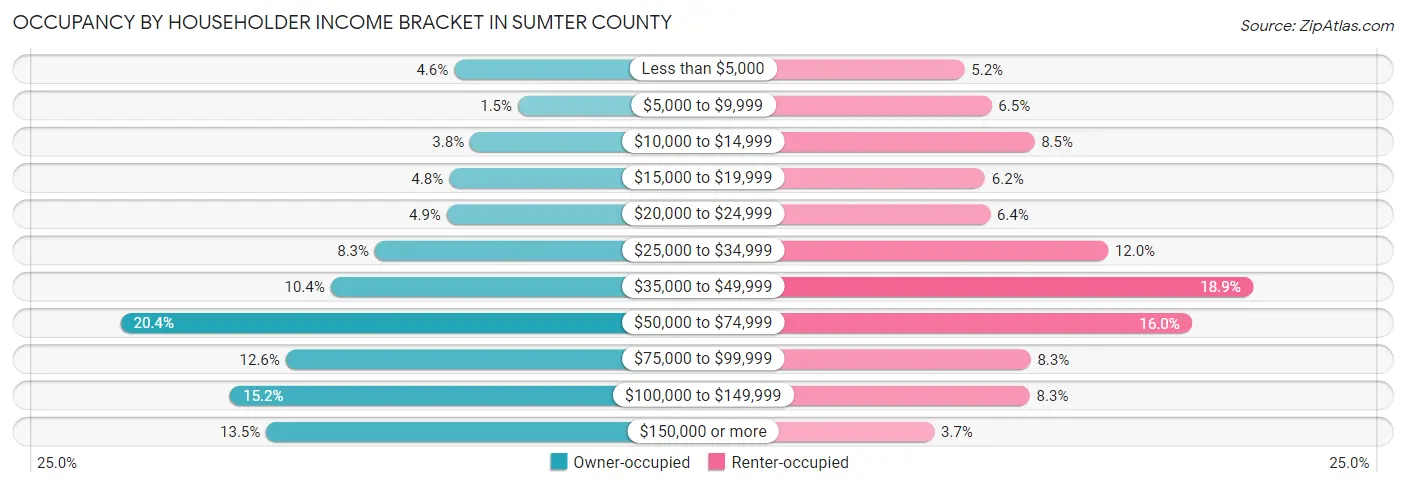
| Income Bracket | Owner-occupied | Renter-occupied |
| Less than $5,000 | 1,230 (4.5%) | 719 (5.2%) |
| $5,000 to $9,999 | 407 (1.5%) | 899 (6.5%) |
| $10,000 to $14,999 | 1,025 (3.8%) | 1,182 (8.5%) |
| $15,000 to $19,999 | 1,295 (4.8%) | 856 (6.2%) |
| $20,000 to $24,999 | 1,325 (4.9%) | 889 (6.4%) |
| $25,000 to $34,999 | 2,249 (8.3%) | 1,670 (12.0%) |
| $35,000 to $49,999 | 2,819 (10.4%) | 2,625 (18.9%) |
| $50,000 to $74,999 | 5,522 (20.4%) | 2,222 (16.0%) |
| $75,000 to $99,999 | 3,397 (12.6%) | 1,157 (8.3%) |
| $100,000 to $149,999 | 4,110 (15.2%) | 1,151 (8.3%) |
| $150,000 or more | 3,649 (13.5%) | 519 (3.7%) |
| Total | 27,028 (100.0%) | 13,889 (100.0%) |
Monthly Housing Cost Tiers in Sumter County
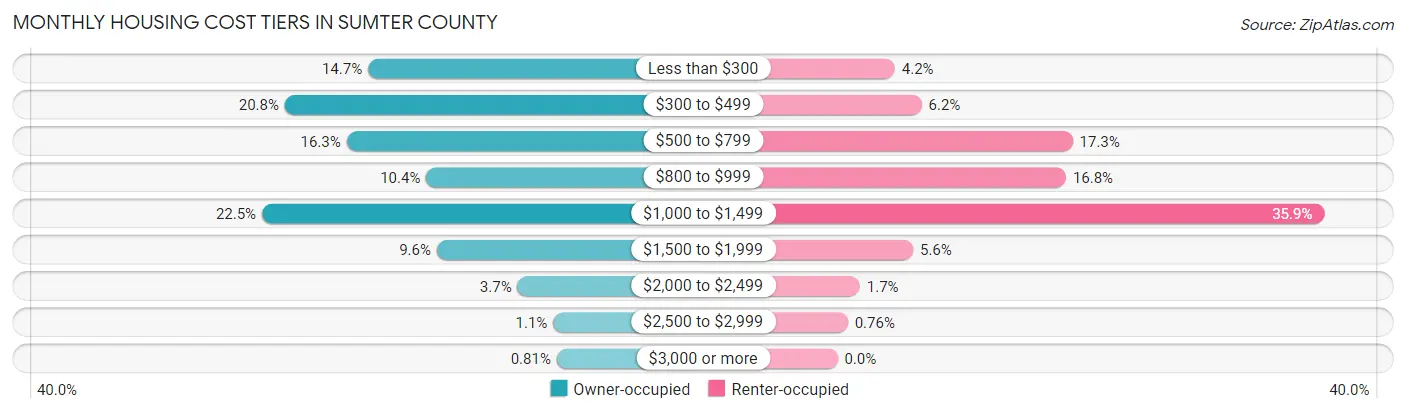
| Monthly Cost | Owner-occupied | Renter-occupied |
| Less than $300 | 3,977 (14.7%) | 587 (4.2%) |
| $300 to $499 | 5,632 (20.8%) | 861 (6.2%) |
| $500 to $799 | 4,403 (16.3%) | 2,405 (17.3%) |
| $800 to $999 | 2,816 (10.4%) | 2,337 (16.8%) |
| $1,000 to $1,499 | 6,088 (22.5%) | 4,979 (35.8%) |
| $1,500 to $1,999 | 2,605 (9.6%) | 773 (5.6%) |
| $2,000 to $2,499 | 999 (3.7%) | 229 (1.7%) |
| $2,500 to $2,999 | 289 (1.1%) | 105 (0.8%) |
| $3,000 or more | 219 (0.8%) | 0 (0.0%) |
| Total | 27,028 (100.0%) | 13,889 (100.0%) |
Physical Housing Characteristics in Sumter County
Housing Structures in Sumter County
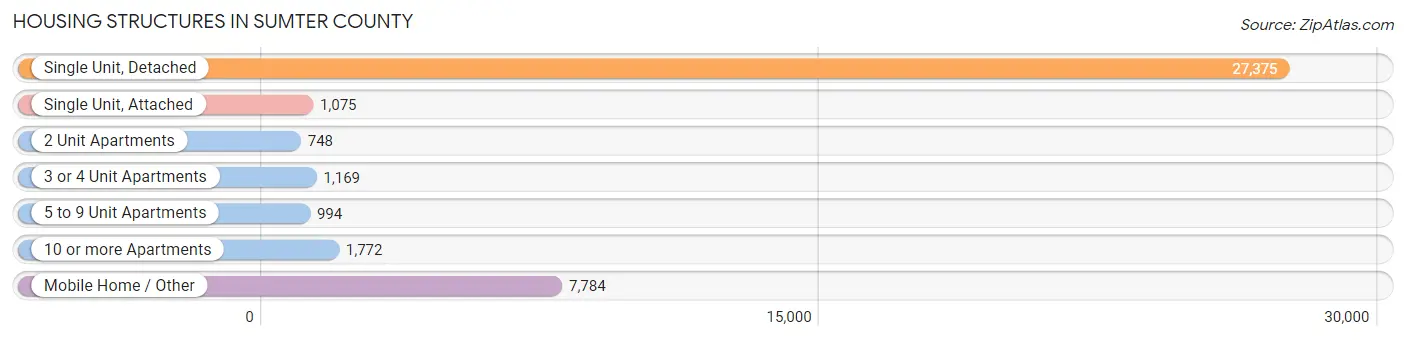
| Structure Type | # Housing Units | % Housing Units |
| Single Unit, Detached | 27,375 | 66.9% |
| Single Unit, Attached | 1,075 | 2.6% |
| 2 Unit Apartments | 748 | 1.8% |
| 3 or 4 Unit Apartments | 1,169 | 2.9% |
| 5 to 9 Unit Apartments | 994 | 2.4% |
| 10 or more Apartments | 1,772 | 4.3% |
| Mobile Home / Other | 7,784 | 19.0% |
| Total | 40,917 | 100.0% |
Housing Structures by Occupancy in Sumter County
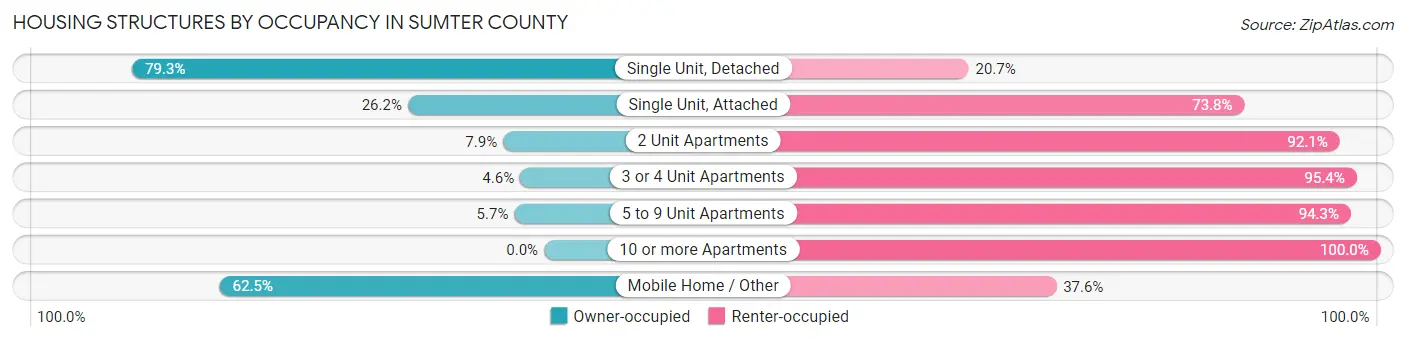
| Structure Type | Owner-occupied | Renter-occupied |
| Single Unit, Detached | 21,715 (79.3%) | 5,660 (20.7%) |
| Single Unit, Attached | 282 (26.2%) | 793 (73.8%) |
| 2 Unit Apartments | 59 (7.9%) | 689 (92.1%) |
| 3 or 4 Unit Apartments | 54 (4.6%) | 1,115 (95.4%) |
| 5 to 9 Unit Apartments | 57 (5.7%) | 937 (94.3%) |
| 10 or more Apartments | 0 (0.0%) | 1,772 (100.0%) |
| Mobile Home / Other | 4,861 (62.5%) | 2,923 (37.6%) |
| Total | 27,028 (66.1%) | 13,889 (33.9%) |
Housing Structures by Number of Rooms in Sumter County
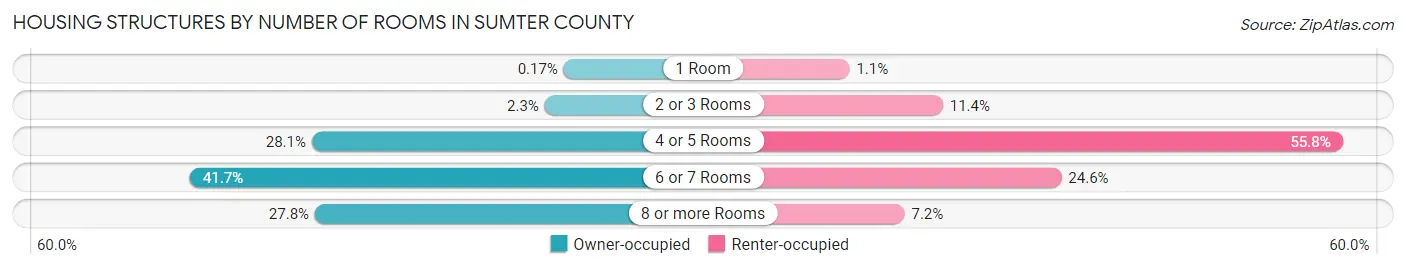
| Number of Rooms | Owner-occupied | Renter-occupied |
| 1 Room | 45 (0.2%) | 147 (1.1%) |
| 2 or 3 Rooms | 615 (2.3%) | 1,586 (11.4%) |
| 4 or 5 Rooms | 7,602 (28.1%) | 7,746 (55.8%) |
| 6 or 7 Rooms | 11,257 (41.6%) | 3,414 (24.6%) |
| 8 or more Rooms | 7,509 (27.8%) | 996 (7.2%) |
| Total | 27,028 (100.0%) | 13,889 (100.0%) |
Housing Structure by Heating Type in Sumter County
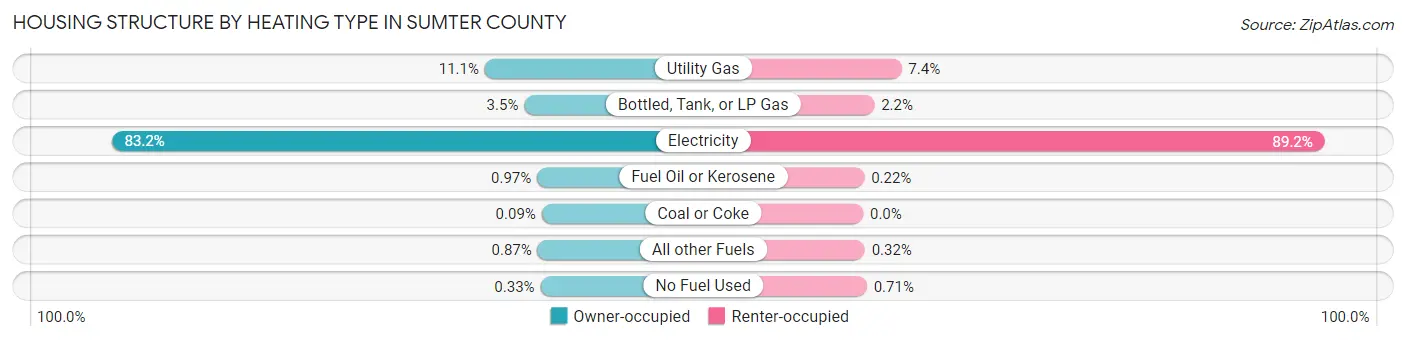
| Heating Type | Owner-occupied | Renter-occupied |
| Utility Gas | 2,995 (11.1%) | 1,029 (7.4%) |
| Bottled, Tank, or LP Gas | 933 (3.5%) | 300 (2.2%) |
| Electricity | 22,490 (83.2%) | 12,386 (89.2%) |
| Fuel Oil or Kerosene | 262 (1.0%) | 30 (0.2%) |
| Coal or Coke | 23 (0.1%) | 0 (0.0%) |
| All other Fuels | 235 (0.9%) | 45 (0.3%) |
| No Fuel Used | 90 (0.3%) | 99 (0.7%) |
| Total | 27,028 (100.0%) | 13,889 (100.0%) |
Household Vehicle Usage in Sumter County
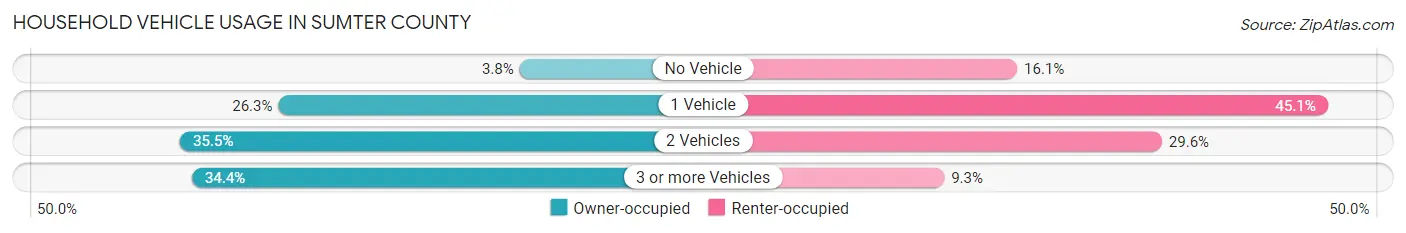
| Vehicles per Household | Owner-occupied | Renter-occupied |
| No Vehicle | 1,028 (3.8%) | 2,233 (16.1%) |
| 1 Vehicle | 7,115 (26.3%) | 6,259 (45.1%) |
| 2 Vehicles | 9,593 (35.5%) | 4,110 (29.6%) |
| 3 or more Vehicles | 9,292 (34.4%) | 1,287 (9.3%) |
| Total | 27,028 (100.0%) | 13,889 (100.0%) |
Real Estate & Mortgages in Sumter County
Real Estate and Mortgage Overview in Sumter County
| Characteristic | Without Mortgage | With Mortgage |
| Housing Units | 12,442 | 14,586 |
| Median Property Value | $103,300 | $167,900 |
| Median Household Income | $49,852 | $2,457 |
| Monthly Housing Costs | $380 | $211 |
| Real Estate Taxes | $611 | $1,048 |
Property Value by Mortgage Status in Sumter County
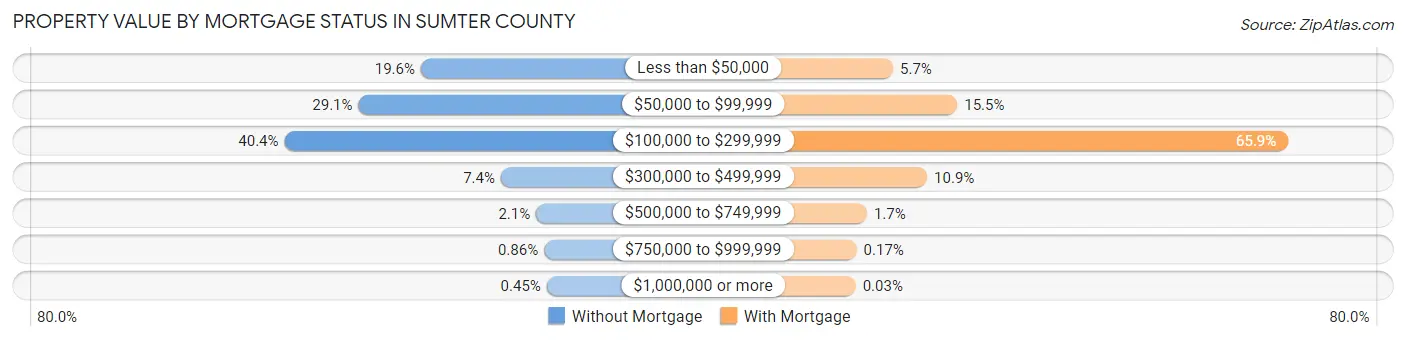
| Property Value | Without Mortgage | With Mortgage |
| Less than $50,000 | 2,442 (19.6%) | 835 (5.7%) |
| $50,000 to $99,999 | 3,626 (29.1%) | 2,262 (15.5%) |
| $100,000 to $299,999 | 5,029 (40.4%) | 9,613 (65.9%) |
| $300,000 to $499,999 | 926 (7.4%) | 1,592 (10.9%) |
| $500,000 to $749,999 | 256 (2.1%) | 254 (1.7%) |
| $750,000 to $999,999 | 107 (0.9%) | 25 (0.2%) |
| $1,000,000 or more | 56 (0.4%) | 5 (0.0%) |
| Total | 12,442 (100.0%) | 14,586 (100.0%) |
Household Income by Mortgage Status in Sumter County
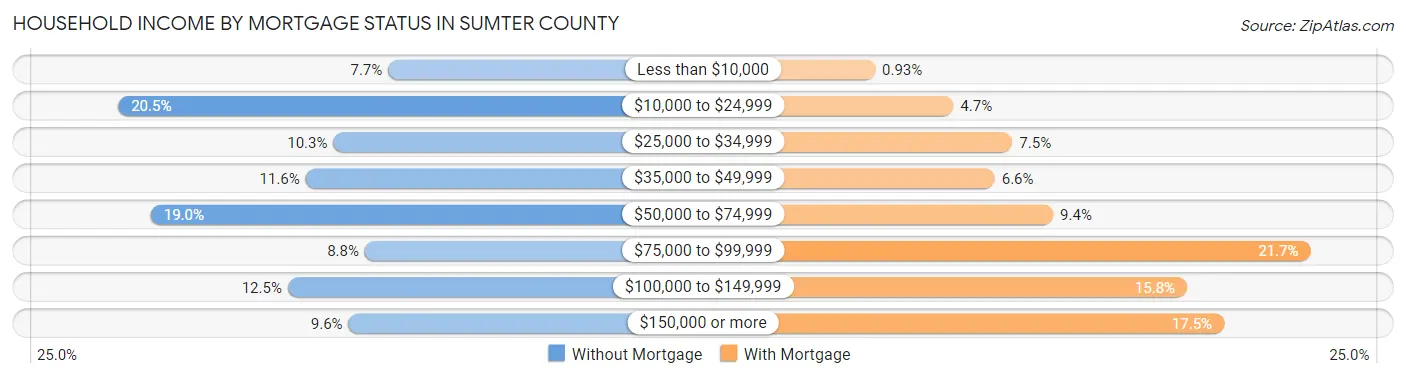
| Household Income | Without Mortgage | With Mortgage |
| Less than $10,000 | 957 (7.7%) | 135 (0.9%) |
| $10,000 to $24,999 | 2,555 (20.5%) | 680 (4.7%) |
| $25,000 to $34,999 | 1,282 (10.3%) | 1,090 (7.5%) |
| $35,000 to $49,999 | 1,446 (11.6%) | 967 (6.6%) |
| $50,000 to $74,999 | 2,363 (19.0%) | 1,373 (9.4%) |
| $75,000 to $99,999 | 1,095 (8.8%) | 3,159 (21.7%) |
| $100,000 to $149,999 | 1,552 (12.5%) | 2,302 (15.8%) |
| $150,000 or more | 1,192 (9.6%) | 2,558 (17.5%) |
| Total | 12,442 (100.0%) | 14,586 (100.0%) |
Property Value to Household Income Ratio in Sumter County
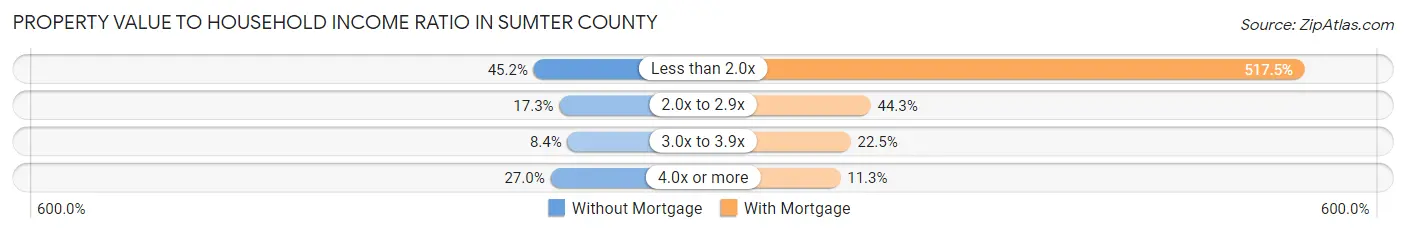
| Value-to-Income Ratio | Without Mortgage | With Mortgage |
| Less than 2.0x | 5,622 (45.2%) | 75,488 (517.5%) |
| 2.0x to 2.9x | 2,147 (17.3%) | 6,454 (44.3%) |
| 3.0x to 3.9x | 1,042 (8.4%) | 3,284 (22.5%) |
| 4.0x or more | 3,355 (27.0%) | 1,648 (11.3%) |
| Total | 12,442 (100.0%) | 14,586 (100.0%) |
Real Estate Taxes by Mortgage Status in Sumter County
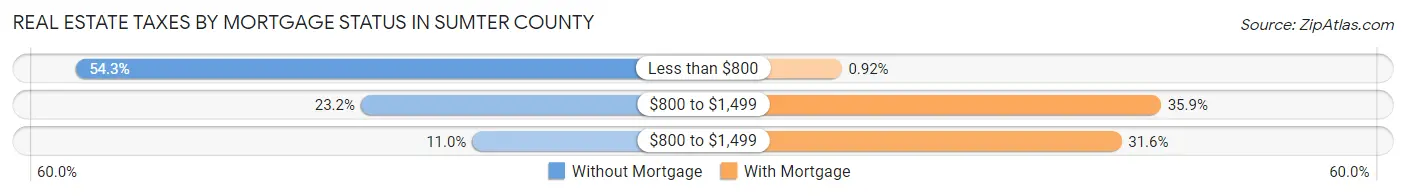
| Property Taxes | Without Mortgage | With Mortgage |
| Less than $800 | 6,761 (54.3%) | 134 (0.9%) |
| $800 to $1,499 | 2,881 (23.2%) | 5,238 (35.9%) |
| $800 to $1,499 | 1,363 (11.0%) | 4,607 (31.6%) |
| Total | 12,442 (100.0%) | 14,586 (100.0%) |
Health & Disability in Sumter County
Health Insurance Coverage by Age in Sumter County
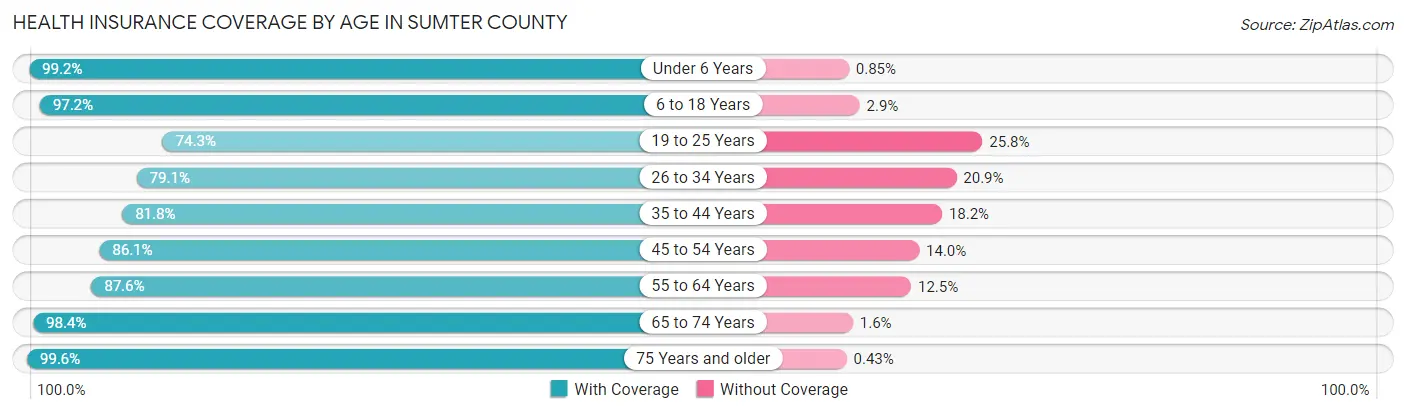
| Age Bracket | With Coverage | Without Coverage |
| Under 6 Years | 8,595 (99.2%) | 74 (0.9%) |
| 6 to 18 Years | 17,109 (97.2%) | 502 (2.9%) |
| 19 to 25 Years | 7,156 (74.3%) | 2,482 (25.8%) |
| 26 to 34 Years | 8,700 (79.1%) | 2,299 (20.9%) |
| 35 to 44 Years | 9,108 (81.8%) | 2,028 (18.2%) |
| 45 to 54 Years | 9,757 (86.1%) | 1,582 (14.0%) |
| 55 to 64 Years | 11,516 (87.5%) | 1,637 (12.4%) |
| 65 to 74 Years | 10,308 (98.4%) | 167 (1.6%) |
| 75 Years and older | 6,768 (99.6%) | 29 (0.4%) |
| Total | 89,017 (89.2%) | 10,800 (10.8%) |
Health Insurance Coverage by Citizenship Status in Sumter County
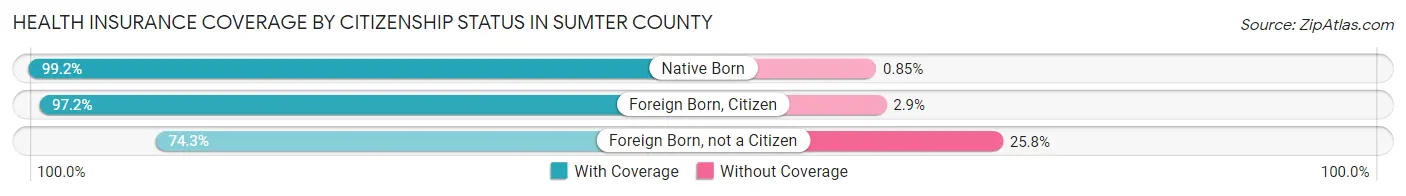
| Citizenship Status | With Coverage | Without Coverage |
| Native Born | 8,595 (99.2%) | 74 (0.9%) |
| Foreign Born, Citizen | 17,109 (97.2%) | 502 (2.9%) |
| Foreign Born, not a Citizen | 7,156 (74.3%) | 2,482 (25.8%) |
Health Insurance Coverage by Household Income in Sumter County
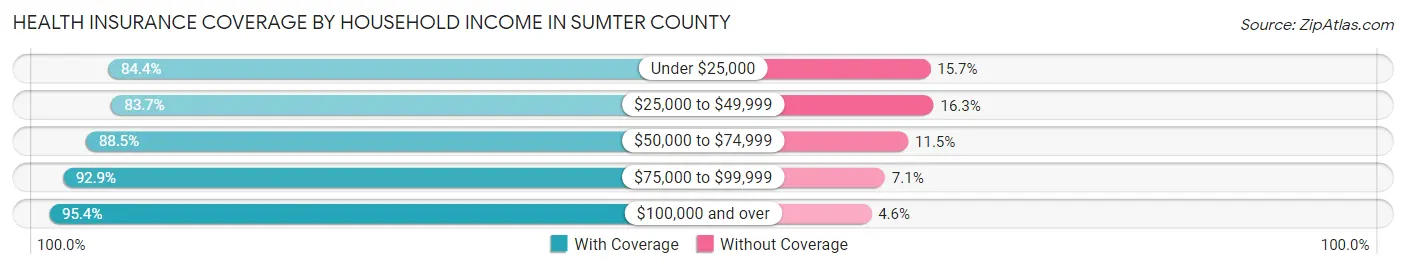
| Household Income | With Coverage | Without Coverage |
| Under $25,000 | 14,192 (84.4%) | 2,634 (15.7%) |
| $25,000 to $49,999 | 17,685 (83.7%) | 3,434 (16.3%) |
| $50,000 to $74,999 | 17,397 (88.5%) | 2,258 (11.5%) |
| $75,000 to $99,999 | 12,464 (92.9%) | 959 (7.1%) |
| $100,000 and over | 26,768 (95.4%) | 1,285 (4.6%) |
Public vs Private Health Insurance Coverage by Age in Sumter County
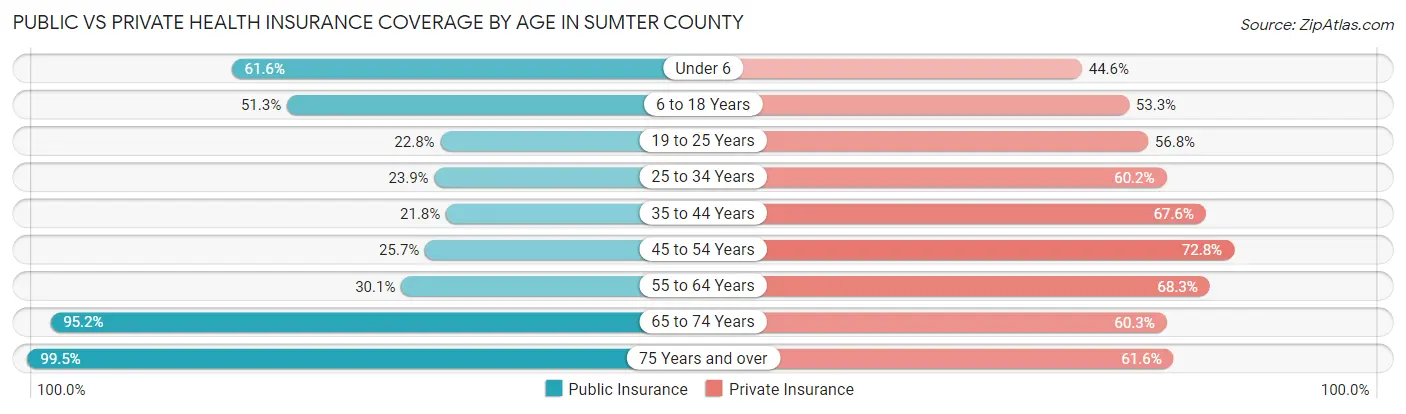
| Age Bracket | Public Insurance | Private Insurance |
| Under 6 | 5,338 (61.6%) | 3,862 (44.6%) |
| 6 to 18 Years | 9,034 (51.3%) | 9,385 (53.3%) |
| 19 to 25 Years | 2,199 (22.8%) | 5,476 (56.8%) |
| 25 to 34 Years | 2,632 (23.9%) | 6,624 (60.2%) |
| 35 to 44 Years | 2,423 (21.8%) | 7,522 (67.5%) |
| 45 to 54 Years | 2,908 (25.7%) | 8,252 (72.8%) |
| 55 to 64 Years | 3,958 (30.1%) | 8,980 (68.3%) |
| 65 to 74 Years | 9,976 (95.2%) | 6,314 (60.3%) |
| 75 Years and over | 6,761 (99.5%) | 4,184 (61.6%) |
| Total | 45,229 (45.3%) | 60,599 (60.7%) |
Disability Status by Sex by Age in Sumter County
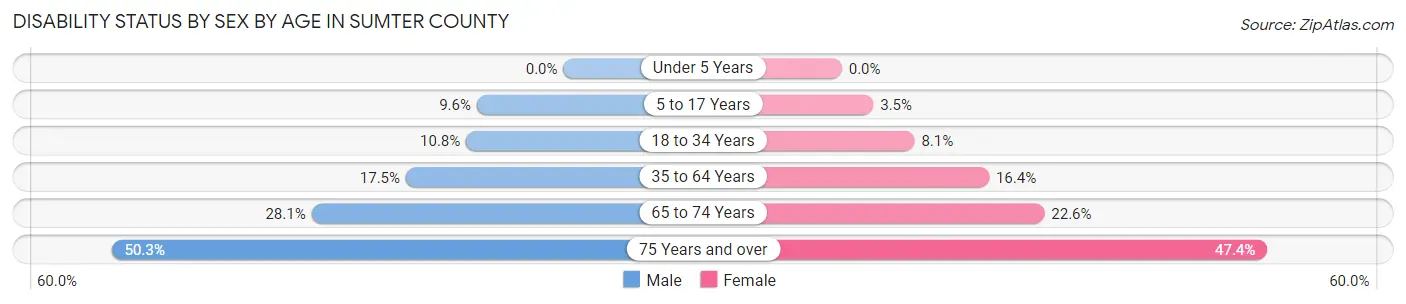
| Age Bracket | Male | Female |
| Under 5 Years | 0 (0.0%) | 0 (0.0%) |
| 5 to 17 Years | 887 (9.6%) | 311 (3.5%) |
| 18 to 34 Years | 1,126 (10.8%) | 930 (8.1%) |
| 35 to 64 Years | 2,833 (17.5%) | 3,192 (16.4%) |
| 65 to 74 Years | 1,352 (28.1%) | 1,276 (22.6%) |
| 75 Years and over | 1,356 (50.3%) | 1,943 (47.4%) |
Disability Class by Sex by Age in Sumter County
Disability Class: Hearing Difficulty
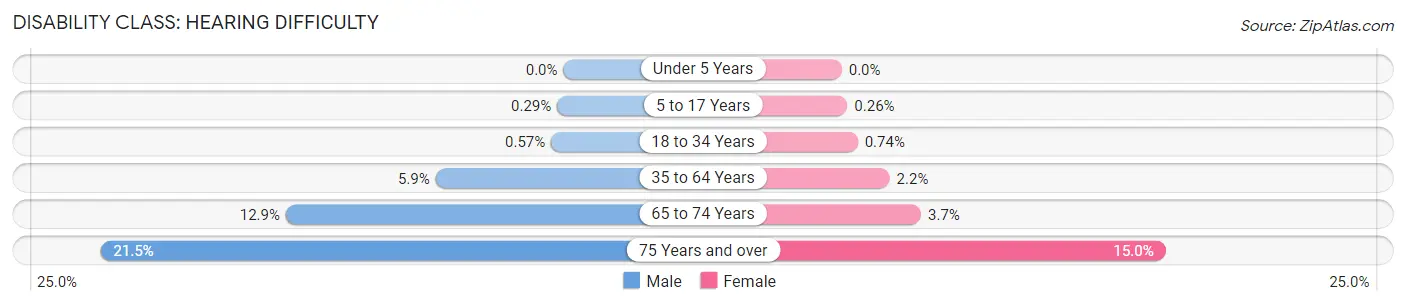
| Age Bracket | Male | Female |
| Under 5 Years | 0 (0.0%) | 0 (0.0%) |
| 5 to 17 Years | 27 (0.3%) | 23 (0.3%) |
| 18 to 34 Years | 59 (0.6%) | 85 (0.7%) |
| 35 to 64 Years | 957 (5.9%) | 432 (2.2%) |
| 65 to 74 Years | 621 (12.9%) | 208 (3.7%) |
| 75 Years and over | 579 (21.5%) | 616 (15.0%) |
Disability Class: Vision Difficulty
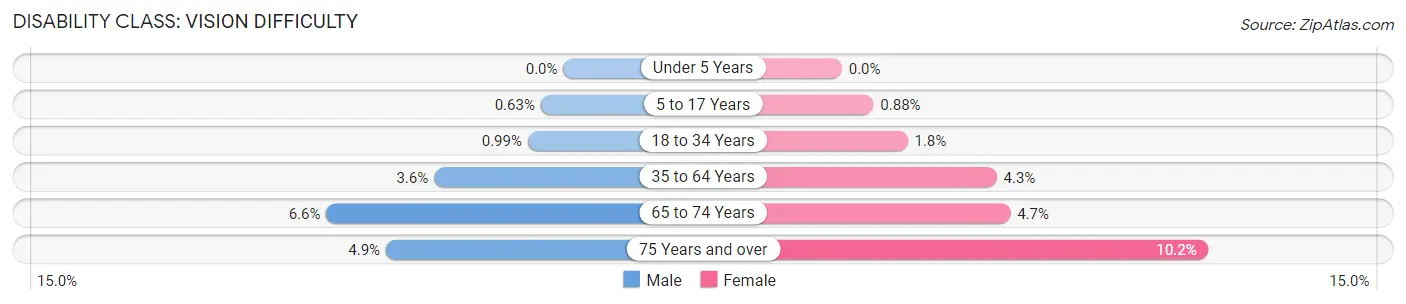
| Age Bracket | Male | Female |
| Under 5 Years | 0 (0.0%) | 0 (0.0%) |
| 5 to 17 Years | 58 (0.6%) | 78 (0.9%) |
| 18 to 34 Years | 103 (1.0%) | 210 (1.8%) |
| 35 to 64 Years | 581 (3.6%) | 840 (4.3%) |
| 65 to 74 Years | 318 (6.6%) | 265 (4.7%) |
| 75 Years and over | 133 (4.9%) | 419 (10.2%) |
Disability Class: Cognitive Difficulty
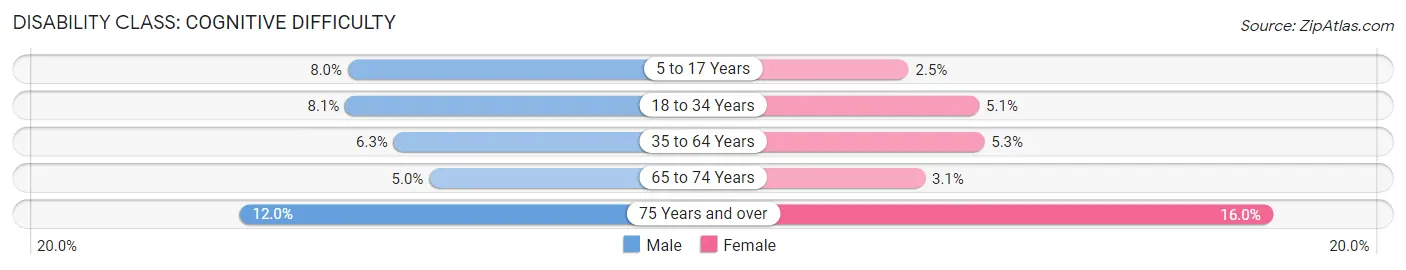
| Age Bracket | Male | Female |
| 5 to 17 Years | 736 (8.0%) | 220 (2.5%) |
| 18 to 34 Years | 842 (8.1%) | 586 (5.1%) |
| 35 to 64 Years | 1,017 (6.3%) | 1,030 (5.3%) |
| 65 to 74 Years | 240 (5.0%) | 175 (3.1%) |
| 75 Years and over | 324 (12.0%) | 656 (16.0%) |
Disability Class: Ambulatory Difficulty
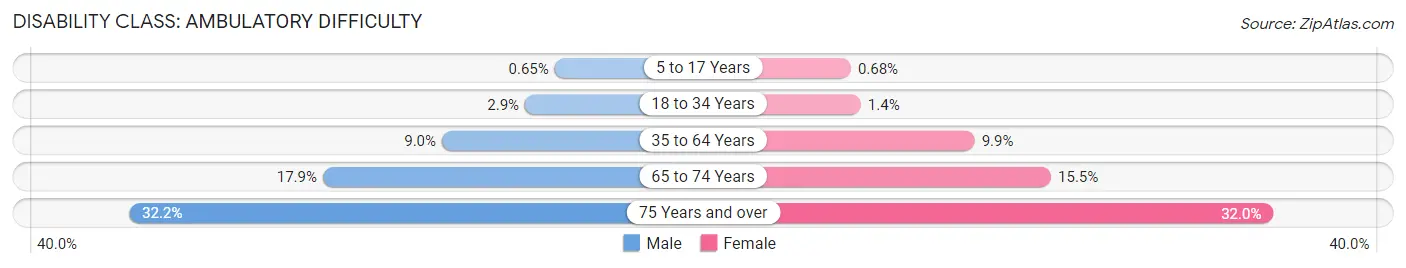
| Age Bracket | Male | Female |
| 5 to 17 Years | 60 (0.6%) | 60 (0.7%) |
| 18 to 34 Years | 296 (2.9%) | 163 (1.4%) |
| 35 to 64 Years | 1,456 (9.0%) | 1,922 (9.9%) |
| 65 to 74 Years | 861 (17.9%) | 879 (15.5%) |
| 75 Years and over | 869 (32.2%) | 1,314 (32.0%) |
Disability Class: Self-Care Difficulty
| Age Bracket | Male | Female |
| 5 to 17 Years | 98 (1.1%) | 84 (0.9%) |
| 18 to 34 Years | 125 (1.2%) | 32 (0.3%) |
| 35 to 64 Years | 432 (2.7%) | 715 (3.7%) |
| 65 to 74 Years | 216 (4.5%) | 258 (4.6%) |
| 75 Years and over | 291 (10.8%) | 684 (16.7%) |
Technology Access in Sumter County
Computing Device Access in Sumter County
| Device Type | # Households | % Households |
| Desktop or Laptop | 28,394 | 69.4% |
| Smartphone | 34,147 | 83.5% |
| Tablet | 21,426 | 52.4% |
| No Computing Device | 4,462 | 10.9% |
| Total | 40,917 | 100.0% |
Internet Access in Sumter County
| Internet Type | # Households | % Households |
| Dial-Up Internet | 45 | 0.1% |
| Broadband Home | 28,074 | 68.6% |
| Cellular Data Only | 4,694 | 11.5% |
| Satellite Internet | 1,863 | 4.5% |
| No Internet | 7,222 | 17.6% |
| Total | 40,917 | 100.0% |
Sumter County Summary
Sumter County, South Carolina is located in the central part of the state and is part of the Sumter Metropolitan Statistical Area. The county was established in 1798 and is named after General Thomas Sumter, a Revolutionary War hero. As of the 2010 census, the population of Sumter County was 107,456.
Geography
Sumter County is located in the central part of South Carolina and is bordered by Clarendon County to the north, Lee County to the east, Florence County to the south, and Kershaw County to the west. The county covers an area of 845 square miles and is the second largest county in the state. The terrain is mostly flat with some rolling hills in the northern part of the county. The Wateree River forms the western border of the county and the Black River forms the eastern border. The county is home to several lakes, including Lake Marion, Lake Moultrie, and Lake Wateree.
Economy
Sumter County has a diverse economy with a mix of manufacturing, agriculture, and services. The county is home to several large employers, including Shaw Air Force Base, Continental Tire, and Walmart. Agriculture is a major part of the economy, with the county producing cotton, soybeans, corn, and peanuts. Manufacturing is also a major part of the economy, with the county producing textiles, furniture, and automotive parts. The service sector is also important, with the county home to several hospitals, banks, and retail stores.
Demographics
As of the 2010 census, the population of Sumter County was 107,456. The population is made up of a diverse mix of races and ethnicities. The largest racial group is African American, making up 54.3% of the population. White Americans make up 33.3% of the population, while Hispanic or Latino Americans make up 8.2%. Other racial groups include Asian Americans (2.2%), Native Americans (0.5%), and Pacific Islanders (0.1%).
The median household income in Sumter County is $41,945, and the median family income is $50,945. The per capita income is $20,945. The unemployment rate is 8.2%, which is slightly higher than the national average.
History
Sumter County was established in 1798 and is named after General Thomas Sumter, a Revolutionary War hero. The county was originally part of Clarendon County, but was split off in 1798. The county was home to several plantations, and the economy was largely based on agriculture. During the Civil War, the county was the site of several battles, including the Battle of Boykin’s Mill. After the war, the economy shifted to manufacturing and the county became a major producer of textiles. In the late 20th century, the county shifted to a more diverse economy, with a mix of manufacturing, agriculture, and services.
Common Questions
What is Per Capita Income in Sumter County?
Per Capita income in Sumter County is $28,319.
What is the Median Family Income in Sumter County?
Median Family Income in Sumter County is $67,811.
What is the Median Household income in Sumter County?
Median Household Income in Sumter County is $53,970.
What is Income or Wage Gap in Sumter County?
Income or Wage Gap in Sumter County is 27.8%.
Women in Sumter County earn 72.2 cents for every dollar earned by a man.
What is Family Income Deficit in Sumter County?
Family Income Deficit in Sumter County is $10,264.
Families that are below poverty line in Sumter County earn $10,264 less on average than the poverty threshold level.
What is Inequality or Gini Index in Sumter County?
Inequality or Gini Index in Sumter County is 0.46.
What is the Total Population of Sumter County?
Total Population of Sumter County is 105,199.
What is the Total Male Population of Sumter County?
Total Male Population of Sumter County is 51,138.
What is the Total Female Population of Sumter County?
Total Female Population of Sumter County is 54,061.
What is the Ratio of Males per 100 Females in Sumter County?
There are 94.59 Males per 100 Females in Sumter County.
What is the Ratio of Females per 100 Males in Sumter County?
There are 105.72 Females per 100 Males in Sumter County.
What is the Median Population Age in Sumter County?
Median Population Age in Sumter County is 36.9 Years.
What is the Average Family Size in Sumter County
Average Family Size in Sumter County is 3.2 People.
What is the Average Household Size in Sumter County
Average Household Size in Sumter County is 2.5 People.
How Large is the Labor Force in Sumter County?
There are 49,031 People in the Labor Forcein in Sumter County.
What is the Percentage of People in the Labor Force in Sumter County?
59.1% of People are in the Labor Force in Sumter County.
What is the Unemployment Rate in Sumter County?
Unemployment Rate in Sumter County is 7.2%.