Cities with the Highest Percentage of Immigrants from Somalia in the United States
RELATED REPORTS & OPTIONS
Somalia
United States
Compare Cities
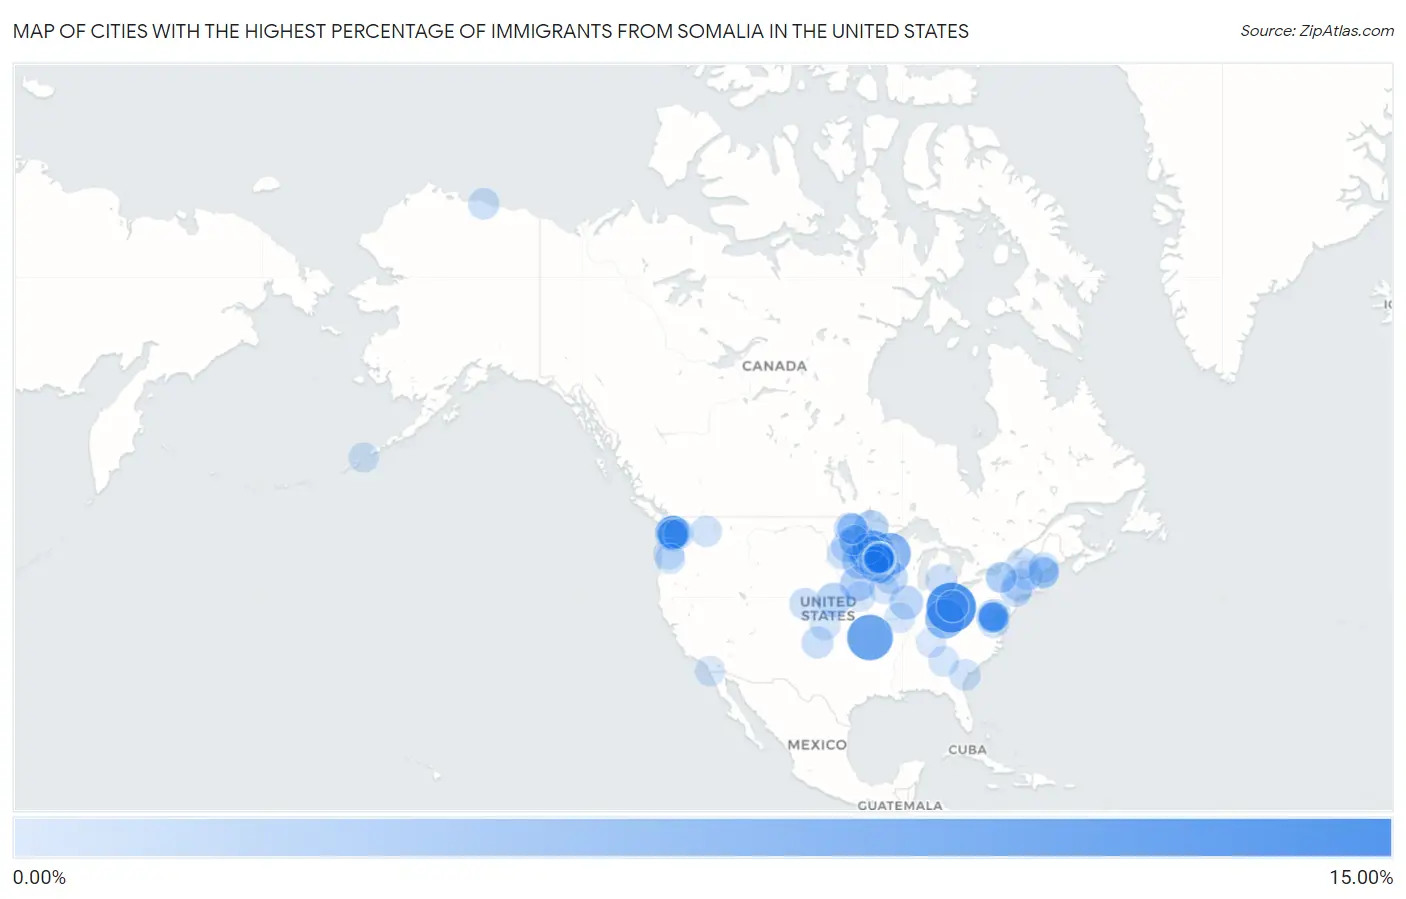
Map of Cities with the Highest Percentage of Immigrants from Somalia in the United States
0.00%
15.00%
Cities with the Highest Percentage of Immigrants from Somalia in the United States
| City | Somalia | vs State | vs National | |
| 1. | Urbancrest | 14.00% | 0.11%(+13.9)#1 | 0.030%(+14.0)#6 |
| 2. | Noel | 11.24% | 0.028%(+11.2)#1 | 0.030%(+11.2)#12 |
| 3. | Waite Park | 9.77% | 0.68%(+9.10)#1 | 0.030%(+9.74)#13 |
| 4. | Barron | 8.37% | 0.026%(+8.34)#1 | 0.030%(+8.34)#14 |
| 5. | Germantown | 6.84% | 0.039%(+6.80)#1 | 0.030%(+6.81)#33 |
| 6. | Hilltop | 5.87% | 0.68%(+5.20)#2 | 0.030%(+5.84)#34 |
| 7. | Faribault | 4.72% | 0.68%(+4.04)#4 | 0.030%(+4.69)#35 |
| 8. | Pelican Rapids | 4.48% | 0.68%(+3.81)#8 | 0.030%(+4.45)#43 |
| 9. | Columbia Heights | 4.06% | 0.68%(+3.39)#9 | 0.030%(+4.03)#44 |
| 10. | St Leo | 3.97% | 0.68%(+3.30)#15 | 0.030%(+3.94)#78 |
| 11. | Seatac | 3.91% | 0.11%(+3.79)#1 | 0.030%(+3.88)#79 |
| 12. | South Sioux City | 3.66% | 0.11%(+3.55)#1 | 0.030%(+3.63)#80 |
| 13. | St Cloud | 3.56% | 0.68%(+2.88)#16 | 0.030%(+3.53)#81 |
| 14. | Lexington | 3.49% | 0.11%(+3.38)#2 | 0.030%(+3.46)#82 |
| 15. | Kelliher | 3.41% | 0.68%(+2.73)#23 | 0.030%(+3.38)#107 |
| 16. | Willmar | 3.28% | 0.68%(+2.60)#24 | 0.030%(+3.25)#108 |
| 17. | Tukwila | 3.22% | 0.11%(+3.11)#2 | 0.030%(+3.19)#109 |
| 18. | Minneapolis | 3.04% | 0.68%(+2.36)#25 | 0.030%(+3.01)#110 |
| 19. | Hopedale | 2.95% | 0.0077%(+2.94)#3 | 0.030%(+2.92)#131 |
| 20. | St Joseph | 2.56% | 0.68%(+1.89)#26 | 0.030%(+2.53)#132 |
| 21. | Bryn Mawr Skyway | 2.44% | 0.11%(+2.33)#3 | 0.030%(+2.41)#133 |
| 22. | White Center | 2.43% | 0.11%(+2.32)#10 | 0.030%(+2.40)#153 |
| 23. | Postville | 2.41% | 0.027%(+2.39)#4 | 0.030%(+2.38)#174 |
| 24. | Gwinner | 2.11% | 0.19%(+1.92)#1 | 0.030%(+2.08)#175 |
| 25. | Burnsville | 2.07% | 0.68%(+1.40)#27 | 0.030%(+2.04)#176 |
| 26. | Minerva Park | 2.06% | 0.11%(+1.95)#8 | 0.030%(+2.03)#205 |
| 27. | Loretto | 2.00% | 0.68%(+1.32)#40 | 0.030%(+1.97)#236 |
| 28. | Philmont | 1.99% | 0.017%(+1.97)#2 | 0.030%(+1.96)#237 |
| 29. | Shakopee | 1.93% | 0.68%(+1.26)#41 | 0.030%(+1.90)#238 |
| 30. | Emerado | 1.92% | 0.19%(+1.73)#3 | 0.030%(+1.89)#243 |
| 31. | South Portland | 1.88% | 0.11%(+1.77)#2 | 0.030%(+1.85)#244 |
| 32. | Eden Prairie | 1.71% | 0.68%(+1.03)#42 | 0.030%(+1.68)#245 |
| 33. | Edgemont Park | 1.68% | 0.010%(+1.67)#7 | 0.030%(+1.65)#280 |
| 34. | Cactus | 1.67% | 0.0089%(+1.66)#3 | 0.030%(+1.64)#281 |
| 35. | Robbinsdale | 1.62% | 0.68%(+0.944)#43 | 0.030%(+1.59)#282 |
| 36. | Richfield | 1.58% | 0.68%(+0.906)#44 | 0.030%(+1.55)#283 |
| 37. | Rochester | 1.58% | 0.68%(+0.902)#45 | 0.030%(+1.55)#284 |
| 38. | Savage | 1.51% | 0.68%(+0.835)#46 | 0.030%(+1.48)#285 |
| 39. | Bloomington | 1.50% | 0.68%(+0.826)#47 | 0.030%(+1.47)#286 |
| 40. | Layhill | 1.47% | 0.0073%(+1.47)#7 | 0.030%(+1.44)#287 |
| 41. | Fridley | 1.47% | 0.68%(+0.798)#48 | 0.030%(+1.44)#288 |
| 42. | Fort Morgan | 1.45% | 0.022%(+1.43)#2 | 0.030%(+1.42)#289 |
| 43. | Eagan | 1.40% | 0.68%(+0.725)#49 | 0.030%(+1.37)#290 |
| 44. | Crown Heights | 1.39% | 0.017%(+1.37)#8 | 0.030%(+1.36)#340 |
| 45. | St Anthony City Hennepin And Ramsey Counties | 1.36% | 0.68%(+0.686)#50 | 0.030%(+1.33)#341 |
| 46. | Lilydale | 1.31% | 0.68%(+0.639)#56 | 0.030%(+1.28)#356 |
| 47. | Prudhoe Bay | 1.31% | 0.012%(+1.30)#6 | 0.030%(+1.28)#359 |
| 48. | Columbus | 1.27% | 0.11%(+1.16)#9 | 0.030%(+1.24)#360 |
| 49. | Port Wentworth | 1.26% | 0.014%(+1.25)#3 | 0.030%(+1.23)#361 |
| 50. | St Paul | 1.19% | 0.68%(+0.520)#57 | 0.030%(+1.17)#362 |
| 51. | Winooski | 1.18% | 0.037%(+1.15)#2 | 0.030%(+1.15)#363 |
| 52. | Bayport | 1.18% | 0.68%(+0.504)#62 | 0.030%(+1.15)#413 |
| 53. | Aberdeen | 1.16% | 0.051%(+1.11)#2 | 0.030%(+1.13)#414 |
| 54. | Claremont | 1.11% | 0.015%(+1.09)#3 | 0.030%(+1.08)#444 |
| 55. | King George | 1.08% | 0.027%(+1.05)#46 | 0.030%(+1.05)#457 |
| 56. | Fairchild Afb | 1.07% | 0.11%(+0.957)#33 | 0.030%(+1.04)#463 |
| 57. | Aloha | 1.03% | 0.038%(+0.995)#2 | 0.030%(+1.00)#464 |
| 58. | Hopkins | 0.98% | 0.68%(+0.301)#63 | 0.030%(+0.946)#465 |
| 59. | Garden City | 0.91% | 0.011%(+0.902)#3 | 0.030%(+0.883)#466 |
| 60. | Lyncourt | 0.89% | 0.017%(+0.877)#12 | 0.030%(+0.864)#467 |
| 61. | Owatonna | 0.89% | 0.68%(+0.215)#64 | 0.030%(+0.860)#468 |
| 62. | Sugarland Run | 0.89% | 0.027%(+0.863)#55 | 0.030%(+0.860)#521 |
| 63. | Roseville | 0.85% | 0.68%(+0.176)#65 | 0.030%(+0.821)#522 |
| 64. | Lewiston | 0.85% | 0.11%(+0.741)#3 | 0.030%(+0.819)#523 |
| 65. | East Grand Forks | 0.84% | 0.68%(+0.169)#68 | 0.030%(+0.815)#524 |
| 66. | Kent | 0.84% | 0.11%(+0.731)#34 | 0.030%(+0.812)#525 |
| 67. | Mendota Heights | 0.83% | 0.68%(+0.158)#79 | 0.030%(+0.803)#613 |
| 68. | Clarkston | 0.83% | 0.014%(+0.818)#4 | 0.030%(+0.802)#614 |
| 69. | Grand Forks | 0.82% | 0.19%(+0.623)#7 | 0.030%(+0.788)#615 |
| 70. | Dellwood | 0.82% | 0.028%(+0.789)#17 | 0.030%(+0.787)#626 |
| 71. | Mahtomedi | 0.79% | 0.68%(+0.117)#80 | 0.030%(+0.763)#627 |
| 72. | Apple Valley | 0.79% | 0.68%(+0.114)#81 | 0.030%(+0.760)#628 |
| 73. | Lauderdale | 0.77% | 0.68%(+0.099)#82 | 0.030%(+0.745)#629 |
| 74. | Des Moines | 0.77% | 0.11%(+0.660)#35 | 0.030%(+0.742)#630 |
| 75. | Syracuse | 0.76% | 0.017%(+0.746)#13 | 0.030%(+0.733)#631 |
| 76. | Portland | 0.76% | 0.11%(+0.651)#4 | 0.030%(+0.729)#632 |
| 77. | Lakeland North | 0.74% | 0.11%(+0.631)#36 | 0.030%(+0.712)#633 |
| 78. | Brooklyn Park | 0.73% | 0.68%(+0.053)#83 | 0.030%(+0.699)#634 |
| 79. | Fairwood Cdp King County | 0.71% | 0.11%(+0.604)#37 | 0.030%(+0.685)#635 |
| 80. | Snoqualmie Pass | 0.71% | 0.11%(+0.603)#41 | 0.030%(+0.685)#707 |
| 81. | Falcon Heights | 0.71% | 0.68%(+0.032)#84 | 0.030%(+0.677)#708 |
| 82. | Edina | 0.71% | 0.68%(+0.032)#85 | 0.030%(+0.677)#709 |
| 83. | La Vista | 0.69% | 0.11%(+0.582)#3 | 0.030%(+0.658)#738 |
| 84. | New Brighton | 0.67% | 0.68%(-0.010)#86 | 0.030%(+0.636)#739 |
| 85. | Silverton | 0.66% | 0.038%(+0.623)#5 | 0.030%(+0.631)#770 |
| 86. | Fairfax Station | 0.66% | 0.027%(+0.633)#56 | 0.030%(+0.630)#771 |
| 87. | Annandale | 0.66% | 0.027%(+0.630)#57 | 0.030%(+0.627)#772 |
| 88. | Long Prairie | 0.63% | 0.68%(-0.047)#91 | 0.030%(+0.599)#812 |
| 89. | Green Isle | 0.63% | 0.68%(-0.049)#93 | 0.030%(+0.597)#816 |
| 90. | Bull Run | 0.63% | 0.027%(+0.599)#58 | 0.030%(+0.596)#817 |
| 91. | Idylwood | 0.62% | 0.027%(+0.597)#59 | 0.030%(+0.594)#818 |
| 92. | Tama | 0.62% | 0.027%(+0.591)#24 | 0.030%(+0.589)#829 |
| 93. | New Hope | 0.62% | 0.68%(-0.060)#94 | 0.030%(+0.585)#830 |
| 94. | Lake Barcroft | 0.60% | 0.027%(+0.578)#60 | 0.030%(+0.575)#831 |
| 95. | Fargo | 0.59% | 0.19%(+0.396)#8 | 0.030%(+0.561)#832 |
| 96. | Lemon Grove | 0.56% | 0.0072%(+0.557)#14 | 0.030%(+0.534)#833 |
| 97. | Mankato | 0.55% | 0.68%(-0.122)#95 | 0.030%(+0.524)#834 |
| 98. | Akutan | 0.55% | 0.012%(+0.537)#7 | 0.030%(+0.519)#835 |
| 99. | St Louis Park | 0.55% | 0.68%(-0.128)#96 | 0.030%(+0.518)#836 |
| 100. | Liberty | 0.53% | 0.021%(+0.505)#5 | 0.030%(+0.497)#950 |
Common Questions
What are the Top 10 Cities with the Highest Percentage of Immigrants from Somalia in the United States?
Top 10 Cities with the Highest Percentage of Immigrants from Somalia in the United States are:
#1
14.00%
#2
11.24%
#3
9.77%
#4
8.37%
#5
6.84%
#6
5.87%
#7
4.72%
#8
4.48%
#9
4.06%
#10
3.97%
What city has the Highest Percentage of Immigrants from Somalia in the United States?
Urbancrest has the Highest Percentage of Immigrants from Somalia in the United States with 14.00%.
What is the Percentage of Immigrants from Somalia in the United States?
Percentage of Immigrants from Somalia in the United States is 0.030%.