Cities with the Largest Guamanian / Chamorro Community in the United States
RELATED REPORTS & OPTIONS
Guamanian / Chamorro
United States
Compare Cities
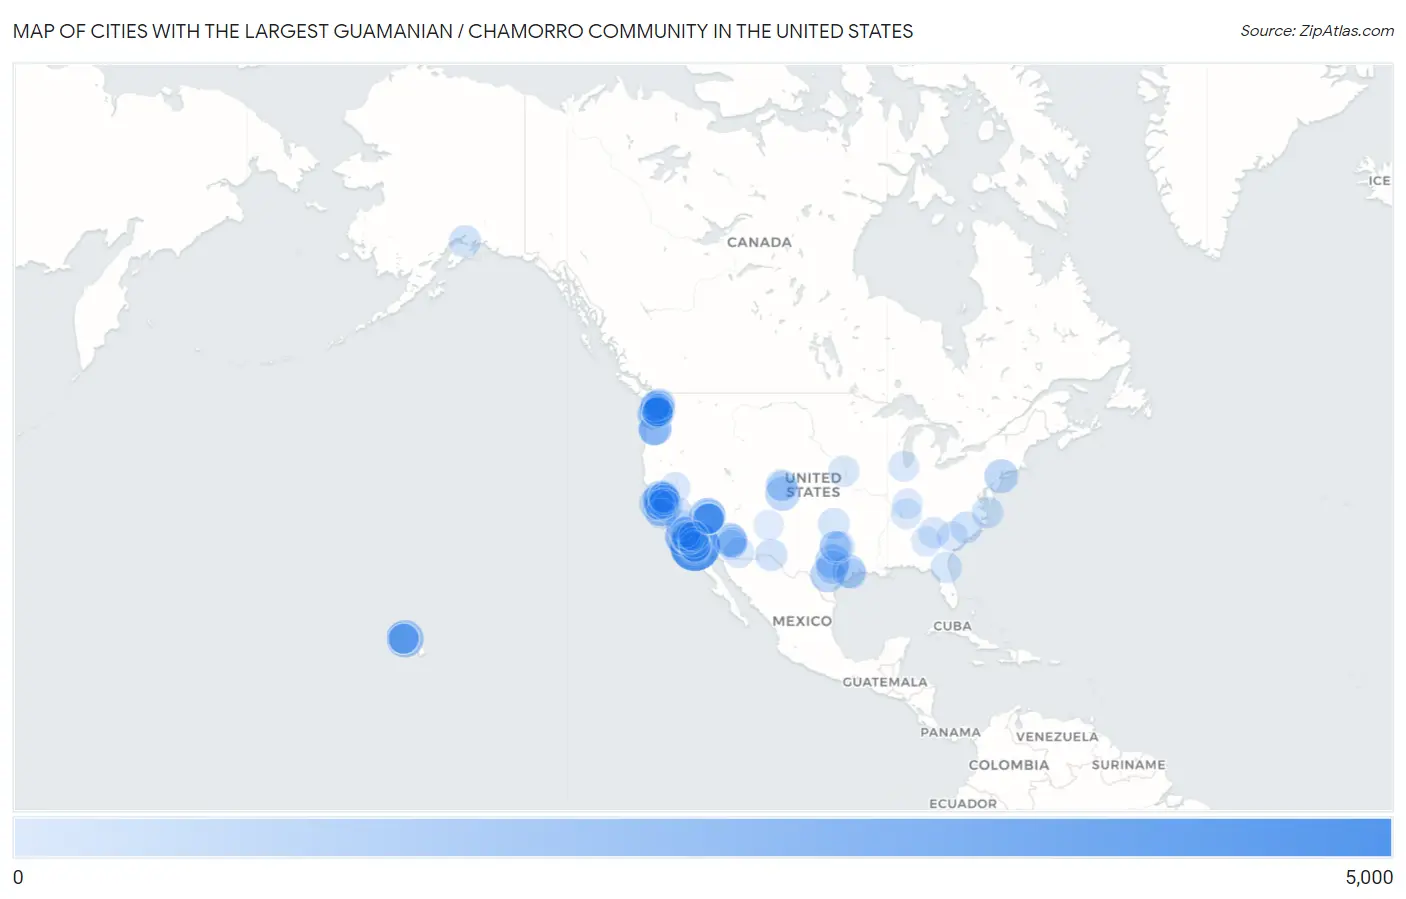
Map of Cities with the Largest Guamanian / Chamorro Community in the United States
0
5,000
Cities with the Largest Guamanian / Chamorro Community in the United States
| City | Guamanian / Chamorro | vs State | vs National | |
| 1. | San Diego | 4,081 | 45,863(8.90%)#1 | 154,057(2.65%)#1 |
| 2. | Los Angeles | 2,111 | 45,863(4.60%)#2 | 154,057(1.37%)#2 |
| 3. | Urban Honolulu | 1,643 | 6,640(24.74%)#1 | 154,057(1.07%)#3 |
| 4. | San Jose | 1,627 | 45,863(3.55%)#3 | 154,057(1.06%)#4 |
| 5. | Las Vegas | 1,480 | 5,518(26.82%)#1 | 154,057(0.96%)#5 |
| 6. | Fairfield | 1,322 | 45,863(2.88%)#4 | 154,057(0.86%)#6 |
| 7. | San Antonio | 1,114 | 14,862(7.50%)#1 | 154,057(0.72%)#7 |
| 8. | Killeen | 1,090 | 14,862(7.33%)#2 | 154,057(0.71%)#8 |
| 9. | Chula Vista | 1,059 | 45,863(2.31%)#5 | 154,057(0.69%)#9 |
| 10. | Phoenix | 1,050 | 5,321(19.73%)#1 | 154,057(0.68%)#10 |
| 11. | Colorado Springs | 1,016 | 4,054(25.06%)#1 | 154,057(0.66%)#11 |
| 12. | Lakewood | 998 | 20,359(4.90%)#1 | 154,057(0.65%)#12 |
| 13. | New York | 967 | 2,128(45.44%)#1 | 154,057(0.63%)#13 |
| 14. | Seattle | 963 | 20,359(4.73%)#2 | 154,057(0.63%)#14 |
| 15. | Houston | 886 | 14,862(5.96%)#3 | 154,057(0.58%)#15 |
| 16. | Lacey | 875 | 20,359(4.30%)#3 | 154,057(0.57%)#16 |
| 17. | North Las Vegas | 864 | 5,518(15.66%)#2 | 154,057(0.56%)#17 |
| 18. | Austin | 847 | 14,862(5.70%)#4 | 154,057(0.55%)#18 |
| 19. | Tacoma | 813 | 20,359(3.99%)#4 | 154,057(0.53%)#19 |
| 20. | Vancouver | 778 | 20,359(3.82%)#5 | 154,057(0.51%)#20 |
| 21. | Portland | 754 | 3,959(19.05%)#1 | 154,057(0.49%)#21 |
| 22. | Arlington | 742 | 14,862(4.99%)#5 | 154,057(0.48%)#22 |
| 23. | Stockton | 733 | 45,863(1.60%)#6 | 154,057(0.48%)#23 |
| 24. | San Francisco | 682 | 45,863(1.49%)#7 | 154,057(0.44%)#24 |
| 25. | Kent | 626 | 20,359(3.07%)#6 | 154,057(0.41%)#25 |
| 26. | Fresno | 619 | 45,863(1.35%)#8 | 154,057(0.40%)#26 |
| 27. | Hayward | 608 | 45,863(1.33%)#9 | 154,057(0.39%)#27 |
| 28. | Auburn | 603 | 20,359(2.96%)#7 | 154,057(0.39%)#28 |
| 29. | El Paso | 602 | 14,862(4.05%)#6 | 154,057(0.39%)#29 |
| 30. | Long Beach | 582 | 45,863(1.27%)#10 | 154,057(0.38%)#30 |
| 31. | Anchorage | 578 | 1,081(53.47%)#1 | 154,057(0.38%)#31 |
| 32. | Maili | 577 | 6,640(8.69%)#2 | 154,057(0.37%)#32 |
| 33. | Fayetteville | 559 | 3,527(15.85%)#1 | 154,057(0.36%)#33 |
| 34. | Spanaway | 547 | 20,359(2.69%)#8 | 154,057(0.36%)#34 |
| 35. | Virginia Beach | 539 | 4,031(13.37%)#1 | 154,057(0.35%)#35 |
| 36. | Carson | 528 | 45,863(1.15%)#11 | 154,057(0.34%)#36 |
| 37. | La Mesa | 520 | 45,863(1.13%)#12 | 154,057(0.34%)#37 |
| 38. | Sunrise Manor | 518 | 5,518(9.39%)#3 | 154,057(0.34%)#38 |
| 39. | Olympia | 514 | 20,359(2.52%)#9 | 154,057(0.33%)#39 |
| 40. | South Hill | 509 | 20,359(2.50%)#10 | 154,057(0.33%)#40 |
| 41. | Jacksonville | 490 | 4,821(10.16%)#1 | 154,057(0.32%)#41 |
| 42. | Vacaville | 487 | 45,863(1.06%)#13 | 154,057(0.32%)#42 |
| 43. | Henderson | 486 | 5,518(8.81%)#4 | 154,057(0.32%)#43 |
| 44. | Oklahoma City | 482 | 1,214(39.70%)#1 | 154,057(0.31%)#44 |
| 45. | Denver | 477 | 4,054(11.77%)#2 | 154,057(0.31%)#45 |
| 46. | National City | 477 | 45,863(1.04%)#14 | 154,057(0.31%)#46 |
| 47. | Norwalk | 471 | 45,863(1.03%)#15 | 154,057(0.31%)#47 |
| 48. | Vallejo | 467 | 45,863(1.02%)#16 | 154,057(0.30%)#48 |
| 49. | Spring Valley | 460 | 5,518(8.34%)#5 | 154,057(0.30%)#49 |
| 50. | Sacramento | 454 | 45,863(0.99%)#17 | 154,057(0.29%)#50 |
| 51. | Bremerton | 446 | 20,359(2.19%)#11 | 154,057(0.29%)#51 |
| 52. | Oakland | 438 | 45,863(0.96%)#18 | 154,057(0.28%)#52 |
| 53. | Moreno Valley | 434 | 45,863(0.95%)#19 | 154,057(0.28%)#53 |
| 54. | Paradise Valley | 433 | 5,321(8.14%)#2 | 154,057(0.28%)#54 |
| 55. | Aurora | 424 | 4,054(10.46%)#3 | 154,057(0.28%)#55 |
| 56. | Martha Lake | 424 | 20,359(2.08%)#12 | 154,057(0.28%)#56 |
| 57. | Omaha | 422 | 1,208(34.93%)#1 | 154,057(0.27%)#57 |
| 58. | Benicia | 418 | 45,863(0.91%)#20 | 154,057(0.27%)#58 |
| 59. | Huntington Beach | 406 | 45,863(0.89%)#21 | 154,057(0.26%)#59 |
| 60. | Bakersfield | 389 | 45,863(0.85%)#22 | 154,057(0.25%)#60 |
| 61. | Enterprise | 387 | 5,518(7.01%)#6 | 154,057(0.25%)#61 |
| 62. | Cornelia | 386 | 3,659(10.55%)#1 | 154,057(0.25%)#62 |
| 63. | Santee | 374 | 45,863(0.82%)#23 | 154,057(0.24%)#63 |
| 64. | Tucson | 361 | 5,321(6.78%)#3 | 154,057(0.23%)#64 |
| 65. | Florin | 360 | 45,863(0.78%)#24 | 154,057(0.23%)#65 |
| 66. | Reno | 359 | 5,518(6.51%)#7 | 154,057(0.23%)#66 |
| 67. | Elk Grove | 359 | 45,863(0.78%)#25 | 154,057(0.23%)#67 |
| 68. | Turlock | 359 | 45,863(0.78%)#26 | 154,057(0.23%)#68 |
| 69. | Columbia | 352 | 1,344(26.19%)#1 | 154,057(0.23%)#69 |
| 70. | Tigard | 346 | 3,959(8.74%)#2 | 154,057(0.22%)#70 |
| 71. | Chicago | 339 | 1,556(21.79%)#1 | 154,057(0.22%)#71 |
| 72. | Westmont | 325 | 45,863(0.71%)#27 | 154,057(0.21%)#72 |
| 73. | Seaside | 325 | 45,863(0.71%)#28 | 154,057(0.21%)#73 |
| 74. | Federal Way | 323 | 20,359(1.59%)#13 | 154,057(0.21%)#74 |
| 75. | Fort Worth | 318 | 14,862(2.14%)#7 | 154,057(0.21%)#75 |
| 76. | Everett | 314 | 20,359(1.54%)#14 | 154,057(0.20%)#76 |
| 77. | Fremont | 311 | 45,863(0.68%)#29 | 154,057(0.20%)#77 |
| 78. | Lodi | 311 | 45,863(0.68%)#30 | 154,057(0.20%)#78 |
| 79. | Clarksville | 307 | 1,382(22.21%)#1 | 154,057(0.20%)#79 |
| 80. | League City | 305 | 14,862(2.05%)#8 | 154,057(0.20%)#80 |
| 81. | Maricopa | 305 | 5,321(5.73%)#4 | 154,057(0.20%)#81 |
| 82. | West Loch Estate | 305 | 6,640(4.59%)#3 | 154,057(0.20%)#82 |
| 83. | Gilbert | 298 | 5,321(5.60%)#5 | 154,057(0.19%)#83 |
| 84. | Fife | 296 | 20,359(1.45%)#15 | 154,057(0.19%)#84 |
| 85. | Rancho Cucamonga | 293 | 45,863(0.64%)#31 | 154,057(0.19%)#85 |
| 86. | Santa Clarita | 292 | 45,863(0.64%)#32 | 154,057(0.19%)#86 |
| 87. | Tracy | 292 | 45,863(0.64%)#33 | 154,057(0.19%)#87 |
| 88. | Spring Valley Cdp San Diego County | 292 | 45,863(0.64%)#34 | 154,057(0.19%)#88 |
| 89. | Oceanside | 291 | 45,863(0.63%)#35 | 154,057(0.19%)#89 |
| 90. | Poulsbo | 287 | 20,359(1.41%)#16 | 154,057(0.19%)#90 |
| 91. | Paradise | 286 | 5,518(5.18%)#8 | 154,057(0.19%)#91 |
| 92. | Renton | 286 | 20,359(1.40%)#17 | 154,057(0.19%)#92 |
| 93. | Dallas | 285 | 14,862(1.92%)#9 | 154,057(0.18%)#93 |
| 94. | Ocean Pointe | 285 | 6,640(4.29%)#4 | 154,057(0.18%)#94 |
| 95. | Parkland | 283 | 20,359(1.39%)#18 | 154,057(0.18%)#95 |
| 96. | Owensboro | 280 | 887(31.57%)#1 | 154,057(0.18%)#96 |
| 97. | Peachtree City | 279 | 3,659(7.63%)#2 | 154,057(0.18%)#97 |
| 98. | Ewa Gentry | 274 | 6,640(4.13%)#5 | 154,057(0.18%)#98 |
| 99. | Rio Rancho | 270 | 760(35.53%)#1 | 154,057(0.18%)#99 |
| 100. | Loma Linda | 270 | 45,863(0.59%)#36 | 154,057(0.18%)#100 |
Common Questions
What are the Top 10 Cities with the Largest Guamanian / Chamorro Community in the United States?
Top 10 Cities with the Largest Guamanian / Chamorro Community in the United States are:
#1
4,081
#2
2,111
#3
1,643
#4
1,627
#5
1,480
#6
1,322
#7
1,114
#8
1,090
#9
1,059
#10
1,050
What city has the Largest Guamanian / Chamorro Community in the United States?
San Diego has the Largest Guamanian / Chamorro Community in the United States with 4,081.
What is the Total Guamanian / Chamorro Population in the United States?
Total Guamanian / Chamorro Population in the United States is 154,057.