Fort Mill, SC Map & Demographics
Fort Mill Map
Fort Mill Overview
$49,784
PER CAPITA INCOME
$143,099
AVG FAMILY INCOME
$128,125
AVG HOUSEHOLD INCOME
38.7%
WAGE / INCOME GAP [ % ]
61.3¢/ $1
WAGE / INCOME GAP [ $ ]
$11,960
FAMILY INCOME DEFICIT
0.39
INEQUALITY / GINI INDEX
26,022
TOTAL POPULATION
12,581
MALE POPULATION
13,441
FEMALE POPULATION
93.60
MALES / 100 FEMALES
106.84
FEMALES / 100 MALES
36.7
MEDIAN AGE
3.2
AVG FAMILY SIZE
2.9
AVG HOUSEHOLD SIZE
13,347
LABOR FORCE [ PEOPLE ]
70.6%
PERCENT IN LABOR FORCE
2.3%
UNEMPLOYMENT RATE
Fort Mill Area Codes
Income in Fort Mill
Income Overview in Fort Mill
Per Capita Income in Fort Mill is $49,784, while median incomes of families and households are $143,099 and $128,125 respectively.
| Characteristic | Number | Measure |
| Per Capita Income | 26,022 | $49,784 |
| Median Family Income | 7,283 | $143,099 |
| Mean Family Income | 7,283 | $160,860 |
| Median Household Income | 8,998 | $128,125 |
| Mean Household Income | 8,998 | $146,042 |
| Income Deficit | 7,283 | $11,960 |
| Wage / Income Gap (%) | 26,022 | 38.69% |
| Wage / Income Gap ($) | 26,022 | 61.31¢ per $1 |
| Gini / Inequality Index | 26,022 | 0.39 |
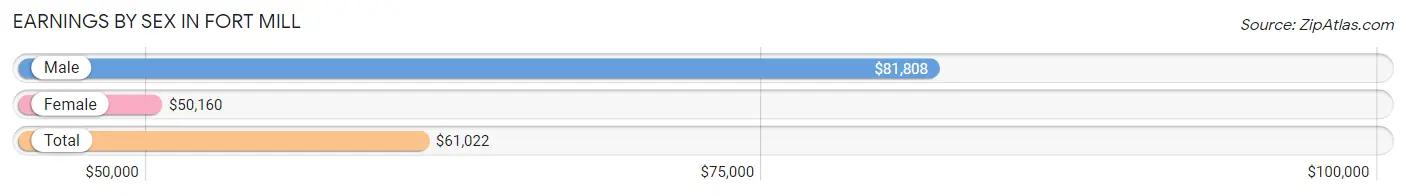
Earnings by Sex in Fort Mill
Average Earnings in Fort Mill are $61,022, $81,808 for men and $50,160 for women, a difference of 38.7%.
| Sex | Number | Average Earnings |
| Male | 6,993 (50.1%) | $81,808 |
| Female | 6,968 (49.9%) | $50,160 |
| Total | 13,961 (100.0%) | $61,022 |
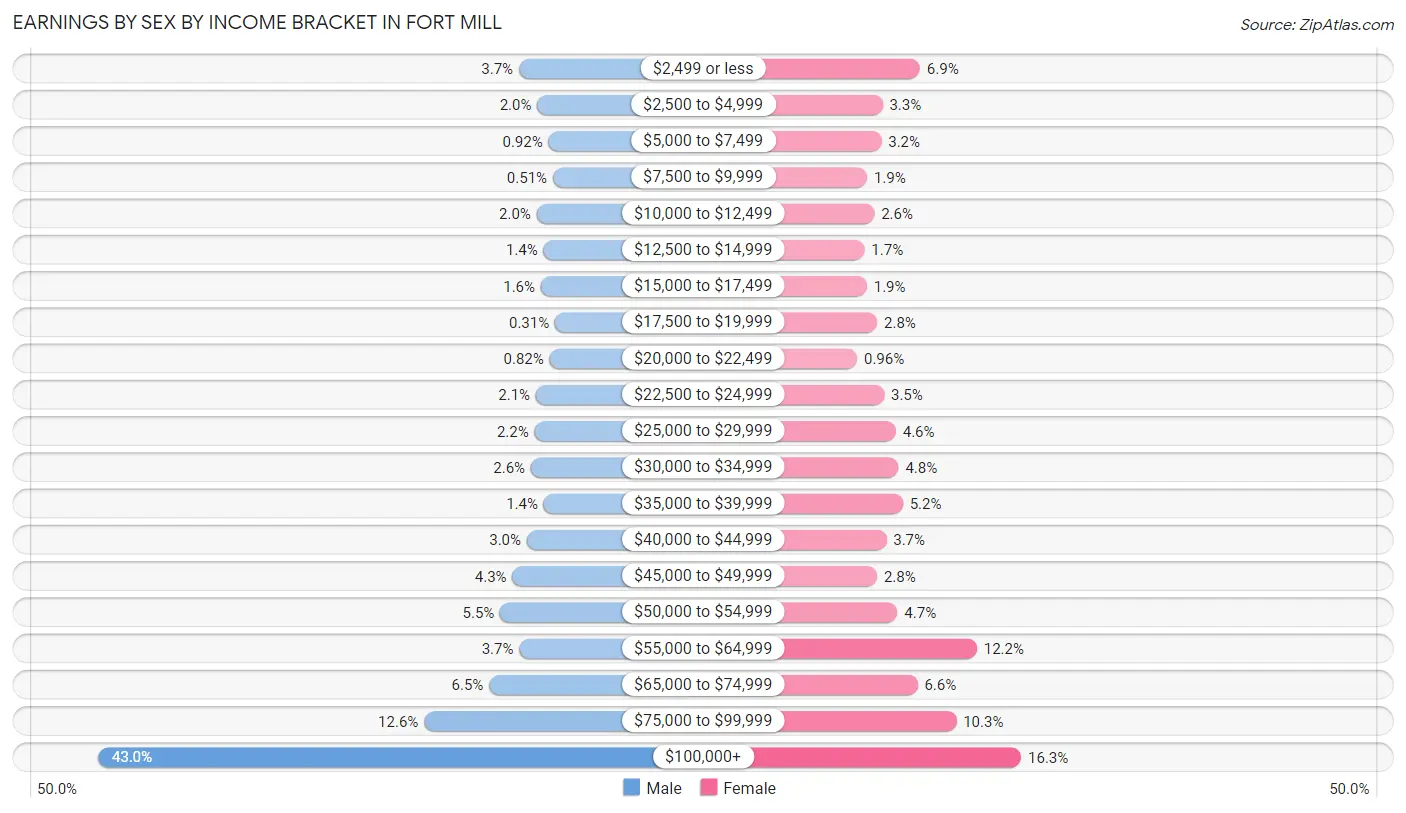
Earnings by Sex by Income Bracket in Fort Mill
The most common earnings brackets in Fort Mill are $100,000+ for men (3,010 | 43.0%) and $100,000+ for women (1,138 | 16.3%).
| Income | Male | Female |
| $2,499 or less | 258 (3.7%) | 477 (6.9%) |
| $2,500 to $4,999 | 138 (2.0%) | 233 (3.3%) |
| $5,000 to $7,499 | 64 (0.9%) | 225 (3.2%) |
| $7,500 to $9,999 | 36 (0.5%) | 132 (1.9%) |
| $10,000 to $12,499 | 142 (2.0%) | 179 (2.6%) |
| $12,500 to $14,999 | 97 (1.4%) | 115 (1.7%) |
| $15,000 to $17,499 | 115 (1.6%) | 130 (1.9%) |
| $17,500 to $19,999 | 22 (0.3%) | 198 (2.8%) |
| $20,000 to $22,499 | 57 (0.8%) | 67 (1.0%) |
| $22,500 to $24,999 | 147 (2.1%) | 243 (3.5%) |
| $25,000 to $29,999 | 156 (2.2%) | 320 (4.6%) |
| $30,000 to $34,999 | 180 (2.6%) | 337 (4.8%) |
| $35,000 to $39,999 | 95 (1.4%) | 365 (5.2%) |
| $40,000 to $44,999 | 206 (2.9%) | 258 (3.7%) |
| $45,000 to $49,999 | 301 (4.3%) | 197 (2.8%) |
| $50,000 to $54,999 | 381 (5.4%) | 330 (4.7%) |
| $55,000 to $64,999 | 256 (3.7%) | 849 (12.2%) |
| $65,000 to $74,999 | 453 (6.5%) | 461 (6.6%) |
| $75,000 to $99,999 | 879 (12.6%) | 714 (10.2%) |
| $100,000+ | 3,010 (43.0%) | 1,138 (16.3%) |
| Total | 6,993 (100.0%) | 6,968 (100.0%) |
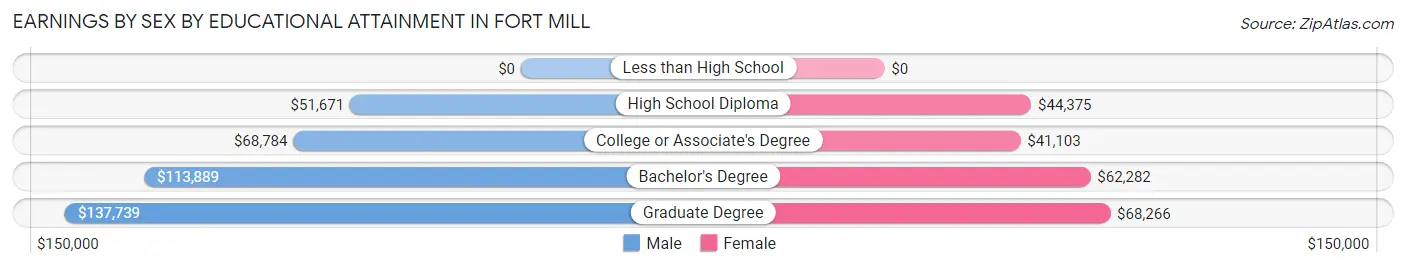
Earnings by Sex by Educational Attainment in Fort Mill
Average earnings in Fort Mill are $94,632 for men and $55,892 for women, a difference of 40.9%. Men with an educational attainment of graduate degree enjoy the highest average annual earnings of $137,739, while those with high school diploma education earn the least with $51,671. Women with an educational attainment of graduate degree earn the most with the average annual earnings of $68,266, while those with college or associate's degree education have the smallest earnings of $41,103.
| Educational Attainment | Male Income | Female Income |
| Less than High School | - | - |
| High School Diploma | $51,671 | $44,375 |
| College or Associate's Degree | $68,784 | $41,103 |
| Bachelor's Degree | $113,889 | $62,282 |
| Graduate Degree | $137,739 | $68,266 |
| Total | $94,632 | $55,892 |
Family Income in Fort Mill
Family Income Brackets in Fort Mill
According to the Fort Mill family income data, there are 1,894 families falling into the $200,000+ income range, which is the most common income bracket and makes up 26.0% of all families. Conversely, the $10,000 to $14,999 income bracket is the least frequent group with only 29 families (0.4%) belonging to this category.
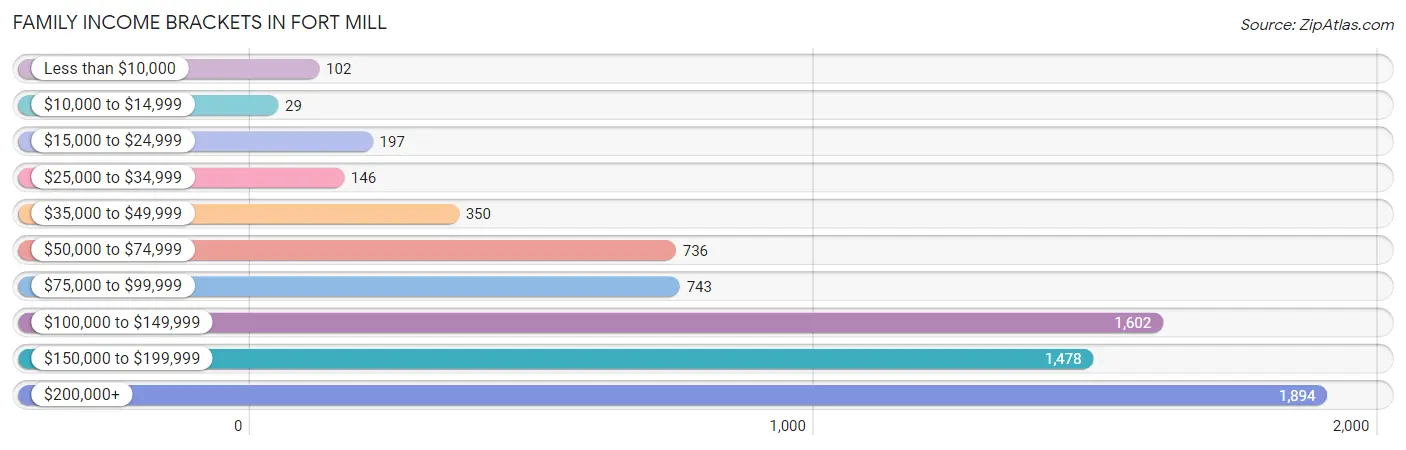
| Income Bracket | # Families | % Families |
| Less than $10,000 | 102 | 1.4% |
| $10,000 to $14,999 | 29 | 0.4% |
| $15,000 to $24,999 | 197 | 2.7% |
| $25,000 to $34,999 | 146 | 2.0% |
| $35,000 to $49,999 | 350 | 4.8% |
| $50,000 to $74,999 | 736 | 10.1% |
| $75,000 to $99,999 | 743 | 10.2% |
| $100,000 to $149,999 | 1,602 | 22.0% |
| $150,000 to $199,999 | 1,478 | 20.3% |
| $200,000+ | 1,894 | 26.0% |
Family Income by Famaliy Size in Fort Mill
5-person families (666 | 9.1%) account for the highest median family income in Fort Mill with $190,139 per family, while 2-person families (2,827 | 38.8%) have the highest median income of $48,106 per family member.
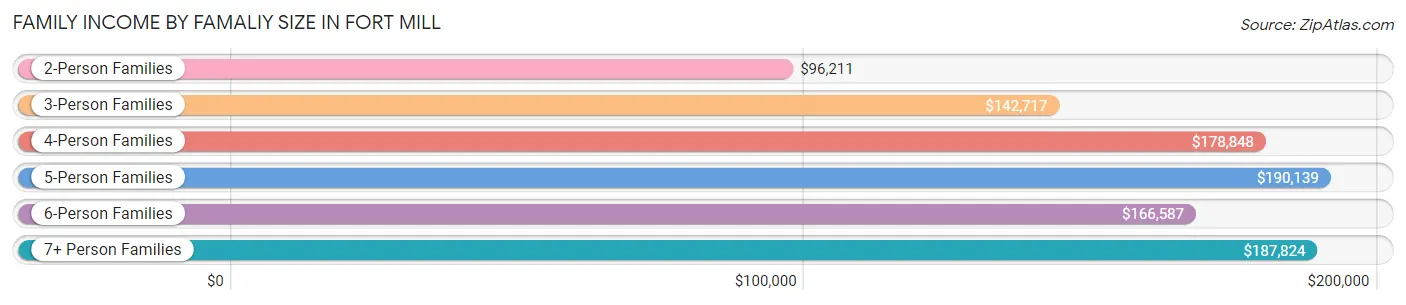
| Income Bracket | # Families | Median Income |
| 2-Person Families | 2,827 (38.8%) | $96,211 |
| 3-Person Families | 1,528 (21.0%) | $142,717 |
| 4-Person Families | 1,936 (26.6%) | $178,848 |
| 5-Person Families | 666 (9.1%) | $190,139 |
| 6-Person Families | 249 (3.4%) | $166,587 |
| 7+ Person Families | 77 (1.1%) | $187,824 |
| Total | 7,283 (100.0%) | $143,099 |
Family Income by Number of Earners in Fort Mill
The median family income in Fort Mill is $143,099, with families comprising 3+ earners (793) having the highest median family income of $177,801, while families with no earners (747) have the lowest median family income of $71,250, accounting for 10.9% and 10.3% of families, respectively.
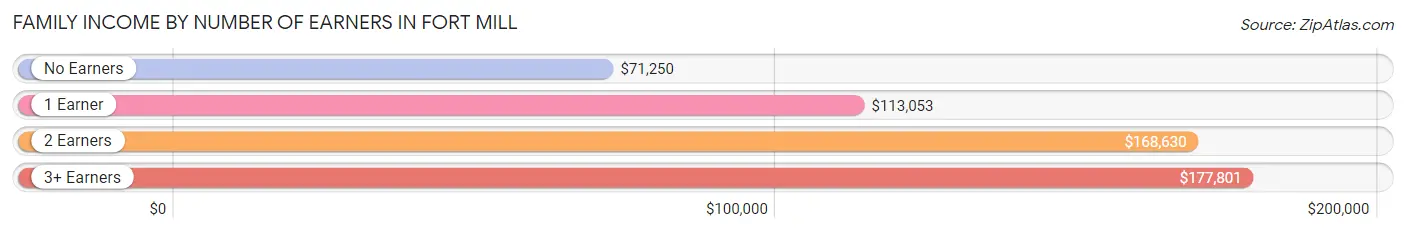
| Number of Earners | # Families | Median Income |
| No Earners | 747 (10.3%) | $71,250 |
| 1 Earner | 2,292 (31.5%) | $113,053 |
| 2 Earners | 3,451 (47.4%) | $168,630 |
| 3+ Earners | 793 (10.9%) | $177,801 |
| Total | 7,283 (100.0%) | $143,099 |
Household Income in Fort Mill
Household Income Brackets in Fort Mill
With 1,980 households falling in the category, the $200,000+ income range is the most frequent in Fort Mill, accounting for 22.0% of all households. In contrast, only 81 households (0.9%) fall into the $10,000 to $14,999 income bracket, making it the least populous group.
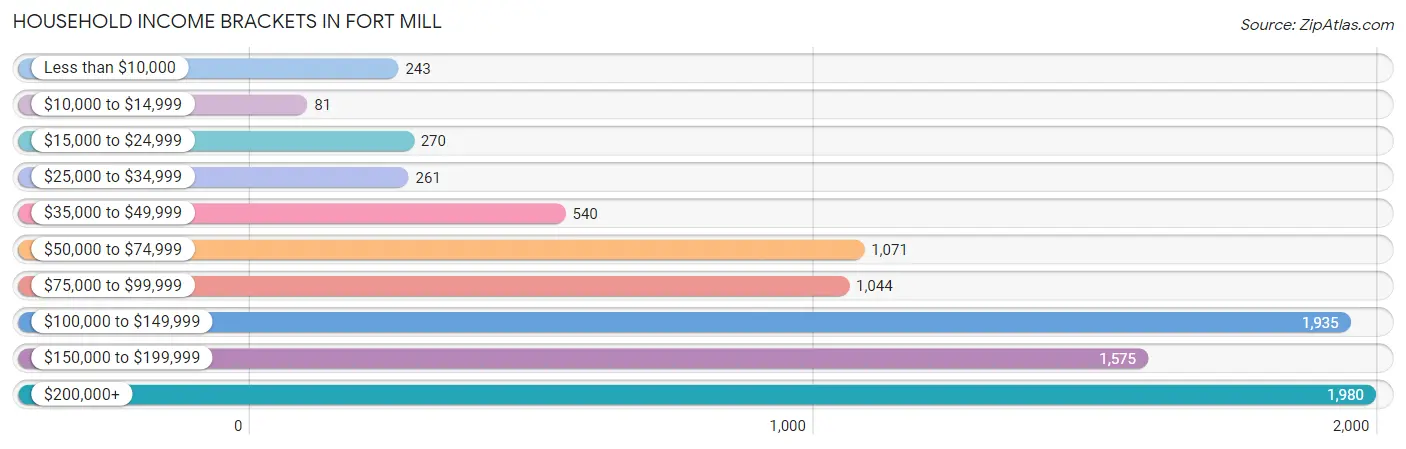
| Income Bracket | # Households | % Households |
| Less than $10,000 | 243 | 2.7% |
| $10,000 to $14,999 | 81 | 0.9% |
| $15,000 to $24,999 | 270 | 3.0% |
| $25,000 to $34,999 | 261 | 2.9% |
| $35,000 to $49,999 | 540 | 6.0% |
| $50,000 to $74,999 | 1,071 | 11.9% |
| $75,000 to $99,999 | 1,044 | 11.6% |
| $100,000 to $149,999 | 1,935 | 21.5% |
| $150,000 to $199,999 | 1,575 | 17.5% |
| $200,000+ | 1,980 | 22.0% |
Household Income by Householder Age in Fort Mill
The median household income in Fort Mill is $128,125, with the highest median household income of $146,069 found in the 25 to 44 years age bracket for the primary householder. A total of 3,431 households (38.1%) fall into this category. Meanwhile, the 15 to 24 years age bracket for the primary householder has the lowest median household income of $45,682, with 112 households (1.2%) in this group.
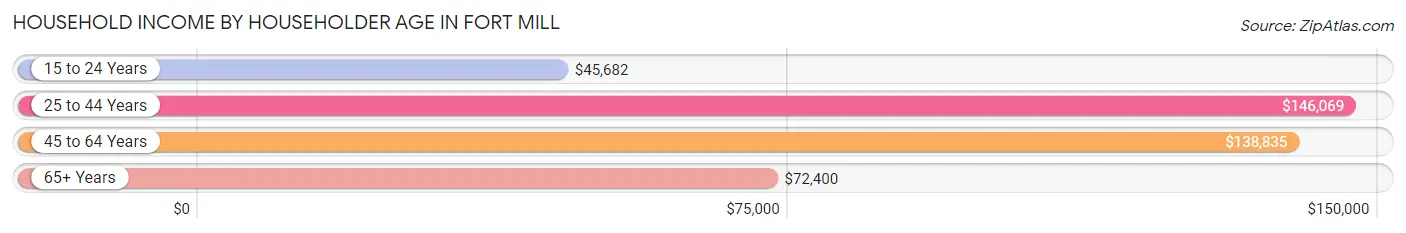
| Income Bracket | # Households | Median Income |
| 15 to 24 Years | 112 (1.2%) | $45,682 |
| 25 to 44 Years | 3,431 (38.1%) | $146,069 |
| 45 to 64 Years | 3,899 (43.3%) | $138,835 |
| 65+ Years | 1,556 (17.3%) | $72,400 |
| Total | 8,998 (100.0%) | $128,125 |
Poverty in Fort Mill
Income Below Poverty by Sex and Age in Fort Mill
With 3.9% poverty level for males and 5.2% for females among the residents of Fort Mill, 15 year old males and 18 to 24 year old females are the most vulnerable to poverty, with 106 males (22.1%) and 105 females (13.0%) in their respective age groups living below the poverty level.
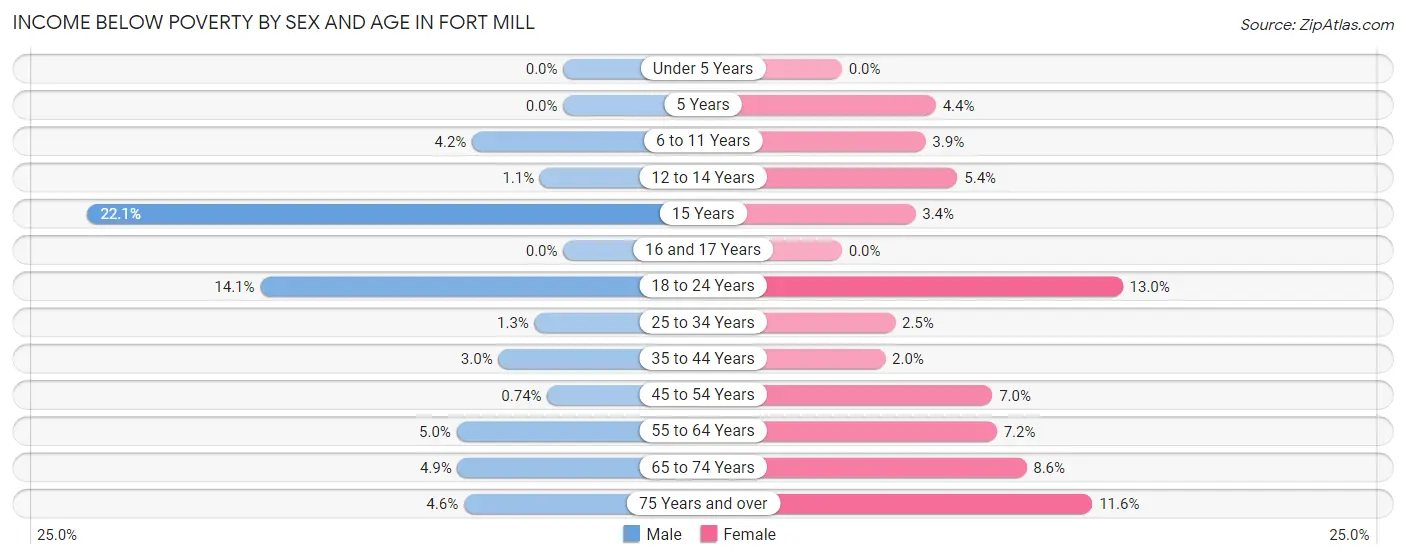
| Age Bracket | Male | Female |
| Under 5 Years | 0 (0.0%) | 0 (0.0%) |
| 5 Years | 0 (0.0%) | 13 (4.4%) |
| 6 to 11 Years | 57 (4.2%) | 46 (3.9%) |
| 12 to 14 Years | 10 (1.1%) | 36 (5.4%) |
| 15 Years | 106 (22.1%) | 15 (3.4%) |
| 16 and 17 Years | 0 (0.0%) | 0 (0.0%) |
| 18 to 24 Years | 100 (14.1%) | 105 (13.0%) |
| 25 to 34 Years | 16 (1.3%) | 39 (2.5%) |
| 35 to 44 Years | 64 (3.0%) | 48 (2.0%) |
| 45 to 54 Years | 14 (0.7%) | 158 (7.0%) |
| 55 to 64 Years | 58 (5.0%) | 98 (7.2%) |
| 65 to 74 Years | 39 (4.9%) | 79 (8.6%) |
| 75 Years and over | 21 (4.6%) | 63 (11.6%) |
| Total | 485 (3.9%) | 700 (5.2%) |
Income Above Poverty by Sex and Age in Fort Mill
According to the poverty statistics in Fort Mill, males aged under 5 years and females aged under 5 years are the age groups that are most secure financially, with 100.0% of males and 100.0% of females in these age groups living above the poverty line.
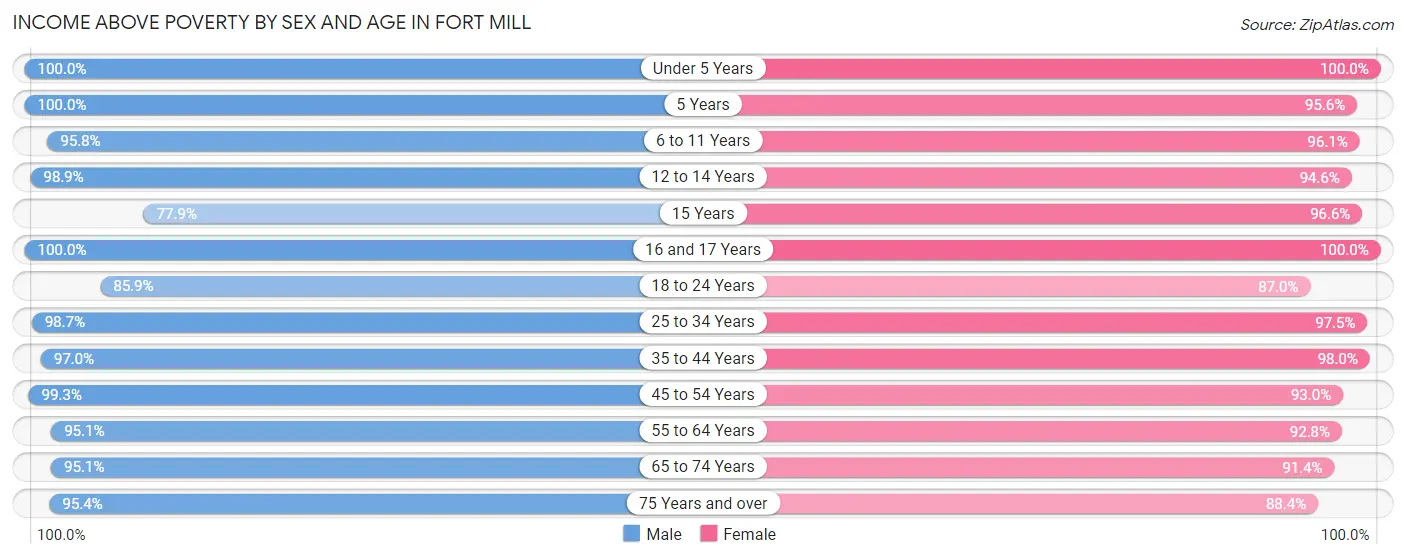
| Age Bracket | Male | Female |
| Under 5 Years | 895 (100.0%) | 668 (100.0%) |
| 5 Years | 201 (100.0%) | 285 (95.6%) |
| 6 to 11 Years | 1,291 (95.8%) | 1,139 (96.1%) |
| 12 to 14 Years | 920 (98.9%) | 636 (94.6%) |
| 15 Years | 374 (77.9%) | 425 (96.6%) |
| 16 and 17 Years | 367 (100.0%) | 320 (100.0%) |
| 18 to 24 Years | 611 (85.9%) | 701 (87.0%) |
| 25 to 34 Years | 1,190 (98.7%) | 1,537 (97.5%) |
| 35 to 44 Years | 2,064 (97.0%) | 2,337 (98.0%) |
| 45 to 54 Years | 1,874 (99.3%) | 2,105 (93.0%) |
| 55 to 64 Years | 1,113 (95.1%) | 1,265 (92.8%) |
| 65 to 74 Years | 755 (95.1%) | 844 (91.4%) |
| 75 Years and over | 435 (95.4%) | 479 (88.4%) |
| Total | 12,090 (96.1%) | 12,741 (94.8%) |
Income Below Poverty Among Married-Couple Families in Fort Mill
The poverty statistics for married-couple families in Fort Mill show that 0.8% or 43 of the total 5,562 families live below the poverty line. Families with 1 or 2 children have the highest poverty rate of 1.1%, comprising of 31 families. On the other hand, families with 3 or 4 children have the lowest poverty rate of 0.0%, which includes 0 families.
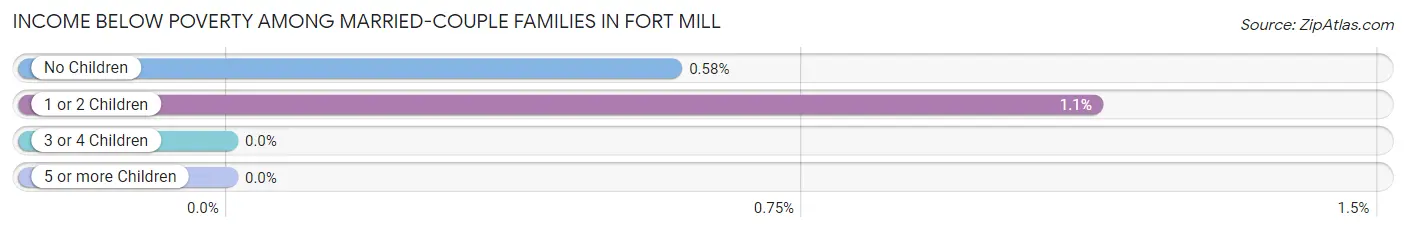
| Children | Above Poverty | Below Poverty |
| No Children | 2,070 (99.4%) | 12 (0.6%) |
| 1 or 2 Children | 2,714 (98.9%) | 31 (1.1%) |
| 3 or 4 Children | 688 (100.0%) | 0 (0.0%) |
| 5 or more Children | 47 (100.0%) | 0 (0.0%) |
| Total | 5,519 (99.2%) | 43 (0.8%) |
Income Below Poverty Among Single-Parent Households in Fort Mill
According to the poverty data in Fort Mill, 10.9% or 56 single-father households and 9.1% or 110 single-mother households are living below the poverty line. Among single-father households, those with 3 or 4 children have the highest poverty rate, with 36 households (100.0%) experiencing poverty. Likewise, among single-mother households, those with 1 or 2 children have the highest poverty rate, with 61 households (9.3%) falling below the poverty line.
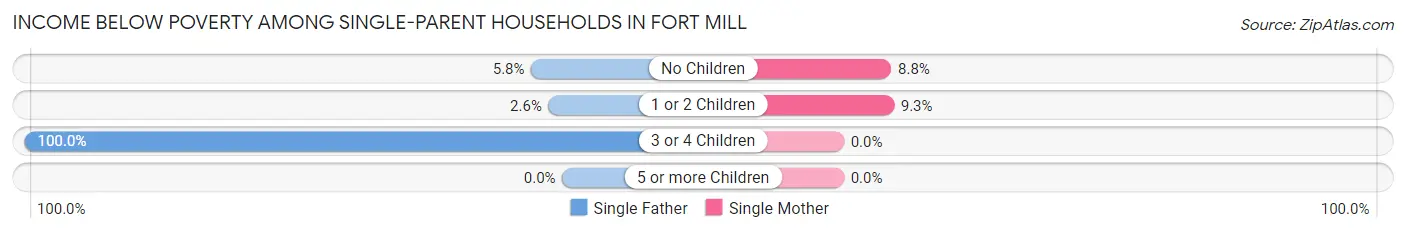
| Children | Single Father | Single Mother |
| No Children | 14 (5.8%) | 49 (8.8%) |
| 1 or 2 Children | 6 (2.6%) | 61 (9.3%) |
| 3 or 4 Children | 36 (100.0%) | 0 (0.0%) |
| 5 or more Children | 0 (0.0%) | 0 (0.0%) |
| Total | 56 (10.9%) | 110 (9.1%) |
Income Below Poverty Among Married-Couple vs Single-Parent Households in Fort Mill
The poverty data for Fort Mill shows that 43 of the married-couple family households (0.8%) and 166 of the single-parent households (9.7%) are living below the poverty level. Within the married-couple family households, those with 1 or 2 children have the highest poverty rate, with 31 households (1.1%) falling below the poverty line. Among the single-parent households, those with 3 or 4 children have the highest poverty rate, with 36 household (100.0%) living below poverty.
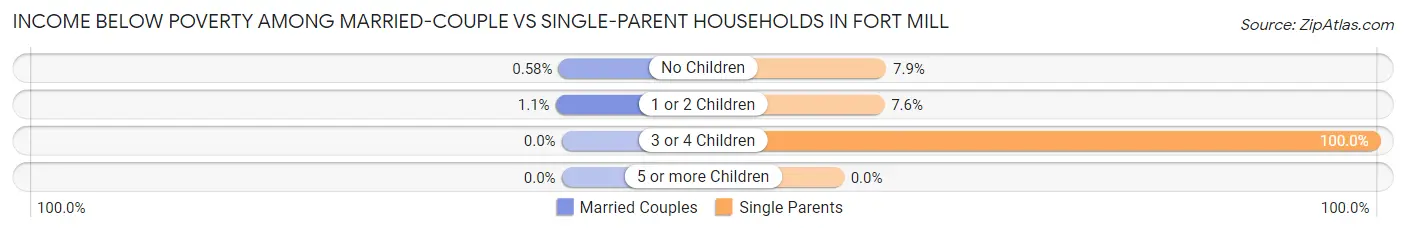
| Children | Married-Couple Families | Single-Parent Households |
| No Children | 12 (0.6%) | 63 (7.9%) |
| 1 or 2 Children | 31 (1.1%) | 67 (7.5%) |
| 3 or 4 Children | 0 (0.0%) | 36 (100.0%) |
| 5 or more Children | 0 (0.0%) | 0 (0.0%) |
| Total | 43 (0.8%) | 166 (9.7%) |
Race in Fort Mill
The most populous races in Fort Mill are White / Caucasian (20,542 | 78.9%), Black / African American (2,900 | 11.1%), and Hispanic or Latino (1,474 | 5.7%).
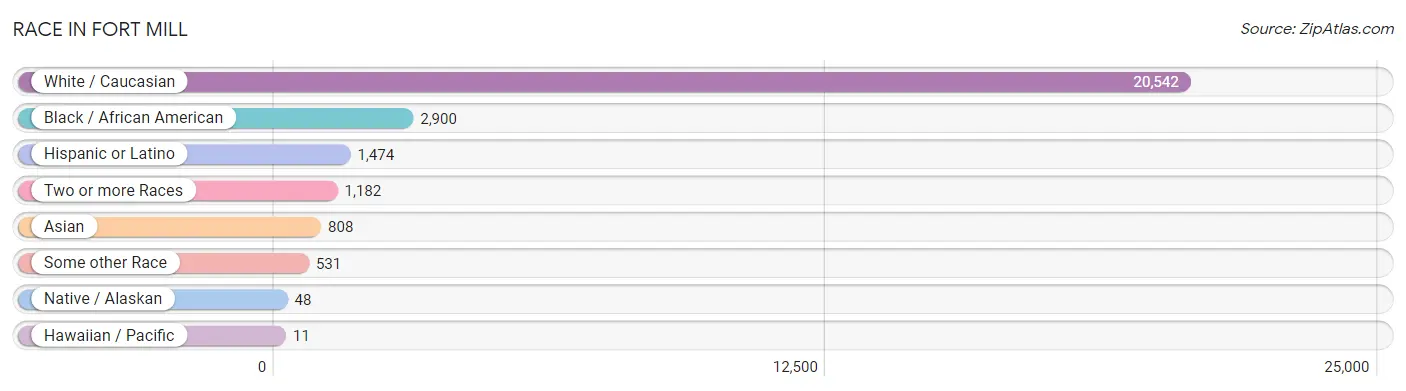
| Race | # Population | % Population |
| Asian | 808 | 3.1% |
| Black / African American | 2,900 | 11.1% |
| Hawaiian / Pacific | 11 | 0.0% |
| Hispanic or Latino | 1,474 | 5.7% |
| Native / Alaskan | 48 | 0.2% |
| White / Caucasian | 20,542 | 78.9% |
| Two or more Races | 1,182 | 4.5% |
| Some other Race | 531 | 2.0% |
| Total | 26,022 | 100.0% |
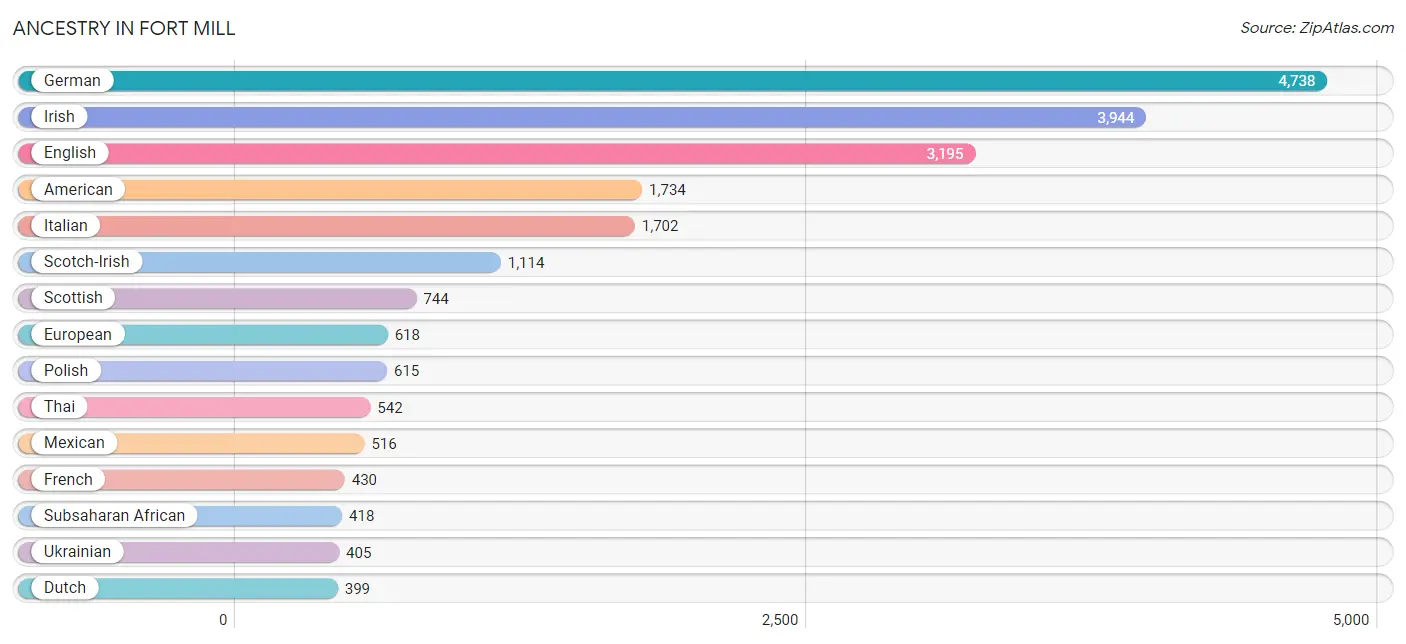
Ancestry in Fort Mill
The most populous ancestries reported in Fort Mill are German (4,738 | 18.2%), Irish (3,944 | 15.2%), English (3,195 | 12.3%), American (1,734 | 6.7%), and Italian (1,702 | 6.5%), together accounting for 58.9% of all Fort Mill residents.
| Ancestry | # Population | % Population |
| African | 383 | 1.5% |
| Albanian | 21 | 0.1% |
| Aleut | 18 | 0.1% |
| American | 1,734 | 6.7% |
| Arab | 56 | 0.2% |
| Argentinean | 69 | 0.3% |
| Australian | 20 | 0.1% |
| Austrian | 136 | 0.5% |
| Belgian | 8 | 0.0% |
| Bhutanese | 59 | 0.2% |
| British | 84 | 0.3% |
| British West Indian | 59 | 0.2% |
| Burmese | 80 | 0.3% |
| Canadian | 136 | 0.5% |
| Central American | 180 | 0.7% |
| Cherokee | 37 | 0.1% |
| Colombian | 117 | 0.4% |
| Croatian | 24 | 0.1% |
| Cuban | 245 | 0.9% |
| Czech | 121 | 0.5% |
| Czechoslovakian | 54 | 0.2% |
| Dominican | 44 | 0.2% |
| Dutch | 399 | 1.5% |
| Eastern European | 67 | 0.3% |
| Ecuadorian | 10 | 0.0% |
| English | 3,195 | 12.3% |
| Ethiopian | 15 | 0.1% |
| European | 618 | 2.4% |
| Finnish | 15 | 0.1% |
| French | 430 | 1.7% |
| French Canadian | 242 | 0.9% |
| German | 4,738 | 18.2% |
| Greek | 130 | 0.5% |
| Guamanian / Chamorro | 11 | 0.0% |
| Honduran | 55 | 0.2% |
| Hungarian | 156 | 0.6% |
| Icelander | 16 | 0.1% |
| Indian (Asian) | 19 | 0.1% |
| Indonesian | 20 | 0.1% |
| Irish | 3,944 | 15.2% |
| Israeli | 5 | 0.0% |
| Italian | 1,702 | 6.5% |
| Jamaican | 13 | 0.1% |
| Korean | 198 | 0.8% |
| Lebanese | 56 | 0.2% |
| Lithuanian | 29 | 0.1% |
| Lumbee | 22 | 0.1% |
| Malaysian | 27 | 0.1% |
| Mexican | 516 | 2.0% |
| Nicaraguan | 18 | 0.1% |
| Northern European | 93 | 0.4% |
| Norwegian | 222 | 0.9% |
| Pakistani | 46 | 0.2% |
| Peruvian | 22 | 0.1% |
| Polish | 615 | 2.4% |
| Portuguese | 226 | 0.9% |
| Puerto Rican | 220 | 0.9% |
| Romanian | 24 | 0.1% |
| Russian | 38 | 0.2% |
| Salvadoran | 107 | 0.4% |
| Scandinavian | 63 | 0.2% |
| Scotch-Irish | 1,114 | 4.3% |
| Scottish | 744 | 2.9% |
| Slavic | 28 | 0.1% |
| Slovak | 113 | 0.4% |
| Slovene | 24 | 0.1% |
| South African | 20 | 0.1% |
| South American | 269 | 1.0% |
| Subsaharan African | 418 | 1.6% |
| Swedish | 124 | 0.5% |
| Swiss | 237 | 0.9% |
| Thai | 542 | 2.1% |
| U.S. Virgin Islander | 31 | 0.1% |
| Ukrainian | 405 | 1.6% |
| Venezuelan | 51 | 0.2% |
| Welsh | 194 | 0.7% |
| Yugoslavian | 40 | 0.2% | View All 77 Rows |
Immigrants in Fort Mill
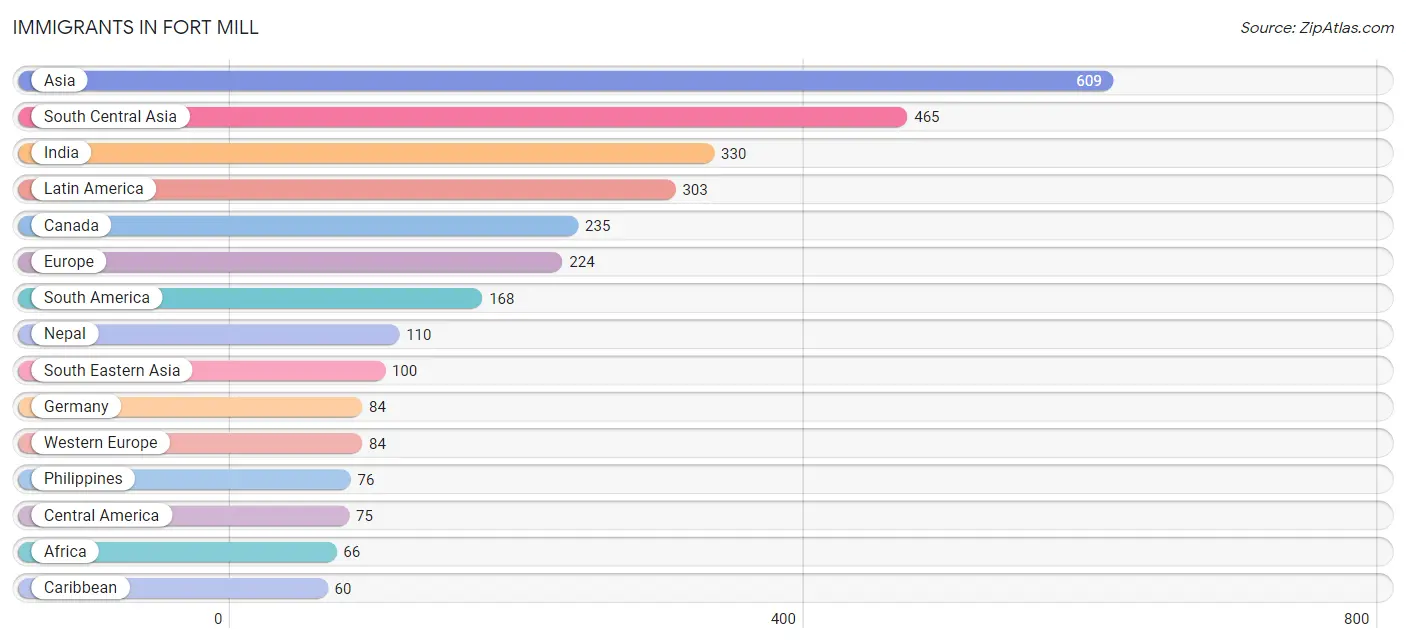
The most numerous immigrant groups reported in Fort Mill came from Asia (609 | 2.3%), South Central Asia (465 | 1.8%), India (330 | 1.3%), Latin America (303 | 1.2%), and Canada (235 | 0.9%), together accounting for 7.5% of all Fort Mill residents.
| Immigration Origin | # Population | % Population |
| Africa | 66 | 0.3% |
| Asia | 609 | 2.3% |
| Australia | 10 | 0.0% |
| Azores | 14 | 0.1% |
| Brazil | 20 | 0.1% |
| Canada | 235 | 0.9% |
| Caribbean | 60 | 0.2% |
| Central America | 75 | 0.3% |
| China | 19 | 0.1% |
| Colombia | 56 | 0.2% |
| Cuba | 21 | 0.1% |
| Eastern Africa | 46 | 0.2% |
| Eastern Asia | 21 | 0.1% |
| Eastern Europe | 59 | 0.2% |
| Ecuador | 10 | 0.0% |
| El Salvador | 17 | 0.1% |
| Europe | 224 | 0.9% |
| Germany | 84 | 0.3% |
| Greece | 11 | 0.0% |
| Honduras | 13 | 0.1% |
| Hong Kong | 19 | 0.1% |
| India | 330 | 1.3% |
| Iran | 13 | 0.1% |
| Israel | 5 | 0.0% |
| Jamaica | 39 | 0.2% |
| Japan | 2 | 0.0% |
| Kazakhstan | 12 | 0.1% |
| Kenya | 46 | 0.2% |
| Laos | 9 | 0.0% |
| Latin America | 303 | 1.2% |
| Lebanon | 18 | 0.1% |
| Mexico | 27 | 0.1% |
| Nepal | 110 | 0.4% |
| Nicaragua | 18 | 0.1% |
| Northern Europe | 56 | 0.2% |
| Oceania | 10 | 0.0% |
| Peru | 11 | 0.0% |
| Philippines | 76 | 0.3% |
| Portugal | 14 | 0.1% |
| Russia | 8 | 0.0% |
| South Africa | 20 | 0.1% |
| South America | 168 | 0.6% |
| South Central Asia | 465 | 1.8% |
| South Eastern Asia | 100 | 0.4% |
| Southern Europe | 25 | 0.1% |
| Thailand | 15 | 0.1% |
| Ukraine | 43 | 0.2% |
| Venezuela | 60 | 0.2% |
| Western Asia | 23 | 0.1% |
| Western Europe | 84 | 0.3% | View All 50 Rows |
Sex and Age in Fort Mill
Sex and Age in Fort Mill
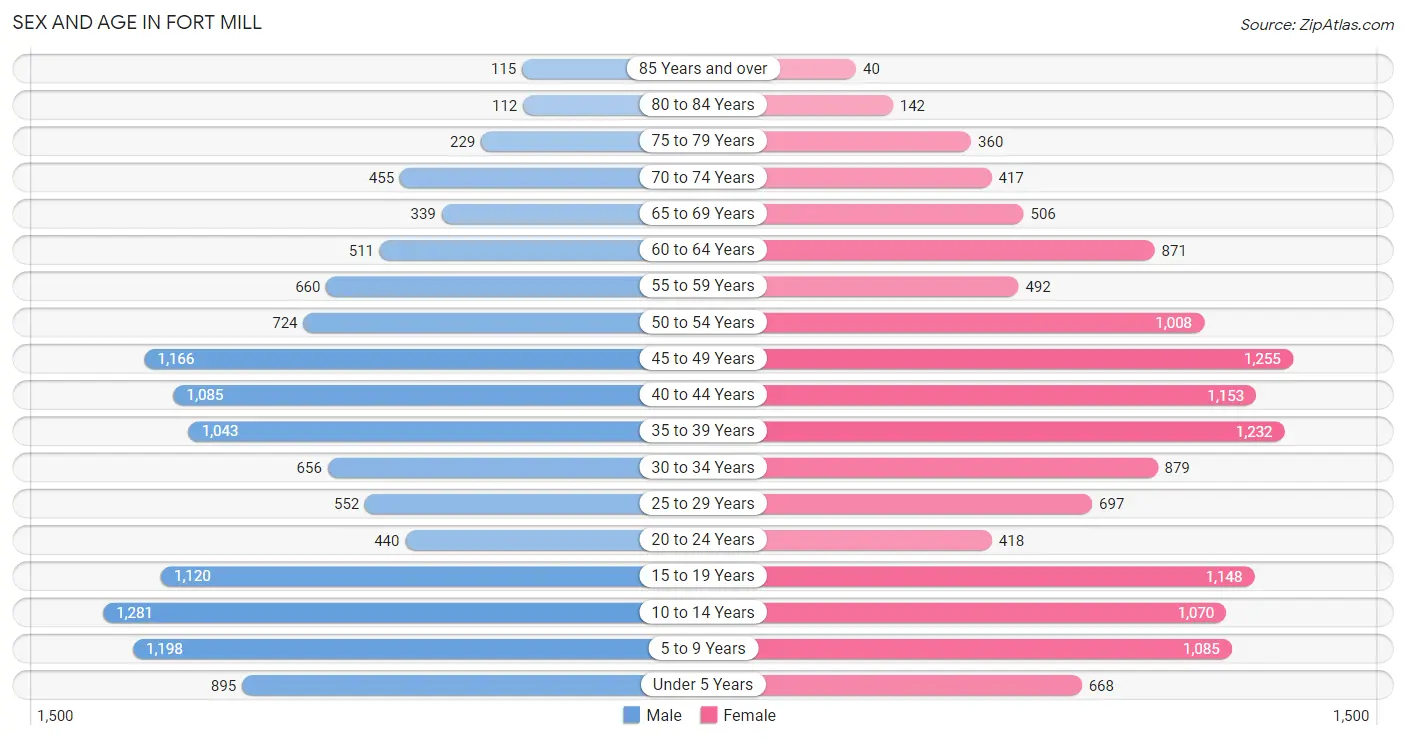
The most populous age groups in Fort Mill are 10 to 14 Years (1,281 | 10.2%) for men and 45 to 49 Years (1,255 | 9.3%) for women.
| Age Bracket | Male | Female |
| Under 5 Years | 895 (7.1%) | 668 (5.0%) |
| 5 to 9 Years | 1,198 (9.5%) | 1,085 (8.1%) |
| 10 to 14 Years | 1,281 (10.2%) | 1,070 (8.0%) |
| 15 to 19 Years | 1,120 (8.9%) | 1,148 (8.5%) |
| 20 to 24 Years | 440 (3.5%) | 418 (3.1%) |
| 25 to 29 Years | 552 (4.4%) | 697 (5.2%) |
| 30 to 34 Years | 656 (5.2%) | 879 (6.5%) |
| 35 to 39 Years | 1,043 (8.3%) | 1,232 (9.2%) |
| 40 to 44 Years | 1,085 (8.6%) | 1,153 (8.6%) |
| 45 to 49 Years | 1,166 (9.3%) | 1,255 (9.3%) |
| 50 to 54 Years | 724 (5.8%) | 1,008 (7.5%) |
| 55 to 59 Years | 660 (5.2%) | 492 (3.7%) |
| 60 to 64 Years | 511 (4.1%) | 871 (6.5%) |
| 65 to 69 Years | 339 (2.7%) | 506 (3.8%) |
| 70 to 74 Years | 455 (3.6%) | 417 (3.1%) |
| 75 to 79 Years | 229 (1.8%) | 360 (2.7%) |
| 80 to 84 Years | 112 (0.9%) | 142 (1.1%) |
| 85 Years and over | 115 (0.9%) | 40 (0.3%) |
| Total | 12,581 (100.0%) | 13,441 (100.0%) |
Families and Households in Fort Mill
Median Family Size in Fort Mill
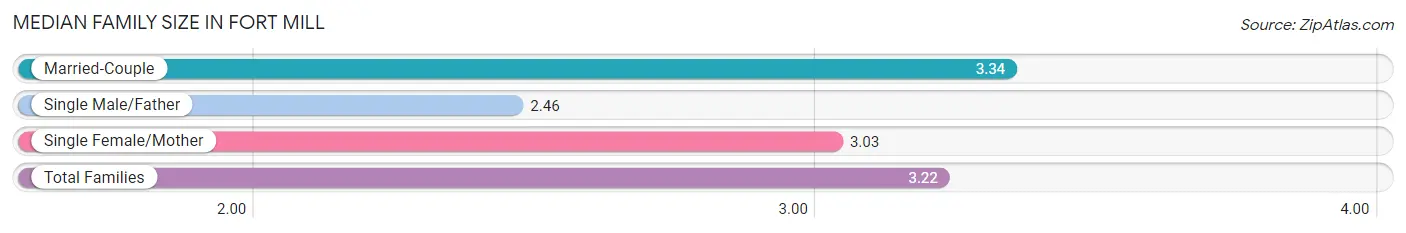
The median family size in Fort Mill is 3.22 persons per family, with married-couple families (5,562 | 76.4%) accounting for the largest median family size of 3.34 persons per family. On the other hand, single male/father families (512 | 7.0%) represent the smallest median family size with 2.46 persons per family.
| Family Type | # Families | Family Size |
| Married-Couple | 5,562 (76.4%) | 3.34 |
| Single Male/Father | 512 (7.0%) | 2.46 |
| Single Female/Mother | 1,209 (16.6%) | 3.03 |
| Total Families | 7,283 (100.0%) | 3.22 |
Median Household Size in Fort Mill
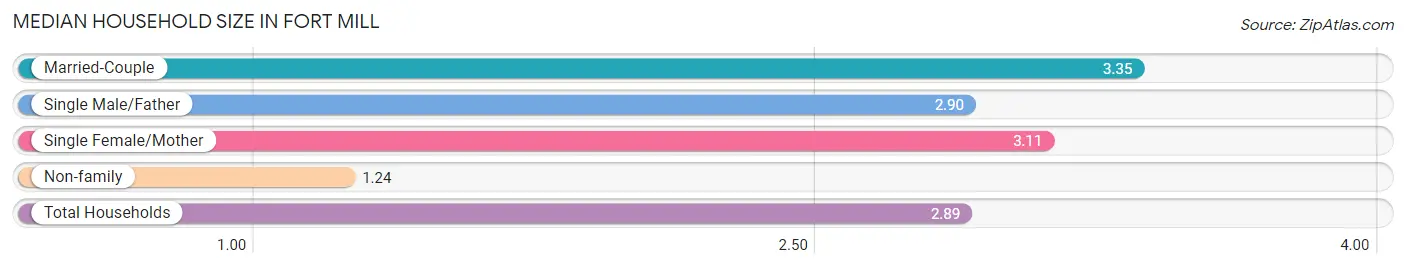
The median household size in Fort Mill is 2.89 persons per household, with married-couple households (5,562 | 61.8%) accounting for the largest median household size of 3.35 persons per household. non-family households (1,715 | 19.1%) represent the smallest median household size with 1.24 persons per household.
| Household Type | # Households | Household Size |
| Married-Couple | 5,562 (61.8%) | 3.35 |
| Single Male/Father | 512 (5.7%) | 2.90 |
| Single Female/Mother | 1,209 (13.4%) | 3.11 |
| Non-family | 1,715 (19.1%) | 1.24 |
| Total Households | 8,998 (100.0%) | 2.89 |
Household Size by Marriage Status in Fort Mill
Out of a total of 8,998 households in Fort Mill, 7,283 (80.9%) are family households, while 1,715 (19.1%) are nonfamily households. The most numerous type of family households are 2-person households, comprising 2,644, and the most common type of nonfamily households are 1-person households, comprising 1,363.
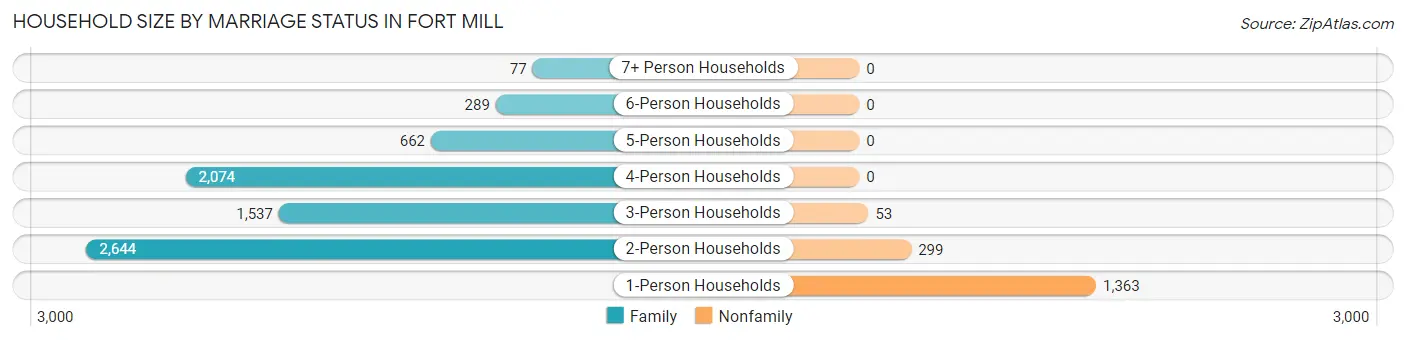
| Household Size | Family Households | Nonfamily Households |
| 1-Person Households | - | 1,363 (15.1%) |
| 2-Person Households | 2,644 (29.4%) | 299 (3.3%) |
| 3-Person Households | 1,537 (17.1%) | 53 (0.6%) |
| 4-Person Households | 2,074 (23.1%) | 0 (0.0%) |
| 5-Person Households | 662 (7.4%) | 0 (0.0%) |
| 6-Person Households | 289 (3.2%) | 0 (0.0%) |
| 7+ Person Households | 77 (0.9%) | 0 (0.0%) |
| Total | 7,283 (80.9%) | 1,715 (19.1%) |
Female Fertility in Fort Mill
Fertility by Age in Fort Mill
Average fertility rate in Fort Mill is 48.0 births per 1,000 women. Women in the age bracket of 20 to 34 years have the highest fertility rate with 87.0 births per 1,000 women. Women in the age bracket of 20 to 34 years acount for 51.0% of all women with births.
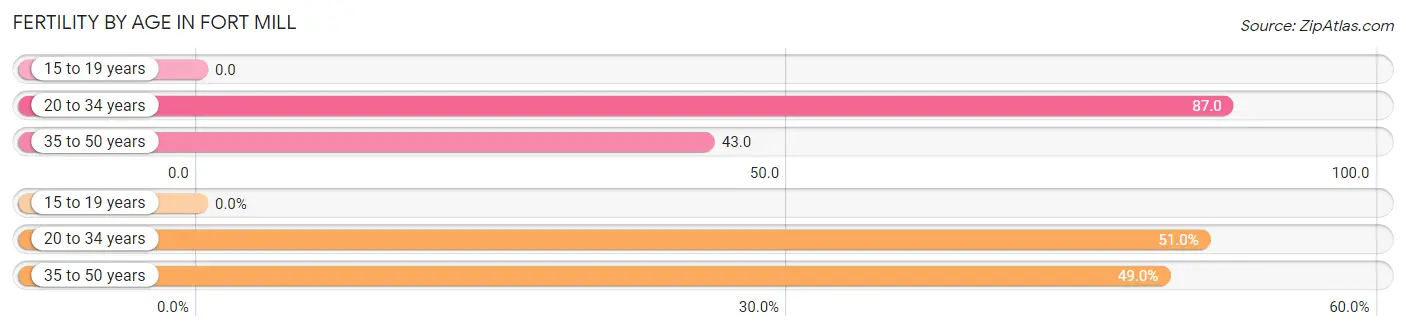
| Age Bracket | Women with Births | Births / 1,000 Women |
| 15 to 19 years | 0 (0.0%) | 0.0 |
| 20 to 34 years | 174 (51.0%) | 87.0 |
| 35 to 50 years | 167 (49.0%) | 43.0 |
| Total | 341 (100.0%) | 48.0 |
Fertility by Age by Marriage Status in Fort Mill
88.0% of women with births (341) in Fort Mill are married. The highest percentage of unmarried women with births falls into 35 to 50 years age bracket with 24.5% of them unmarried at the time of birth, while the lowest percentage of unmarried women with births belong to 20 to 34 years age bracket with 0.0% of them unmarried.
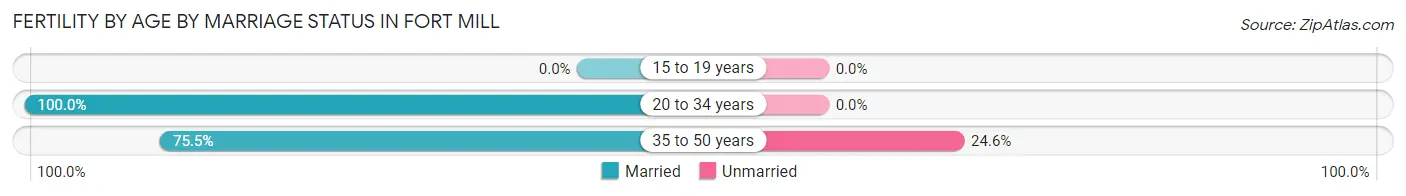
| Age Bracket | Married | Unmarried |
| 15 to 19 years | 0 (0.0%) | 0 (0.0%) |
| 20 to 34 years | 174 (100.0%) | 0 (0.0%) |
| 35 to 50 years | 126 (75.4%) | 41 (24.5%) |
| Total | 300 (88.0%) | 41 (12.0%) |
Fertility by Education in Fort Mill
Average fertility rate in Fort Mill is 48.0 births per 1,000 women. Women with the education attainment of bachelor's degree have the highest fertility rate of 84.0 births per 1,000 women, while women with the education attainment of less than high school have the lowest fertility at 14.0 births per 1,000 women. Women with the education attainment of bachelor's degree represent 47.2% of all women with births.
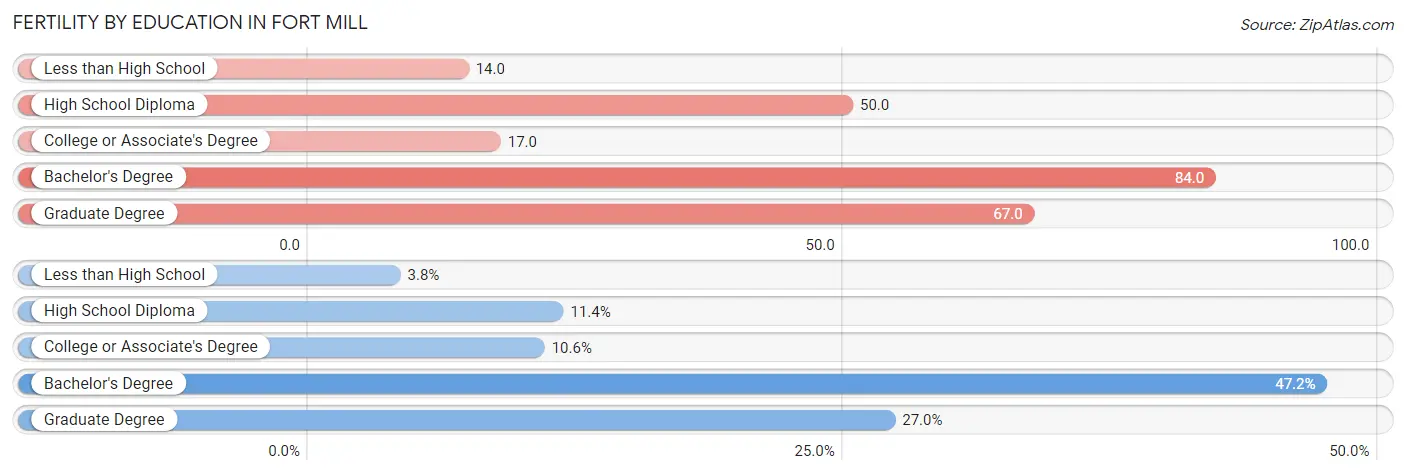
| Educational Attainment | Women with Births | Births / 1,000 Women |
| Less than High School | 13 (3.8%) | 14.0 |
| High School Diploma | 39 (11.4%) | 50.0 |
| College or Associate's Degree | 36 (10.6%) | 17.0 |
| Bachelor's Degree | 161 (47.2%) | 84.0 |
| Graduate Degree | 92 (27.0%) | 67.0 |
| Total | 341 (100.0%) | 48.0 |
Fertility by Education by Marriage Status in Fort Mill
12.0% of women with births in Fort Mill are unmarried. Women with the educational attainment of high school diploma are most likely to be married with 100.0% of them married at childbirth, while women with the educational attainment of college or associate's degree are least likely to be married with 41.7% of them unmarried at childbirth.
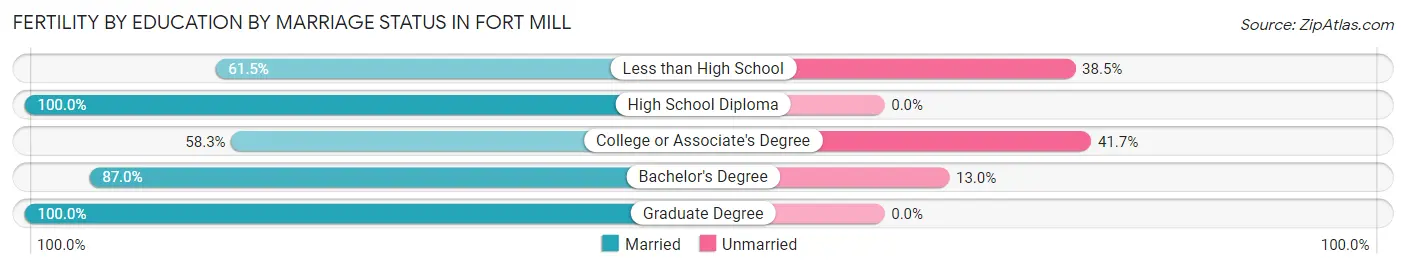
| Educational Attainment | Married | Unmarried |
| Less than High School | 8 (61.5%) | 5 (38.5%) |
| High School Diploma | 39 (100.0%) | 0 (0.0%) |
| College or Associate's Degree | 21 (58.3%) | 15 (41.7%) |
| Bachelor's Degree | 140 (87.0%) | 21 (13.0%) |
| Graduate Degree | 92 (100.0%) | 0 (0.0%) |
| Total | 300 (88.0%) | 41 (12.0%) |
Employment Characteristics in Fort Mill
Employment by Class of Employer in Fort Mill
Among the 12,926 employed individuals in Fort Mill, private company employees (9,670 | 74.8%), not-for-profit organizations (757 | 5.9%), and local government employees (718 | 5.6%) make up the most common classes of employment.
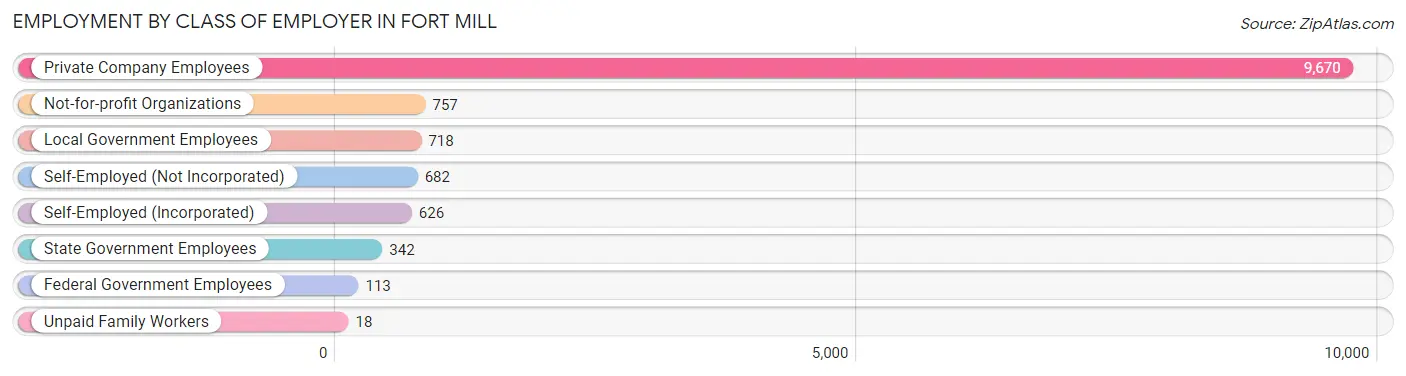
| Employer Class | # Employees | % Employees |
| Private Company Employees | 9,670 | 74.8% |
| Self-Employed (Incorporated) | 626 | 4.8% |
| Self-Employed (Not Incorporated) | 682 | 5.3% |
| Not-for-profit Organizations | 757 | 5.9% |
| Local Government Employees | 718 | 5.6% |
| State Government Employees | 342 | 2.6% |
| Federal Government Employees | 113 | 0.9% |
| Unpaid Family Workers | 18 | 0.1% |
| Total | 12,926 | 100.0% |
Employment Status by Age in Fort Mill
According to the labor force statistics for Fort Mill, out of the total population over 16 years of age (18,905), 70.6% or 13,347 individuals are in the labor force, with 2.3% or 307 of them unemployed. The age group with the highest labor force participation rate is 20 to 24 years, with 89.9% or 771 individuals in the labor force. Within the labor force, the 16 to 19 years age range has the highest percentage of unemployed individuals, with 11.7% or 68 of them being unemployed.
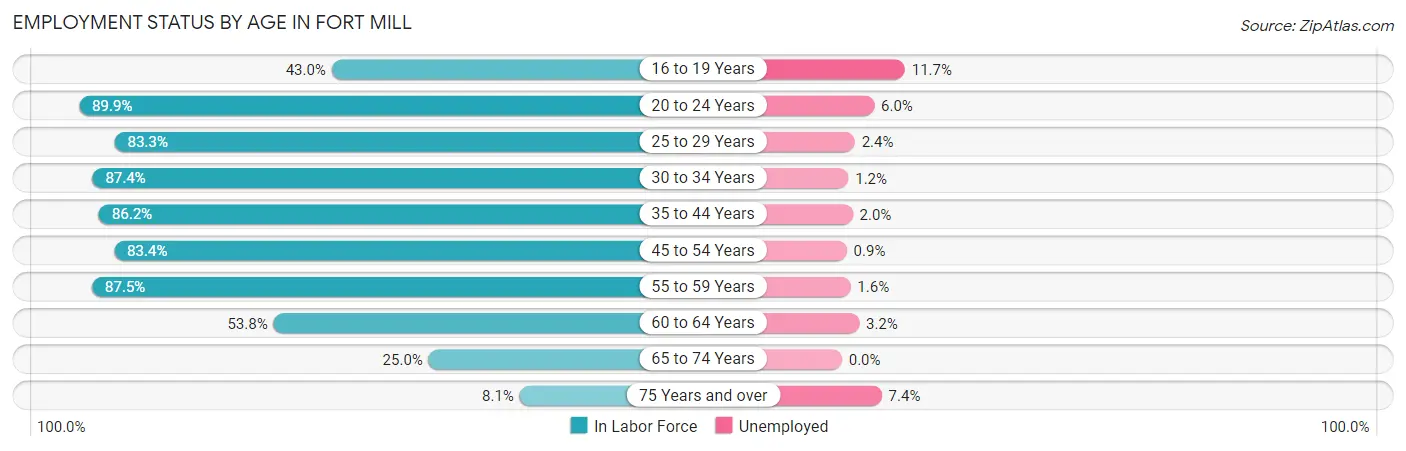
| Age Bracket | In Labor Force | Unemployed |
| 16 to 19 Years | 580 (43.0%) | 68 (11.7%) |
| 20 to 24 Years | 771 (89.9%) | 46 (6.0%) |
| 25 to 29 Years | 1,040 (83.3%) | 25 (2.4%) |
| 30 to 34 Years | 1,342 (87.4%) | 16 (1.2%) |
| 35 to 44 Years | 3,890 (86.2%) | 78 (2.0%) |
| 45 to 54 Years | 3,464 (83.4%) | 31 (0.9%) |
| 55 to 59 Years | 1,008 (87.5%) | 16 (1.6%) |
| 60 to 64 Years | 744 (53.8%) | 24 (3.2%) |
| 65 to 74 Years | 429 (25.0%) | 0 (0.0%) |
| 75 Years and over | 81 (8.1%) | 6 (7.4%) |
| Total | 13,347 (70.6%) | 307 (2.3%) |
Employment Status by Educational Attainment in Fort Mill
According to labor force statistics for Fort Mill, 82.1% of individuals (11,481) out of the total population between 25 and 64 years of age (13,984) are in the labor force, with 1.7% or 195 of them being unemployed. The group with the highest labor force participation rate are those with the educational attainment of bachelor's degree or higher, with 86.1% or 6,988 individuals in the labor force. Within the labor force, individuals with college / associate degree education have the highest percentage of unemployment, with 2.7% or 81 of them being unemployed.
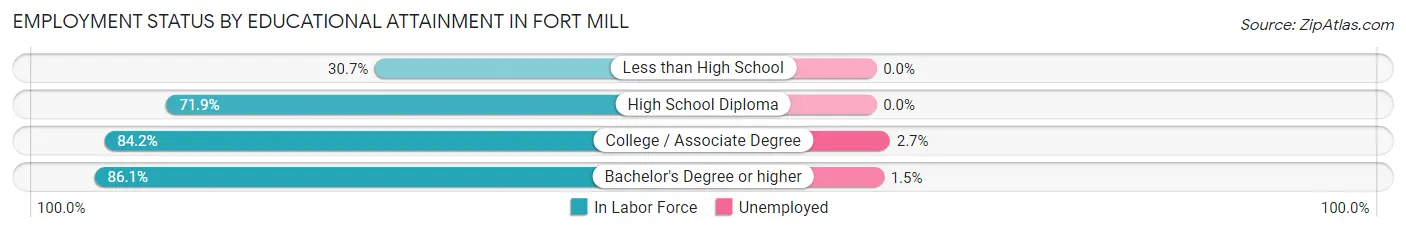
| Educational Attainment | In Labor Force | Unemployed |
| Less than High School | 119 (30.7%) | 0 (0.0%) |
| High School Diploma | 1,391 (71.9%) | 0 (0.0%) |
| College / Associate Degree | 2,986 (84.2%) | 96 (2.7%) |
| Bachelor's Degree or higher | 6,988 (86.1%) | 122 (1.5%) |
| Total | 11,481 (82.1%) | 238 (1.7%) |
Employment Occupations by Sex in Fort Mill
Management, Business, Science and Arts Occupations
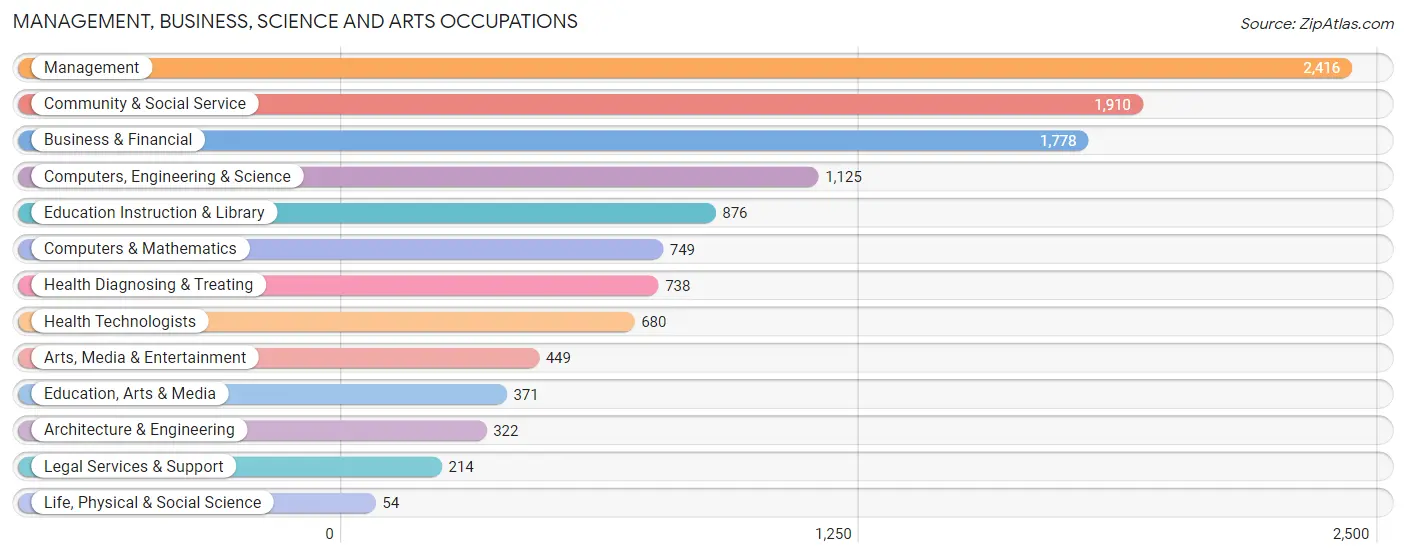
The most common Management, Business, Science and Arts occupations in Fort Mill are Management (2,416 | 18.5%), Community & Social Service (1,910 | 14.7%), Business & Financial (1,778 | 13.6%), Computers, Engineering & Science (1,125 | 8.6%), and Education Instruction & Library (876 | 6.7%).
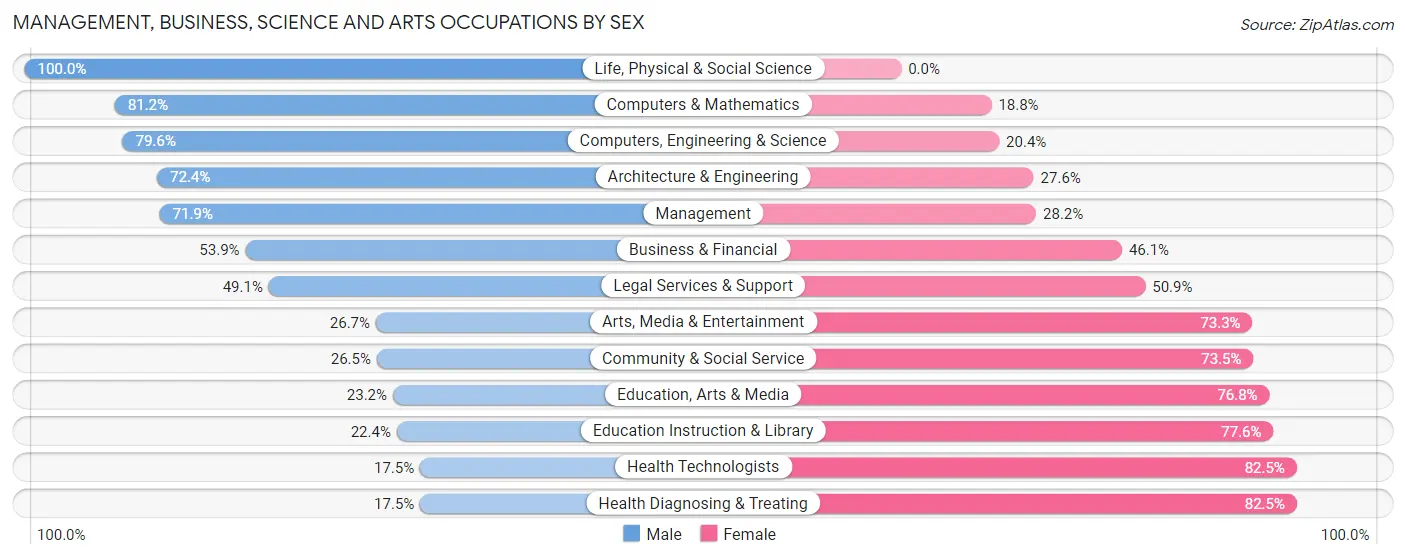
Management, Business, Science and Arts Occupations by Sex
Within the Management, Business, Science and Arts occupations in Fort Mill, the most male-oriented occupations are Life, Physical & Social Science (100.0%), Computers & Mathematics (81.2%), and Computers, Engineering & Science (79.6%), while the most female-oriented occupations are Health Diagnosing & Treating (82.5%), Health Technologists (82.5%), and Education Instruction & Library (77.6%).
| Occupation | Male | Female |
| Management | 1,736 (71.9%) | 680 (28.1%) |
| Business & Financial | 959 (53.9%) | 819 (46.1%) |
| Computers, Engineering & Science | 895 (79.6%) | 230 (20.4%) |
| Computers & Mathematics | 608 (81.2%) | 141 (18.8%) |
| Architecture & Engineering | 233 (72.4%) | 89 (27.6%) |
| Life, Physical & Social Science | 54 (100.0%) | 0 (0.0%) |
| Community & Social Service | 507 (26.5%) | 1,403 (73.5%) |
| Education, Arts & Media | 86 (23.2%) | 285 (76.8%) |
| Legal Services & Support | 105 (49.1%) | 109 (50.9%) |
| Education Instruction & Library | 196 (22.4%) | 680 (77.6%) |
| Arts, Media & Entertainment | 120 (26.7%) | 329 (73.3%) |
| Health Diagnosing & Treating | 129 (17.5%) | 609 (82.5%) |
| Health Technologists | 119 (17.5%) | 561 (82.5%) |
| Total (Category) | 4,226 (53.0%) | 3,741 (47.0%) |
| Total (Overall) | 6,591 (50.6%) | 6,442 (49.4%) |
Services Occupations
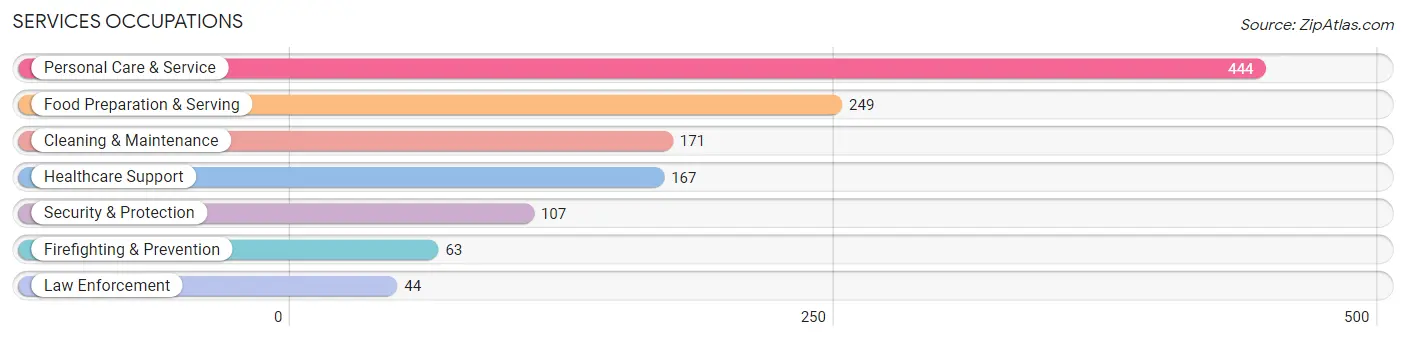
The most common Services occupations in Fort Mill are Personal Care & Service (444 | 3.4%), Food Preparation & Serving (249 | 1.9%), Cleaning & Maintenance (171 | 1.3%), Healthcare Support (167 | 1.3%), and Security & Protection (107 | 0.8%).
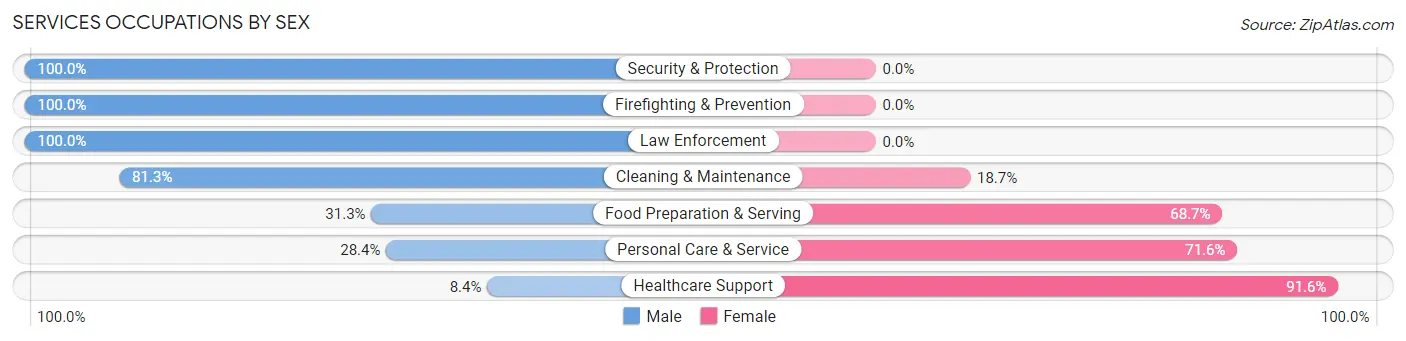
Services Occupations by Sex
Within the Services occupations in Fort Mill, the most male-oriented occupations are Security & Protection (100.0%), Firefighting & Prevention (100.0%), and Law Enforcement (100.0%), while the most female-oriented occupations are Healthcare Support (91.6%), Personal Care & Service (71.6%), and Food Preparation & Serving (68.7%).
| Occupation | Male | Female |
| Healthcare Support | 14 (8.4%) | 153 (91.6%) |
| Security & Protection | 107 (100.0%) | 0 (0.0%) |
| Firefighting & Prevention | 63 (100.0%) | 0 (0.0%) |
| Law Enforcement | 44 (100.0%) | 0 (0.0%) |
| Food Preparation & Serving | 78 (31.3%) | 171 (68.7%) |
| Cleaning & Maintenance | 139 (81.3%) | 32 (18.7%) |
| Personal Care & Service | 126 (28.4%) | 318 (71.6%) |
| Total (Category) | 464 (40.8%) | 674 (59.2%) |
| Total (Overall) | 6,591 (50.6%) | 6,442 (49.4%) |
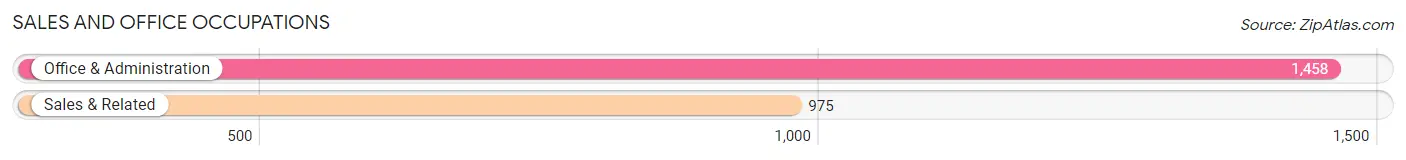
Sales and Office Occupations
The most common Sales and Office occupations in Fort Mill are Office & Administration (1,458 | 11.2%), and Sales & Related (975 | 7.5%).
Sales and Office Occupations by Sex
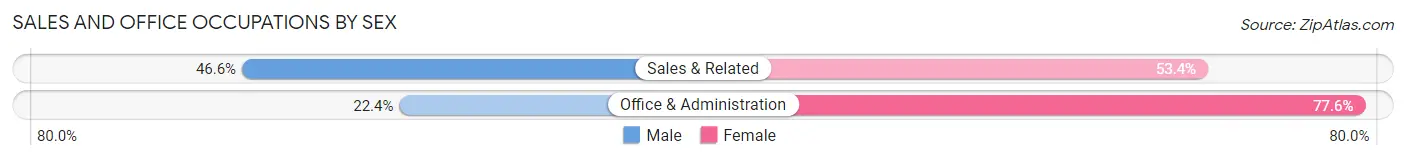
| Occupation | Male | Female |
| Sales & Related | 454 (46.6%) | 521 (53.4%) |
| Office & Administration | 326 (22.4%) | 1,132 (77.6%) |
| Total (Category) | 780 (32.1%) | 1,653 (67.9%) |
| Total (Overall) | 6,591 (50.6%) | 6,442 (49.4%) |
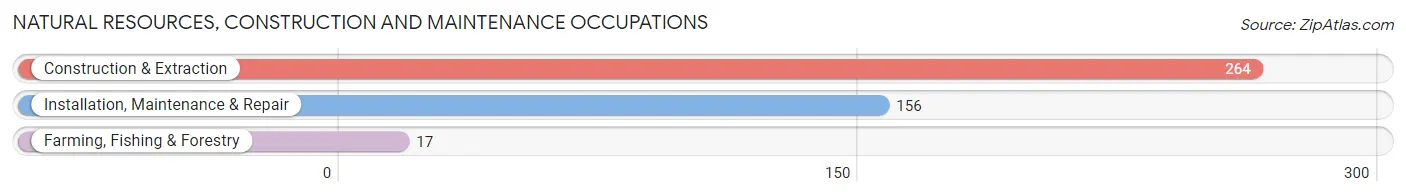
Natural Resources, Construction and Maintenance Occupations
The most common Natural Resources, Construction and Maintenance occupations in Fort Mill are Construction & Extraction (264 | 2.0%), Installation, Maintenance & Repair (156 | 1.2%), and Farming, Fishing & Forestry (17 | 0.1%).
Natural Resources, Construction and Maintenance Occupations by Sex
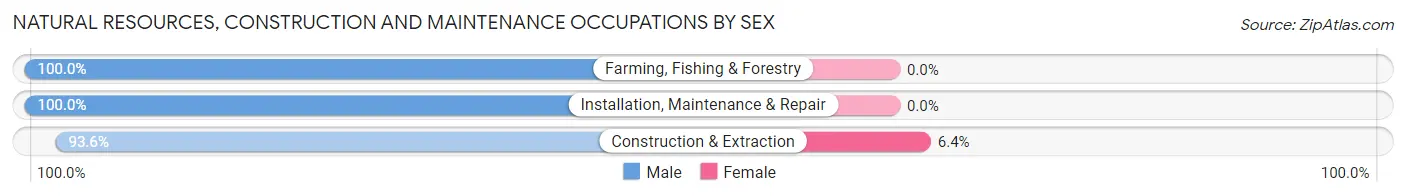
| Occupation | Male | Female |
| Farming, Fishing & Forestry | 17 (100.0%) | 0 (0.0%) |
| Construction & Extraction | 247 (93.6%) | 17 (6.4%) |
| Installation, Maintenance & Repair | 156 (100.0%) | 0 (0.0%) |
| Total (Category) | 420 (96.1%) | 17 (3.9%) |
| Total (Overall) | 6,591 (50.6%) | 6,442 (49.4%) |
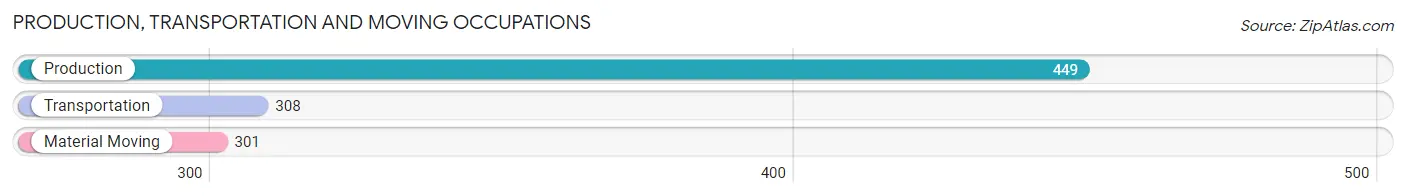
Production, Transportation and Moving Occupations
The most common Production, Transportation and Moving occupations in Fort Mill are Production (449 | 3.5%), Transportation (308 | 2.4%), and Material Moving (301 | 2.3%).
Production, Transportation and Moving Occupations by Sex
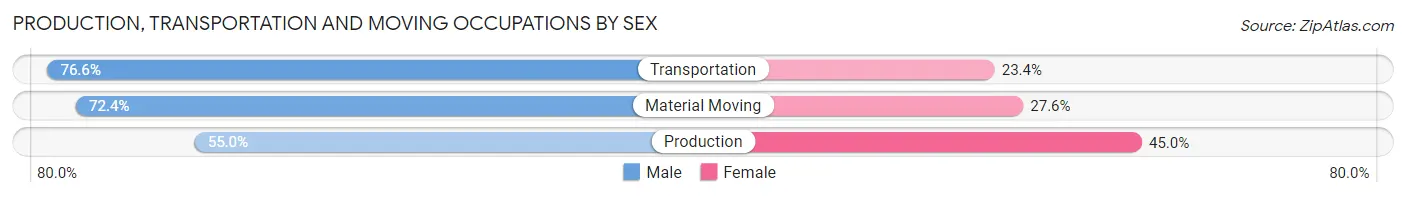
| Occupation | Male | Female |
| Production | 247 (55.0%) | 202 (45.0%) |
| Transportation | 236 (76.6%) | 72 (23.4%) |
| Material Moving | 218 (72.4%) | 83 (27.6%) |
| Total (Category) | 701 (66.3%) | 357 (33.7%) |
| Total (Overall) | 6,591 (50.6%) | 6,442 (49.4%) |
Employment Industries by Sex in Fort Mill
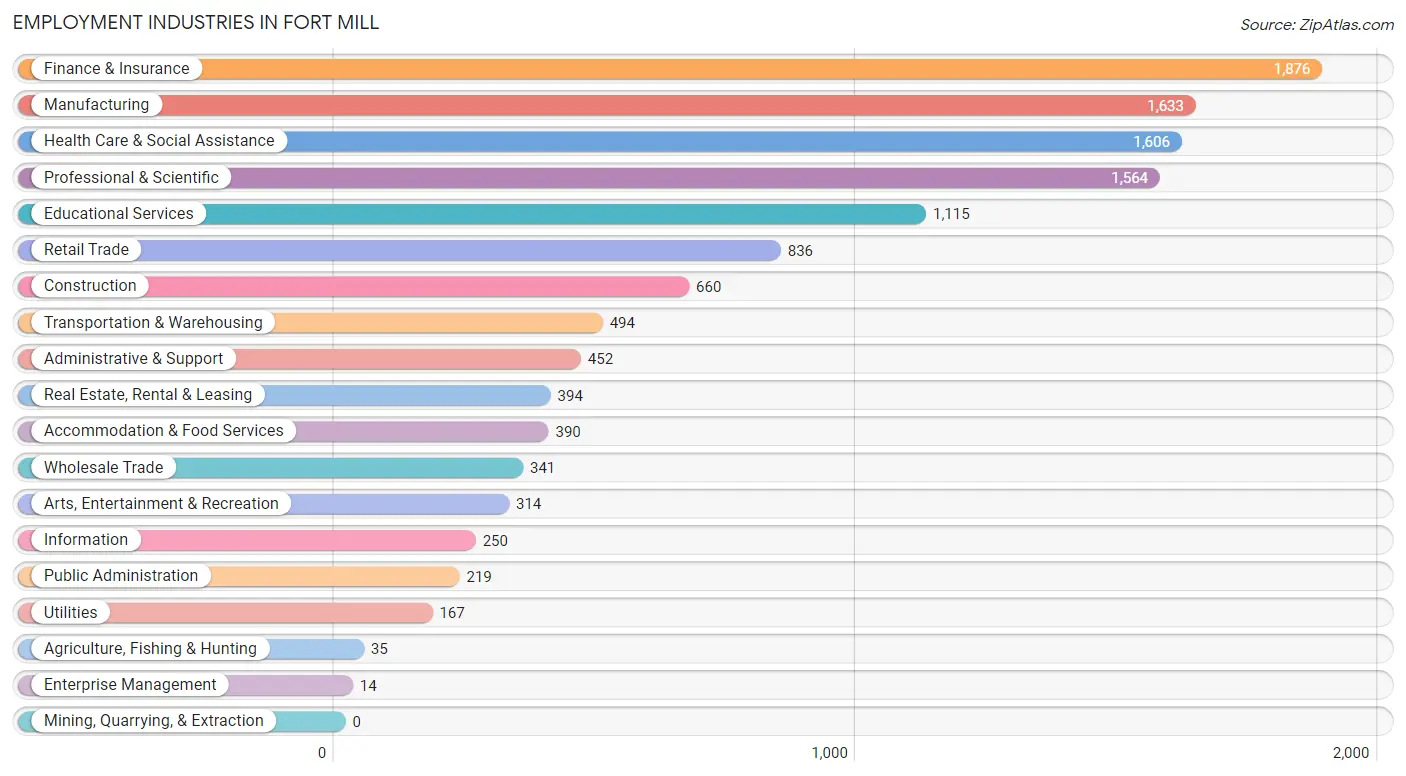
Employment Industries in Fort Mill
The major employment industries in Fort Mill include Finance & Insurance (1,876 | 14.4%), Manufacturing (1,633 | 12.5%), Health Care & Social Assistance (1,606 | 12.3%), Professional & Scientific (1,564 | 12.0%), and Educational Services (1,115 | 8.6%).
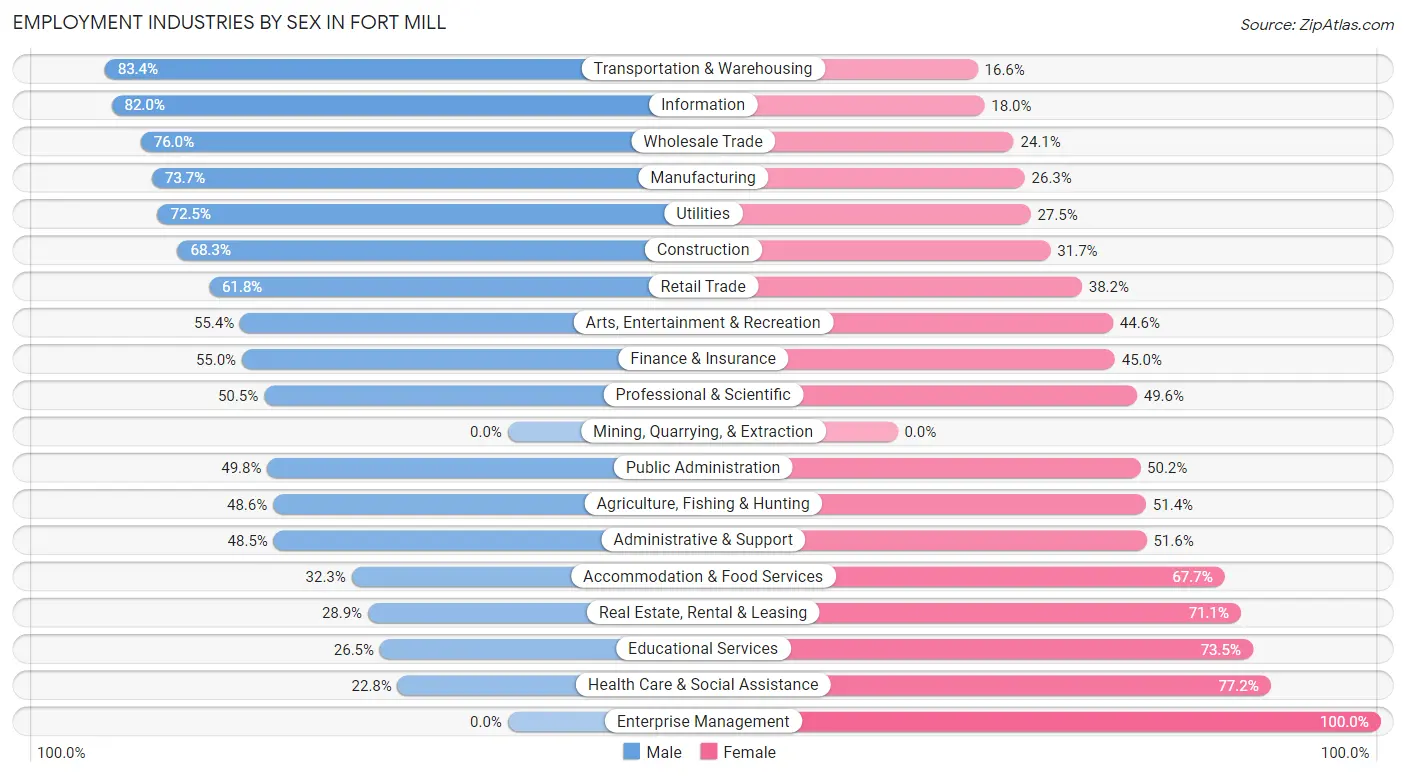
Employment Industries by Sex in Fort Mill
The Fort Mill industries that see more men than women are Transportation & Warehousing (83.4%), Information (82.0%), and Wholesale Trade (75.9%), whereas the industries that tend to have a higher number of women are Enterprise Management (100.0%), Health Care & Social Assistance (77.2%), and Educational Services (73.5%).
| Industry | Male | Female |
| Agriculture, Fishing & Hunting | 17 (48.6%) | 18 (51.4%) |
| Mining, Quarrying, & Extraction | 0 (0.0%) | 0 (0.0%) |
| Construction | 451 (68.3%) | 209 (31.7%) |
| Manufacturing | 1,203 (73.7%) | 430 (26.3%) |
| Wholesale Trade | 259 (75.9%) | 82 (24.0%) |
| Retail Trade | 517 (61.8%) | 319 (38.2%) |
| Transportation & Warehousing | 412 (83.4%) | 82 (16.6%) |
| Utilities | 121 (72.5%) | 46 (27.5%) |
| Information | 205 (82.0%) | 45 (18.0%) |
| Finance & Insurance | 1,032 (55.0%) | 844 (45.0%) |
| Real Estate, Rental & Leasing | 114 (28.9%) | 280 (71.1%) |
| Professional & Scientific | 789 (50.4%) | 775 (49.5%) |
| Enterprise Management | 0 (0.0%) | 14 (100.0%) |
| Administrative & Support | 219 (48.4%) | 233 (51.5%) |
| Educational Services | 295 (26.5%) | 820 (73.5%) |
| Health Care & Social Assistance | 366 (22.8%) | 1,240 (77.2%) |
| Arts, Entertainment & Recreation | 174 (55.4%) | 140 (44.6%) |
| Accommodation & Food Services | 126 (32.3%) | 264 (67.7%) |
| Public Administration | 109 (49.8%) | 110 (50.2%) |
| Total | 6,591 (50.6%) | 6,442 (49.4%) |
Education in Fort Mill
School Enrollment in Fort Mill
The most common levels of schooling among the 7,908 students in Fort Mill are high school (2,153 | 27.2%), middle school (1,854 | 23.4%), and elementary school (1,848 | 23.4%).
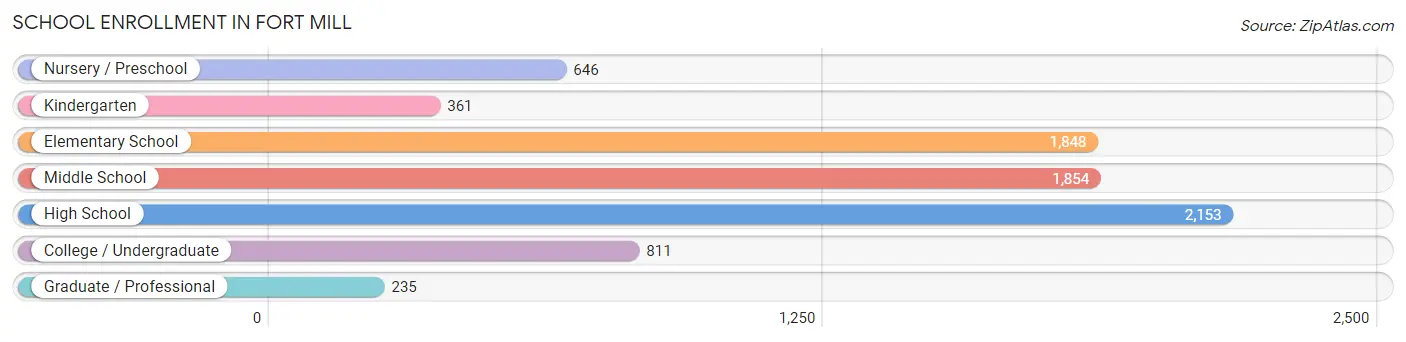
| School Level | # Students | % Students |
| Nursery / Preschool | 646 | 8.2% |
| Kindergarten | 361 | 4.6% |
| Elementary School | 1,848 | 23.4% |
| Middle School | 1,854 | 23.4% |
| High School | 2,153 | 27.2% |
| College / Undergraduate | 811 | 10.3% |
| Graduate / Professional | 235 | 3.0% |
| Total | 7,908 | 100.0% |
School Enrollment by Age by Funding Source in Fort Mill
Out of a total of 7,908 students who are enrolled in schools in Fort Mill, 1,052 (13.3%) attend a private institution, while the remaining 6,856 (86.7%) are enrolled in public schools. The age group of 3 to 4 year olds has the highest likelihood of being enrolled in private schools, with 238 (47.6% in the age bracket) enrolled. Conversely, the age group of 20 to 24 year olds has the lowest likelihood of being enrolled in a private school, with 286 (100.0% in the age bracket) attending a public institution.
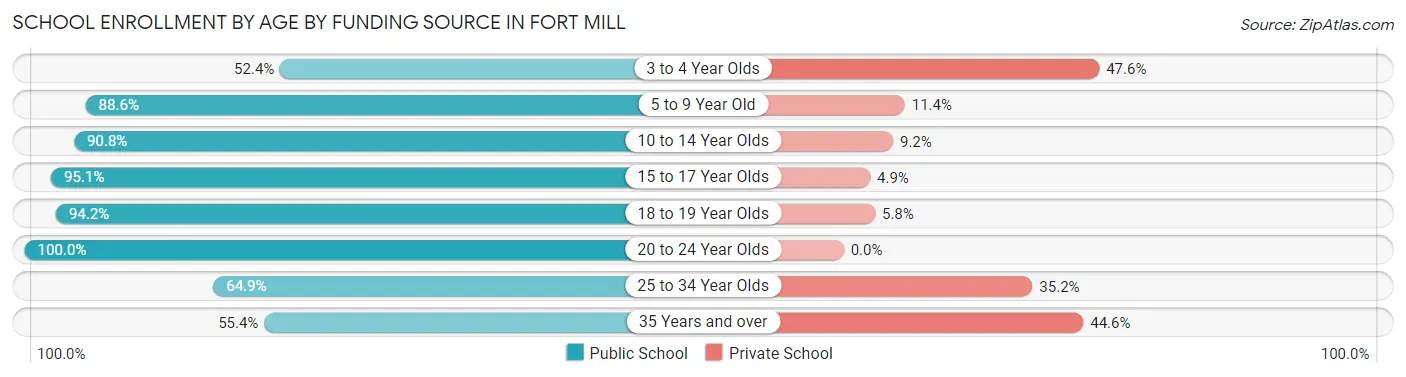
| Age Bracket | Public School | Private School |
| 3 to 4 Year Olds | 262 (52.4%) | 238 (47.6%) |
| 5 to 9 Year Old | 1,884 (88.6%) | 242 (11.4%) |
| 10 to 14 Year Olds | 2,072 (90.8%) | 210 (9.2%) |
| 15 to 17 Year Olds | 1,528 (95.1%) | 79 (4.9%) |
| 18 to 19 Year Olds | 484 (94.2%) | 30 (5.8%) |
| 20 to 24 Year Olds | 286 (100.0%) | 0 (0.0%) |
| 25 to 34 Year Olds | 107 (64.8%) | 58 (35.1%) |
| 35 Years and over | 237 (55.4%) | 191 (44.6%) |
| Total | 6,856 (86.7%) | 1,052 (13.3%) |
Educational Attainment by Field of Study in Fort Mill
Business (2,442 | 25.1%), education (1,038 | 10.7%), science & technology (684 | 7.0%), engineering (679 | 7.0%), and psychology (662 | 6.8%) are the most common fields of study among 9,736 individuals in Fort Mill who have obtained a bachelor's degree or higher.
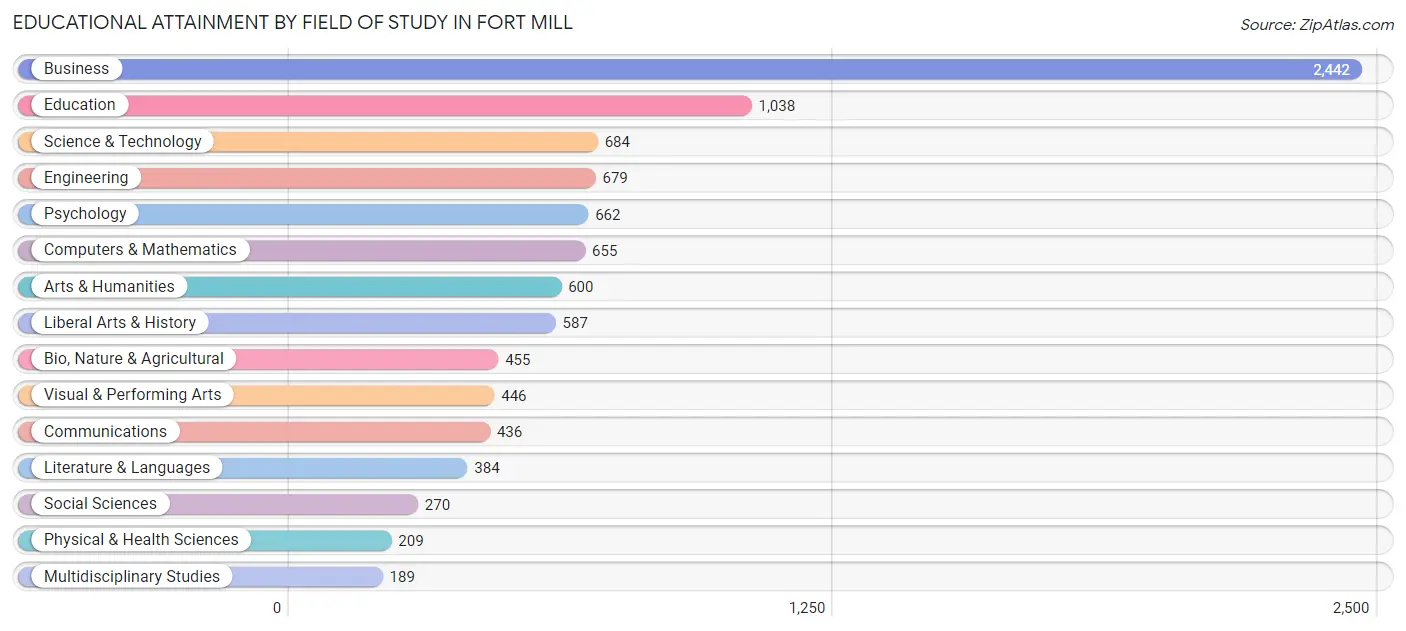
| Field of Study | # Graduates | % Graduates |
| Computers & Mathematics | 655 | 6.7% |
| Bio, Nature & Agricultural | 455 | 4.7% |
| Physical & Health Sciences | 209 | 2.1% |
| Psychology | 662 | 6.8% |
| Social Sciences | 270 | 2.8% |
| Engineering | 679 | 7.0% |
| Multidisciplinary Studies | 189 | 1.9% |
| Science & Technology | 684 | 7.0% |
| Business | 2,442 | 25.1% |
| Education | 1,038 | 10.7% |
| Literature & Languages | 384 | 3.9% |
| Liberal Arts & History | 587 | 6.0% |
| Visual & Performing Arts | 446 | 4.6% |
| Communications | 436 | 4.5% |
| Arts & Humanities | 600 | 6.2% |
| Total | 9,736 | 100.0% |
Transportation & Commute in Fort Mill
Vehicle Availability by Sex in Fort Mill
The most prevalent vehicle ownership categories in Fort Mill are males with 2 vehicles (3,320, accounting for 50.8%) and females with 2 vehicles (2,864, making up 51.9%).
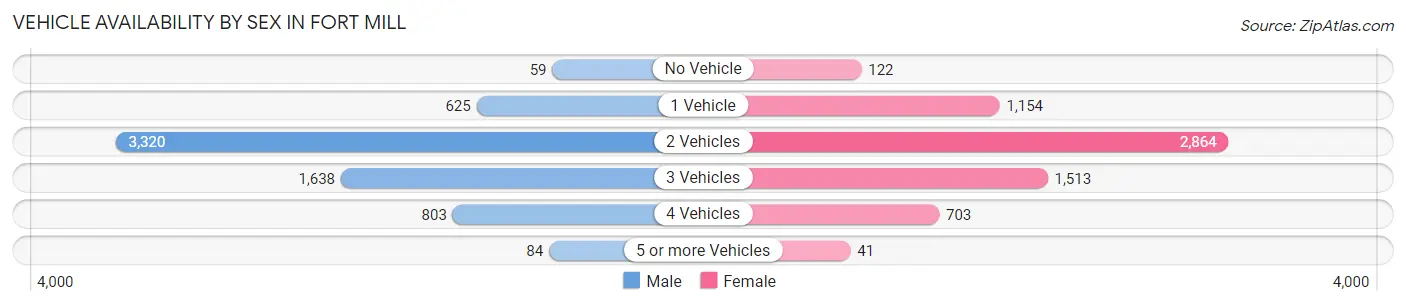
| Vehicles Available | Male | Female |
| No Vehicle | 59 (0.9%) | 122 (1.9%) |
| 1 Vehicle | 625 (9.6%) | 1,154 (18.0%) |
| 2 Vehicles | 3,320 (50.8%) | 2,864 (44.8%) |
| 3 Vehicles | 1,638 (25.1%) | 1,513 (23.6%) |
| 4 Vehicles | 803 (12.3%) | 703 (11.0%) |
| 5 or more Vehicles | 84 (1.3%) | 41 (0.6%) |
| Total | 6,529 (100.0%) | 6,397 (100.0%) |
Commute Time in Fort Mill
The most frequently occuring commute durations in Fort Mill are 15 to 19 minutes (1,936 commuters, 19.2%), 30 to 34 minutes (1,700 commuters, 16.9%), and 20 to 24 minutes (1,277 commuters, 12.7%).
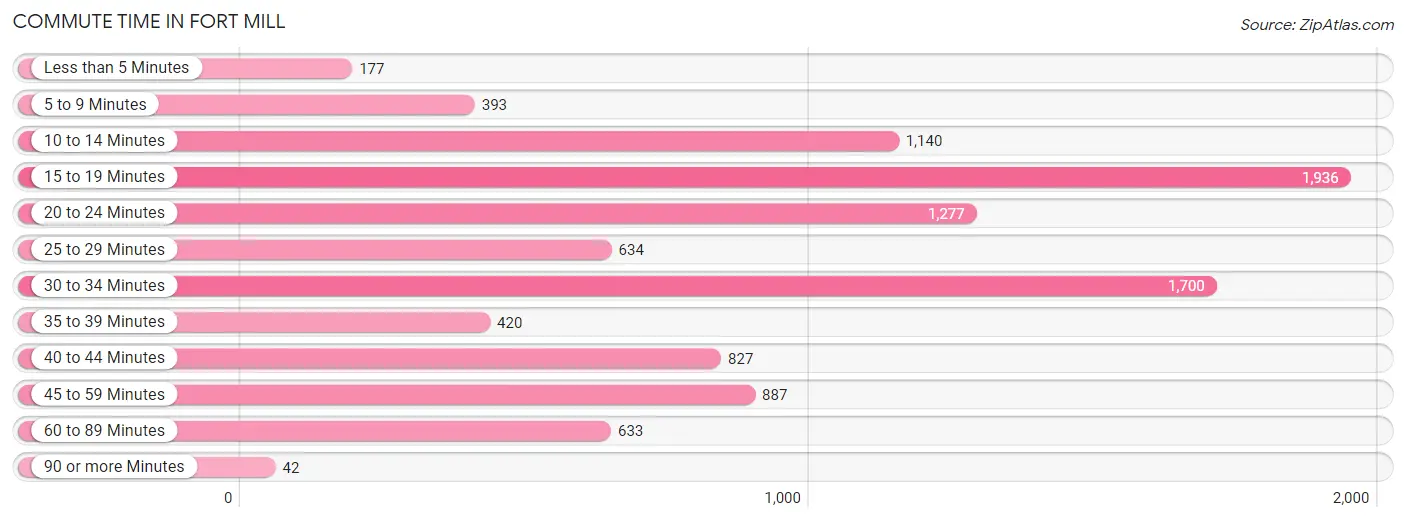
| Commute Time | # Commuters | % Commuters |
| Less than 5 Minutes | 177 | 1.8% |
| 5 to 9 Minutes | 393 | 3.9% |
| 10 to 14 Minutes | 1,140 | 11.3% |
| 15 to 19 Minutes | 1,936 | 19.2% |
| 20 to 24 Minutes | 1,277 | 12.7% |
| 25 to 29 Minutes | 634 | 6.3% |
| 30 to 34 Minutes | 1,700 | 16.9% |
| 35 to 39 Minutes | 420 | 4.2% |
| 40 to 44 Minutes | 827 | 8.2% |
| 45 to 59 Minutes | 887 | 8.8% |
| 60 to 89 Minutes | 633 | 6.3% |
| 90 or more Minutes | 42 | 0.4% |
Commute Time by Sex in Fort Mill
The most common commute times in Fort Mill are 15 to 19 minutes (880 commuters, 16.9%) for males and 15 to 19 minutes (1,056 commuters, 21.7%) for females.
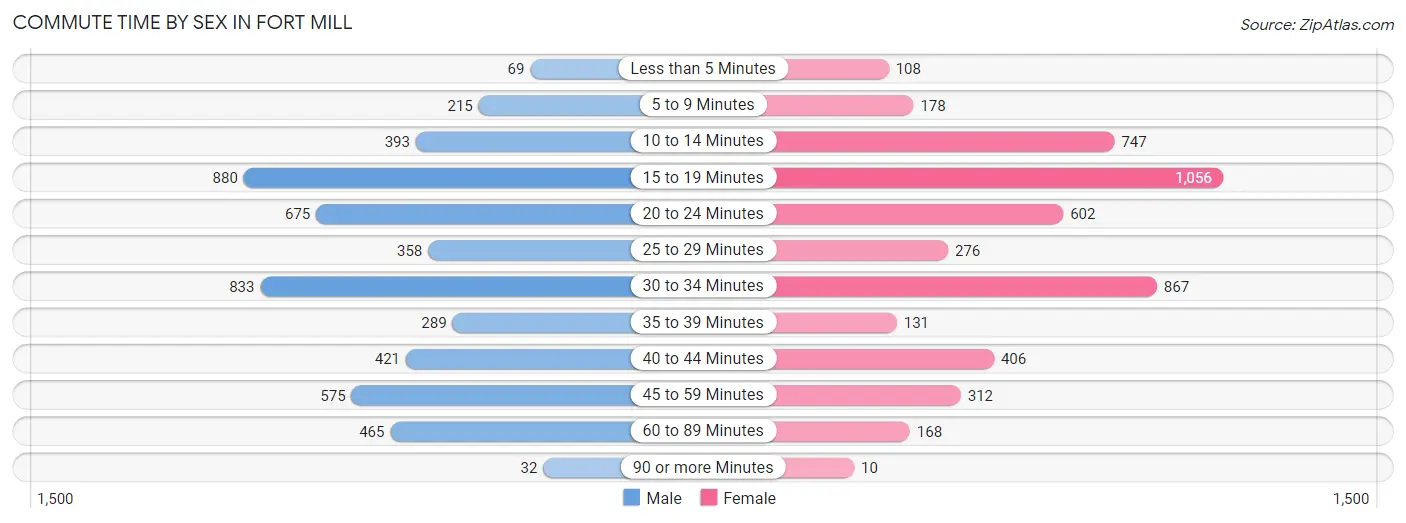
| Commute Time | Male | Female |
| Less than 5 Minutes | 69 (1.3%) | 108 (2.2%) |
| 5 to 9 Minutes | 215 (4.1%) | 178 (3.7%) |
| 10 to 14 Minutes | 393 (7.5%) | 747 (15.4%) |
| 15 to 19 Minutes | 880 (16.9%) | 1,056 (21.7%) |
| 20 to 24 Minutes | 675 (13.0%) | 602 (12.4%) |
| 25 to 29 Minutes | 358 (6.9%) | 276 (5.7%) |
| 30 to 34 Minutes | 833 (16.0%) | 867 (17.8%) |
| 35 to 39 Minutes | 289 (5.6%) | 131 (2.7%) |
| 40 to 44 Minutes | 421 (8.1%) | 406 (8.4%) |
| 45 to 59 Minutes | 575 (11.1%) | 312 (6.4%) |
| 60 to 89 Minutes | 465 (8.9%) | 168 (3.5%) |
| 90 or more Minutes | 32 (0.6%) | 10 (0.2%) |
Time of Departure to Work by Sex in Fort Mill
The most frequent times of departure to work in Fort Mill are 7:00 AM to 7:29 AM (1,070, 20.6%) for males and 7:00 AM to 7:29 AM (1,061, 21.8%) for females.
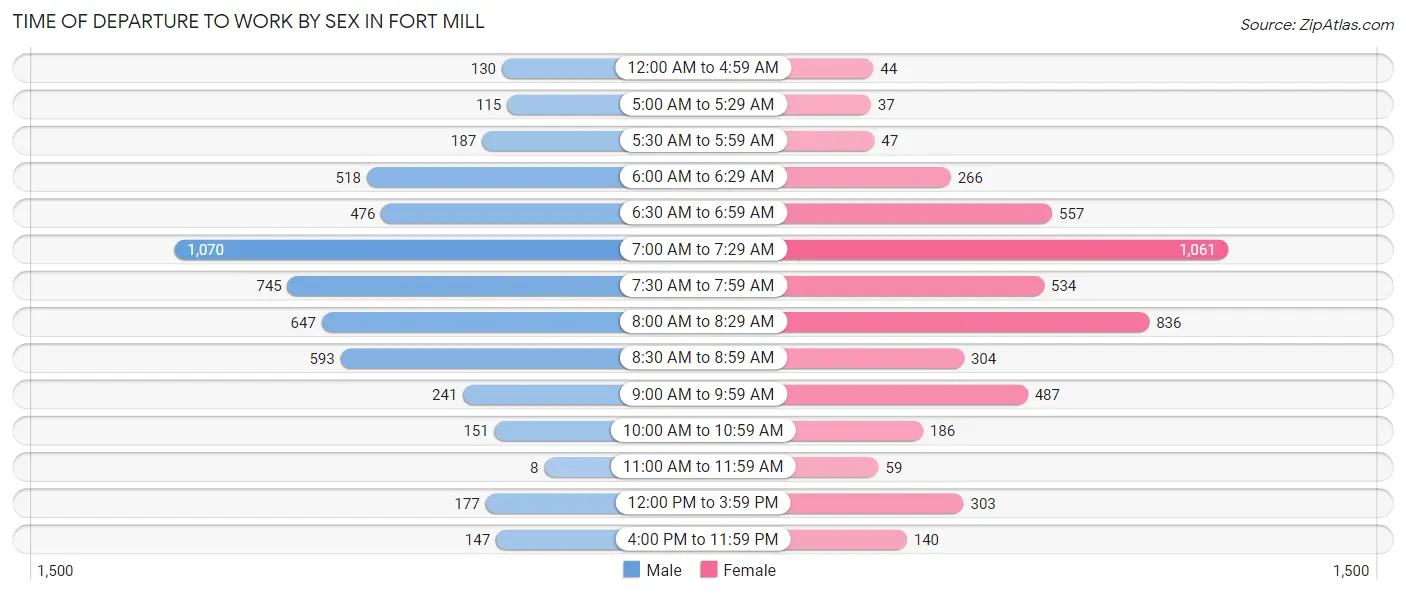
| Time of Departure | Male | Female |
| 12:00 AM to 4:59 AM | 130 (2.5%) | 44 (0.9%) |
| 5:00 AM to 5:29 AM | 115 (2.2%) | 37 (0.8%) |
| 5:30 AM to 5:59 AM | 187 (3.6%) | 47 (1.0%) |
| 6:00 AM to 6:29 AM | 518 (10.0%) | 266 (5.5%) |
| 6:30 AM to 6:59 AM | 476 (9.1%) | 557 (11.5%) |
| 7:00 AM to 7:29 AM | 1,070 (20.6%) | 1,061 (21.8%) |
| 7:30 AM to 7:59 AM | 745 (14.3%) | 534 (11.0%) |
| 8:00 AM to 8:29 AM | 647 (12.4%) | 836 (17.2%) |
| 8:30 AM to 8:59 AM | 593 (11.4%) | 304 (6.2%) |
| 9:00 AM to 9:59 AM | 241 (4.6%) | 487 (10.0%) |
| 10:00 AM to 10:59 AM | 151 (2.9%) | 186 (3.8%) |
| 11:00 AM to 11:59 AM | 8 (0.2%) | 59 (1.2%) |
| 12:00 PM to 3:59 PM | 177 (3.4%) | 303 (6.2%) |
| 4:00 PM to 11:59 PM | 147 (2.8%) | 140 (2.9%) |
| Total | 5,205 (100.0%) | 4,861 (100.0%) |
Housing Occupancy in Fort Mill
Occupancy by Ownership in Fort Mill
Of the total 8,998 dwellings in Fort Mill, owner-occupied units account for 7,575 (84.2%), while renter-occupied units make up 1,423 (15.8%).
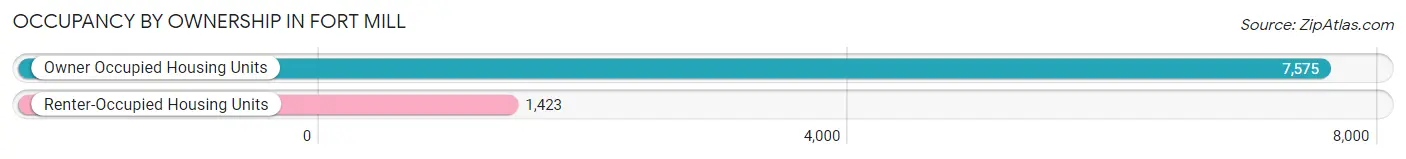
| Occupancy | # Housing Units | % Housing Units |
| Owner Occupied Housing Units | 7,575 | 84.2% |
| Renter-Occupied Housing Units | 1,423 | 15.8% |
| Total Occupied Housing Units | 8,998 | 100.0% |
Occupancy by Household Size in Fort Mill
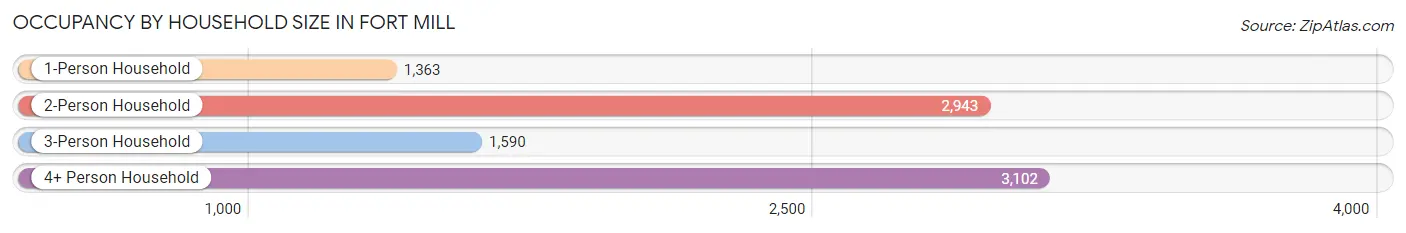
| Household Size | # Housing Units | % Housing Units |
| 1-Person Household | 1,363 | 15.1% |
| 2-Person Household | 2,943 | 32.7% |
| 3-Person Household | 1,590 | 17.7% |
| 4+ Person Household | 3,102 | 34.5% |
| Total Housing Units | 8,998 | 100.0% |
Occupancy by Ownership by Household Size in Fort Mill
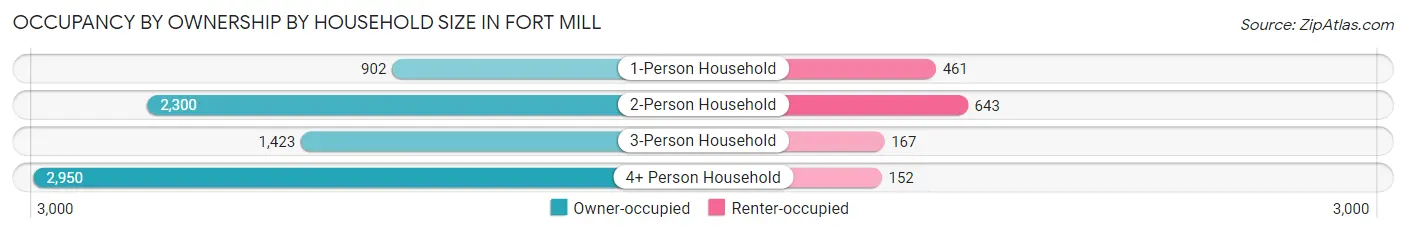
| Household Size | Owner-occupied | Renter-occupied |
| 1-Person Household | 902 (66.2%) | 461 (33.8%) |
| 2-Person Household | 2,300 (78.1%) | 643 (21.8%) |
| 3-Person Household | 1,423 (89.5%) | 167 (10.5%) |
| 4+ Person Household | 2,950 (95.1%) | 152 (4.9%) |
| Total Housing Units | 7,575 (84.2%) | 1,423 (15.8%) |
Occupancy by Educational Attainment in Fort Mill
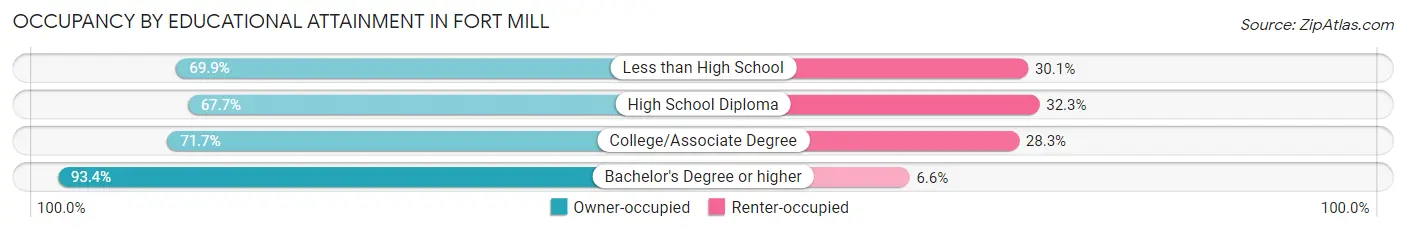
| Household Size | Owner-occupied | Renter-occupied |
| Less than High School | 144 (69.9%) | 62 (30.1%) |
| High School Diploma | 820 (67.7%) | 392 (32.3%) |
| College/Associate Degree | 1,548 (71.7%) | 611 (28.3%) |
| Bachelor's Degree or higher | 5,063 (93.4%) | 358 (6.6%) |
Occupancy by Age of Householder in Fort Mill
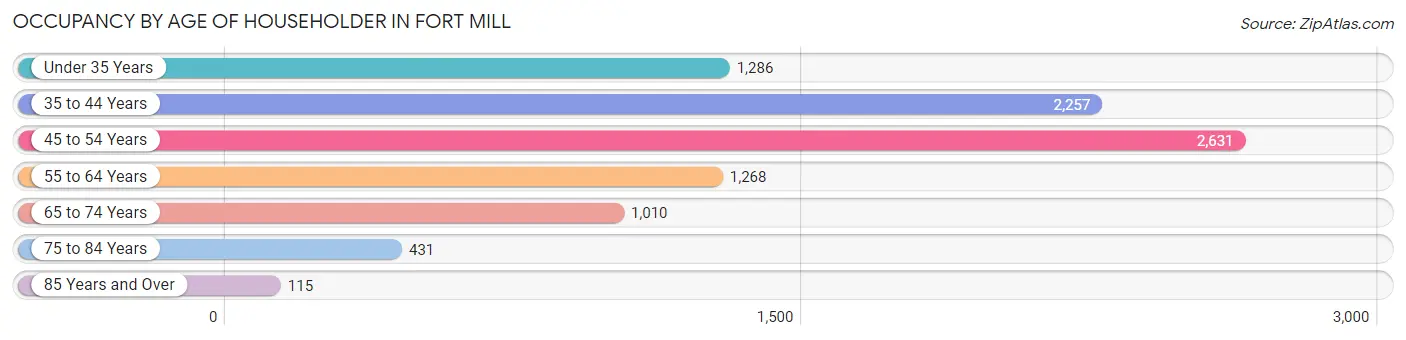
| Age Bracket | # Households | % Households |
| Under 35 Years | 1,286 | 14.3% |
| 35 to 44 Years | 2,257 | 25.1% |
| 45 to 54 Years | 2,631 | 29.2% |
| 55 to 64 Years | 1,268 | 14.1% |
| 65 to 74 Years | 1,010 | 11.2% |
| 75 to 84 Years | 431 | 4.8% |
| 85 Years and Over | 115 | 1.3% |
| Total | 8,998 | 100.0% |
Housing Finances in Fort Mill
Median Income by Occupancy in Fort Mill
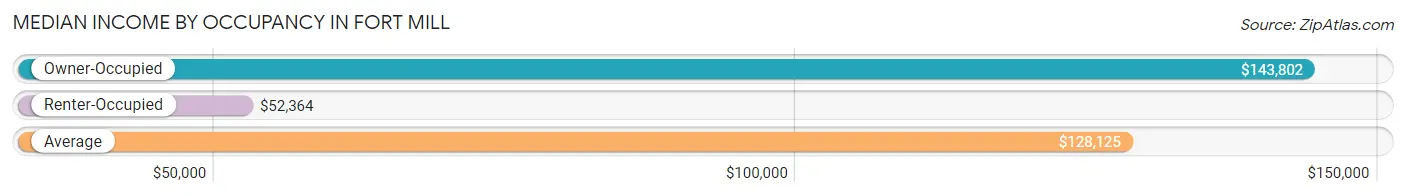
| Occupancy Type | # Households | Median Income |
| Owner-Occupied | 7,575 (84.2%) | $143,802 |
| Renter-Occupied | 1,423 (15.8%) | $52,364 |
| Average | 8,998 (100.0%) | $128,125 |
Occupancy by Householder Income Bracket in Fort Mill
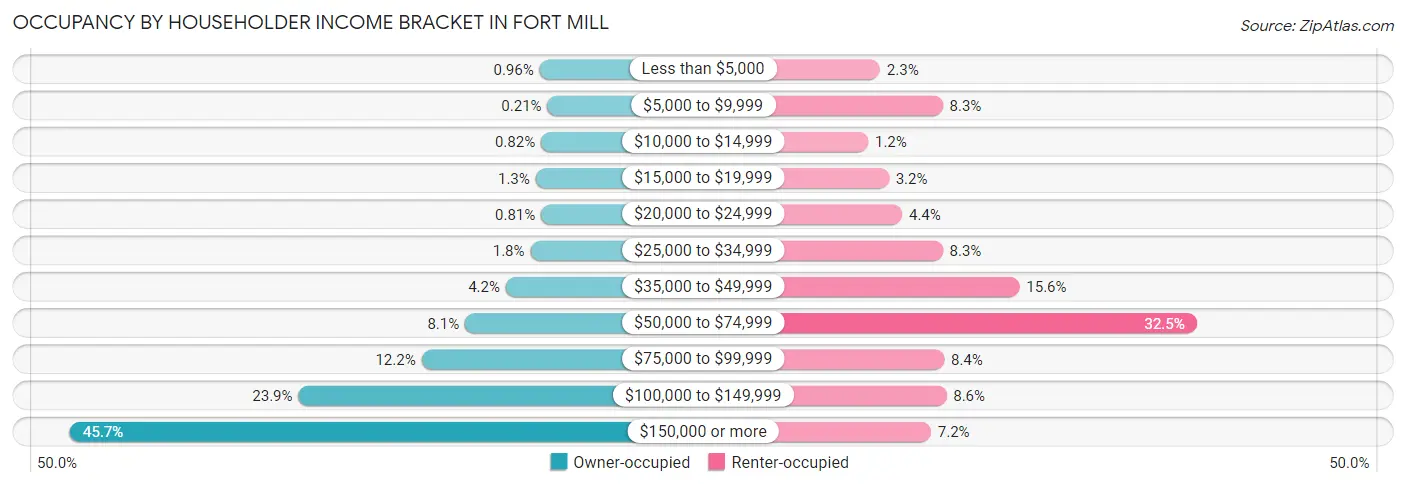
| Income Bracket | Owner-occupied | Renter-occupied |
| Less than $5,000 | 73 (1.0%) | 33 (2.3%) |
| $5,000 to $9,999 | 16 (0.2%) | 118 (8.3%) |
| $10,000 to $14,999 | 62 (0.8%) | 17 (1.2%) |
| $15,000 to $19,999 | 101 (1.3%) | 45 (3.2%) |
| $20,000 to $24,999 | 61 (0.8%) | 63 (4.4%) |
| $25,000 to $34,999 | 139 (1.8%) | 118 (8.3%) |
| $35,000 to $49,999 | 316 (4.2%) | 222 (15.6%) |
| $50,000 to $74,999 | 610 (8.1%) | 462 (32.5%) |
| $75,000 to $99,999 | 924 (12.2%) | 120 (8.4%) |
| $100,000 to $149,999 | 1,813 (23.9%) | 123 (8.6%) |
| $150,000 or more | 3,460 (45.7%) | 102 (7.2%) |
| Total | 7,575 (100.0%) | 1,423 (100.0%) |
Monthly Housing Cost Tiers in Fort Mill
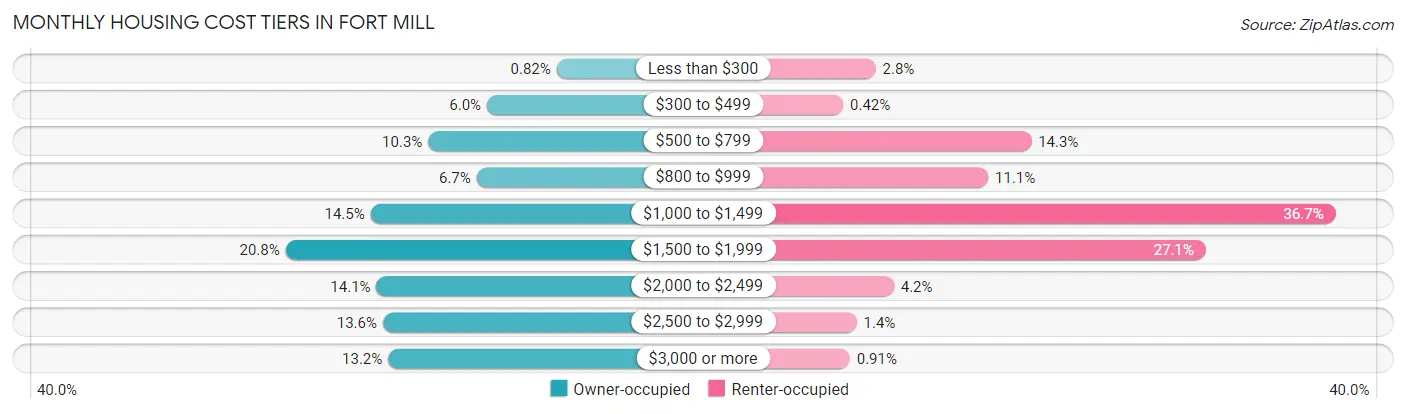
| Monthly Cost | Owner-occupied | Renter-occupied |
| Less than $300 | 62 (0.8%) | 40 (2.8%) |
| $300 to $499 | 451 (5.9%) | 6 (0.4%) |
| $500 to $799 | 779 (10.3%) | 203 (14.3%) |
| $800 to $999 | 508 (6.7%) | 158 (11.1%) |
| $1,000 to $1,499 | 1,100 (14.5%) | 522 (36.7%) |
| $1,500 to $1,999 | 1,574 (20.8%) | 386 (27.1%) |
| $2,000 to $2,499 | 1,067 (14.1%) | 59 (4.2%) |
| $2,500 to $2,999 | 1,032 (13.6%) | 20 (1.4%) |
| $3,000 or more | 1,002 (13.2%) | 13 (0.9%) |
| Total | 7,575 (100.0%) | 1,423 (100.0%) |
Physical Housing Characteristics in Fort Mill
Housing Structures in Fort Mill
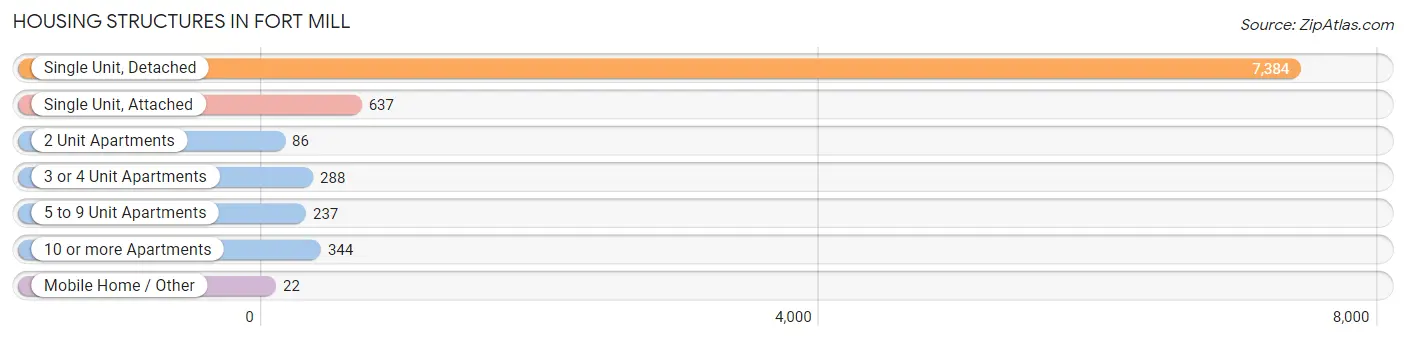
| Structure Type | # Housing Units | % Housing Units |
| Single Unit, Detached | 7,384 | 82.1% |
| Single Unit, Attached | 637 | 7.1% |
| 2 Unit Apartments | 86 | 1.0% |
| 3 or 4 Unit Apartments | 288 | 3.2% |
| 5 to 9 Unit Apartments | 237 | 2.6% |
| 10 or more Apartments | 344 | 3.8% |
| Mobile Home / Other | 22 | 0.2% |
| Total | 8,998 | 100.0% |
Housing Structures by Occupancy in Fort Mill
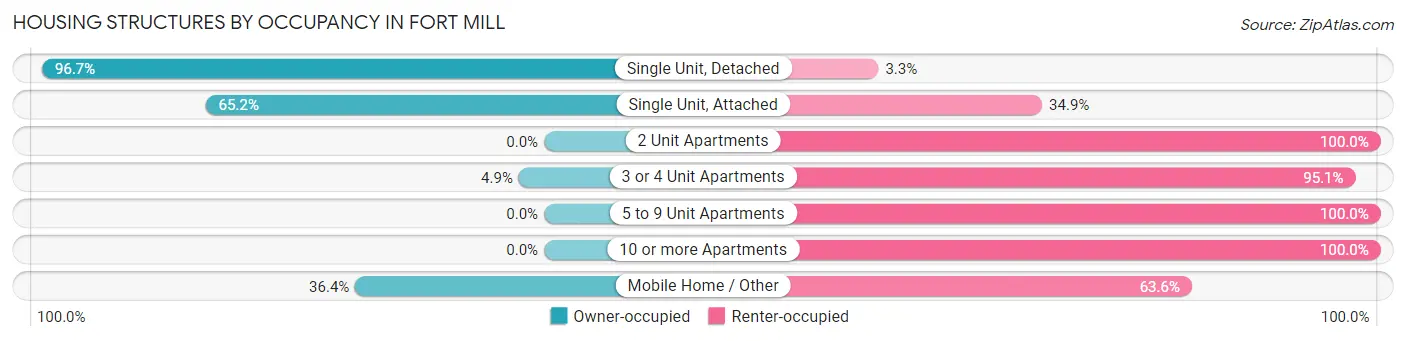
| Structure Type | Owner-occupied | Renter-occupied |
| Single Unit, Detached | 7,138 (96.7%) | 246 (3.3%) |
| Single Unit, Attached | 415 (65.1%) | 222 (34.8%) |
| 2 Unit Apartments | 0 (0.0%) | 86 (100.0%) |
| 3 or 4 Unit Apartments | 14 (4.9%) | 274 (95.1%) |
| 5 to 9 Unit Apartments | 0 (0.0%) | 237 (100.0%) |
| 10 or more Apartments | 0 (0.0%) | 344 (100.0%) |
| Mobile Home / Other | 8 (36.4%) | 14 (63.6%) |
| Total | 7,575 (84.2%) | 1,423 (15.8%) |
Housing Structures by Number of Rooms in Fort Mill
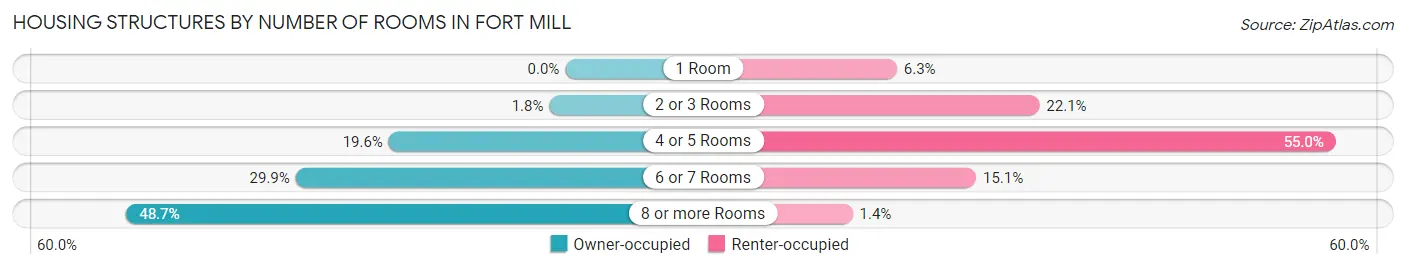
| Number of Rooms | Owner-occupied | Renter-occupied |
| 1 Room | 0 (0.0%) | 90 (6.3%) |
| 2 or 3 Rooms | 134 (1.8%) | 315 (22.1%) |
| 4 or 5 Rooms | 1,484 (19.6%) | 783 (55.0%) |
| 6 or 7 Rooms | 2,267 (29.9%) | 215 (15.1%) |
| 8 or more Rooms | 3,690 (48.7%) | 20 (1.4%) |
| Total | 7,575 (100.0%) | 1,423 (100.0%) |
Housing Structure by Heating Type in Fort Mill
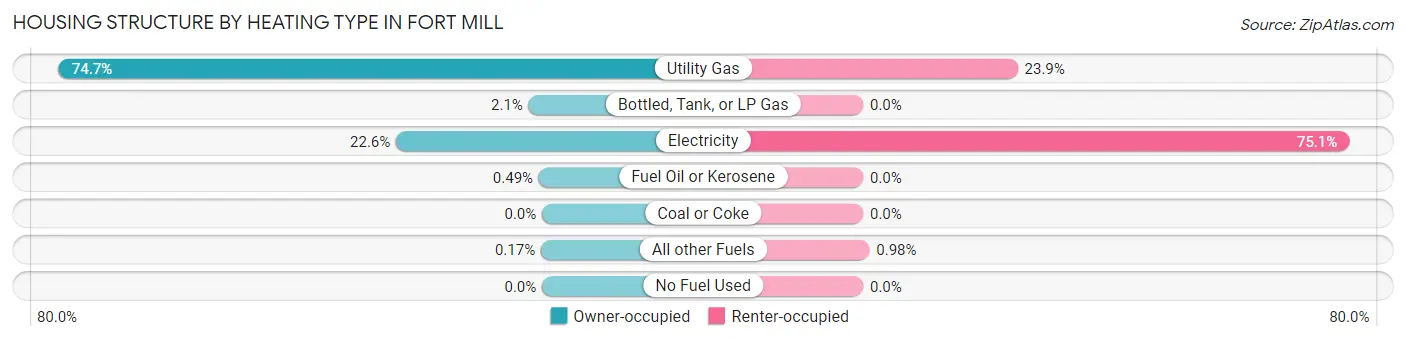
| Heating Type | Owner-occupied | Renter-occupied |
| Utility Gas | 5,658 (74.7%) | 340 (23.9%) |
| Bottled, Tank, or LP Gas | 157 (2.1%) | 0 (0.0%) |
| Electricity | 1,710 (22.6%) | 1,069 (75.1%) |
| Fuel Oil or Kerosene | 37 (0.5%) | 0 (0.0%) |
| Coal or Coke | 0 (0.0%) | 0 (0.0%) |
| All other Fuels | 13 (0.2%) | 14 (1.0%) |
| No Fuel Used | 0 (0.0%) | 0 (0.0%) |
| Total | 7,575 (100.0%) | 1,423 (100.0%) |
Household Vehicle Usage in Fort Mill
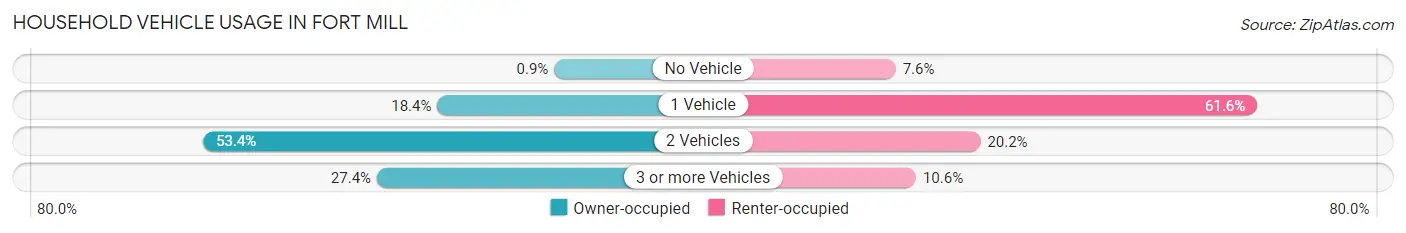
| Vehicles per Household | Owner-occupied | Renter-occupied |
| No Vehicle | 68 (0.9%) | 108 (7.6%) |
| 1 Vehicle | 1,391 (18.4%) | 876 (61.6%) |
| 2 Vehicles | 4,042 (53.4%) | 288 (20.2%) |
| 3 or more Vehicles | 2,074 (27.4%) | 151 (10.6%) |
| Total | 7,575 (100.0%) | 1,423 (100.0%) |
Real Estate & Mortgages in Fort Mill
Real Estate and Mortgage Overview in Fort Mill
| Characteristic | Without Mortgage | With Mortgage |
| Housing Units | 1,621 | 5,954 |
| Median Property Value | $397,000 | $418,700 |
| Median Household Income | $106,023 | $3,030 |
| Monthly Housing Costs | $615 | $993 |
| Real Estate Taxes | $3,192 | $39 |
Property Value by Mortgage Status in Fort Mill
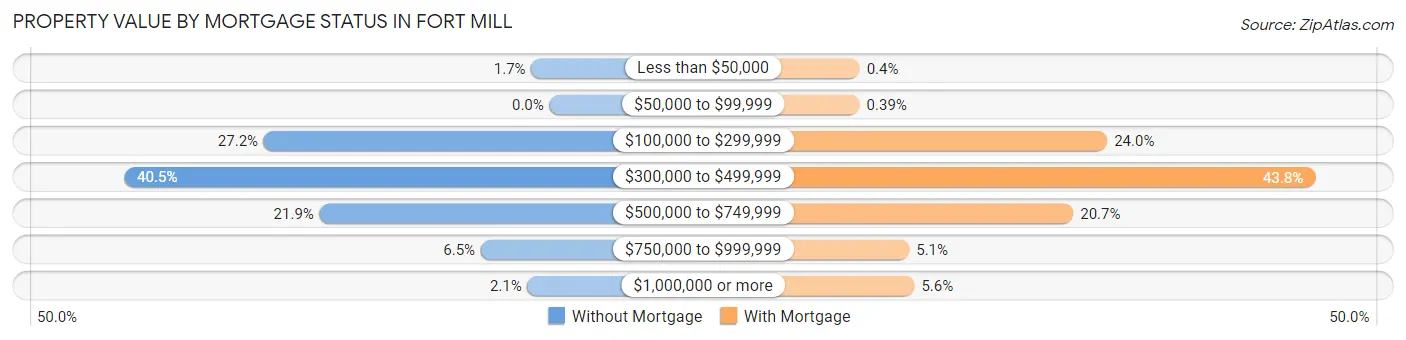
| Property Value | Without Mortgage | With Mortgage |
| Less than $50,000 | 28 (1.7%) | 24 (0.4%) |
| $50,000 to $99,999 | 0 (0.0%) | 23 (0.4%) |
| $100,000 to $299,999 | 441 (27.2%) | 1,427 (24.0%) |
| $300,000 to $499,999 | 657 (40.5%) | 2,606 (43.8%) |
| $500,000 to $749,999 | 355 (21.9%) | 1,235 (20.7%) |
| $750,000 to $999,999 | 106 (6.5%) | 305 (5.1%) |
| $1,000,000 or more | 34 (2.1%) | 334 (5.6%) |
| Total | 1,621 (100.0%) | 5,954 (100.0%) |
Household Income by Mortgage Status in Fort Mill
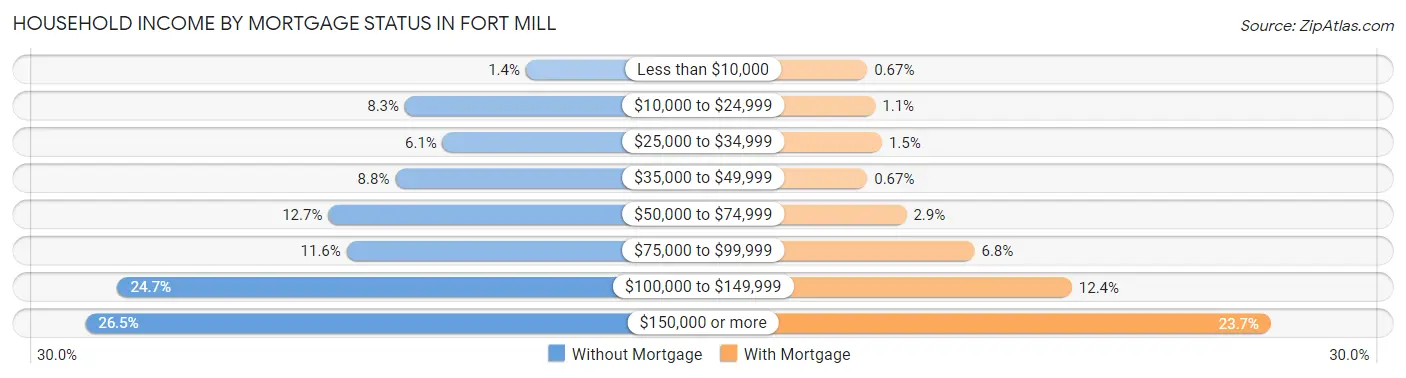
| Household Income | Without Mortgage | With Mortgage |
| Less than $10,000 | 22 (1.4%) | 40 (0.7%) |
| $10,000 to $24,999 | 134 (8.3%) | 67 (1.1%) |
| $25,000 to $34,999 | 99 (6.1%) | 90 (1.5%) |
| $35,000 to $49,999 | 143 (8.8%) | 40 (0.7%) |
| $50,000 to $74,999 | 205 (12.7%) | 173 (2.9%) |
| $75,000 to $99,999 | 188 (11.6%) | 405 (6.8%) |
| $100,000 to $149,999 | 400 (24.7%) | 736 (12.4%) |
| $150,000 or more | 430 (26.5%) | 1,413 (23.7%) |
| Total | 1,621 (100.0%) | 5,954 (100.0%) |
Property Value to Household Income Ratio in Fort Mill
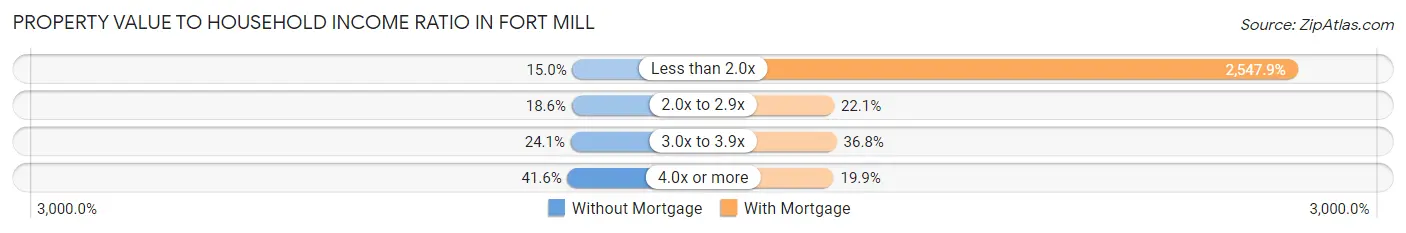
| Value-to-Income Ratio | Without Mortgage | With Mortgage |
| Less than 2.0x | 243 (15.0%) | 151,699 (2,547.9%) |
| 2.0x to 2.9x | 301 (18.6%) | 1,316 (22.1%) |
| 3.0x to 3.9x | 390 (24.1%) | 2,189 (36.8%) |
| 4.0x or more | 675 (41.6%) | 1,183 (19.9%) |
| Total | 1,621 (100.0%) | 5,954 (100.0%) |
Real Estate Taxes by Mortgage Status in Fort Mill
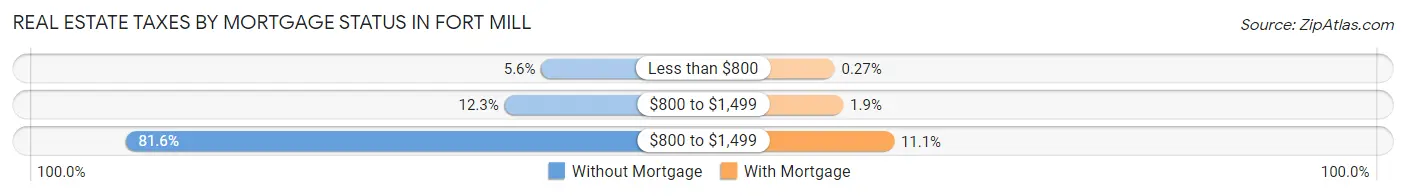
| Property Taxes | Without Mortgage | With Mortgage |
| Less than $800 | 91 (5.6%) | 16 (0.3%) |
| $800 to $1,499 | 200 (12.3%) | 110 (1.8%) |
| $800 to $1,499 | 1,322 (81.6%) | 662 (11.1%) |
| Total | 1,621 (100.0%) | 5,954 (100.0%) |
Health & Disability in Fort Mill
Health Insurance Coverage by Age in Fort Mill
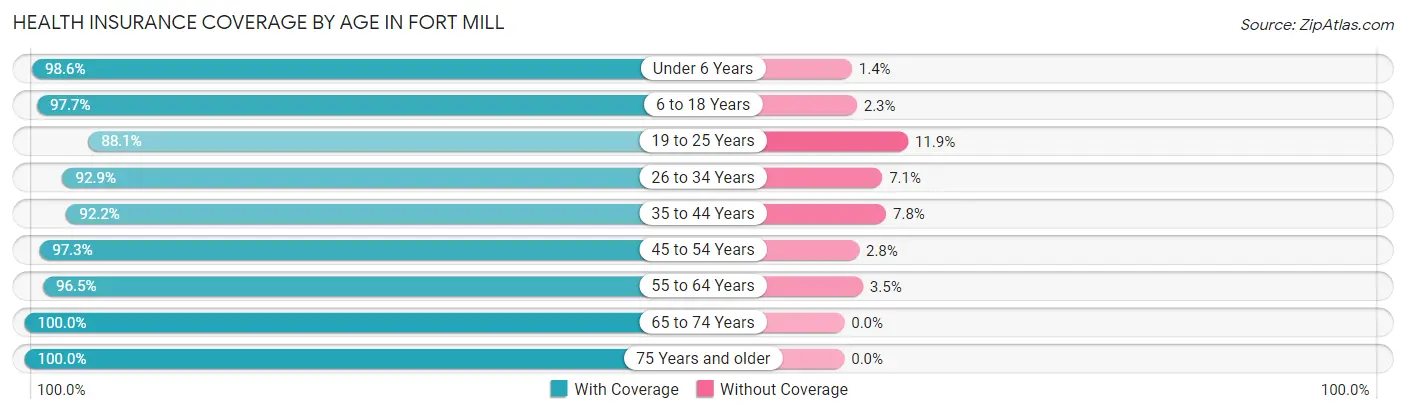
| Age Bracket | With Coverage | Without Coverage |
| Under 6 Years | 2,033 (98.6%) | 29 (1.4%) |
| 6 to 18 Years | 6,087 (97.7%) | 145 (2.3%) |
| 19 to 25 Years | 1,253 (88.1%) | 169 (11.9%) |
| 26 to 34 Years | 2,218 (92.9%) | 169 (7.1%) |
| 35 to 44 Years | 4,161 (92.2%) | 352 (7.8%) |
| 45 to 54 Years | 4,037 (97.3%) | 114 (2.8%) |
| 55 to 64 Years | 2,446 (96.5%) | 88 (3.5%) |
| 65 to 74 Years | 1,717 (100.0%) | 0 (0.0%) |
| 75 Years and older | 998 (100.0%) | 0 (0.0%) |
| Total | 24,950 (95.9%) | 1,066 (4.1%) |
Health Insurance Coverage by Citizenship Status in Fort Mill
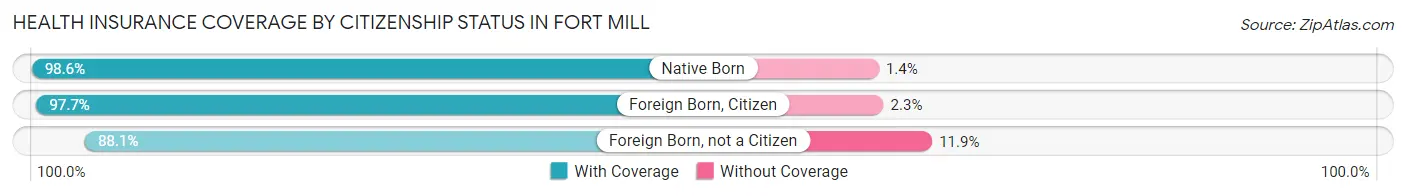
| Citizenship Status | With Coverage | Without Coverage |
| Native Born | 2,033 (98.6%) | 29 (1.4%) |
| Foreign Born, Citizen | 6,087 (97.7%) | 145 (2.3%) |
| Foreign Born, not a Citizen | 1,253 (88.1%) | 169 (11.9%) |
Health Insurance Coverage by Household Income in Fort Mill
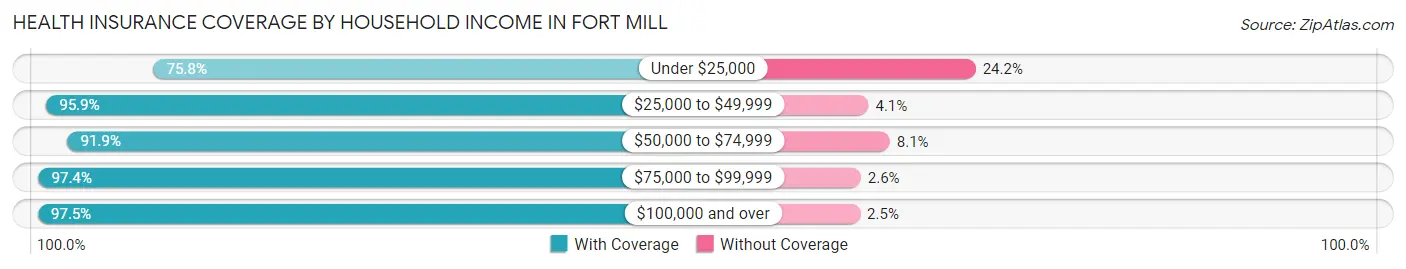
| Household Income | With Coverage | Without Coverage |
| Under $25,000 | 835 (75.8%) | 266 (24.2%) |
| $25,000 to $49,999 | 1,627 (95.9%) | 69 (4.1%) |
| $50,000 to $74,999 | 2,419 (91.9%) | 212 (8.1%) |
| $75,000 to $99,999 | 2,590 (97.4%) | 70 (2.6%) |
| $100,000 and over | 17,479 (97.5%) | 449 (2.5%) |
Public vs Private Health Insurance Coverage by Age in Fort Mill
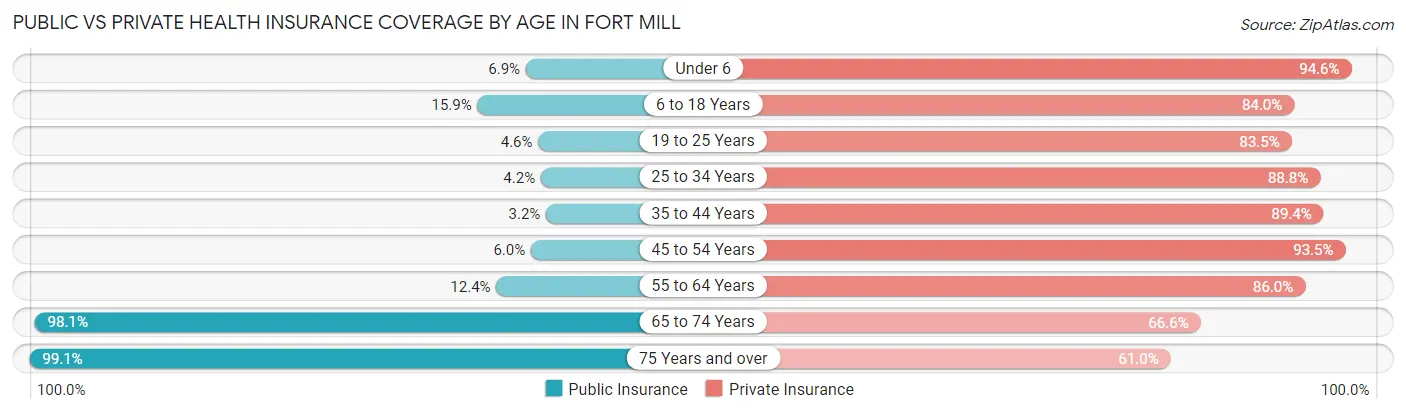
| Age Bracket | Public Insurance | Private Insurance |
| Under 6 | 143 (6.9%) | 1,950 (94.6%) |
| 6 to 18 Years | 992 (15.9%) | 5,232 (84.0%) |
| 19 to 25 Years | 66 (4.6%) | 1,187 (83.5%) |
| 25 to 34 Years | 99 (4.2%) | 2,119 (88.8%) |
| 35 to 44 Years | 144 (3.2%) | 4,036 (89.4%) |
| 45 to 54 Years | 249 (6.0%) | 3,879 (93.4%) |
| 55 to 64 Years | 315 (12.4%) | 2,179 (86.0%) |
| 65 to 74 Years | 1,685 (98.1%) | 1,143 (66.6%) |
| 75 Years and over | 989 (99.1%) | 609 (61.0%) |
| Total | 4,682 (18.0%) | 22,334 (85.9%) |
Disability Status by Sex by Age in Fort Mill
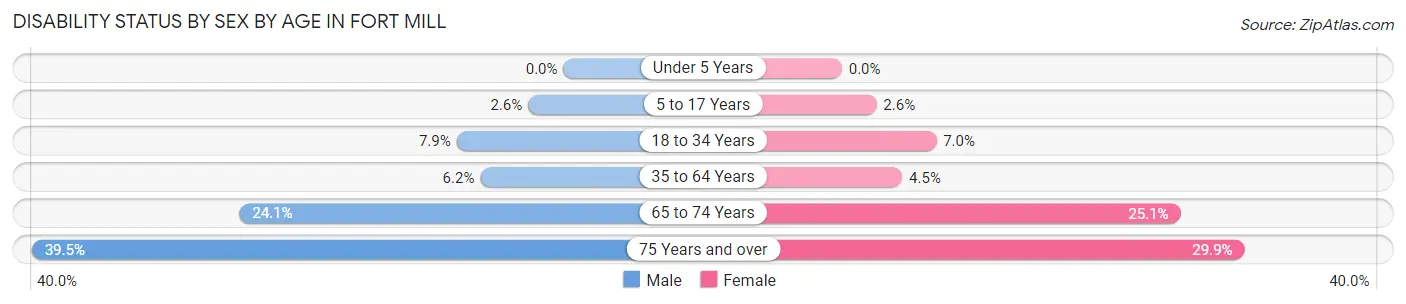
| Age Bracket | Male | Female |
| Under 5 Years | 0 (0.0%) | 0 (0.0%) |
| 5 to 17 Years | 87 (2.6%) | 75 (2.6%) |
| 18 to 34 Years | 152 (7.9%) | 167 (7.0%) |
| 35 to 64 Years | 320 (6.2%) | 269 (4.5%) |
| 65 to 74 Years | 191 (24.1%) | 232 (25.1%) |
| 75 Years and over | 180 (39.5%) | 162 (29.9%) |
Disability Class by Sex by Age in Fort Mill
Disability Class: Hearing Difficulty
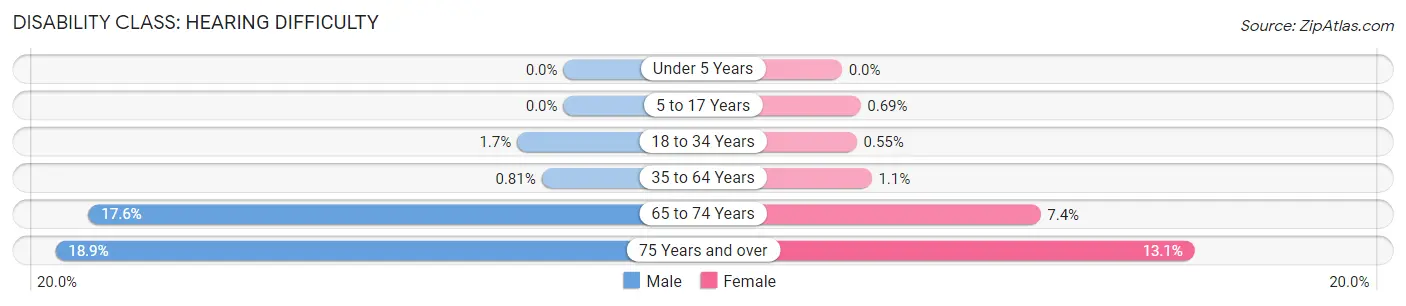
| Age Bracket | Male | Female |
| Under 5 Years | 0 (0.0%) | 0 (0.0%) |
| 5 to 17 Years | 0 (0.0%) | 20 (0.7%) |
| 18 to 34 Years | 33 (1.7%) | 13 (0.5%) |
| 35 to 64 Years | 42 (0.8%) | 66 (1.1%) |
| 65 to 74 Years | 140 (17.6%) | 68 (7.4%) |
| 75 Years and over | 86 (18.9%) | 71 (13.1%) |
Disability Class: Vision Difficulty

| Age Bracket | Male | Female |
| Under 5 Years | 0 (0.0%) | 0 (0.0%) |
| 5 to 17 Years | 62 (1.9%) | 0 (0.0%) |
| 18 to 34 Years | 29 (1.5%) | 52 (2.2%) |
| 35 to 64 Years | 36 (0.7%) | 27 (0.4%) |
| 65 to 74 Years | 20 (2.5%) | 27 (2.9%) |
| 75 Years and over | 23 (5.0%) | 11 (2.0%) |
Disability Class: Cognitive Difficulty
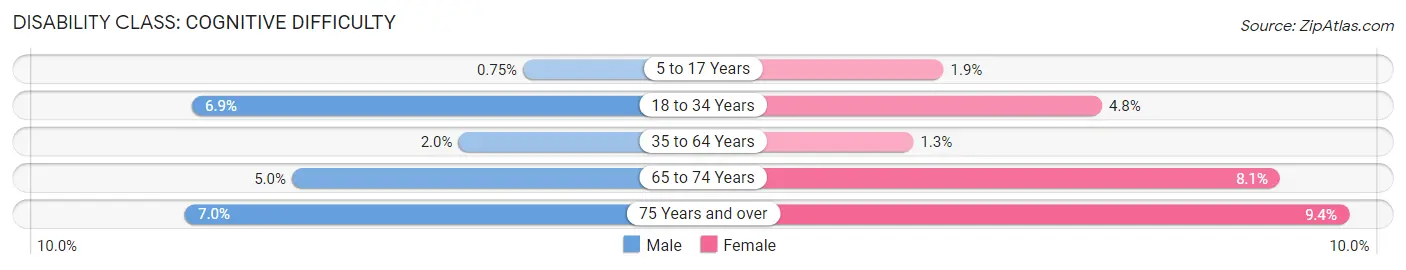
| Age Bracket | Male | Female |
| 5 to 17 Years | 25 (0.7%) | 55 (1.9%) |
| 18 to 34 Years | 132 (6.9%) | 115 (4.8%) |
| 35 to 64 Years | 101 (1.9%) | 80 (1.3%) |
| 65 to 74 Years | 40 (5.0%) | 75 (8.1%) |
| 75 Years and over | 32 (7.0%) | 51 (9.4%) |
Disability Class: Ambulatory Difficulty
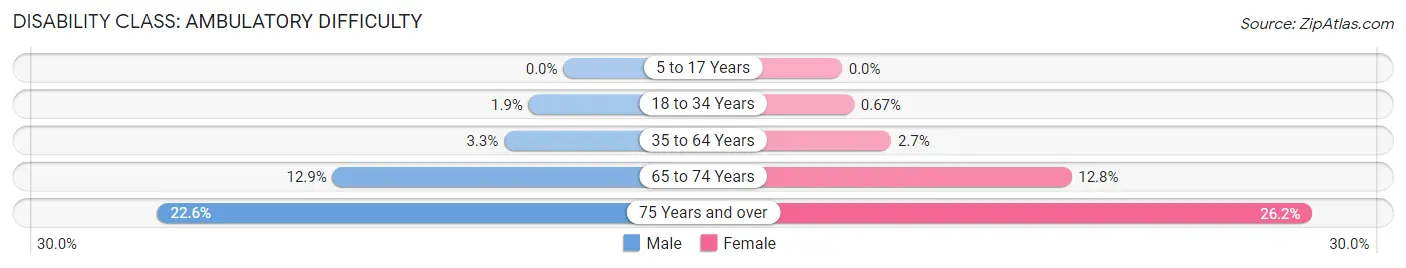
| Age Bracket | Male | Female |
| 5 to 17 Years | 0 (0.0%) | 0 (0.0%) |
| 18 to 34 Years | 37 (1.9%) | 16 (0.7%) |
| 35 to 64 Years | 171 (3.3%) | 165 (2.7%) |
| 65 to 74 Years | 102 (12.9%) | 118 (12.8%) |
| 75 Years and over | 103 (22.6%) | 142 (26.2%) |
Disability Class: Self-Care Difficulty
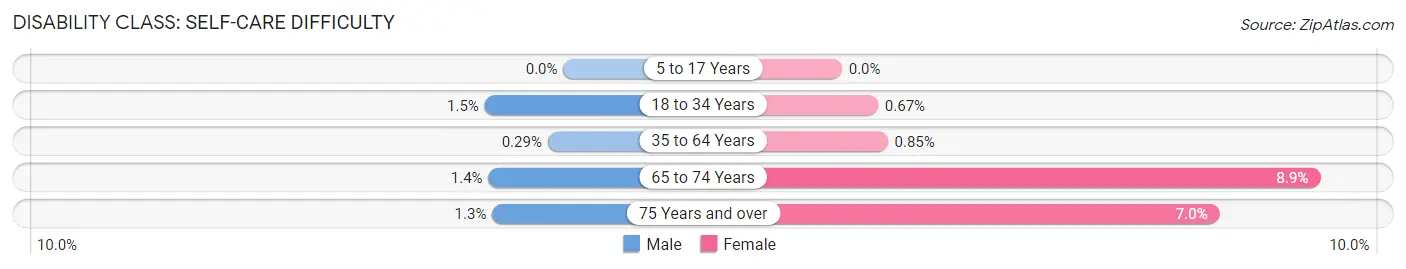
| Age Bracket | Male | Female |
| 5 to 17 Years | 0 (0.0%) | 0 (0.0%) |
| 18 to 34 Years | 28 (1.5%) | 16 (0.7%) |
| 35 to 64 Years | 15 (0.3%) | 51 (0.9%) |
| 65 to 74 Years | 11 (1.4%) | 82 (8.9%) |
| 75 Years and over | 6 (1.3%) | 38 (7.0%) |
Technology Access in Fort Mill
Computing Device Access in Fort Mill
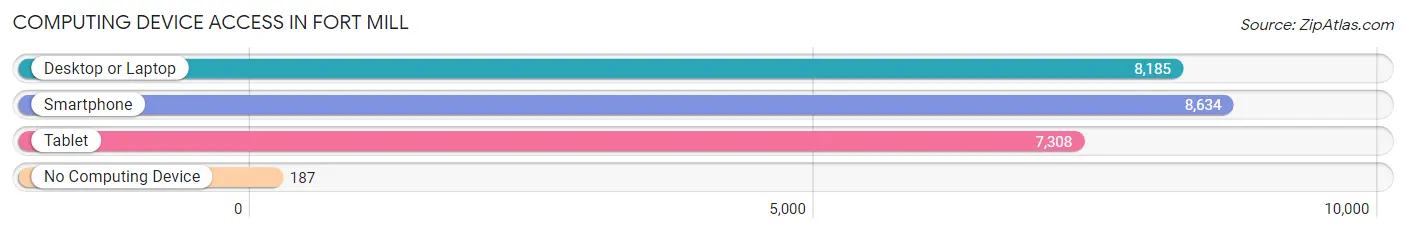
| Device Type | # Households | % Households |
| Desktop or Laptop | 8,185 | 91.0% |
| Smartphone | 8,634 | 96.0% |
| Tablet | 7,308 | 81.2% |
| No Computing Device | 187 | 2.1% |
| Total | 8,998 | 100.0% |
Internet Access in Fort Mill
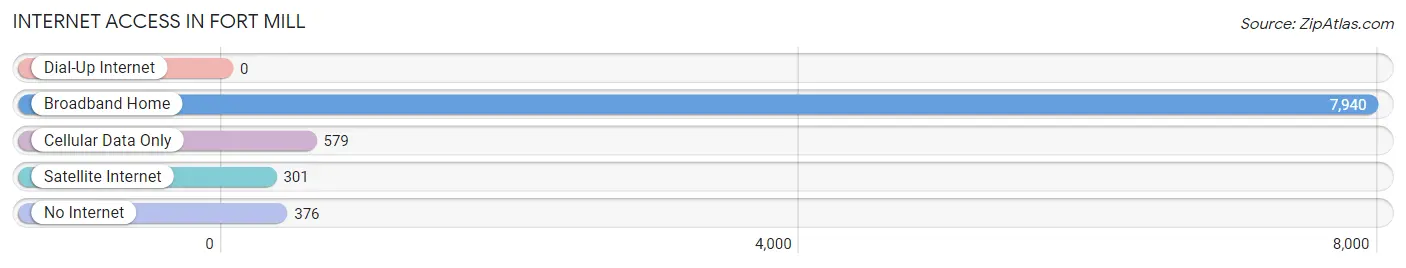
| Internet Type | # Households | % Households |
| Dial-Up Internet | 0 | 0.0% |
| Broadband Home | 7,940 | 88.2% |
| Cellular Data Only | 579 | 6.4% |
| Satellite Internet | 301 | 3.4% |
| No Internet | 376 | 4.2% |
| Total | 8,998 | 100.0% |
Fort Mill Summary
Fort Mill is a town located in York County, South Carolina, United States. It is a suburb of Charlotte, North Carolina, and is located approximately 15 miles south of the city. The population was 10,811 at the 2010 census, and had grown to 13,541 according to the 2019 census estimate.
History
Fort Mill was first settled in the late 1700s by European settlers. The town was originally known as "Fort Hill" and was named after a nearby fort built by the British during the Revolutionary War. The fort was used to protect the settlers from Native American attacks. The town was later renamed "Fort Mill" in 1873.
The town was incorporated in 1873 and has since grown to become one of the fastest-growing towns in the state. The town has seen a population boom in recent years, with the population increasing by over 50% since 2000.
Geography
Fort Mill is located in York County, South Carolina, approximately 15 miles south of Charlotte, North Carolina. The town is situated on the Catawba River and is bordered by the cities of Rock Hill and Tega Cay. The town has a total area of 8.3 square miles, all of which is land.
The town has a humid subtropical climate, with hot, humid summers and mild winters. The average annual temperature is around 70 degrees Fahrenheit.
Economy
Fort Mill is home to a variety of businesses and industries. The town is home to several large employers, including the headquarters of Springs Industries, a textile manufacturer, and the headquarters of Continental Tire North America. The town is also home to a variety of small businesses, including restaurants, retail stores, and professional services.
The town is also home to a variety of recreational activities, including golf courses, parks, and trails. The town is also home to a variety of cultural attractions, including the Anne Springs Close Greenway, a 2,100-acre nature preserve.
Demographics
As of the 2010 census, the population of Fort Mill was 10,811. The population has since grown to 13,541 according to the 2019 census estimate. The town has a population density of 1,300 people per square mile.
The racial makeup of the town is 87.3% White, 8.2% African American, 0.7% Asian, 0.3% Native American, 0.1% Pacific Islander, 1.7% from other races, and 1.9% from two or more races. The median household income is $68,945, and the median family income is $77,945. The town has a poverty rate of 8.3%.
Fort Mill is a growing town with a diverse population and a strong economy. The town is home to a variety of businesses and industries, as well as a variety of recreational activities and cultural attractions. The town is a great place to live, work, and play.
Common Questions
What is Per Capita Income in Fort Mill?
Per Capita income in Fort Mill is $49,784.
What is the Median Family Income in Fort Mill?
Median Family Income in Fort Mill is $143,099.
What is the Median Household income in Fort Mill?
Median Household Income in Fort Mill is $128,125.
What is Income or Wage Gap in Fort Mill?
Income or Wage Gap in Fort Mill is 38.7%.
Women in Fort Mill earn 61.3 cents for every dollar earned by a man.
What is Family Income Deficit in Fort Mill?
Family Income Deficit in Fort Mill is $11,960.
Families that are below poverty line in Fort Mill earn $11,960 less on average than the poverty threshold level.
What is Inequality or Gini Index in Fort Mill?
Inequality or Gini Index in Fort Mill is 0.39.
What is the Total Population of Fort Mill?
Total Population of Fort Mill is 26,022.
What is the Total Male Population of Fort Mill?
Total Male Population of Fort Mill is 12,581.
What is the Total Female Population of Fort Mill?
Total Female Population of Fort Mill is 13,441.
What is the Ratio of Males per 100 Females in Fort Mill?
There are 93.60 Males per 100 Females in Fort Mill.
What is the Ratio of Females per 100 Males in Fort Mill?
There are 106.84 Females per 100 Males in Fort Mill.
What is the Median Population Age in Fort Mill?
Median Population Age in Fort Mill is 36.7 Years.
What is the Average Family Size in Fort Mill
Average Family Size in Fort Mill is 3.2 People.
What is the Average Household Size in Fort Mill
Average Household Size in Fort Mill is 2.9 People.
How Large is the Labor Force in Fort Mill?
There are 13,347 People in the Labor Forcein in Fort Mill.
What is the Percentage of People in the Labor Force in Fort Mill?
70.6% of People are in the Labor Force in Fort Mill.
What is the Unemployment Rate in Fort Mill?
Unemployment Rate in Fort Mill is 2.3%.