Cities with the Highest Percentage of Immigrants from Mexico in the United States
RELATED REPORTS & OPTIONS
Mexico
United States
Compare Cities
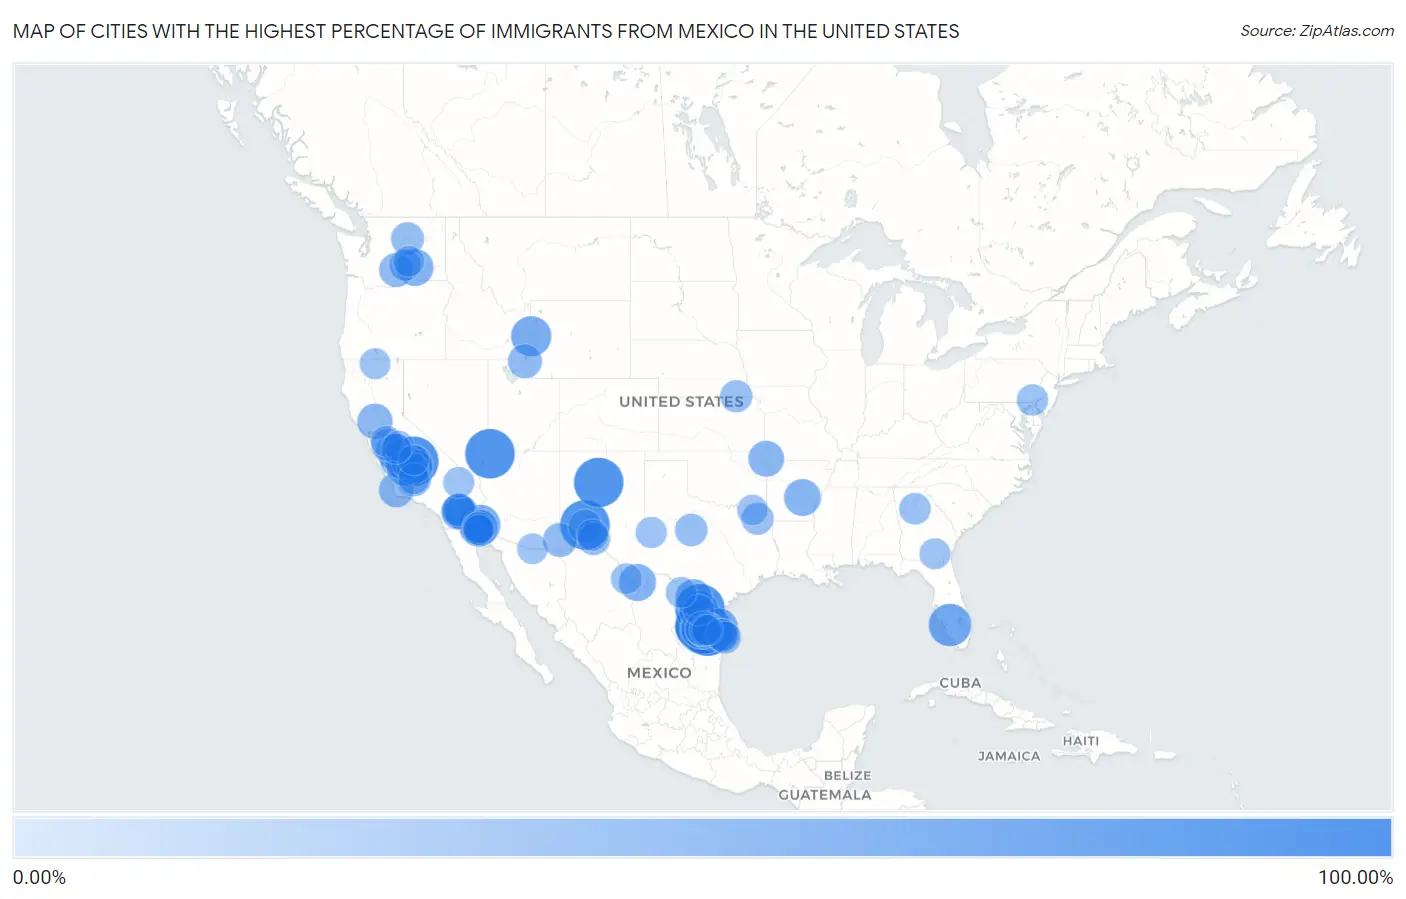
Map of Cities with the Highest Percentage of Immigrants from Mexico in the United States
0.00%
100.00%
Cities with the Highest Percentage of Immigrants from Mexico in the United States
| City | Mexico | vs State | vs National | |
| 1. | Yettem | 100.00% | 9.86%(+90.1)#-1 | 3.25%(+96.7)#0 |
| 2. | B And E | 100.00% | 8.25%(+91.8)#-1 | 3.25%(+96.7)#1 |
| 3. | Littlefield | 100.00% | 6.97%(+93.0)#-1 | 3.25%(+96.7)#2 |
| 4. | Garfield | 100.00% | 6.12%(+93.9)#-1 | 3.25%(+96.7)#3 |
| 5. | Manuel Garcia | 100.00% | 8.25%(+91.8)#0 | 3.25%(+96.7)#4 |
| 6. | La Chuparosa | 100.00% | 8.25%(+91.8)#1 | 3.25%(+96.7)#5 |
| 7. | Jovista | 100.00% | 9.86%(+90.1)#0 | 3.25%(+96.7)#6 |
| 8. | El Socio | 100.00% | 8.25%(+91.8)#2 | 3.25%(+96.7)#7 |
| 9. | Victoria Vera | 100.00% | 8.25%(+91.8)#3 | 3.25%(+96.7)#8 |
| 10. | Golden | 100.00% | 6.12%(+93.9)#0 | 3.25%(+96.7)#9 |
| 11. | Palo Blanco | 100.00% | 8.25%(+91.8)#4 | 3.25%(+96.7)#10 |
| 12. | Falconaire | 100.00% | 8.25%(+91.8)#5 | 3.25%(+96.7)#11 |
| 13. | Chapeno | 100.00% | 8.25%(+91.8)#6 | 3.25%(+96.7)#12 |
| 14. | Rafael Pena | 100.00% | 8.25%(+91.8)#7 | 3.25%(+96.7)#13 |
| 15. | Martinez | 100.00% | 8.25%(+91.8)#8 | 3.25%(+96.7)#14 |
| 16. | Hillside Acres | 100.00% | 8.25%(+91.8)#9 | 3.25%(+96.7)#15 |
| 17. | Campo Verde | 95.43% | 8.25%(+87.2)#10 | 3.25%(+92.2)#16 |
| 18. | Fluvanna | 83.33% | 8.25%(+75.1)#11 | 3.25%(+80.1)#17 |
| 19. | Charleston Park | 78.79% | 1.19%(+77.6)#-1 | 3.25%(+75.5)#18 |
| 20. | Hillisburg | 77.38% | 1.50%(+75.9)#-1 | 3.25%(+74.1)#19 |
| 21. | Ramos | 74.19% | 8.25%(+65.9)#12 | 3.25%(+70.9)#20 |
| 22. | Winterhaven | 73.58% | 9.86%(+63.7)#1 | 3.25%(+70.3)#21 |
| 23. | Alpine Northwest | 72.32% | 1.47%(+70.9)#-1 | 3.25%(+69.1)#22 |
| 24. | Fronton Ranchettes | 70.71% | 8.25%(+62.5)#13 | 3.25%(+67.5)#23 |
| 25. | Los Veteranos I | 69.23% | 8.25%(+61.0)#14 | 3.25%(+66.0)#24 |
| 26. | Drysdale | 67.19% | 6.97%(+60.2)#0 | 3.25%(+63.9)#25 |
| 27. | Ranchette Estates | 66.47% | 8.25%(+58.2)#15 | 3.25%(+63.2)#26 |
| 28. | Havana | 63.71% | 8.25%(+55.5)#16 | 3.25%(+60.5)#27 |
| 29. | Basin City | 62.93% | 3.14%(+59.8)#-1 | 3.25%(+59.7)#28 |
| 30. | Study Butte | 62.92% | 8.25%(+54.7)#17 | 3.25%(+59.7)#29 |
| 31. | Sherrill | 62.37% | 2.02%(+60.3)#-1 | 3.25%(+59.1)#30 |
| 32. | El Chaparral | 62.09% | 8.25%(+53.8)#18 | 3.25%(+58.8)#31 |
| 33. | Catarina | 61.54% | 8.25%(+53.3)#19 | 3.25%(+58.3)#32 |
| 34. | Shallow Water | 60.71% | 2.77%(+57.9)#-1 | 3.25%(+57.5)#33 |
| 35. | Woodville Farm Labor Camp | 60.71% | 9.86%(+50.8)#2 | 3.25%(+57.5)#34 |
| 36. | Linn Grove | 59.83% | 1.50%(+58.3)#0 | 3.25%(+56.6)#35 |
| 37. | Ginger Blue | 59.29% | 0.63%(+58.7)#-1 | 3.25%(+56.0)#36 |
| 38. | Pena | 58.67% | 8.25%(+50.4)#20 | 3.25%(+55.4)#37 |
| 39. | Dos Palos Y | 58.38% | 9.86%(+48.5)#3 | 3.25%(+55.1)#38 |
| 40. | Linnell Camp | 58.34% | 9.86%(+48.5)#4 | 3.25%(+55.1)#39 |
| 41. | Madison | 57.58% | 9.86%(+47.7)#5 | 3.25%(+54.3)#40 |
| 42. | Smith Corner | 56.96% | 9.86%(+47.1)#6 | 3.25%(+53.7)#41 |
| 43. | Three Rocks | 56.91% | 9.86%(+47.0)#7 | 3.25%(+53.7)#42 |
| 44. | Casmalia | 56.25% | 9.86%(+46.4)#8 | 3.25%(+53.0)#43 |
| 45. | Gutierrez | 55.56% | 8.25%(+47.3)#21 | 3.25%(+52.3)#44 |
| 46. | Oasis | 55.50% | 9.86%(+45.6)#9 | 3.25%(+52.2)#45 |
| 47. | Garceno | 55.22% | 8.25%(+47.0)#22 | 3.25%(+52.0)#46 |
| 48. | Mecca | 55.17% | 9.86%(+45.3)#10 | 3.25%(+51.9)#47 |
| 49. | Chula Vista Cdp Cameron County | 54.55% | 8.25%(+46.3)#23 | 3.25%(+51.3)#48 |
| 50. | Garden | 54.47% | 3.04%(+51.4)#-1 | 3.25%(+51.2)#49 |
| 51. | Parker | 54.44% | 3.14%(+51.3)#0 | 3.25%(+51.2)#50 |
| 52. | Kettleman City | 54.29% | 9.86%(+44.4)#11 | 3.25%(+51.0)#51 |
| 53. | Rodeo | 54.00% | 6.12%(+47.9)#1 | 3.25%(+50.7)#52 |
| 54. | North Shore | 53.49% | 9.86%(+43.6)#12 | 3.25%(+50.2)#53 |
| 55. | Salem | 52.49% | 6.12%(+46.4)#2 | 3.25%(+49.2)#54 |
| 56. | Donovan Estates | 52.30% | 6.97%(+45.3)#1 | 3.25%(+49.0)#55 |
| 57. | Plainview | 51.59% | 9.86%(+41.7)#13 | 3.25%(+48.3)#56 |
| 58. | Bridgeport | 51.16% | 3.14%(+48.0)#1 | 3.25%(+47.9)#57 |
| 59. | Westside | 50.79% | 9.86%(+40.9)#14 | 3.25%(+47.5)#58 |
| 60. | Thermal | 50.67% | 9.86%(+40.8)#15 | 3.25%(+47.4)#59 |
| 61. | Westway | 50.37% | 8.25%(+42.1)#24 | 3.25%(+47.1)#60 |
| 62. | Crows Landing | 50.00% | 9.86%(+40.1)#16 | 3.25%(+46.7)#61 |
| 63. | Hardwick | 50.00% | 9.86%(+40.1)#17 | 3.25%(+46.7)#62 |
| 64. | Impact | 50.00% | 8.25%(+41.8)#25 | 3.25%(+46.7)#63 |
| 65. | Olmito | 49.62% | 8.25%(+41.4)#26 | 3.25%(+46.4)#64 |
| 66. | Encantada Ranchito El Calaboz | 49.54% | 8.25%(+41.3)#27 | 3.25%(+46.3)#65 |
| 67. | Pumpkin Center | 49.22% | 9.86%(+39.4)#18 | 3.25%(+46.0)#66 |
| 68. | Barneston | 48.82% | 2.38%(+46.4)#-1 | 3.25%(+45.6)#67 |
| 69. | Miller S Cove | 48.65% | 8.25%(+40.4)#28 | 3.25%(+45.4)#68 |
| 70. | South Point | 48.36% | 8.25%(+40.1)#29 | 3.25%(+45.1)#69 |
| 71. | El Prado Estates | 48.08% | 6.97%(+41.1)#2 | 3.25%(+44.8)#70 |
| 72. | Tipton | 47.44% | 9.86%(+37.6)#19 | 3.25%(+44.2)#71 |
| 73. | Mattawa | 47.29% | 3.14%(+44.1)#2 | 3.25%(+44.0)#72 |
| 74. | La Moca Ranch | 47.06% | 8.25%(+38.8)#30 | 3.25%(+43.8)#73 |
| 75. | Gadsden | 46.99% | 6.97%(+40.0)#3 | 3.25%(+43.7)#74 |
| 76. | Las Lomas | 46.81% | 8.25%(+38.6)#31 | 3.25%(+43.6)#75 |
| 77. | San Miguel Cdp San Luis Obispo County | 46.81% | 9.86%(+36.9)#20 | 3.25%(+43.6)#76 |
| 78. | Lakeview Estates | 46.76% | 2.08%(+44.7)#-1 | 3.25%(+43.5)#77 |
| 79. | Sunset Cdp Starr County | 46.67% | 8.25%(+38.4)#32 | 3.25%(+43.4)#78 |
| 80. | Mesquite | 46.57% | 6.12%(+40.4)#3 | 3.25%(+43.3)#79 |
| 81. | Los Arcos | 46.34% | 8.25%(+38.1)#33 | 3.25%(+43.1)#80 |
| 82. | Toughkenamon | 46.11% | 0.42%(+45.7)#-1 | 3.25%(+42.9)#81 |
| 83. | Orange Grove Mobile Manor | 46.06% | 6.97%(+39.1)#4 | 3.25%(+42.8)#82 |
| 84. | Mckinney Acres | 45.74% | 8.25%(+37.5)#34 | 3.25%(+42.5)#83 |
| 85. | Cherokee Strip | 45.66% | 9.86%(+35.8)#21 | 3.25%(+42.4)#84 |
| 86. | Baker | 45.39% | 9.86%(+35.5)#22 | 3.25%(+42.1)#85 |
| 87. | Westley | 45.18% | 9.86%(+35.3)#23 | 3.25%(+41.9)#86 |
| 88. | Royal City | 45.10% | 3.14%(+42.0)#3 | 3.25%(+41.8)#87 |
| 89. | Argyle | 45.04% | 2.08%(+43.0)#0 | 3.25%(+41.8)#88 |
| 90. | Las Quintas Fronterizas | 44.80% | 8.25%(+36.6)#35 | 3.25%(+41.5)#89 |
| 91. | Planada | 44.71% | 9.86%(+34.8)#24 | 3.25%(+41.5)#90 |
| 92. | East Orosi | 44.55% | 9.86%(+34.7)#25 | 3.25%(+41.3)#91 |
| 93. | El Nido | 44.44% | 9.86%(+34.6)#26 | 3.25%(+41.2)#92 |
| 94. | Presidio | 44.41% | 8.25%(+36.2)#36 | 3.25%(+41.2)#93 |
| 95. | San Luis | 44.39% | 6.97%(+37.4)#5 | 3.25%(+41.1)#94 |
| 96. | Mount Hebron | 44.25% | 9.86%(+34.4)#27 | 3.25%(+41.0)#95 |
| 97. | Alto Bonito Heights | 44.21% | 8.25%(+36.0)#37 | 3.25%(+41.0)#96 |
| 98. | Nogales | 44.10% | 6.97%(+37.1)#6 | 3.25%(+40.9)#97 |
| 99. | Sun Valley | 44.00% | 8.25%(+35.8)#38 | 3.25%(+40.7)#98 |
| 100. | Hypericum | 43.96% | 9.86%(+34.1)#28 | 3.25%(+40.7)#99 |
Common Questions
What are the Top 10 Cities with the Highest Percentage of Immigrants from Mexico in the United States?
Top 10 Cities with the Highest Percentage of Immigrants from Mexico in the United States are:
#1
100.00%
#2
100.00%
#3
100.00%
#4
100.00%
#5
100.00%
#6
100.00%
#7
100.00%
#8
100.00%
#9
100.00%
#10
100.00%
What city has the Highest Percentage of Immigrants from Mexico in the United States?
Yettem has the Highest Percentage of Immigrants from Mexico in the United States with 100.00%.
What is the Percentage of Immigrants from Mexico in the United States?
Percentage of Immigrants from Mexico in the United States is 3.25%.