Cities with the Most Immigrants from Kazakhstan in the United States
RELATED REPORTS & OPTIONS
Kazakhstan
United States
Compare Cities
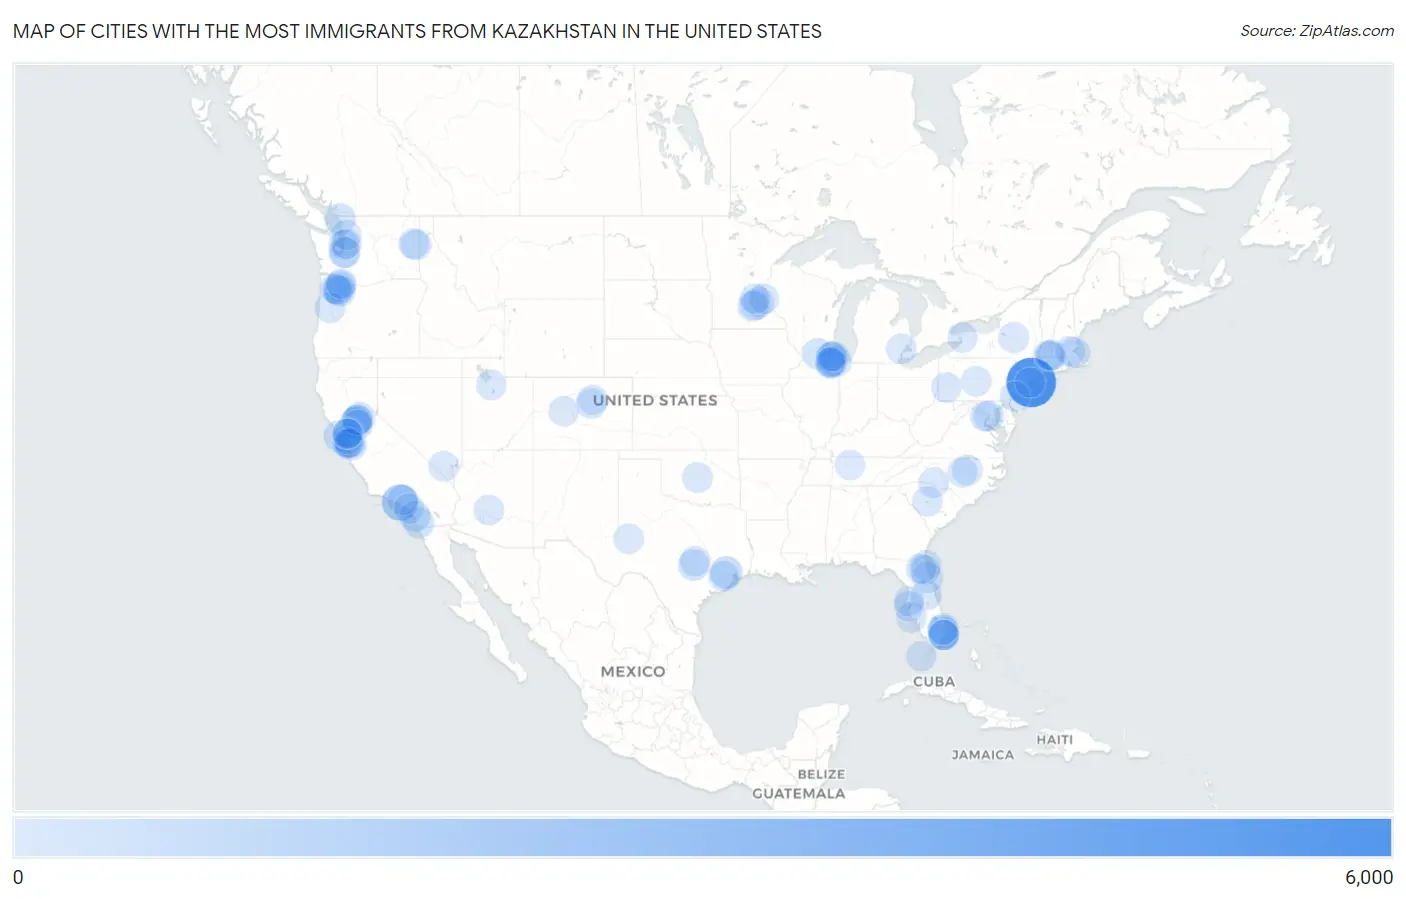
Map of Cities with the Most Immigrants from Kazakhstan in the United States
0
6,000
Cities with the Most Immigrants from Kazakhstan in the United States
| City | Kazakhstan | vs State | vs National | |
| 1. | New York | 5,038 | 6,042(83.38%)#1 | 37,031(13.60%)#1 |
| 2. | Los Angeles | 1,554 | 6,648(23.38%)#1 | 37,031(4.20%)#2 |
| 3. | Houston | 621 | 2,502(24.82%)#1 | 37,031(1.68%)#3 |
| 4. | Austin | 330 | 2,502(13.19%)#2 | 37,031(0.89%)#4 |
| 5. | Portland | 329 | 1,161(28.34%)#1 | 37,031(0.89%)#5 |
| 6. | San Diego | 315 | 6,648(4.74%)#2 | 37,031(0.85%)#6 |
| 7. | Oceanside | 294 | 6,648(4.42%)#3 | 37,031(0.79%)#7 |
| 8. | San Jose | 267 | 6,648(4.02%)#4 | 37,031(0.72%)#8 |
| 9. | Fort Lauderdale | 266 | 3,402(7.82%)#1 | 37,031(0.72%)#9 |
| 10. | Ferndale | 265 | 2,424(10.93%)#1 | 37,031(0.72%)#10 |
| 11. | Chicago | 262 | 2,070(12.66%)#1 | 37,031(0.71%)#11 |
| 12. | San Francisco | 259 | 6,648(3.90%)#5 | 37,031(0.70%)#12 |
| 13. | Rockford | 252 | 2,070(12.17%)#2 | 37,031(0.68%)#13 |
| 14. | Palm Coast | 247 | 3,402(7.26%)#2 | 37,031(0.67%)#14 |
| 15. | Boca Raton | 230 | 3,402(6.76%)#3 | 37,031(0.62%)#15 |
| 16. | Vancouver | 227 | 2,424(9.36%)#2 | 37,031(0.61%)#16 |
| 17. | West Sacramento | 223 | 6,648(3.35%)#6 | 37,031(0.60%)#17 |
| 18. | East Palo Alto | 204 | 6,648(3.07%)#7 | 37,031(0.55%)#18 |
| 19. | Jennings Lodge | 200 | 1,161(17.23%)#2 | 37,031(0.54%)#19 |
| 20. | Sacramento | 196 | 6,648(2.95%)#8 | 37,031(0.53%)#20 |
| 21. | North Highlands | 194 | 6,648(2.92%)#9 | 37,031(0.52%)#21 |
| 22. | Schaumburg | 191 | 2,070(9.23%)#3 | 37,031(0.52%)#22 |
| 23. | Orlando | 186 | 3,402(5.47%)#4 | 37,031(0.50%)#23 |
| 24. | Utica | 172 | 6,042(2.85%)#2 | 37,031(0.46%)#24 |
| 25. | Corvallis | 170 | 1,161(14.64%)#3 | 37,031(0.46%)#25 |
| 26. | Spokane Valley | 169 | 2,424(6.97%)#3 | 37,031(0.46%)#26 |
| 27. | Hallandale Beach | 166 | 3,402(4.88%)#5 | 37,031(0.45%)#27 |
| 28. | Federal Way | 162 | 2,424(6.68%)#4 | 37,031(0.44%)#28 |
| 29. | Washington | 152 | 152(100.00%)#1 | 37,031(0.41%)#29 |
| 30. | Glendale | 140 | 6,648(2.11%)#10 | 37,031(0.38%)#30 |
| 31. | Oklahoma City | 134 | 202(66.34%)#1 | 37,031(0.36%)#31 |
| 32. | Sugar Land | 134 | 2,502(5.36%)#3 | 37,031(0.36%)#32 |
| 33. | Rocklin | 134 | 6,648(2.02%)#11 | 37,031(0.36%)#33 |
| 34. | Boston | 132 | 1,036(12.74%)#1 | 37,031(0.36%)#34 |
| 35. | Bolingbrook | 132 | 2,070(6.38%)#4 | 37,031(0.36%)#35 |
| 36. | Philadelphia | 130 | 1,124(11.57%)#1 | 37,031(0.35%)#36 |
| 37. | Eagan | 124 | 763(16.25%)#1 | 37,031(0.33%)#37 |
| 38. | Elk Grove | 123 | 6,648(1.85%)#12 | 37,031(0.33%)#38 |
| 39. | Spokane | 122 | 2,424(5.03%)#5 | 37,031(0.33%)#39 |
| 40. | Park Forest Village | 122 | 1,124(10.85%)#2 | 37,031(0.33%)#40 |
| 41. | Auburn | 116 | 2,424(4.79%)#6 | 37,031(0.31%)#41 |
| 42. | Oak Brook | 114 | 2,070(5.51%)#5 | 37,031(0.31%)#42 |
| 43. | Mountain View | 113 | 6,648(1.70%)#13 | 37,031(0.31%)#43 |
| 44. | Seattle | 112 | 2,424(4.62%)#7 | 37,031(0.30%)#44 |
| 45. | Key West | 110 | 3,402(3.23%)#6 | 37,031(0.30%)#45 |
| 46. | Highlands Ranch | 107 | 529(20.23%)#1 | 37,031(0.29%)#46 |
| 47. | Aventura | 107 | 3,402(3.15%)#7 | 37,031(0.29%)#47 |
| 48. | Fairview | 105 | 6,648(1.58%)#14 | 37,031(0.28%)#48 |
| 49. | Concord | 103 | 6,648(1.55%)#15 | 37,031(0.28%)#49 |
| 50. | Lisle | 102 | 2,070(4.93%)#6 | 37,031(0.28%)#50 |
| 51. | Rolesville | 102 | 698(14.61%)#1 | 37,031(0.28%)#51 |
| 52. | Hillsboro | 100 | 1,161(8.61%)#4 | 37,031(0.27%)#52 |
| 53. | Sunny Isles Beach | 98 | 3,402(2.88%)#8 | 37,031(0.26%)#53 |
| 54. | Irvine | 97 | 6,648(1.46%)#16 | 37,031(0.26%)#54 |
| 55. | Cary | 95 | 698(13.61%)#2 | 37,031(0.26%)#55 |
| 56. | Oak Park | 95 | 529(17.96%)#1 | 37,031(0.26%)#56 |
| 57. | South Venice | 94 | 3,402(2.76%)#9 | 37,031(0.25%)#57 |
| 58. | St Petersburg | 93 | 3,402(2.73%)#10 | 37,031(0.25%)#58 |
| 59. | Milpitas | 93 | 6,648(1.40%)#17 | 37,031(0.25%)#59 |
| 60. | Westfield | 93 | 1,036(8.98%)#2 | 37,031(0.25%)#60 |
| 61. | Coral Springs | 92 | 3,402(2.70%)#11 | 37,031(0.25%)#61 |
| 62. | Round Rock | 91 | 2,502(3.64%)#4 | 37,031(0.25%)#62 |
| 63. | Denver | 89 | 529(16.82%)#2 | 37,031(0.24%)#63 |
| 64. | Charlotte | 87 | 698(12.46%)#3 | 37,031(0.23%)#64 |
| 65. | Phoenix | 86 | 433(19.86%)#1 | 37,031(0.23%)#65 |
| 66. | Lake Murray Of Richland | 86 | 579(14.85%)#1 | 37,031(0.23%)#66 |
| 67. | Jacksonville Beach | 85 | 3,402(2.50%)#12 | 37,031(0.23%)#67 |
| 68. | West Jordan | 83 | 193(43.01%)#1 | 37,031(0.22%)#68 |
| 69. | Odessa | 83 | 2,502(3.32%)#5 | 37,031(0.22%)#69 |
| 70. | Marysville | 83 | 2,424(3.42%)#8 | 37,031(0.22%)#70 |
| 71. | Antelope | 82 | 6,648(1.23%)#18 | 37,031(0.22%)#71 |
| 72. | Walnut Creek | 81 | 6,648(1.22%)#19 | 37,031(0.22%)#72 |
| 73. | Jordan | 81 | 763(10.62%)#2 | 37,031(0.22%)#73 |
| 74. | Wheeling | 79 | 2,070(3.82%)#7 | 37,031(0.21%)#74 |
| 75. | Santa Clara | 78 | 6,648(1.17%)#20 | 37,031(0.21%)#75 |
| 76. | Chicopee | 77 | 1,036(7.43%)#3 | 37,031(0.21%)#76 |
| 77. | West Springfield Town | 74 | 1,036(7.14%)#4 | 37,031(0.20%)#77 |
| 78. | World Golf Village | 73 | 3,402(2.15%)#13 | 37,031(0.20%)#78 |
| 79. | Fort Lee Borough | 72 | 993(7.25%)#1 | 37,031(0.19%)#79 |
| 80. | Eagleville Cdp Montgomery County | 71 | 1,124(6.32%)#3 | 37,031(0.19%)#80 |
| 81. | Jersey City | 70 | 993(7.05%)#2 | 37,031(0.19%)#81 |
| 82. | Naperville | 70 | 2,070(3.38%)#8 | 37,031(0.19%)#82 |
| 83. | Kirkland | 70 | 2,424(2.89%)#9 | 37,031(0.19%)#83 |
| 84. | Beaverton | 69 | 1,161(5.94%)#5 | 37,031(0.19%)#84 |
| 85. | Prior Lake | 68 | 763(8.91%)#3 | 37,031(0.18%)#85 |
| 86. | Rolling Meadows | 68 | 2,070(3.29%)#9 | 37,031(0.18%)#86 |
| 87. | Summerlin South | 67 | 220(30.45%)#1 | 37,031(0.18%)#87 |
| 88. | Battle Ground | 67 | 2,424(2.76%)#10 | 37,031(0.18%)#88 |
| 89. | Pittsburgh | 66 | 1,124(5.87%)#4 | 37,031(0.18%)#89 |
| 90. | Aspen | 66 | 529(12.48%)#3 | 37,031(0.18%)#90 |
| 91. | Pleasant Hill | 65 | 6,648(0.98%)#21 | 37,031(0.18%)#91 |
| 92. | Waltham | 64 | 1,036(6.18%)#5 | 37,031(0.17%)#92 |
| 93. | Fleming Island | 64 | 3,402(1.88%)#14 | 37,031(0.17%)#93 |
| 94. | Tysons | 64 | 1,074(5.96%)#1 | 37,031(0.17%)#94 |
| 95. | Stillwater | 64 | 763(8.39%)#4 | 37,031(0.17%)#95 |
| 96. | Marlene | 64 | 1,161(5.51%)#6 | 37,031(0.17%)#96 |
| 97. | Nashville | 63 | 202(31.19%)#1 | 37,031(0.17%)#97 |
| 98. | North Tonawanda | 63 | 6,042(1.04%)#3 | 37,031(0.17%)#98 |
| 99. | Westchase | 63 | 3,402(1.85%)#15 | 37,031(0.17%)#99 |
| 100. | New Hope | 63 | 763(8.26%)#5 | 37,031(0.17%)#100 |
Common Questions
What are the Top 10 Cities with the Most Immigrants from Kazakhstan in the United States?
Top 10 Cities with the Most Immigrants from Kazakhstan in the United States are:
What city has the Most Immigrants from Kazakhstan in the United States?
New York has the Most Immigrants from Kazakhstan in the United States with 5,038.
What is the Total Immigrants from Kazakhstan in the United States?
Total Immigrants from Kazakhstan in the United States is 37,031.