Arkansas Map & Demographics
Arkansas Map
Arkansas Overview
Jun 15, 1836
INCORPORATED
53,178
TOTAL AREA [ SQ MI ]
52,030
LAND AREA [ SQ MI ]
1,149
WATER AREA [ SQ MI ]
650
ELEVATION AVG [ FT ]
2,753
ELEVATION HIGH [ FT ]
55
ELEVATION LOW [ FT ]
58.0
POP DENSITY [ PPL / SQ MI ]
$31,868
PER CAPITA INCOME
$71,437
AVG FAMILY INCOME
$56,335
AVG HOUSEHOLD INCOME
26.0%
WAGE / INCOME GAP [ % ]
74.0¢/ $1
WAGE / INCOME GAP [ $ ]
$10,633
FAMILY INCOME DEFICIT
0.48
INEQUALITY / GINI INDEX
72764
LARGEST ZIP CODE
Little Rock
LARGEST CITY
Pulaski County
LARGEST COUNTY
3,018,669
TOTAL POPULATION
1,491,622
MALE POPULATION
1,527,047
FEMALE POPULATION
97.68
MALES / 100 FEMALES
102.37
FEMALES / 100 MALES
38.4
MEDIAN AGE
3.1
AVG FAMILY SIZE
2.5
AVG HOUSEHOLD SIZE
1,398,233
LABOR FORCE [ PEOPLE ]
58.2%
PERCENT IN LABOR FORCE
5.1%
UNEMPLOYMENT RATE
Income in Arkansas
Income Overview in Arkansas
Per Capita Income in Arkansas is $31,868, while median incomes of families and households are $71,437 and $56,335 respectively.
| Characteristic | Number | Measure |
| Per Capita Income | 3,018,669 | $31,868 |
| Median Family Income | 763,445 | $71,437 |
| Mean Family Income | 763,445 | $95,550 |
| Median Household Income | 1,171,694 | $56,335 |
| Mean Household Income | 1,171,694 | $79,592 |
| Income Deficit | 763,445 | $10,633 |
| Wage / Income Gap (%) | 3,018,669 | 25.96% |
| Wage / Income Gap ($) | 3,018,669 | 74.04¢ per $1 |
| Gini / Inequality Index | 3,018,669 | 0.48 |
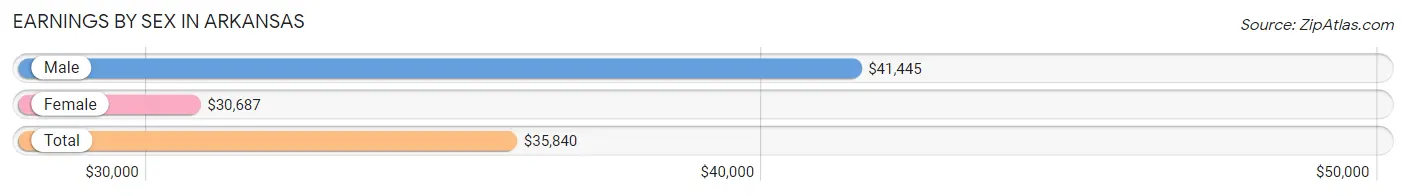
Earnings by Sex in Arkansas
Average Earnings in Arkansas are $35,840, $41,445 for men and $30,687 for women, a difference of 26.0%.
| Sex | Number | Average Earnings |
| Male | 764,238 (52.4%) | $41,445 |
| Female | 694,682 (47.6%) | $30,687 |
| Total | 1,458,920 (100.0%) | $35,840 |
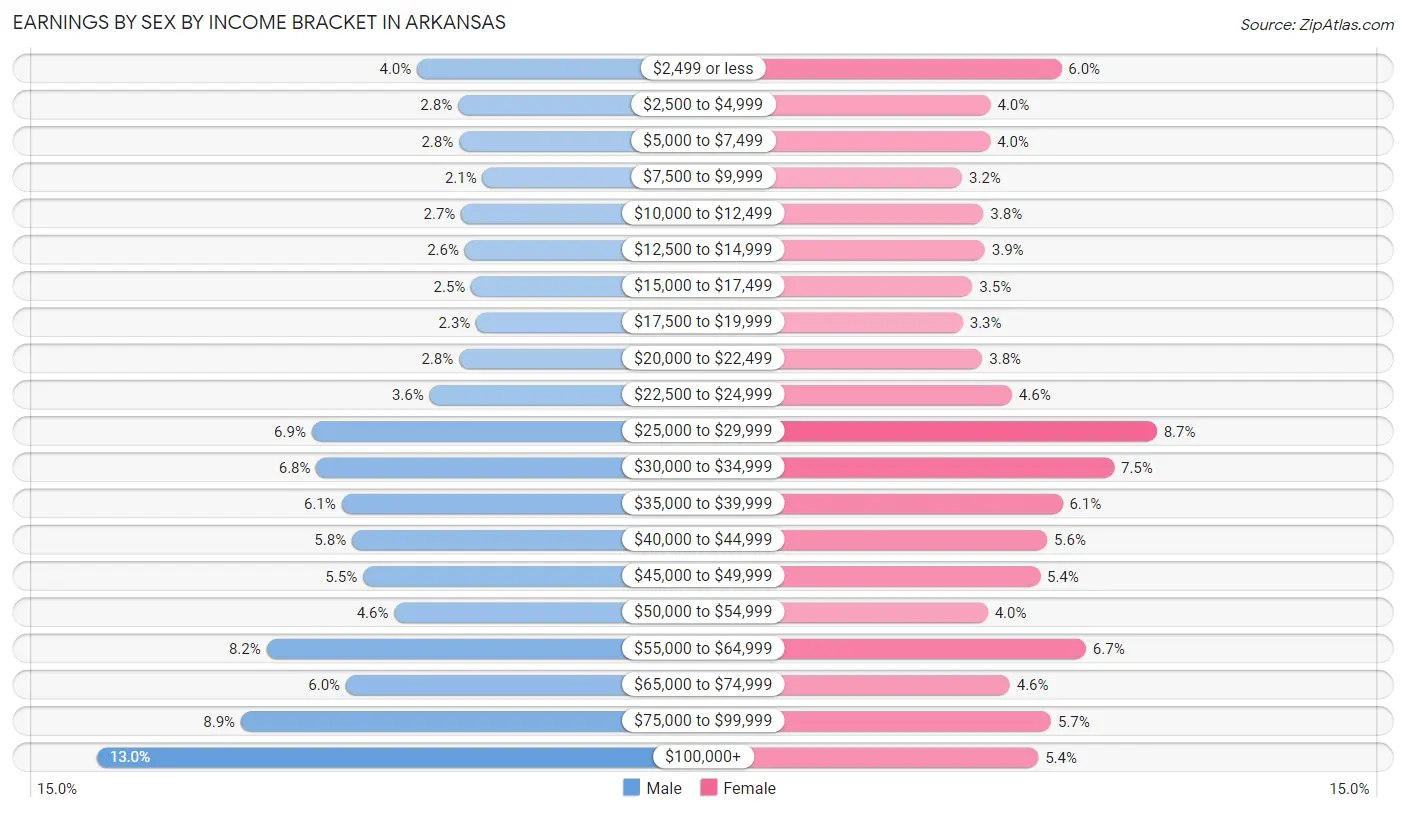
Earnings by Sex by Income Bracket in Arkansas
The most common earnings brackets in Arkansas are $100,000+ for men (99,134 | 13.0%) and $25,000 to $29,999 for women (60,487 | 8.7%).
| Income | Male | Female |
| $2,499 or less | 30,312 (4.0%) | 41,906 (6.0%) |
| $2,500 to $4,999 | 21,559 (2.8%) | 28,059 (4.0%) |
| $5,000 to $7,499 | 21,290 (2.8%) | 28,009 (4.0%) |
| $7,500 to $9,999 | 16,294 (2.1%) | 22,479 (3.2%) |
| $10,000 to $12,499 | 20,894 (2.7%) | 26,693 (3.8%) |
| $12,500 to $14,999 | 20,084 (2.6%) | 26,927 (3.9%) |
| $15,000 to $17,499 | 18,733 (2.5%) | 24,489 (3.5%) |
| $17,500 to $19,999 | 17,644 (2.3%) | 22,613 (3.3%) |
| $20,000 to $22,499 | 21,349 (2.8%) | 26,456 (3.8%) |
| $22,500 to $24,999 | 27,632 (3.6%) | 32,218 (4.6%) |
| $25,000 to $29,999 | 52,959 (6.9%) | 60,487 (8.7%) |
| $30,000 to $34,999 | 51,941 (6.8%) | 52,155 (7.5%) |
| $35,000 to $39,999 | 46,521 (6.1%) | 42,124 (6.1%) |
| $40,000 to $44,999 | 44,311 (5.8%) | 39,102 (5.6%) |
| $45,000 to $49,999 | 41,960 (5.5%) | 37,689 (5.4%) |
| $50,000 to $54,999 | 35,208 (4.6%) | 27,529 (4.0%) |
| $55,000 to $64,999 | 62,638 (8.2%) | 46,655 (6.7%) |
| $65,000 to $74,999 | 45,619 (6.0%) | 31,831 (4.6%) |
| $75,000 to $99,999 | 68,156 (8.9%) | 39,893 (5.7%) |
| $100,000+ | 99,134 (13.0%) | 37,368 (5.4%) |
| Total | 764,238 (100.0%) | 694,682 (100.0%) |
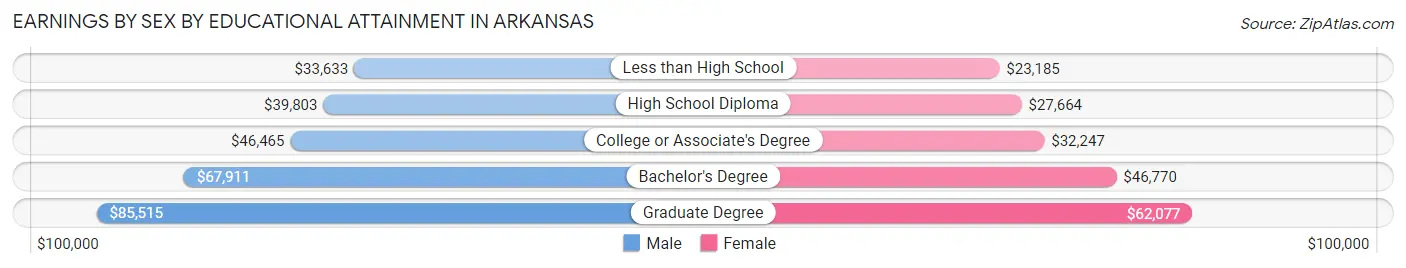
Earnings by Sex by Educational Attainment in Arkansas
Average earnings in Arkansas are $46,892 for men and $34,755 for women, a difference of 25.9%. Men with an educational attainment of graduate degree enjoy the highest average annual earnings of $85,515, while those with less than high school education earn the least with $33,633. Women with an educational attainment of graduate degree earn the most with the average annual earnings of $62,077, while those with less than high school education have the smallest earnings of $23,185.
| Educational Attainment | Male Income | Female Income |
| Less than High School | $33,633 | $23,185 |
| High School Diploma | $39,803 | $27,664 |
| College or Associate's Degree | $46,465 | $32,247 |
| Bachelor's Degree | $67,911 | $46,770 |
| Graduate Degree | $85,515 | $62,077 |
| Total | $46,892 | $34,755 |
Family Income in Arkansas
Family Income Brackets in Arkansas
According to the Arkansas family income data, there are 141,237 families falling into the $50,000 to $74,999 income range, which is the most common income bracket and makes up 18.5% of all families. Conversely, the $10,000 to $14,999 income bracket is the least frequent group with only 19,850 families (2.6%) belonging to this category.
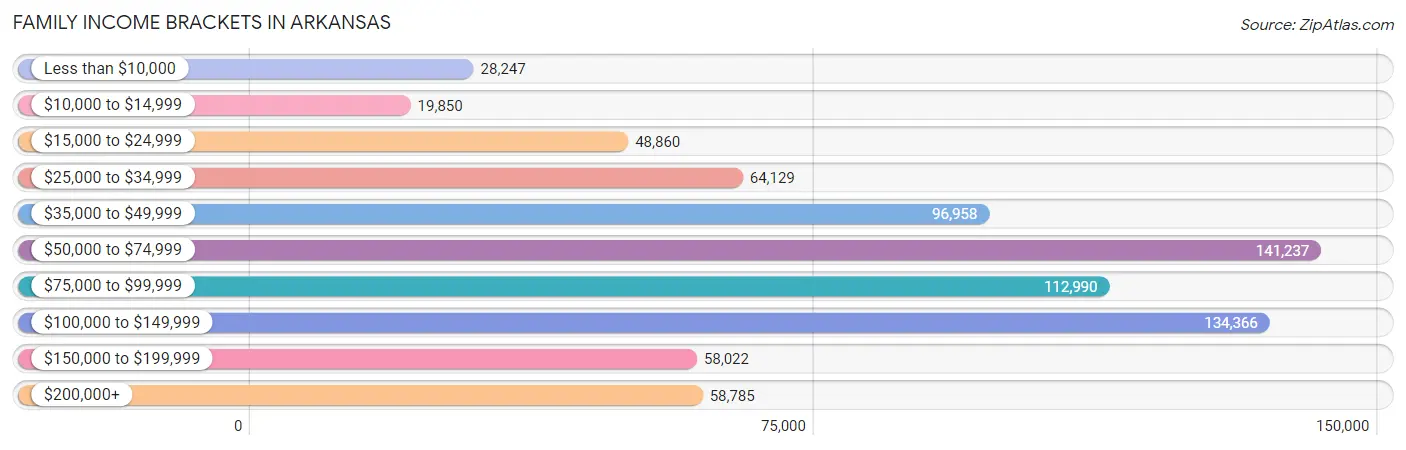
| Income Bracket | # Families | % Families |
| Less than $10,000 | 28,247 | 3.7% |
| $10,000 to $14,999 | 19,850 | 2.6% |
| $15,000 to $24,999 | 48,860 | 6.4% |
| $25,000 to $34,999 | 64,129 | 8.4% |
| $35,000 to $49,999 | 96,958 | 12.7% |
| $50,000 to $74,999 | 141,237 | 18.5% |
| $75,000 to $99,999 | 112,990 | 14.8% |
| $100,000 to $149,999 | 134,366 | 17.6% |
| $150,000 to $199,999 | 58,022 | 7.6% |
| $200,000+ | 58,785 | 7.7% |
Family Income by Famaliy Size in Arkansas
4-person families (126,829 | 16.6%) account for the highest median family income in Arkansas with $86,577 per family, while 2-person families (377,575 | 49.5%) have the highest median income of $32,277 per family member.
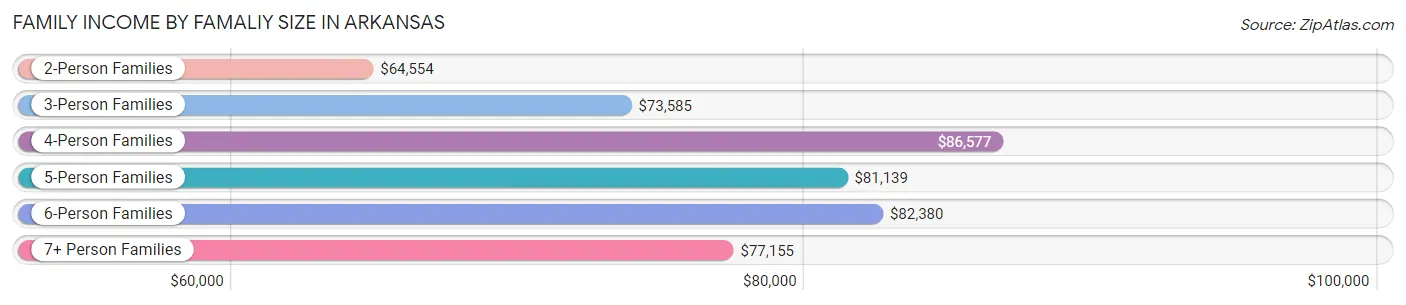
| Income Bracket | # Families | Median Income |
| 2-Person Families | 377,575 (49.5%) | $64,554 |
| 3-Person Families | 167,941 (22.0%) | $73,585 |
| 4-Person Families | 126,829 (16.6%) | $86,577 |
| 5-Person Families | 58,125 (7.6%) | $81,139 |
| 6-Person Families | 21,708 (2.8%) | $82,380 |
| 7+ Person Families | 11,267 (1.5%) | $77,155 |
| Total | 763,445 (100.0%) | $71,437 |
Family Income by Number of Earners in Arkansas
The median family income in Arkansas is $71,437, with families comprising 3+ earners (60,905) having the highest median family income of $120,284, while families with no earners (139,080) have the lowest median family income of $38,800, accounting for 8.0% and 18.2% of families, respectively.
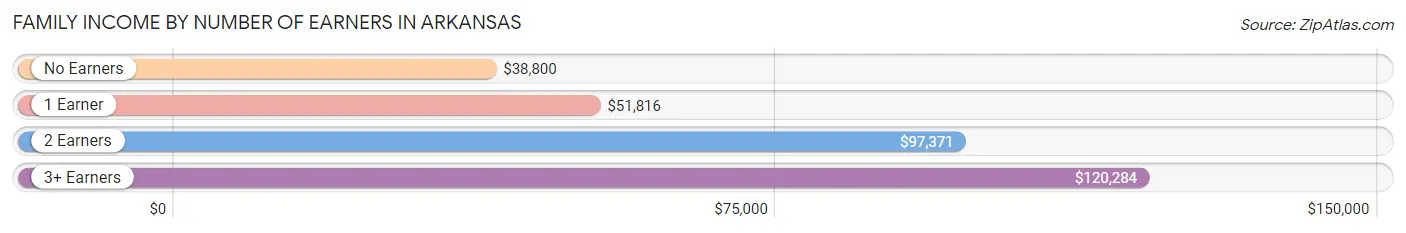
| Number of Earners | # Families | Median Income |
| No Earners | 139,080 (18.2%) | $38,800 |
| 1 Earner | 263,666 (34.5%) | $51,816 |
| 2 Earners | 299,794 (39.3%) | $97,371 |
| 3+ Earners | 60,905 (8.0%) | $120,284 |
| Total | 763,445 (100.0%) | $71,437 |
Household Income in Arkansas
Household Income Brackets in Arkansas
With 206,218 households falling in the category, the $50,000 to $74,999 income range is the most frequent in Arkansas, accounting for 17.6% of all households. In contrast, only 62,100 households (5.3%) fall into the $10,000 to $14,999 income bracket, making it the least populous group.
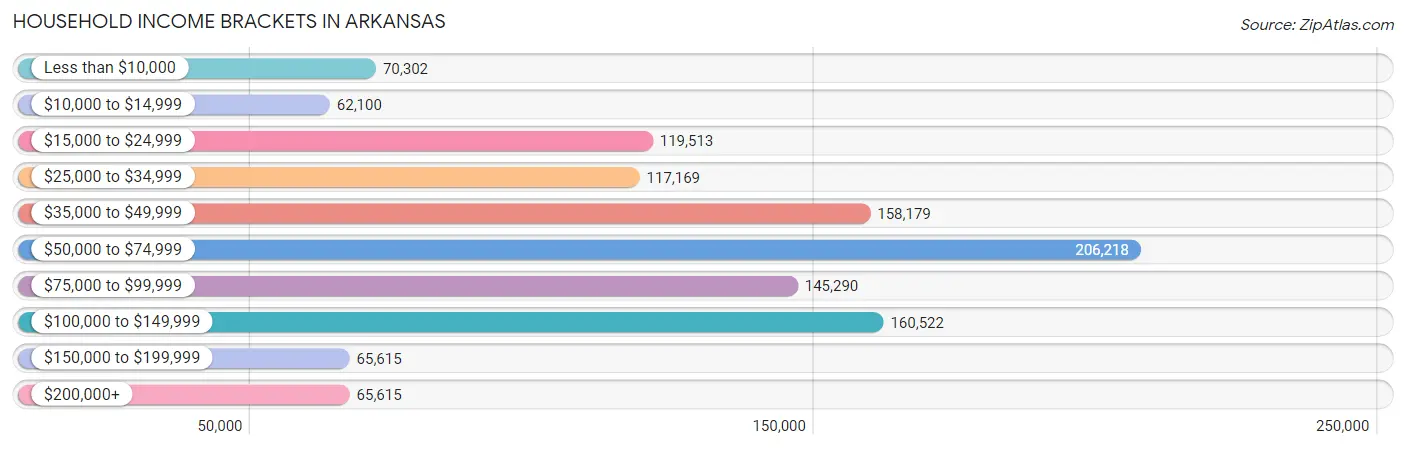
| Income Bracket | # Households | % Households |
| Less than $10,000 | 70,302 | 6.0% |
| $10,000 to $14,999 | 62,100 | 5.3% |
| $15,000 to $24,999 | 119,513 | 10.2% |
| $25,000 to $34,999 | 117,169 | 10.0% |
| $35,000 to $49,999 | 158,179 | 13.5% |
| $50,000 to $74,999 | 206,218 | 17.6% |
| $75,000 to $99,999 | 145,290 | 12.4% |
| $100,000 to $149,999 | 160,522 | 13.7% |
| $150,000 to $199,999 | 65,615 | 5.6% |
| $200,000+ | 65,615 | 5.6% |
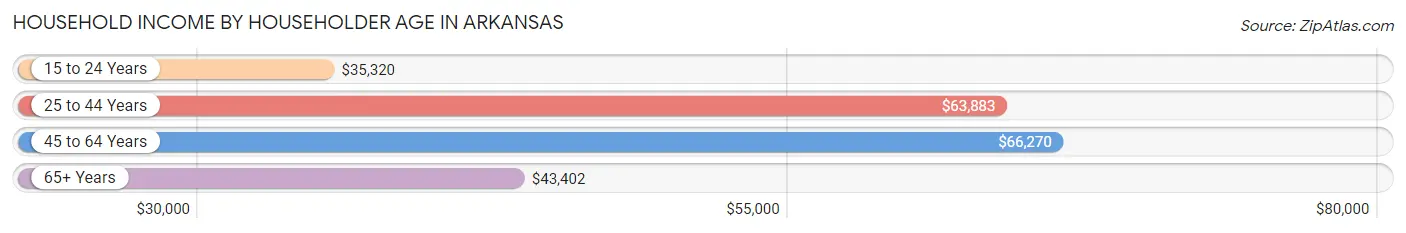
Household Income by Householder Age in Arkansas
The median household income in Arkansas is $56,335, with the highest median household income of $66,270 found in the 45 to 64 years age bracket for the primary householder. A total of 417,704 households (35.6%) fall into this category. Meanwhile, the 15 to 24 years age bracket for the primary householder has the lowest median household income of $35,320, with 56,874 households (4.9%) in this group.
| Income Bracket | # Households | Median Income |
| 15 to 24 Years | 56,874 (4.9%) | $35,320 |
| 25 to 44 Years | 372,505 (31.8%) | $63,883 |
| 45 to 64 Years | 417,704 (35.6%) | $66,270 |
| 65+ Years | 324,611 (27.7%) | $43,402 |
| Total | 1,171,694 (100.0%) | $56,335 |
Poverty in Arkansas
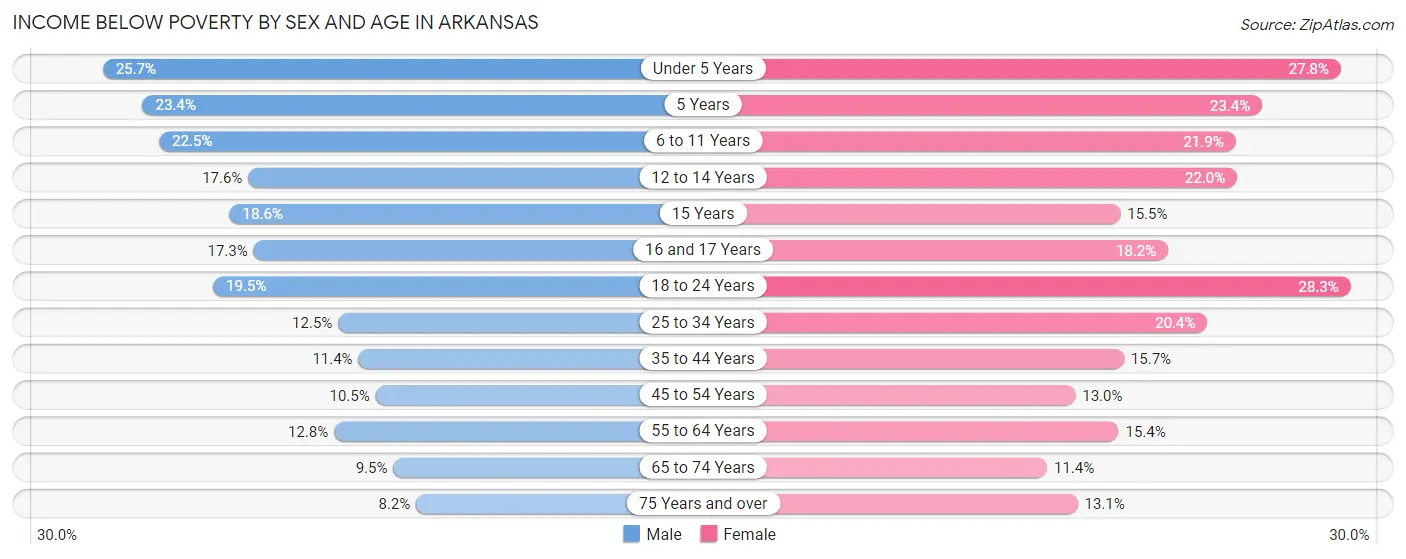
Income Below Poverty by Sex and Age in Arkansas
With 14.5% poverty level for males and 17.9% for females among the residents of Arkansas, under 5 year old males and 18 to 24 year old females are the most vulnerable to poverty, with 23,419 males (25.7%) and 35,668 females (28.3%) in their respective age groups living below the poverty level.
| Age Bracket | Male | Female |
| Under 5 Years | 23,419 (25.7%) | 24,000 (27.8%) |
| 5 Years | 4,527 (23.4%) | 3,953 (23.4%) |
| 6 to 11 Years | 26,258 (22.5%) | 25,002 (21.9%) |
| 12 to 14 Years | 10,953 (17.5%) | 12,632 (22.0%) |
| 15 Years | 3,735 (18.6%) | 3,132 (15.5%) |
| 16 and 17 Years | 7,093 (17.2%) | 7,104 (18.2%) |
| 18 to 24 Years | 26,036 (19.5%) | 35,668 (28.3%) |
| 25 to 34 Years | 23,652 (12.5%) | 39,134 (20.3%) |
| 35 to 44 Years | 20,771 (11.4%) | 29,449 (15.7%) |
| 45 to 54 Years | 18,284 (10.5%) | 23,331 (13.0%) |
| 55 to 64 Years | 23,582 (12.8%) | 30,025 (15.4%) |
| 65 to 74 Years | 13,254 (9.5%) | 18,224 (11.4%) |
| 75 Years and over | 7,030 (8.2%) | 15,481 (13.1%) |
| Total | 208,594 (14.5%) | 267,135 (17.9%) |
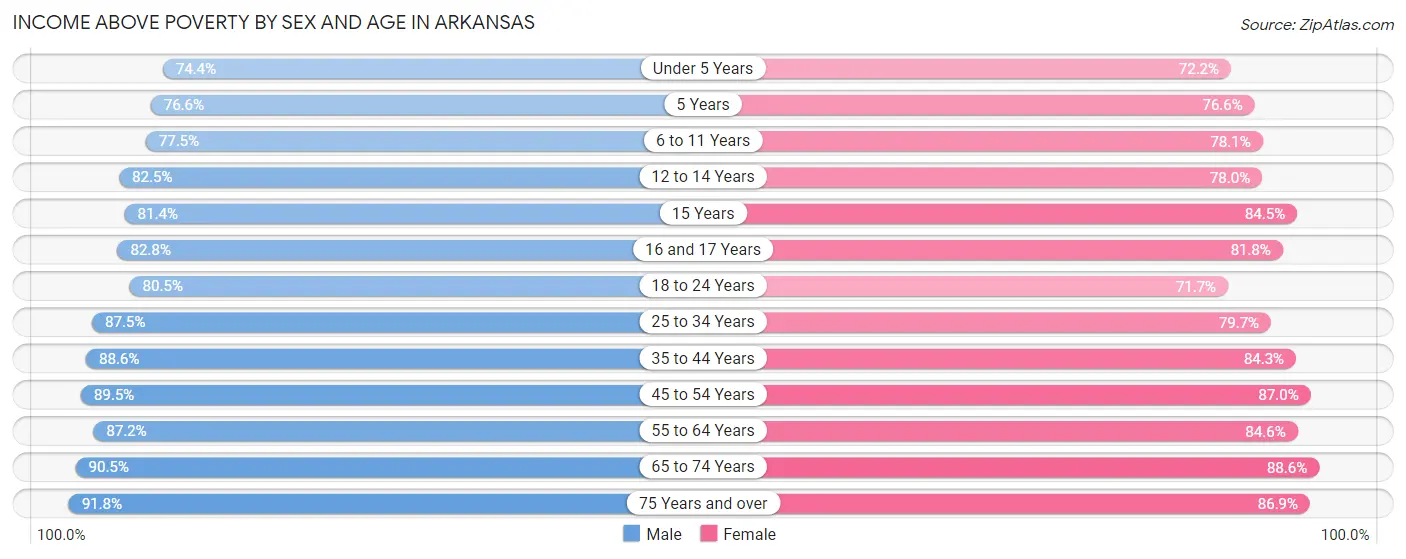
Income Above Poverty by Sex and Age in Arkansas
According to the poverty statistics in Arkansas, males aged 75 years and over and females aged 65 to 74 years are the age groups that are most secure financially, with 91.8% of males and 88.6% of females in these age groups living above the poverty line.
| Age Bracket | Male | Female |
| Under 5 Years | 67,896 (74.4%) | 62,348 (72.2%) |
| 5 Years | 14,795 (76.6%) | 12,940 (76.6%) |
| 6 to 11 Years | 90,379 (77.5%) | 89,050 (78.1%) |
| 12 to 14 Years | 51,449 (82.5%) | 44,763 (78.0%) |
| 15 Years | 16,370 (81.4%) | 17,066 (84.5%) |
| 16 and 17 Years | 34,031 (82.8%) | 31,986 (81.8%) |
| 18 to 24 Years | 107,516 (80.5%) | 90,251 (71.7%) |
| 25 to 34 Years | 164,895 (87.5%) | 153,182 (79.6%) |
| 35 to 44 Years | 161,228 (88.6%) | 157,988 (84.3%) |
| 45 to 54 Years | 156,510 (89.5%) | 156,151 (87.0%) |
| 55 to 64 Years | 161,016 (87.2%) | 164,844 (84.6%) |
| 65 to 74 Years | 126,652 (90.5%) | 141,268 (88.6%) |
| 75 Years and over | 78,662 (91.8%) | 102,412 (86.9%) |
| Total | 1,231,399 (85.5%) | 1,224,249 (82.1%) |
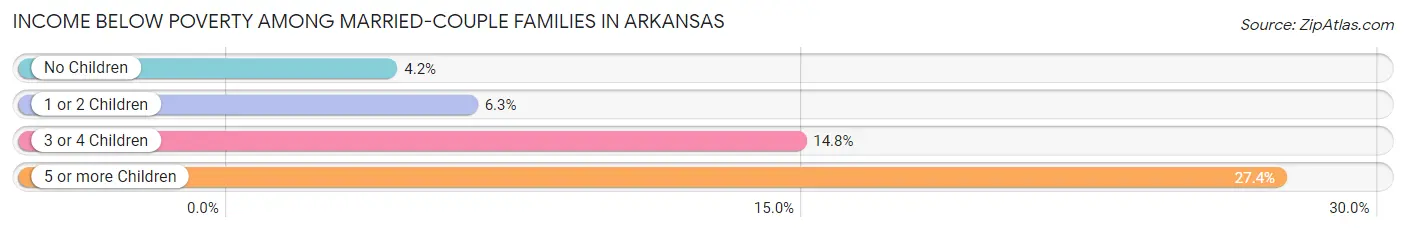
Income Below Poverty Among Married-Couple Families in Arkansas
The poverty statistics for married-couple families in Arkansas show that 5.9% or 33,052 of the total 556,967 families live below the poverty line. Families with 5 or more children have the highest poverty rate of 27.4%, comprising of 1,193 families. On the other hand, families with no children have the lowest poverty rate of 4.2%, which includes 13,724 families.
| Children | Above Poverty | Below Poverty |
| No Children | 316,172 (95.8%) | 13,724 (4.2%) |
| 1 or 2 Children | 163,011 (93.7%) | 10,891 (6.3%) |
| 3 or 4 Children | 41,569 (85.2%) | 7,244 (14.8%) |
| 5 or more Children | 3,163 (72.6%) | 1,193 (27.4%) |
| Total | 523,915 (94.1%) | 33,052 (5.9%) |
Income Below Poverty Among Single-Parent Households in Arkansas
According to the poverty data in Arkansas, 16.7% or 9,196 single-father households and 30.8% or 46,667 single-mother households are living below the poverty line. Among single-father households, those with 5 or more children have the highest poverty rate, with 463 households (55.8%) experiencing poverty. Likewise, among single-mother households, those with 5 or more children have the highest poverty rate, with 1,306 households (64.9%) falling below the poverty line.
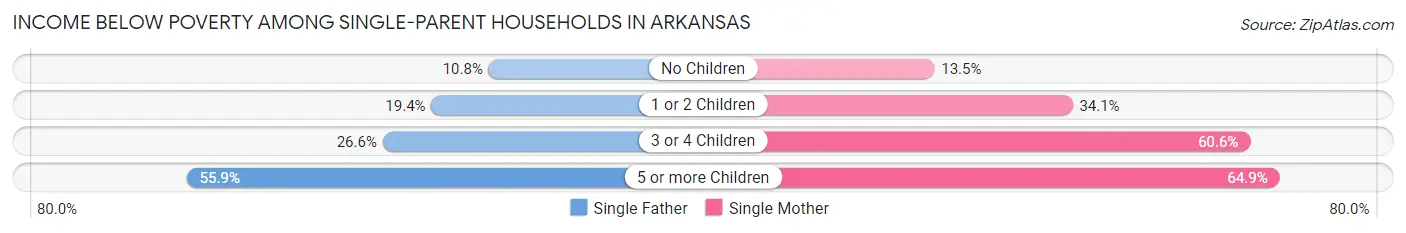
| Children | Single Father | Single Mother |
| No Children | 2,595 (10.8%) | 7,002 (13.5%) |
| 1 or 2 Children | 5,090 (19.4%) | 26,769 (34.1%) |
| 3 or 4 Children | 1,048 (26.6%) | 11,590 (60.6%) |
| 5 or more Children | 463 (55.8%) | 1,306 (64.9%) |
| Total | 9,196 (16.7%) | 46,667 (30.8%) |
Income Below Poverty Among Married-Couple vs Single-Parent Households in Arkansas
The poverty data for Arkansas shows that 33,052 of the married-couple family households (5.9%) and 55,863 of the single-parent households (27.1%) are living below the poverty level. Within the married-couple family households, those with 5 or more children have the highest poverty rate, with 1,193 households (27.4%) falling below the poverty line. Among the single-parent households, those with 5 or more children have the highest poverty rate, with 1,769 household (62.3%) living below poverty.
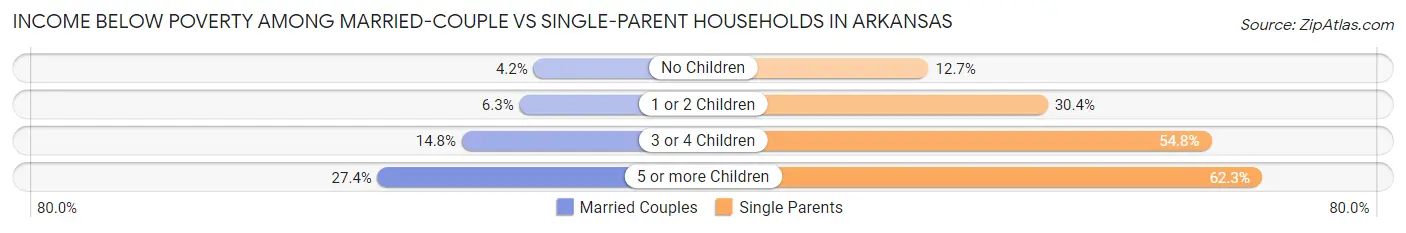
| Children | Married-Couple Families | Single-Parent Households |
| No Children | 13,724 (4.2%) | 9,597 (12.7%) |
| 1 or 2 Children | 10,891 (6.3%) | 31,859 (30.4%) |
| 3 or 4 Children | 7,244 (14.8%) | 12,638 (54.8%) |
| 5 or more Children | 1,193 (27.4%) | 1,769 (62.3%) |
| Total | 33,052 (5.9%) | 55,863 (27.1%) |
Largest Zip Codes by Population in Arkansas
The largest zip codes in Arkansas by population are 72764 (58,066), 72034 (48,286), 72701 (47,780), 72758 (46,731), and 71913 (46,227).
1.72764
58,066 (1.92%)
2.72034
48,286 (1.60%)
3.72701
47,780 (1.58%)
4.72758
46,731 (1.55%)
5.71913
46,227 (1.53%)
6.72762
44,822 (1.48%)
7.72401
42,159 (1.40%)
8.72756
40,282 (1.33%)
9.72450
40,251 (1.33%)
10.72076
39,284 (1.30%)
11.72712
38,006 (1.26%)
12.71854
36,148 (1.20%)
13.72023
36,042 (1.19%)
14.72703
35,324 (1.17%)
15.72032
34,900 (1.16%)
16.72956
34,805 (1.15%)
17.72143
34,692 (1.15%)
18.72120
32,815 (1.09%)
19.72209
32,095 (1.06%)
20.71603
30,604 (1.01%)
21.72204
30,348 (1.01%)
22.71901
30,023 (0.99%)
23.72601
29,777 (0.99%)
24.72404
29,571 (0.98%)
25.72019
29,529 (0.98%)
26.71730
29,287 (0.97%)
27.72704
28,832 (0.96%)
28.72653
28,615 (0.95%)
29.72015
27,298 (0.90%)
30.72501
26,604 (0.88%)
Largest Cities by Population in Arkansas
The largest cities in Arkansas by population are Little Rock (202,218), Fayetteville (95,022), Fort Smith (89,315), Springdale (86,705), and Jonesboro (78,379).
202,218 (6.70%)
95,022 (3.15%)
89,315 (2.96%)
86,705 (2.87%)
78,379 (2.60%)
6.Rogers
69,961 (2.32%)
7.Conway
65,159 (2.16%)
64,454 (2.14%)
54,513 (1.81%)
10.Pine Bluff
41,172 (1.36%)
11.Hot Springs
38,025 (1.26%)
12.Benton
35,318 (1.17%)
13.Sherwood
32,715 (1.08%)
14.Bella Vista
30,297 (1.00%)
15.Paragould
29,690 (0.98%)
16.Texarkana
29,404 (0.97%)
17.Jacksonville
29,332 (0.97%)
18.Russellville
28,946 (0.96%)
19.Cabot
26,543 (0.88%)
20.West Memphis
24,351 (0.81%)
21.Van Buren
23,398 (0.78%)
22.Searcy
22,961 (0.76%)
23.Bryant
20,750 (0.69%)
24.Maumelle
19,183 (0.64%)
25.Centerton
18,655 (0.62%)
17,632 (0.58%)
27.El Dorado
17,606 (0.58%)
16,843 (0.56%)
29.Marion
13,635 (0.45%)
30.Blytheville
13,276 (0.44%)
Largest Counties by Population in Arkansas
The largest counties in Arkansas by population are Pulaski County (398,322), Benton County (286,528), Washington County (247,331), Sebastian County (128,184), and Faulkner County (124,611).
398,322 (13.20%)
286,528 (9.49%)
247,331 (8.19%)
128,184 (4.25%)
124,611 (4.13%)
123,988 (4.11%)
111,038 (3.68%)
100,021 (3.31%)
77,118 (2.55%)
74,292 (2.46%)
66,934 (2.22%)
12.Pope County
63,475 (2.10%)
60,593 (2.01%)
47,945 (1.59%)
45,954 (1.52%)
42,682 (1.41%)
41,801 (1.38%)
40,361 (1.34%)
19.Union County
38,815 (1.29%)
37,910 (1.26%)
21.Boone County
37,662 (1.25%)
33,129 (1.10%)
28,362 (0.94%)
25,925 (0.86%)
24,948 (0.83%)
23,138 (0.77%)
22,997 (0.76%)
22,707 (0.75%)
22,606 (0.75%)
30.Clark County
21,469 (0.71%)
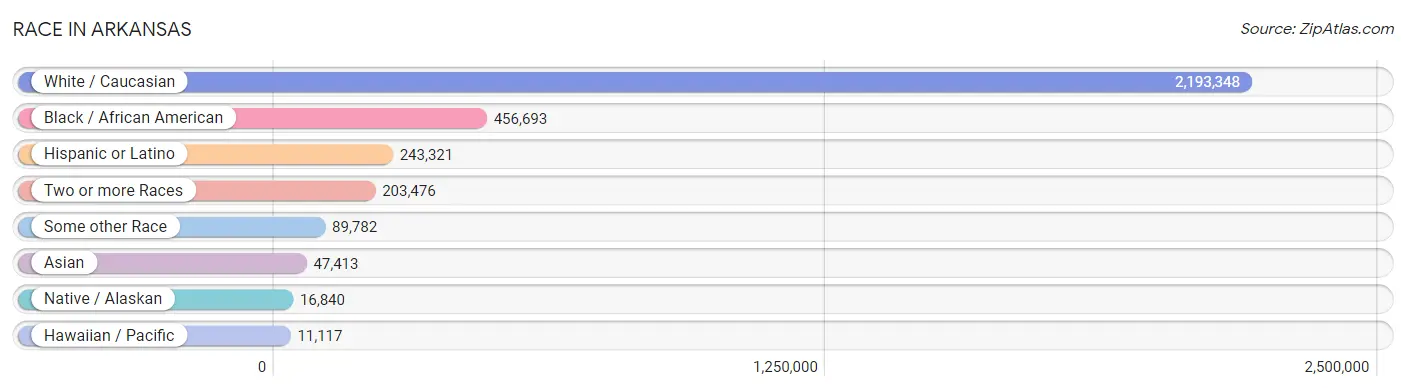
Race in Arkansas
The most populous races in Arkansas are White / Caucasian (2,193,348 | 72.7%), Black / African American (456,693 | 15.1%), and Hispanic or Latino (243,321 | 8.1%).
| Race | # Population | % Population |
| Asian | 47,413 | 1.6% |
| Black / African American | 456,693 | 15.1% |
| Hawaiian / Pacific | 11,117 | 0.4% |
| Hispanic or Latino | 243,321 | 8.1% |
| Native / Alaskan | 16,840 | 0.6% |
| White / Caucasian | 2,193,348 | 72.7% |
| Two or more Races | 203,476 | 6.7% |
| Some other Race | 89,782 | 3.0% |
| Total | 3,018,669 | 100.0% |
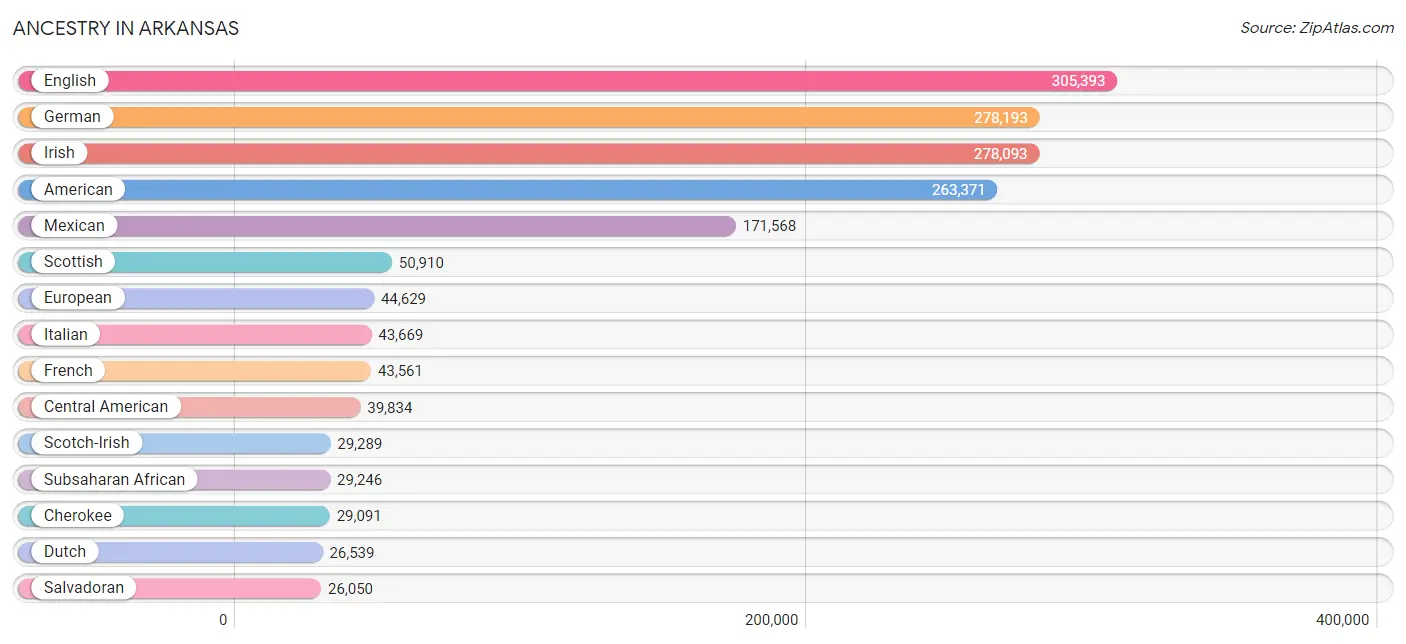
Ancestry in Arkansas
The most populous ancestries reported in Arkansas are English (305,393 | 10.1%), German (278,193 | 9.2%), Irish (278,093 | 9.2%), American (263,371 | 8.7%), and Mexican (171,568 | 5.7%), together accounting for 43.0% of all Arkansas residents.
| Ancestry | # Population | % Population |
| Afghan | 57 | 0.0% |
| African | 25,468 | 0.8% |
| Alaska Native | 36 | 0.0% |
| Alaskan Athabascan | 61 | 0.0% |
| Albanian | 111 | 0.0% |
| Aleut | 260 | 0.0% |
| Alsatian | 52 | 0.0% |
| American | 263,371 | 8.7% |
| Apache | 993 | 0.0% |
| Arab | 5,553 | 0.2% |
| Arapaho | 4 | 0.0% |
| Argentinean | 552 | 0.0% |
| Armenian | 442 | 0.0% |
| Assyrian / Chaldean / Syriac | 105 | 0.0% |
| Australian | 279 | 0.0% |
| Austrian | 2,166 | 0.1% |
| Bahamian | 99 | 0.0% |
| Bangladeshi | 2,149 | 0.1% |
| Barbadian | 20 | 0.0% |
| Basque | 89 | 0.0% |
| Belgian | 906 | 0.0% |
| Belizean | 160 | 0.0% |
| Bermudan | 99 | 0.0% |
| Bhutanese | 3,993 | 0.1% |
| Blackfeet | 2,550 | 0.1% |
| Bolivian | 200 | 0.0% |
| Brazilian | 1,117 | 0.0% |
| British | 15,420 | 0.5% |
| British West Indian | 53 | 0.0% |
| Bulgarian | 352 | 0.0% |
| Burmese | 4,449 | 0.2% |
| Cajun | 1,247 | 0.0% |
| Cambodian | 126 | 0.0% |
| Canadian | 2,039 | 0.1% |
| Carpatho Rusyn | 12 | 0.0% |
| Celtic | 387 | 0.0% |
| Central American | 39,834 | 1.3% |
| Central American Indian | 1,350 | 0.0% |
| Cherokee | 29,091 | 1.0% |
| Cheyenne | 105 | 0.0% |
| Chickasaw | 886 | 0.0% |
| Chilean | 562 | 0.0% |
| Chinese | 78 | 0.0% |
| Chippewa | 341 | 0.0% |
| Choctaw | 6,508 | 0.2% |
| Colombian | 1,250 | 0.0% |
| Colville | 9 | 0.0% |
| Comanche | 337 | 0.0% |
| Costa Rican | 676 | 0.0% |
| Cree | 84 | 0.0% |
| Creek | 944 | 0.0% |
| Croatian | 549 | 0.0% |
| Crow | 64 | 0.0% |
| Cuban | 2,234 | 0.1% |
| Czech | 6,082 | 0.2% |
| Czechoslovakian | 1,594 | 0.1% |
| Danish | 4,469 | 0.2% |
| Delaware | 141 | 0.0% |
| Dominican | 962 | 0.0% |
| Dutch | 26,539 | 0.9% |
| Dutch West Indian | 1,238 | 0.0% |
| Eastern European | 3,029 | 0.1% |
| Ecuadorian | 448 | 0.0% |
| Egyptian | 690 | 0.0% |
| English | 305,393 | 10.1% |
| Estonian | 50 | 0.0% |
| Ethiopian | 91 | 0.0% |
| European | 44,629 | 1.5% |
| Fijian | 8,851 | 0.3% |
| Filipino | 290 | 0.0% |
| Finnish | 1,724 | 0.1% |
| French | 43,561 | 1.4% |
| French American Indian | 190 | 0.0% |
| French Canadian | 5,259 | 0.2% |
| German | 278,193 | 9.2% |
| German Russian | 65 | 0.0% |
| Ghanaian | 508 | 0.0% |
| Greek | 2,996 | 0.1% |
| Guamanian / Chamorro | 230 | 0.0% |
| Guatemalan | 7,827 | 0.3% |
| Guyanese | 71 | 0.0% |
| Haitian | 737 | 0.0% |
| Honduran | 3,419 | 0.1% |
| Hopi | 3 | 0.0% |
| Houma | 16 | 0.0% |
| Hungarian | 2,527 | 0.1% |
| Icelander | 85 | 0.0% |
| Indian (Asian) | 8,069 | 0.3% |
| Indonesian | 545 | 0.0% |
| Inupiat | 91 | 0.0% |
| Iranian | 820 | 0.0% |
| Iraqi | 221 | 0.0% |
| Irish | 278,093 | 9.2% |
| Iroquois | 490 | 0.0% |
| Israeli | 373 | 0.0% |
| Italian | 43,669 | 1.5% |
| Jamaican | 805 | 0.0% |
| Japanese | 562 | 0.0% |
| Jordanian | 106 | 0.0% |
| Kenyan | 134 | 0.0% |
| Kiowa | 27 | 0.0% |
| Korean | 10,165 | 0.3% |
| Laotian | 453 | 0.0% |
| Latvian | 109 | 0.0% |
| Lebanese | 1,463 | 0.1% |
| Liberian | 102 | 0.0% |
| Lithuanian | 1,515 | 0.1% |
| Lumbee | 62 | 0.0% |
| Luxembourger | 64 | 0.0% |
| Macedonian | 32 | 0.0% |
| Malaysian | 6,712 | 0.2% |
| Maltese | 77 | 0.0% |
| Marshallese | 192 | 0.0% |
| Menominee | 28 | 0.0% |
| Mexican | 171,568 | 5.7% |
| Mexican American Indian | 3,405 | 0.1% |
| Mongolian | 175 | 0.0% |
| Moroccan | 167 | 0.0% |
| Native Hawaiian | 1,976 | 0.1% |
| Navajo | 786 | 0.0% |
| New Zealander | 109 | 0.0% |
| Nicaraguan | 839 | 0.0% |
| Nigerian | 1,016 | 0.0% |
| Northern European | 3,098 | 0.1% |
| Norwegian | 13,582 | 0.4% |
| Okinawan | 159 | 0.0% |
| Osage | 423 | 0.0% |
| Ottawa | 82 | 0.0% |
| Paiute | 44 | 0.0% |
| Pakistani | 1,812 | 0.1% |
| Palestinian | 354 | 0.0% |
| Panamanian | 807 | 0.0% |
| Pennsylvania German | 622 | 0.0% |
| Peruvian | 921 | 0.0% |
| Pima | 4 | 0.0% |
| Polish | 21,637 | 0.7% |
| Portuguese | 2,994 | 0.1% |
| Potawatomi | 626 | 0.0% |
| Pueblo | 21 | 0.0% |
| Puerto Rican | 8,465 | 0.3% |
| Romanian | 1,381 | 0.1% |
| Russian | 4,148 | 0.1% |
| Salvadoran | 26,050 | 0.9% |
| Samoan | 1,129 | 0.0% |
| Scandinavian | 5,899 | 0.2% |
| Scotch-Irish | 29,289 | 1.0% |
| Scottish | 50,910 | 1.7% |
| Seminole | 285 | 0.0% |
| Senegalese | 166 | 0.0% |
| Serbian | 303 | 0.0% |
| Shoshone | 54 | 0.0% |
| Sierra Leonean | 139 | 0.0% |
| Sioux | 792 | 0.0% |
| Slavic | 210 | 0.0% |
| Slovak | 857 | 0.0% |
| Slovene | 209 | 0.0% |
| South African | 629 | 0.0% |
| South American | 5,355 | 0.2% |
| South American Indian | 59 | 0.0% |
| Spaniard | 3,235 | 0.1% |
| Spanish | 3,263 | 0.1% |
| Spanish American | 140 | 0.0% |
| Spanish American Indian | 57 | 0.0% |
| Sri Lankan | 7,442 | 0.3% |
| Subsaharan African | 29,246 | 1.0% |
| Swedish | 12,444 | 0.4% |
| Swiss | 4,696 | 0.2% |
| Syrian | 618 | 0.0% |
| Thai | 13,274 | 0.4% |
| Tlingit-Haida | 27 | 0.0% |
| Tohono O'Odham | 95 | 0.0% |
| Tongan | 197 | 0.0% |
| Trinidadian and Tobagonian | 417 | 0.0% |
| Turkish | 229 | 0.0% |
| U.S. Virgin Islander | 43 | 0.0% |
| Ugandan | 7 | 0.0% |
| Ukrainian | 1,581 | 0.1% |
| Uruguayan | 39 | 0.0% |
| Ute | 39 | 0.0% |
| Venezuelan | 1,169 | 0.0% |
| Vietnamese | 506 | 0.0% |
| Welsh | 13,962 | 0.5% |
| West Indian | 918 | 0.0% |
| Yakama | 10 | 0.0% |
| Yaqui | 207 | 0.0% |
| Yugoslavian | 259 | 0.0% |
| Yup'ik | 239 | 0.0% |
| Zimbabwean | 44 | 0.0% | View All 188 Rows |
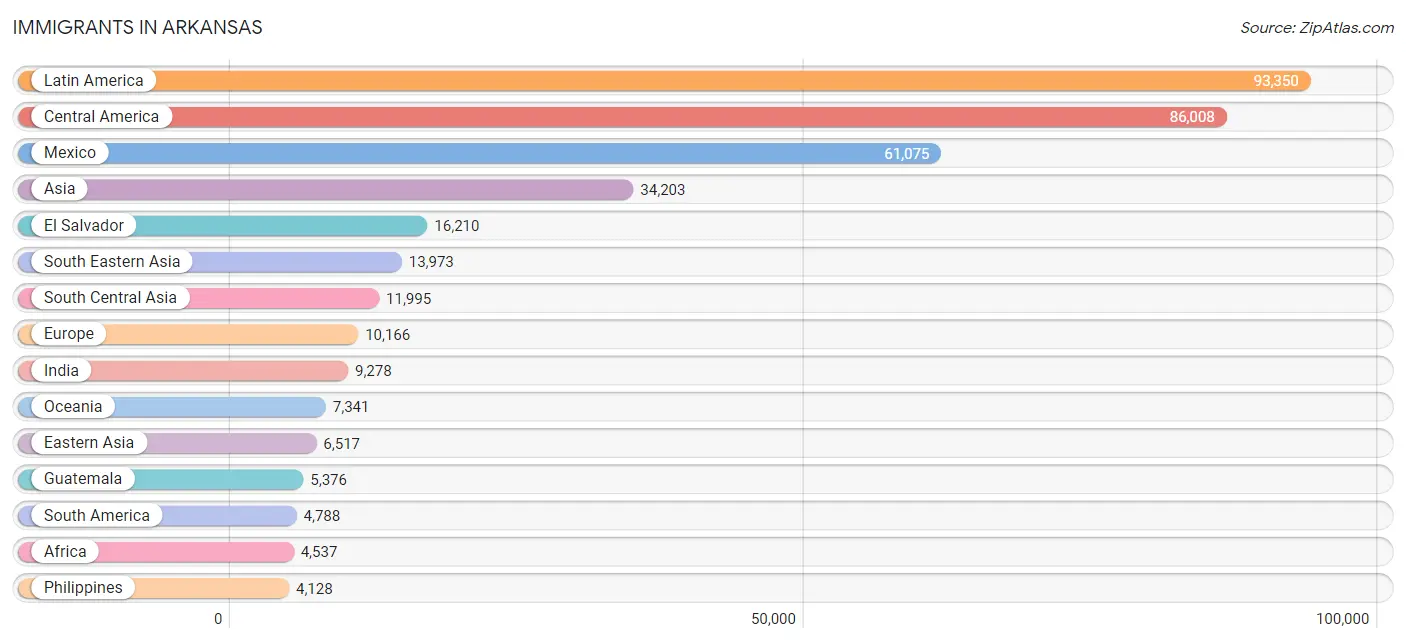
Immigrants in Arkansas
The most numerous immigrant groups reported in Arkansas came from Latin America (93,350 | 3.1%), Central America (86,008 | 2.9%), Mexico (61,075 | 2.0%), Asia (34,203 | 1.1%), and El Salvador (16,210 | 0.5%), together accounting for 9.6% of all Arkansas residents.
| Immigration Origin | # Population | % Population |
| Afghanistan | 57 | 0.0% |
| Africa | 4,537 | 0.2% |
| Albania | 61 | 0.0% |
| Argentina | 399 | 0.0% |
| Asia | 34,203 | 1.1% |
| Australia | 371 | 0.0% |
| Austria | 79 | 0.0% |
| Bahamas | 226 | 0.0% |
| Bangladesh | 618 | 0.0% |
| Barbados | 34 | 0.0% |
| Belarus | 108 | 0.0% |
| Belgium | 68 | 0.0% |
| Belize | 89 | 0.0% |
| Bolivia | 149 | 0.0% |
| Bosnia and Herzegovina | 7 | 0.0% |
| Brazil | 1,447 | 0.1% |
| Bulgaria | 52 | 0.0% |
| Cambodia | 338 | 0.0% |
| Cameroon | 275 | 0.0% |
| Canada | 2,174 | 0.1% |
| Caribbean | 2,554 | 0.1% |
| Central America | 86,008 | 2.9% |
| Chile | 173 | 0.0% |
| China | 4,026 | 0.1% |
| Colombia | 889 | 0.0% |
| Congo | 85 | 0.0% |
| Costa Rica | 664 | 0.0% |
| Croatia | 11 | 0.0% |
| Cuba | 455 | 0.0% |
| Czechoslovakia | 174 | 0.0% |
| Denmark | 148 | 0.0% |
| Dominica | 319 | 0.0% |
| Dominican Republic | 403 | 0.0% |
| Eastern Africa | 965 | 0.0% |
| Eastern Asia | 6,517 | 0.2% |
| Eastern Europe | 2,189 | 0.1% |
| Ecuador | 332 | 0.0% |
| Egypt | 329 | 0.0% |
| El Salvador | 16,210 | 0.5% |
| England | 1,434 | 0.1% |
| Ethiopia | 80 | 0.0% |
| Europe | 10,166 | 0.3% |
| Fiji | 6 | 0.0% |
| France | 469 | 0.0% |
| Germany | 2,721 | 0.1% |
| Ghana | 425 | 0.0% |
| Greece | 100 | 0.0% |
| Grenada | 19 | 0.0% |
| Guatemala | 5,376 | 0.2% |
| Guyana | 33 | 0.0% |
| Haiti | 431 | 0.0% |
| Honduras | 1,606 | 0.1% |
| Hong Kong | 84 | 0.0% |
| Hungary | 80 | 0.0% |
| India | 9,278 | 0.3% |
| Indonesia | 486 | 0.0% |
| Iran | 487 | 0.0% |
| Iraq | 250 | 0.0% |
| Ireland | 239 | 0.0% |
| Israel | 133 | 0.0% |
| Italy | 157 | 0.0% |
| Jamaica | 240 | 0.0% |
| Japan | 603 | 0.0% |
| Jordan | 271 | 0.0% |
| Kenya | 267 | 0.0% |
| Korea | 1,813 | 0.1% |
| Kuwait | 133 | 0.0% |
| Laos | 3,381 | 0.1% |
| Latin America | 93,350 | 3.1% |
| Lebanon | 50 | 0.0% |
| Liberia | 128 | 0.0% |
| Lithuania | 8 | 0.0% |
| Malaysia | 114 | 0.0% |
| Mexico | 61,075 | 2.0% |
| Micronesia | 90 | 0.0% |
| Middle Africa | 462 | 0.0% |
| Moldova | 49 | 0.0% |
| Morocco | 84 | 0.0% |
| Nepal | 195 | 0.0% |
| Netherlands | 205 | 0.0% |
| Nicaragua | 404 | 0.0% |
| Nigeria | 627 | 0.0% |
| Northern Africa | 629 | 0.0% |
| Northern Europe | 3,842 | 0.1% |
| Norway | 79 | 0.0% |
| Oceania | 7,341 | 0.2% |
| Pakistan | 1,236 | 0.0% |
| Panama | 563 | 0.0% |
| Peru | 486 | 0.0% |
| Philippines | 4,128 | 0.1% |
| Poland | 451 | 0.0% |
| Portugal | 35 | 0.0% |
| Romania | 403 | 0.0% |
| Russia | 360 | 0.0% |
| Saudi Arabia | 172 | 0.0% |
| Scotland | 485 | 0.0% |
| Serbia | 52 | 0.0% |
| Sierra Leone | 53 | 0.0% |
| Singapore | 95 | 0.0% |
| South Africa | 800 | 0.0% |
| South America | 4,788 | 0.2% |
| South Central Asia | 11,995 | 0.4% |
| South Eastern Asia | 13,973 | 0.5% |
| Southern Europe | 505 | 0.0% |
| Spain | 213 | 0.0% |
| Sri Lanka | 107 | 0.0% |
| St. Vincent and the Grenadines | 17 | 0.0% |
| Sweden | 153 | 0.0% |
| Switzerland | 23 | 0.0% |
| Syria | 50 | 0.0% |
| Taiwan | 439 | 0.0% |
| Thailand | 1,136 | 0.0% |
| Trinidad and Tobago | 333 | 0.0% |
| Turkey | 181 | 0.0% |
| Uganda | 12 | 0.0% |
| Ukraine | 207 | 0.0% |
| Uzbekistan | 10 | 0.0% |
| Venezuela | 755 | 0.0% |
| Vietnam | 4,028 | 0.1% |
| Western Africa | 1,392 | 0.1% |
| Western Asia | 1,684 | 0.1% |
| Western Europe | 3,565 | 0.1% |
| Yemen | 318 | 0.0% |
| Zaire | 102 | 0.0% |
| Zimbabwe | 93 | 0.0% | View All 125 Rows |
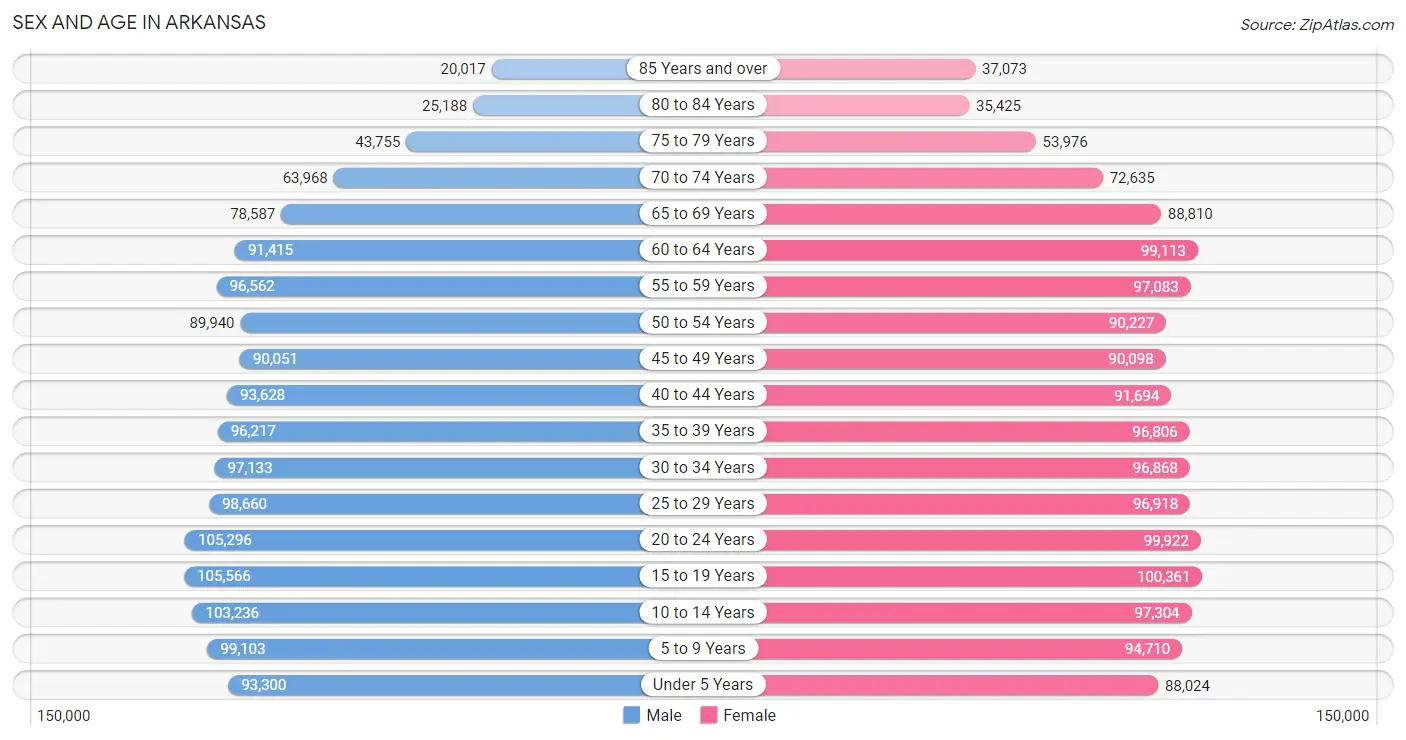
Sex and Age in Arkansas
Sex and Age in Arkansas
The most populous age groups in Arkansas are 15 to 19 Years (105,566 | 7.1%) for men and 15 to 19 Years (100,361 | 6.6%) for women.
| Age Bracket | Male | Female |
| Under 5 Years | 93,300 (6.2%) | 88,024 (5.8%) |
| 5 to 9 Years | 99,103 (6.6%) | 94,710 (6.2%) |
| 10 to 14 Years | 103,236 (6.9%) | 97,304 (6.4%) |
| 15 to 19 Years | 105,566 (7.1%) | 100,361 (6.6%) |
| 20 to 24 Years | 105,296 (7.1%) | 99,922 (6.5%) |
| 25 to 29 Years | 98,660 (6.6%) | 96,918 (6.4%) |
| 30 to 34 Years | 97,133 (6.5%) | 96,868 (6.3%) |
| 35 to 39 Years | 96,217 (6.5%) | 96,806 (6.3%) |
| 40 to 44 Years | 93,628 (6.3%) | 91,694 (6.0%) |
| 45 to 49 Years | 90,051 (6.0%) | 90,098 (5.9%) |
| 50 to 54 Years | 89,940 (6.0%) | 90,227 (5.9%) |
| 55 to 59 Years | 96,562 (6.5%) | 97,083 (6.4%) |
| 60 to 64 Years | 91,415 (6.1%) | 99,113 (6.5%) |
| 65 to 69 Years | 78,587 (5.3%) | 88,810 (5.8%) |
| 70 to 74 Years | 63,968 (4.3%) | 72,635 (4.8%) |
| 75 to 79 Years | 43,755 (2.9%) | 53,976 (3.5%) |
| 80 to 84 Years | 25,188 (1.7%) | 35,425 (2.3%) |
| 85 Years and over | 20,017 (1.3%) | 37,073 (2.4%) |
| Total | 1,491,622 (100.0%) | 1,527,047 (100.0%) |
Families and Households in Arkansas
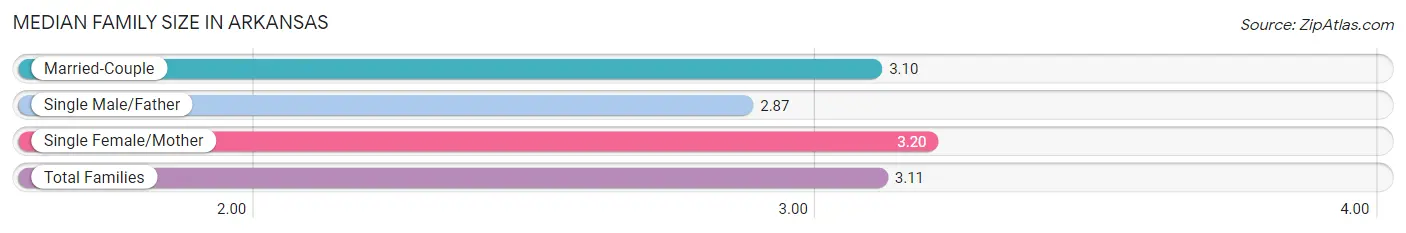
Median Family Size in Arkansas
The median family size in Arkansas is 3.11 persons per family, with single female/mother families (151,520 | 19.9%) accounting for the largest median family size of 3.2 persons per family. On the other hand, single male/father families (54,958 | 7.2%) represent the smallest median family size with 2.87 persons per family.
| Family Type | # Families | Family Size |
| Married-Couple | 556,967 (73.0%) | 3.10 |
| Single Male/Father | 54,958 (7.2%) | 2.87 |
| Single Female/Mother | 151,520 (19.9%) | 3.20 |
| Total Families | 763,445 (100.0%) | 3.11 |
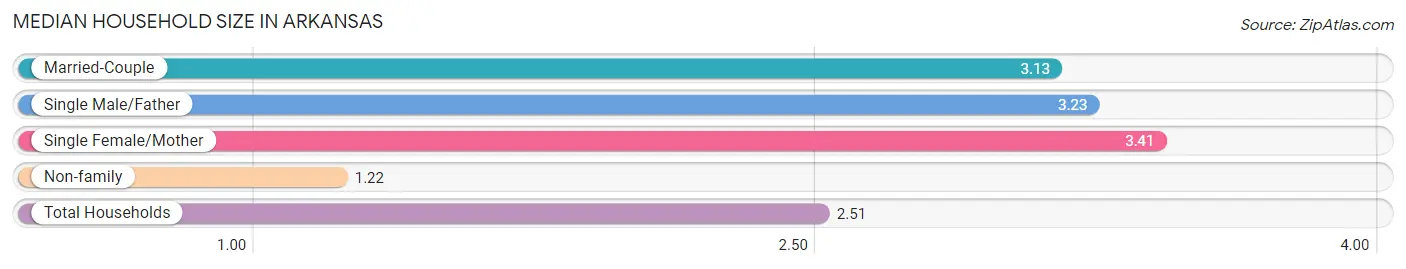
Median Household Size in Arkansas
The median household size in Arkansas is 2.51 persons per household, with single female/mother households (151,520 | 12.9%) accounting for the largest median household size of 3.41 persons per household. non-family households (408,249 | 34.8%) represent the smallest median household size with 1.22 persons per household.
| Household Type | # Households | Household Size |
| Married-Couple | 556,967 (47.5%) | 3.13 |
| Single Male/Father | 54,958 (4.7%) | 3.23 |
| Single Female/Mother | 151,520 (12.9%) | 3.41 |
| Non-family | 408,249 (34.8%) | 1.22 |
| Total Households | 1,171,694 (100.0%) | 2.51 |
Household Size by Marriage Status in Arkansas
Out of a total of 1,171,694 households in Arkansas, 763,445 (65.2%) are family households, while 408,249 (34.8%) are nonfamily households. The most numerous type of family households are 2-person households, comprising 355,419, and the most common type of nonfamily households are 1-person households, comprising 342,476.
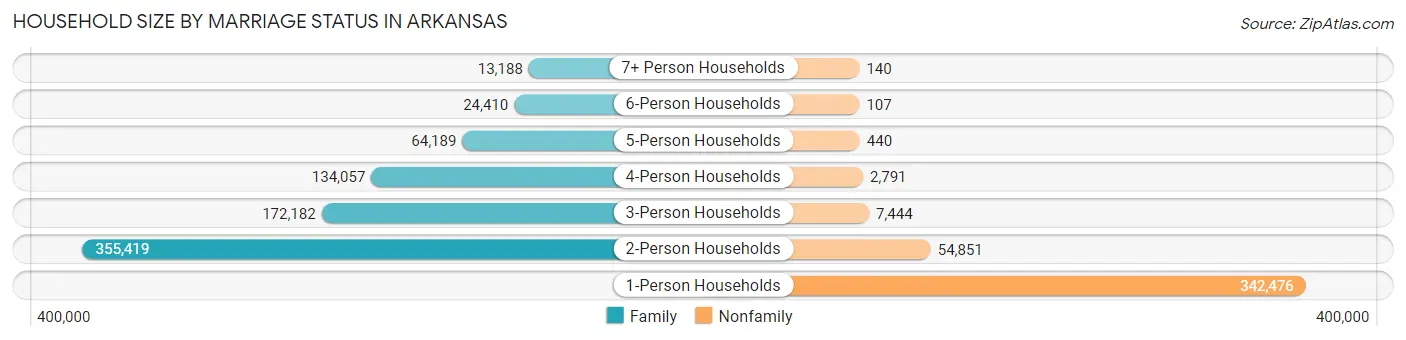
| Household Size | Family Households | Nonfamily Households |
| 1-Person Households | - | 342,476 (29.2%) |
| 2-Person Households | 355,419 (30.3%) | 54,851 (4.7%) |
| 3-Person Households | 172,182 (14.7%) | 7,444 (0.6%) |
| 4-Person Households | 134,057 (11.4%) | 2,791 (0.2%) |
| 5-Person Households | 64,189 (5.5%) | 440 (0.0%) |
| 6-Person Households | 24,410 (2.1%) | 107 (0.0%) |
| 7+ Person Households | 13,188 (1.1%) | 140 (0.0%) |
| Total | 763,445 (65.2%) | 408,249 (34.8%) |
Female Fertility in Arkansas
Fertility by Age in Arkansas
Average fertility rate in Arkansas is 54.0 births per 1,000 women. Women in the age bracket of 20 to 34 years have the highest fertility rate with 102.0 births per 1,000 women. Women in the age bracket of 20 to 34 years acount for 80.6% of all women with births.
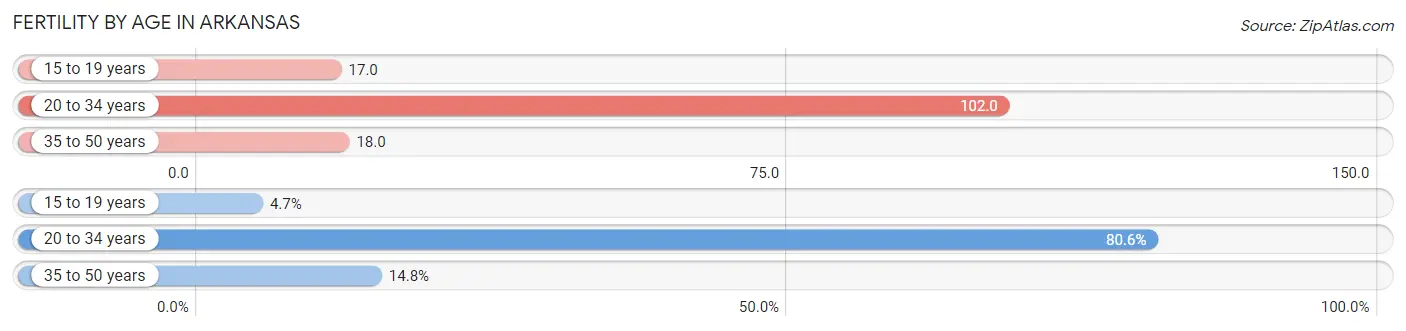
| Age Bracket | Women with Births | Births / 1,000 Women |
| 15 to 19 years | 1,737 (4.7%) | 17.0 |
| 20 to 34 years | 30,022 (80.6%) | 102.0 |
| 35 to 50 years | 5,496 (14.7%) | 18.0 |
| Total | 37,255 (100.0%) | 54.0 |
Fertility by Age by Marriage Status in Arkansas
61.6% of women with births (37,255) in Arkansas are married. The highest percentage of unmarried women with births falls into 15 to 19 years age bracket with 80.3% of them unmarried at the time of birth, while the lowest percentage of unmarried women with births belong to 35 to 50 years age bracket with 25.7% of them unmarried.
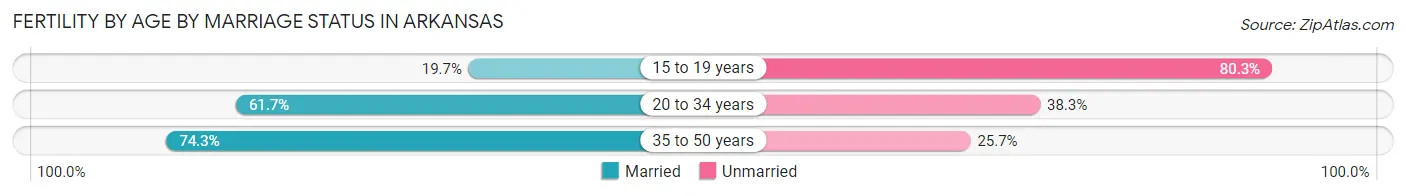
| Age Bracket | Married | Unmarried |
| 15 to 19 years | 342 (19.7%) | 1,395 (80.3%) |
| 20 to 34 years | 18,524 (61.7%) | 11,498 (38.3%) |
| 35 to 50 years | 4,084 (74.3%) | 1,412 (25.7%) |
| Total | 22,949 (61.6%) | 14,306 (38.4%) |
Fertility by Education in Arkansas
Average fertility rate in Arkansas is 54.0 births per 1,000 women. Women with the education attainment of high school diploma have the highest fertility rate of 67.0 births per 1,000 women, while women with the education attainment of less than high school have the lowest fertility at 34.0 births per 1,000 women. Women with the education attainment of college or associate's degree represent 33.6% of all women with births.
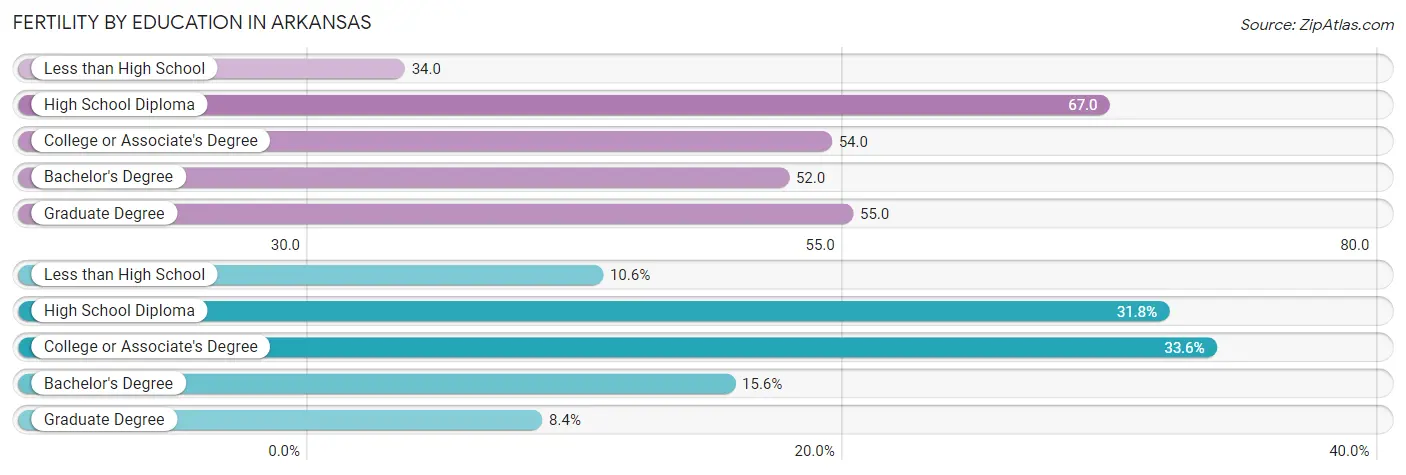
| Educational Attainment | Women with Births | Births / 1,000 Women |
| Less than High School | 3,960 (10.6%) | 34.0 |
| High School Diploma | 11,860 (31.8%) | 67.0 |
| College or Associate's Degree | 12,523 (33.6%) | 54.0 |
| Bachelor's Degree | 5,803 (15.6%) | 52.0 |
| Graduate Degree | 3,109 (8.4%) | 55.0 |
| Total | 37,255 (100.0%) | 54.0 |
Fertility by Education by Marriage Status in Arkansas
38.4% of women with births in Arkansas are unmarried. Women with the educational attainment of graduate degree are most likely to be married with 94.2% of them married at childbirth, while women with the educational attainment of high school diploma are least likely to be married with 53.0% of them unmarried at childbirth.
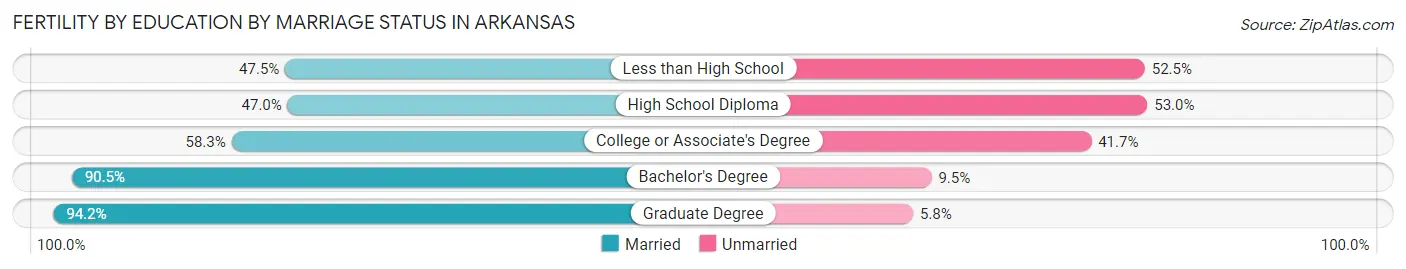
| Educational Attainment | Married | Unmarried |
| Less than High School | 1,881 (47.5%) | 2,079 (52.5%) |
| High School Diploma | 5,574 (47.0%) | 6,286 (53.0%) |
| College or Associate's Degree | 7,301 (58.3%) | 5,222 (41.7%) |
| Bachelor's Degree | 5,252 (90.5%) | 551 (9.5%) |
| Graduate Degree | 2,929 (94.2%) | 180 (5.8%) |
| Total | 22,949 (61.6%) | 14,306 (38.4%) |
Employment Characteristics in Arkansas
Employment by Class of Employer in Arkansas
Among the 1,304,084 employed individuals in Arkansas, private company employees (870,565 | 66.8%), not-for-profit organizations (98,586 | 7.6%), and state government employees (86,205 | 6.6%) make up the most common classes of employment.
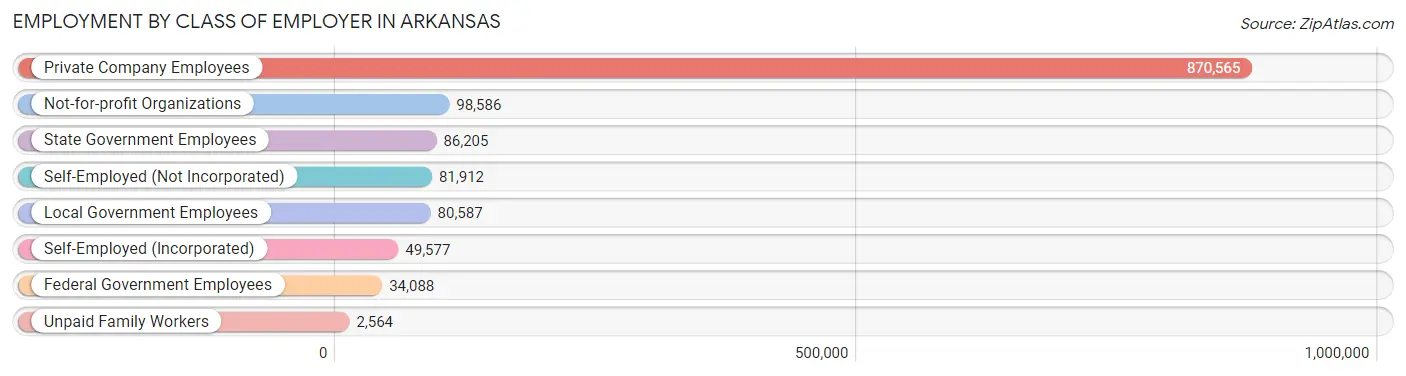
| Employer Class | # Employees | % Employees |
| Private Company Employees | 870,565 | 66.8% |
| Self-Employed (Incorporated) | 49,577 | 3.8% |
| Self-Employed (Not Incorporated) | 81,912 | 6.3% |
| Not-for-profit Organizations | 98,586 | 7.6% |
| Local Government Employees | 80,587 | 6.2% |
| State Government Employees | 86,205 | 6.6% |
| Federal Government Employees | 34,088 | 2.6% |
| Unpaid Family Workers | 2,564 | 0.2% |
| Total | 1,304,084 | 100.0% |
Employment Status by Age in Arkansas
According to the labor force statistics for Arkansas, out of the total population over 16 years of age (2,402,462), 58.2% or 1,398,233 individuals are in the labor force, with 5.1% or 71,310 of them unemployed. The age group with the highest labor force participation rate is 25 to 29 years, with 80.3% or 157,049 individuals in the labor force. Within the labor force, the 16 to 19 years age range has the highest percentage of unemployed individuals, with 16.5% or 9,606 of them being unemployed.
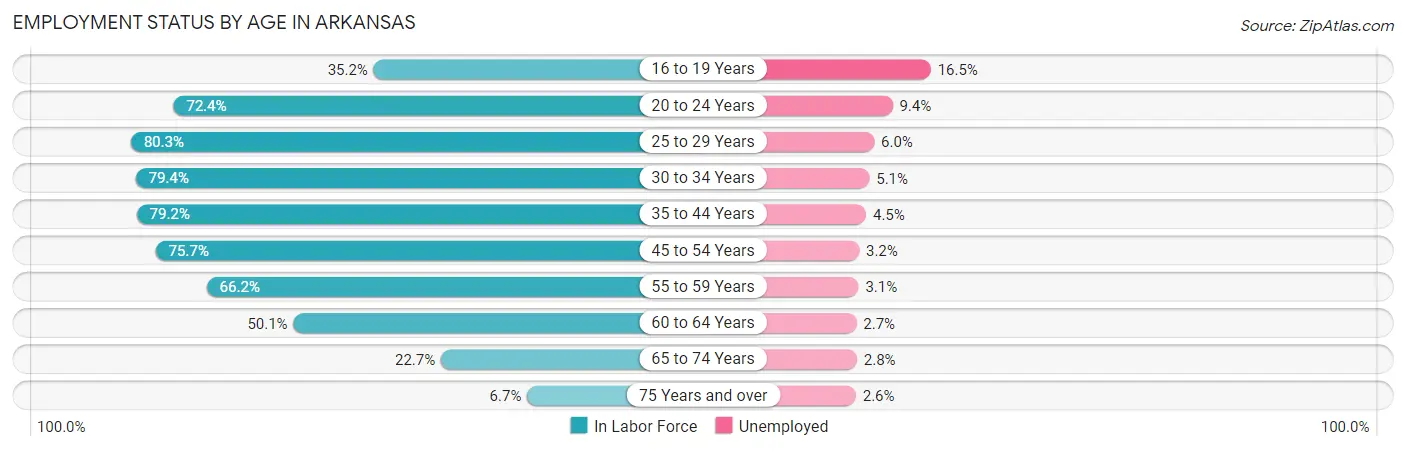
| Age Bracket | In Labor Force | Unemployed |
| 16 to 19 Years | 58,220 (35.2%) | 9,606 (16.5%) |
| 20 to 24 Years | 148,578 (72.4%) | 13,966 (9.4%) |
| 25 to 29 Years | 157,049 (80.3%) | 9,423 (6.0%) |
| 30 to 34 Years | 154,037 (79.4%) | 7,856 (5.1%) |
| 35 to 44 Years | 299,649 (79.2%) | 13,484 (4.5%) |
| 45 to 54 Years | 272,759 (75.7%) | 8,728 (3.2%) |
| 55 to 59 Years | 128,193 (66.2%) | 3,974 (3.1%) |
| 60 to 64 Years | 95,455 (50.1%) | 2,577 (2.7%) |
| 65 to 74 Years | 69,008 (22.7%) | 1,932 (2.8%) |
| 75 Years and over | 14,434 (6.7%) | 375 (2.6%) |
| Total | 1,398,233 (58.2%) | 71,310 (5.1%) |
Employment Status by Educational Attainment in Arkansas
According to labor force statistics for Arkansas, 73.2% of individuals (1,107,086) out of the total population between 25 and 64 years of age (1,512,413) are in the labor force, with 4.2% or 46,498 of them being unemployed. The group with the highest labor force participation rate are those with the educational attainment of bachelor's degree or higher, with 85.7% or 331,771 individuals in the labor force. Within the labor force, individuals with less than high school education have the highest percentage of unemployment, with 8.0% or 7,051 of them being unemployed.
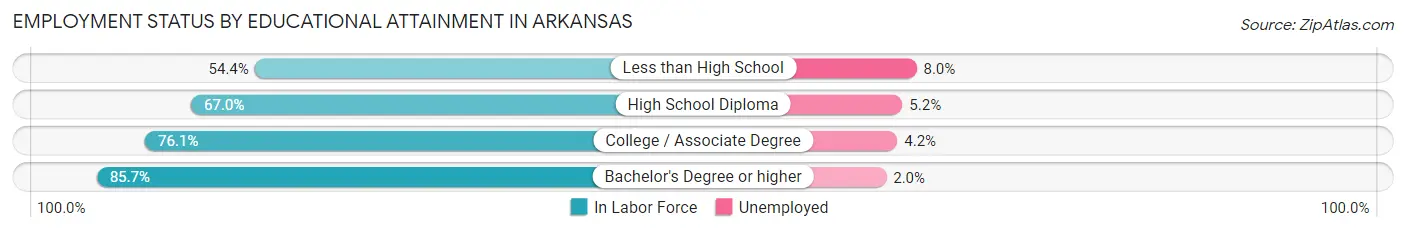
| Educational Attainment | In Labor Force | Unemployed |
| Less than High School | 88,137 (54.4%) | 12,961 (8.0%) |
| High School Diploma | 336,317 (67.0%) | 26,102 (5.2%) |
| College / Associate Degree | 351,049 (76.1%) | 19,375 (4.2%) |
| Bachelor's Degree or higher | 331,771 (85.7%) | 7,743 (2.0%) |
| Total | 1,107,086 (73.2%) | 63,521 (4.2%) |
Employment Occupations by Sex in Arkansas
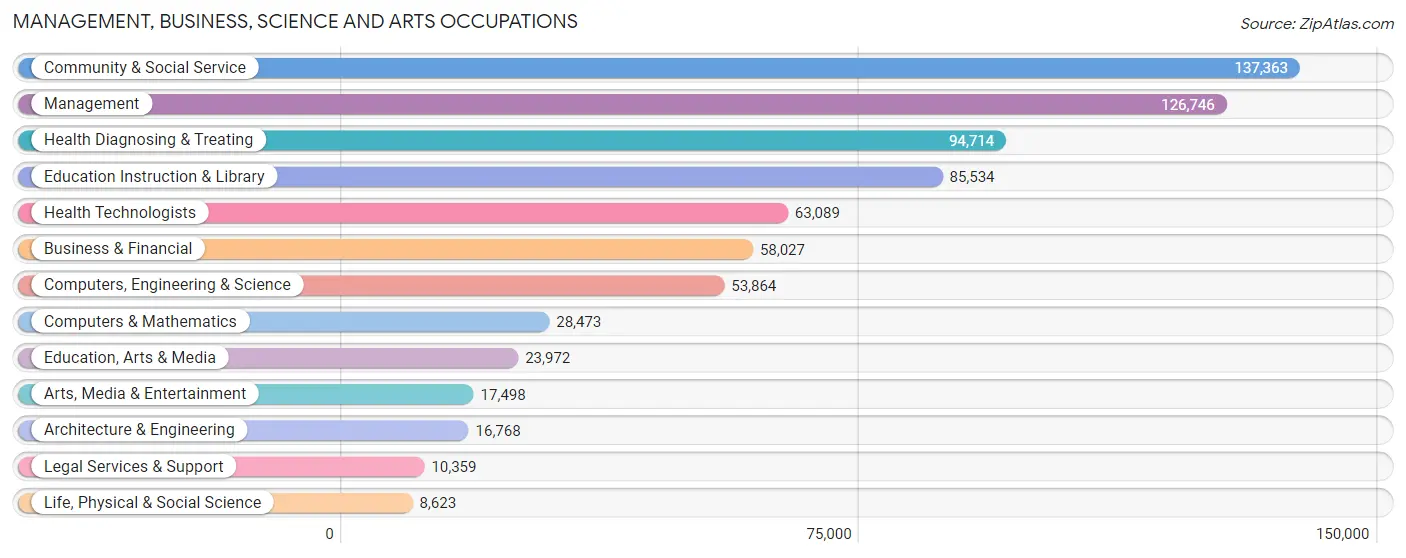
Management, Business, Science and Arts Occupations
The most common Management, Business, Science and Arts occupations in Arkansas are Community & Social Service (137,363 | 10.4%), Management (126,746 | 9.6%), Health Diagnosing & Treating (94,714 | 7.2%), Education Instruction & Library (85,534 | 6.5%), and Health Technologists (63,089 | 4.8%).
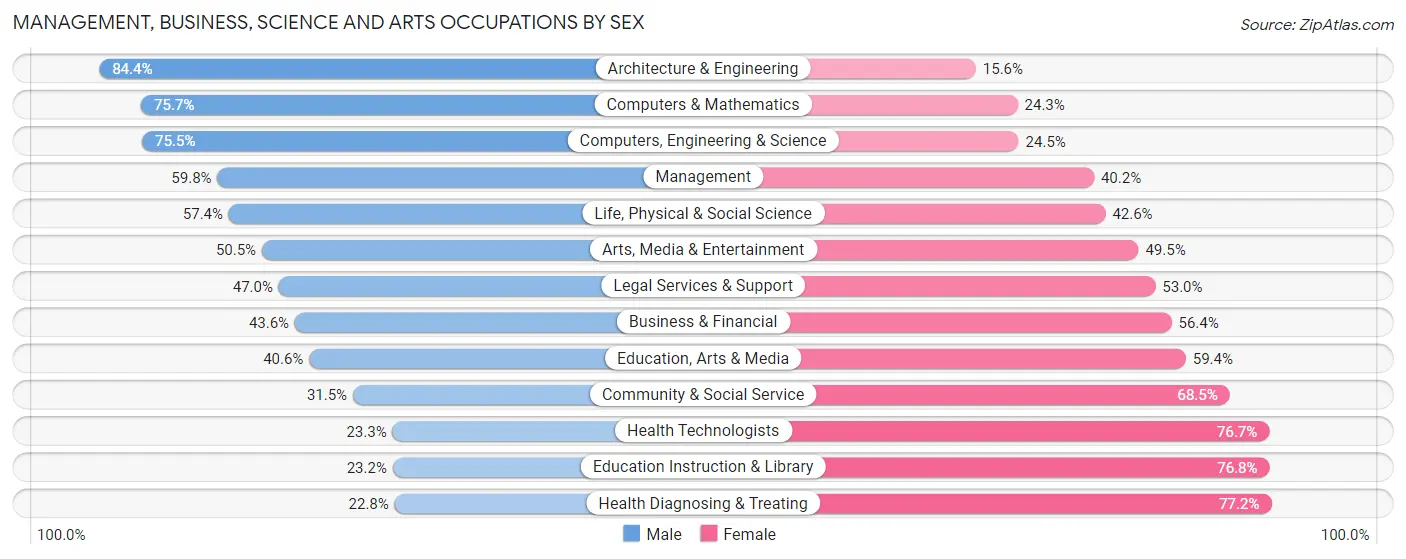
Management, Business, Science and Arts Occupations by Sex
Within the Management, Business, Science and Arts occupations in Arkansas, the most male-oriented occupations are Architecture & Engineering (84.4%), Computers & Mathematics (75.7%), and Computers, Engineering & Science (75.5%), while the most female-oriented occupations are Health Diagnosing & Treating (77.2%), Education Instruction & Library (76.8%), and Health Technologists (76.7%).
| Occupation | Male | Female |
| Management | 75,766 (59.8%) | 50,980 (40.2%) |
| Business & Financial | 25,299 (43.6%) | 32,728 (56.4%) |
| Computers, Engineering & Science | 40,662 (75.5%) | 13,202 (24.5%) |
| Computers & Mathematics | 21,558 (75.7%) | 6,915 (24.3%) |
| Architecture & Engineering | 14,155 (84.4%) | 2,613 (15.6%) |
| Life, Physical & Social Science | 4,949 (57.4%) | 3,674 (42.6%) |
| Community & Social Service | 43,284 (31.5%) | 94,079 (68.5%) |
| Education, Arts & Media | 9,740 (40.6%) | 14,232 (59.4%) |
| Legal Services & Support | 4,866 (47.0%) | 5,493 (53.0%) |
| Education Instruction & Library | 19,844 (23.2%) | 65,690 (76.8%) |
| Arts, Media & Entertainment | 8,834 (50.5%) | 8,664 (49.5%) |
| Health Diagnosing & Treating | 21,600 (22.8%) | 73,114 (77.2%) |
| Health Technologists | 14,672 (23.3%) | 48,417 (76.7%) |
| Total (Category) | 206,611 (43.9%) | 264,103 (56.1%) |
| Total (Overall) | 693,185 (52.5%) | 626,298 (47.5%) |
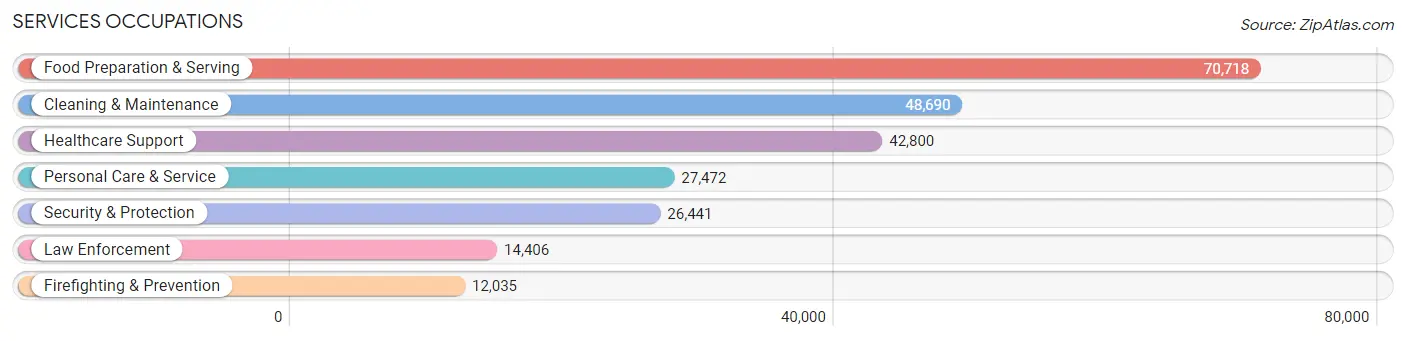
Services Occupations
The most common Services occupations in Arkansas are Food Preparation & Serving (70,718 | 5.4%), Cleaning & Maintenance (48,690 | 3.7%), Healthcare Support (42,800 | 3.2%), Personal Care & Service (27,472 | 2.1%), and Security & Protection (26,441 | 2.0%).
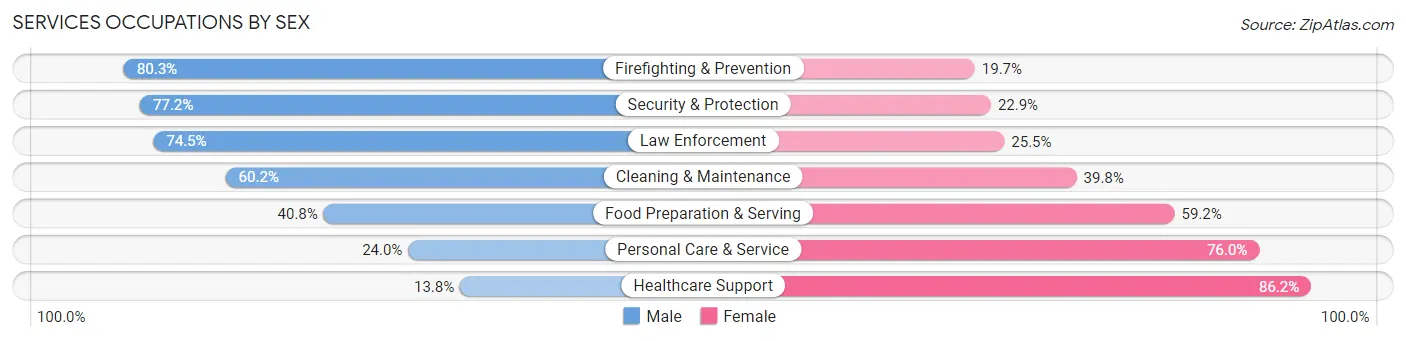
Services Occupations by Sex
Within the Services occupations in Arkansas, the most male-oriented occupations are Firefighting & Prevention (80.3%), Security & Protection (77.1%), and Law Enforcement (74.5%), while the most female-oriented occupations are Healthcare Support (86.2%), Personal Care & Service (76.0%), and Food Preparation & Serving (59.2%).
| Occupation | Male | Female |
| Healthcare Support | 5,893 (13.8%) | 36,907 (86.2%) |
| Security & Protection | 20,399 (77.1%) | 6,042 (22.9%) |
| Firefighting & Prevention | 9,668 (80.3%) | 2,367 (19.7%) |
| Law Enforcement | 10,731 (74.5%) | 3,675 (25.5%) |
| Food Preparation & Serving | 28,845 (40.8%) | 41,873 (59.2%) |
| Cleaning & Maintenance | 29,304 (60.2%) | 19,386 (39.8%) |
| Personal Care & Service | 6,603 (24.0%) | 20,869 (76.0%) |
| Total (Category) | 91,044 (42.1%) | 125,077 (57.9%) |
| Total (Overall) | 693,185 (52.5%) | 626,298 (47.5%) |
Sales and Office Occupations
The most common Sales and Office occupations in Arkansas are Office & Administration (142,340 | 10.8%), and Sales & Related (129,579 | 9.8%).
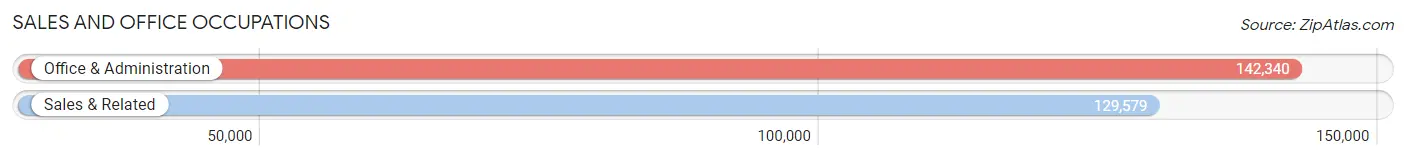
Sales and Office Occupations by Sex
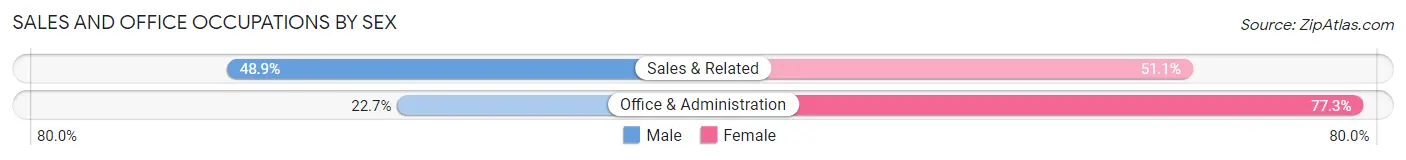
| Occupation | Male | Female |
| Sales & Related | 63,350 (48.9%) | 66,229 (51.1%) |
| Office & Administration | 32,250 (22.7%) | 110,090 (77.3%) |
| Total (Category) | 95,600 (35.2%) | 176,319 (64.8%) |
| Total (Overall) | 693,185 (52.5%) | 626,298 (47.5%) |
Natural Resources, Construction and Maintenance Occupations
The most common Natural Resources, Construction and Maintenance occupations in Arkansas are Construction & Extraction (70,910 | 5.4%), Installation, Maintenance & Repair (50,099 | 3.8%), and Farming, Fishing & Forestry (12,637 | 1.0%).
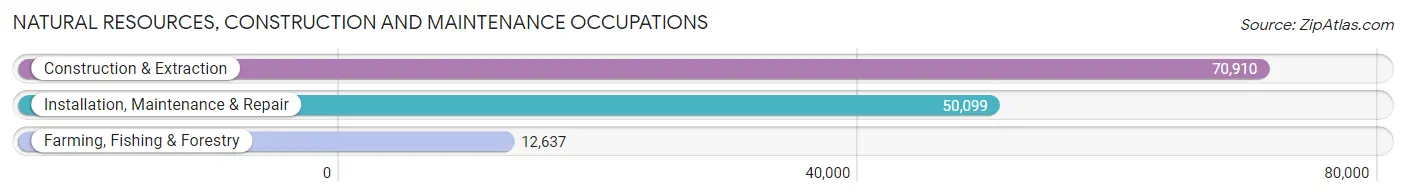
Natural Resources, Construction and Maintenance Occupations by Sex
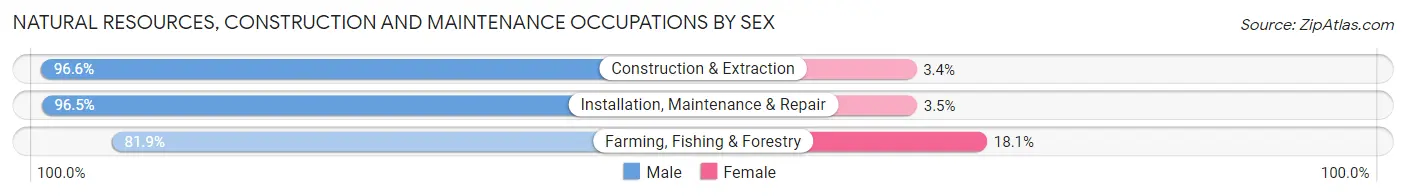
| Occupation | Male | Female |
| Farming, Fishing & Forestry | 10,351 (81.9%) | 2,286 (18.1%) |
| Construction & Extraction | 68,508 (96.6%) | 2,402 (3.4%) |
| Installation, Maintenance & Repair | 48,342 (96.5%) | 1,757 (3.5%) |
| Total (Category) | 127,201 (95.2%) | 6,445 (4.8%) |
| Total (Overall) | 693,185 (52.5%) | 626,298 (47.5%) |
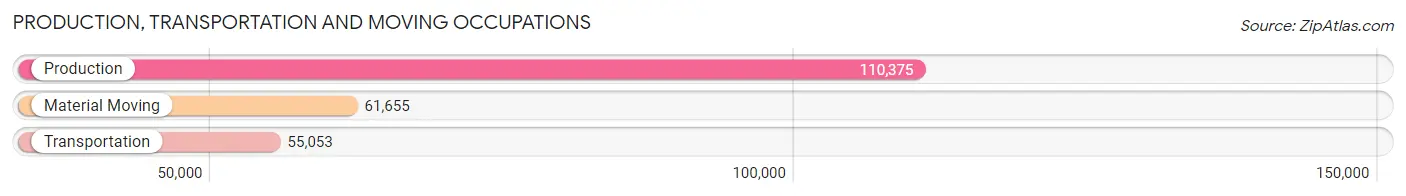
Production, Transportation and Moving Occupations
The most common Production, Transportation and Moving occupations in Arkansas are Production (110,375 | 8.4%), Material Moving (61,655 | 4.7%), and Transportation (55,053 | 4.2%).
Production, Transportation and Moving Occupations by Sex
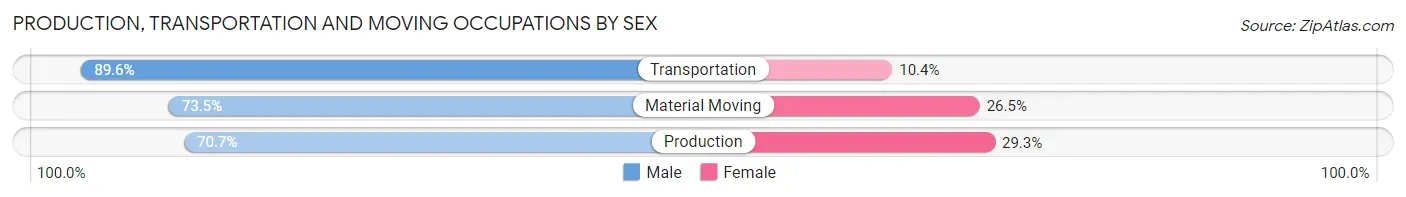
| Occupation | Male | Female |
| Production | 78,064 (70.7%) | 32,311 (29.3%) |
| Transportation | 49,324 (89.6%) | 5,729 (10.4%) |
| Material Moving | 45,341 (73.5%) | 16,314 (26.5%) |
| Total (Category) | 172,729 (76.1%) | 54,354 (23.9%) |
| Total (Overall) | 693,185 (52.5%) | 626,298 (47.5%) |
Employment Industries by Sex in Arkansas
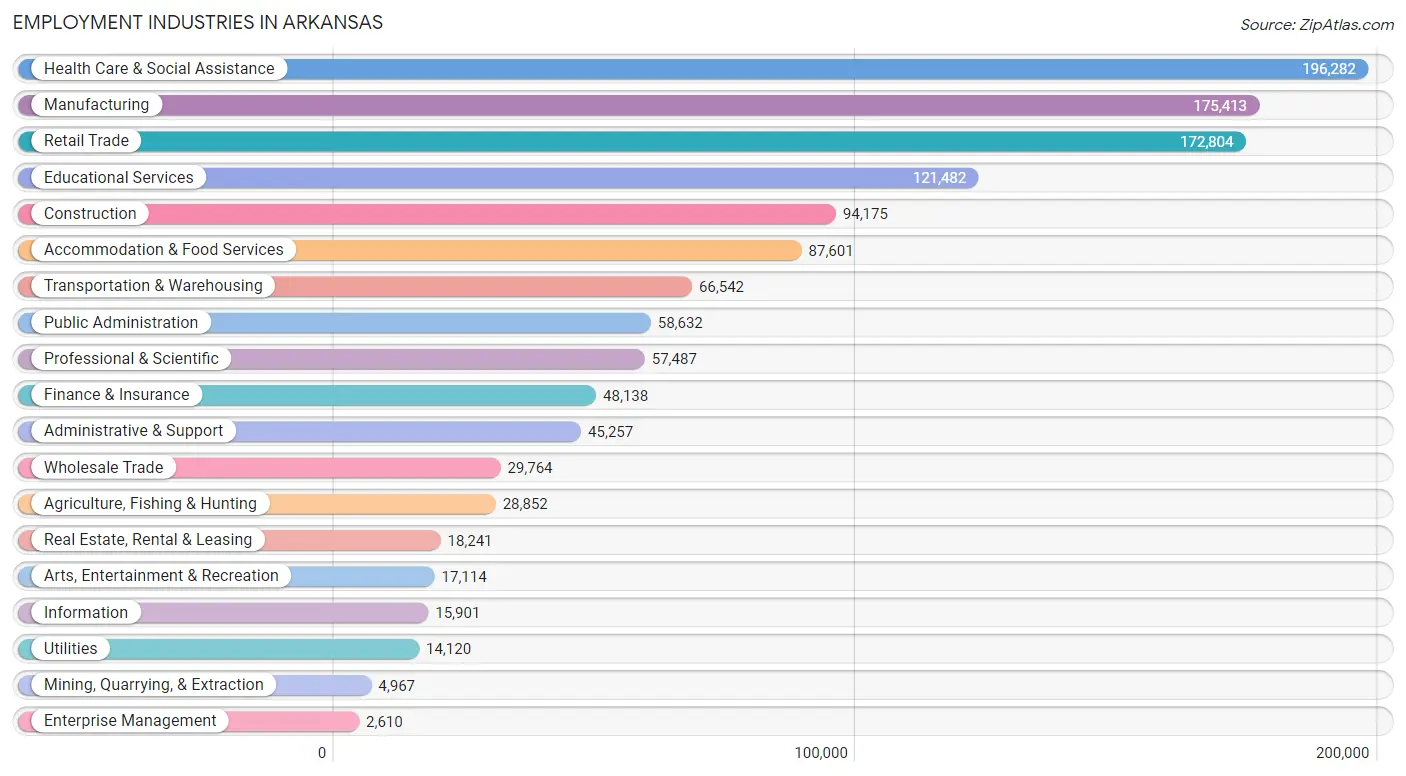
Employment Industries in Arkansas
The major employment industries in Arkansas include Health Care & Social Assistance (196,282 | 14.9%), Manufacturing (175,413 | 13.3%), Retail Trade (172,804 | 13.1%), Educational Services (121,482 | 9.2%), and Construction (94,175 | 7.1%).
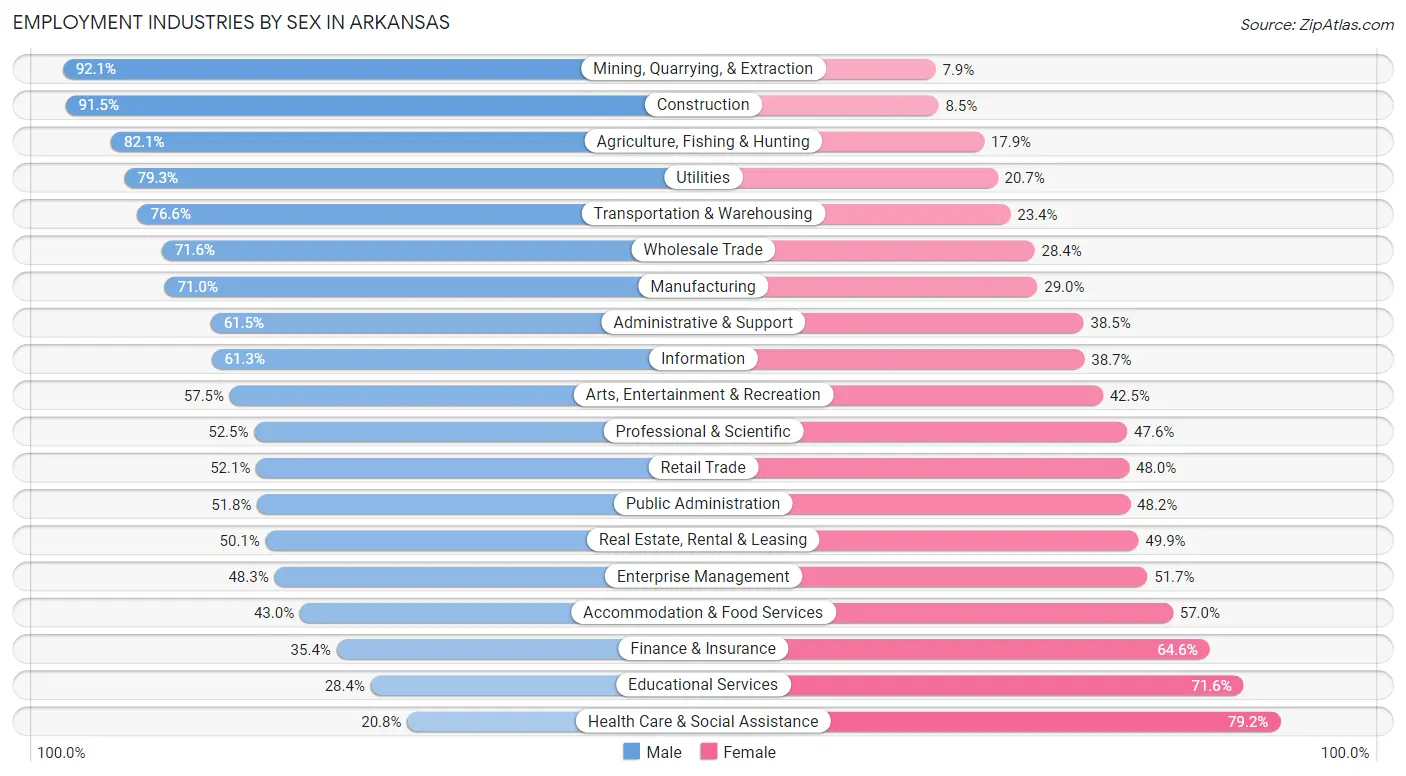
Employment Industries by Sex in Arkansas
The Arkansas industries that see more men than women are Mining, Quarrying, & Extraction (92.1%), Construction (91.5%), and Agriculture, Fishing & Hunting (82.1%), whereas the industries that tend to have a higher number of women are Health Care & Social Assistance (79.2%), Educational Services (71.6%), and Finance & Insurance (64.6%).
| Industry | Male | Female |
| Agriculture, Fishing & Hunting | 23,685 (82.1%) | 5,167 (17.9%) |
| Mining, Quarrying, & Extraction | 4,575 (92.1%) | 392 (7.9%) |
| Construction | 86,175 (91.5%) | 8,000 (8.5%) |
| Manufacturing | 124,613 (71.0%) | 50,800 (29.0%) |
| Wholesale Trade | 21,317 (71.6%) | 8,447 (28.4%) |
| Retail Trade | 89,952 (52.0%) | 82,852 (47.9%) |
| Transportation & Warehousing | 50,985 (76.6%) | 15,557 (23.4%) |
| Utilities | 11,195 (79.3%) | 2,925 (20.7%) |
| Information | 9,749 (61.3%) | 6,152 (38.7%) |
| Finance & Insurance | 17,044 (35.4%) | 31,094 (64.6%) |
| Real Estate, Rental & Leasing | 9,142 (50.1%) | 9,099 (49.9%) |
| Professional & Scientific | 30,153 (52.4%) | 27,334 (47.5%) |
| Enterprise Management | 1,260 (48.3%) | 1,350 (51.7%) |
| Administrative & Support | 27,820 (61.5%) | 17,437 (38.5%) |
| Educational Services | 34,449 (28.4%) | 87,033 (71.6%) |
| Health Care & Social Assistance | 40,808 (20.8%) | 155,474 (79.2%) |
| Arts, Entertainment & Recreation | 9,842 (57.5%) | 7,272 (42.5%) |
| Accommodation & Food Services | 37,668 (43.0%) | 49,933 (57.0%) |
| Public Administration | 30,392 (51.8%) | 28,240 (48.2%) |
| Total | 693,185 (52.5%) | 626,298 (47.5%) |
Education in Arkansas
School Enrollment in Arkansas
The most common levels of schooling among the 713,057 students in Arkansas are middle school (156,210 | 21.9%), high school (155,613 | 21.8%), and elementary school (153,699 | 21.5%).
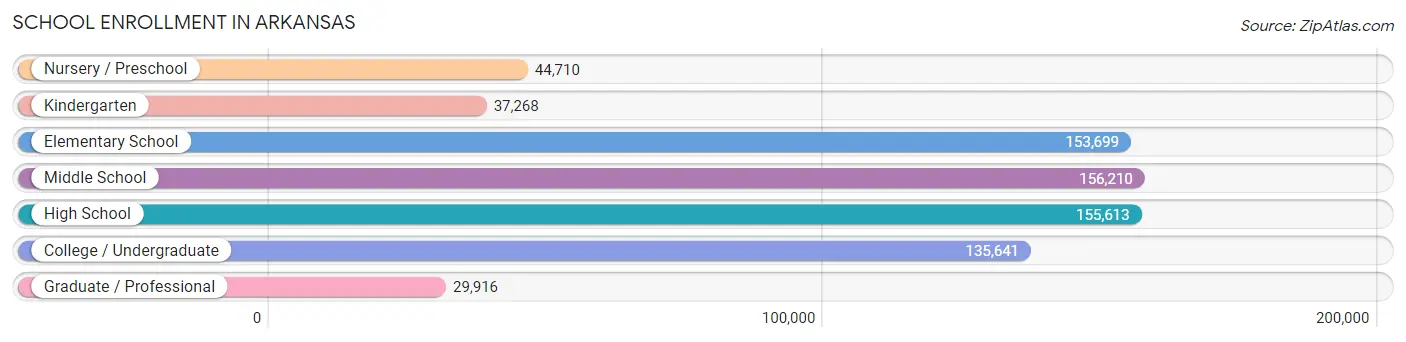
| School Level | # Students | % Students |
| Nursery / Preschool | 44,710 | 6.3% |
| Kindergarten | 37,268 | 5.2% |
| Elementary School | 153,699 | 21.5% |
| Middle School | 156,210 | 21.9% |
| High School | 155,613 | 21.8% |
| College / Undergraduate | 135,641 | 19.0% |
| Graduate / Professional | 29,916 | 4.2% |
| Total | 713,057 | 100.0% |
School Enrollment by Age by Funding Source in Arkansas
Out of a total of 713,057 students who are enrolled in schools in Arkansas, 89,132 (12.5%) attend a private institution, while the remaining 623,925 (87.5%) are enrolled in public schools. The age group of 3 to 4 year olds has the highest likelihood of being enrolled in private schools, with 9,368 (28.7% in the age bracket) enrolled. Conversely, the age group of 15 to 17 year olds has the lowest likelihood of being enrolled in a private school, with 106,286 (91.2% in the age bracket) attending a public institution.
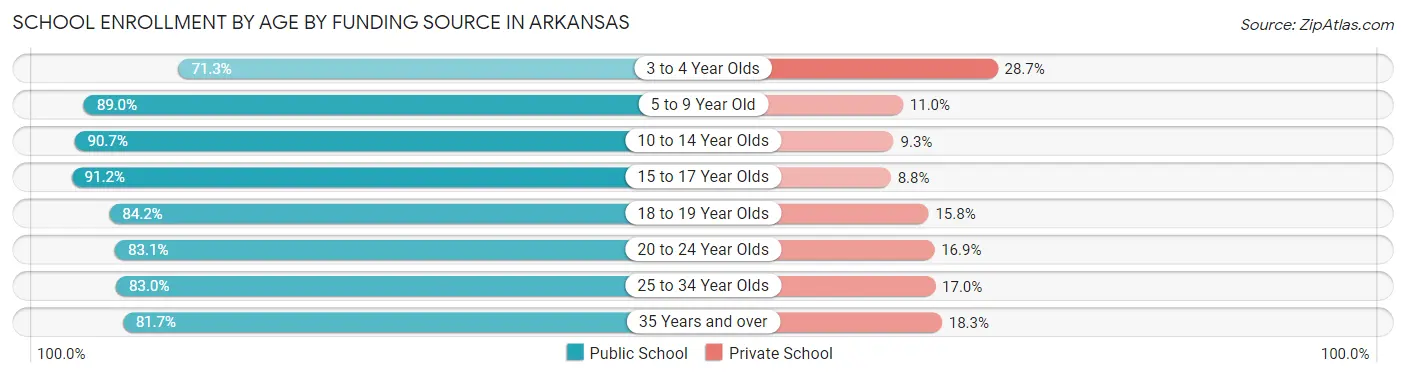
| Age Bracket | Public School | Private School |
| 3 to 4 Year Olds | 23,317 (71.3%) | 9,368 (28.7%) |
| 5 to 9 Year Old | 159,026 (89.0%) | 19,706 (11.0%) |
| 10 to 14 Year Olds | 176,058 (90.7%) | 18,061 (9.3%) |
| 15 to 17 Year Olds | 106,286 (91.2%) | 10,220 (8.8%) |
| 18 to 19 Year Olds | 48,000 (84.2%) | 9,007 (15.8%) |
| 20 to 24 Year Olds | 57,014 (83.1%) | 11,570 (16.9%) |
| 25 to 34 Year Olds | 29,067 (83.0%) | 5,965 (17.0%) |
| 35 Years and over | 24,836 (81.7%) | 5,556 (18.3%) |
| Total | 623,925 (87.5%) | 89,132 (12.5%) |
Educational Attainment by Field of Study in Arkansas
Business (109,099 | 20.3%), education (90,330 | 16.9%), science & technology (64,136 | 12.0%), bio, nature & agricultural (41,559 | 7.7%), and arts & humanities (34,249 | 6.4%) are the most common fields of study among 536,159 individuals in Arkansas who have obtained a bachelor's degree or higher.
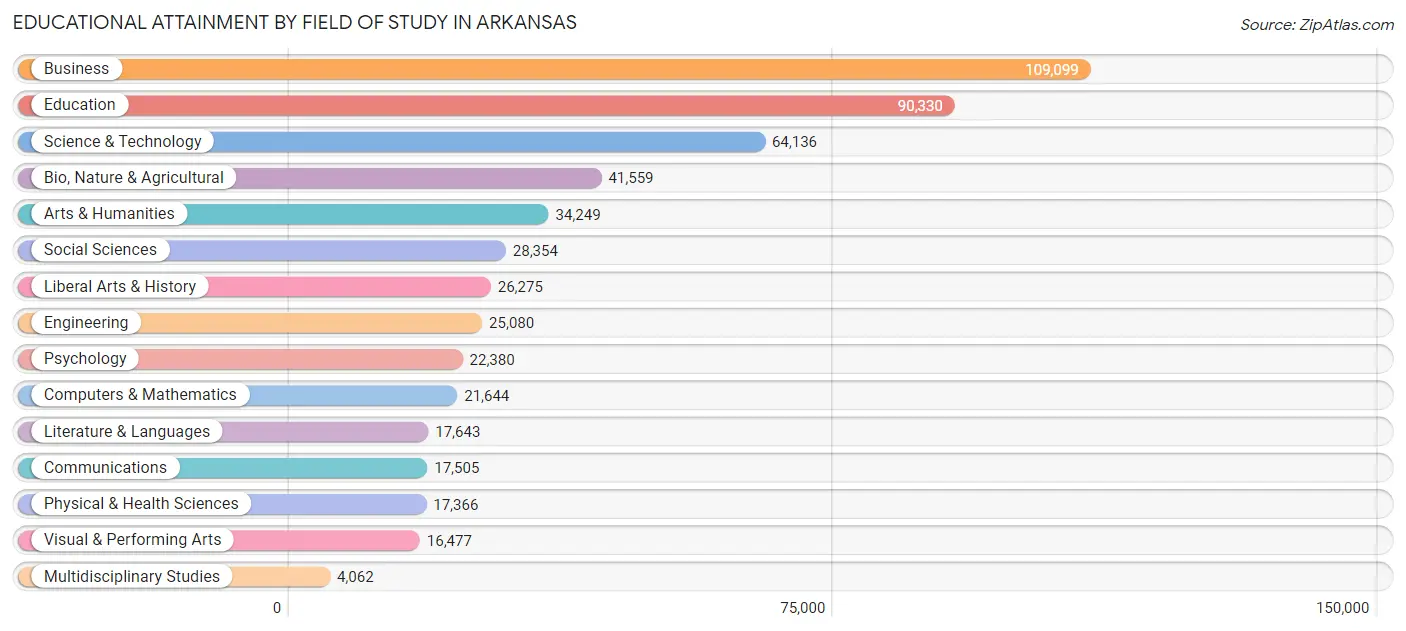
| Field of Study | # Graduates | % Graduates |
| Computers & Mathematics | 21,644 | 4.0% |
| Bio, Nature & Agricultural | 41,559 | 7.7% |
| Physical & Health Sciences | 17,366 | 3.2% |
| Psychology | 22,380 | 4.2% |
| Social Sciences | 28,354 | 5.3% |
| Engineering | 25,080 | 4.7% |
| Multidisciplinary Studies | 4,062 | 0.8% |
| Science & Technology | 64,136 | 12.0% |
| Business | 109,099 | 20.3% |
| Education | 90,330 | 16.9% |
| Literature & Languages | 17,643 | 3.3% |
| Liberal Arts & History | 26,275 | 4.9% |
| Visual & Performing Arts | 16,477 | 3.1% |
| Communications | 17,505 | 3.3% |
| Arts & Humanities | 34,249 | 6.4% |
| Total | 536,159 | 100.0% |
Transportation & Commute in Arkansas
Vehicle Availability by Sex in Arkansas
The most prevalent vehicle ownership categories in Arkansas are males with 2 vehicles (293,787, accounting for 43.0%) and females with 2 vehicles (249,975, making up 48.1%).
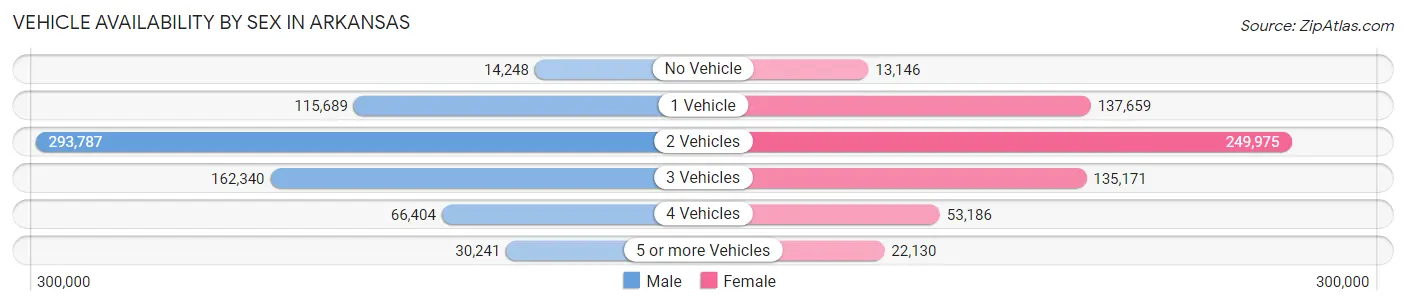
| Vehicles Available | Male | Female |
| No Vehicle | 14,248 (2.1%) | 13,146 (2.1%) |
| 1 Vehicle | 115,689 (17.0%) | 137,659 (22.5%) |
| 2 Vehicles | 293,787 (43.0%) | 249,975 (40.9%) |
| 3 Vehicles | 162,340 (23.8%) | 135,171 (22.1%) |
| 4 Vehicles | 66,404 (9.7%) | 53,186 (8.7%) |
| 5 or more Vehicles | 30,241 (4.4%) | 22,130 (3.6%) |
| Total | 682,709 (100.0%) | 611,267 (100.0%) |
Commute Time in Arkansas
The most frequently occuring commute durations in Arkansas are 15 to 19 minutes (212,178 commuters, 17.4%), 10 to 14 minutes (208,810 commuters, 17.2%), and 20 to 24 minutes (166,379 commuters, 13.7%).
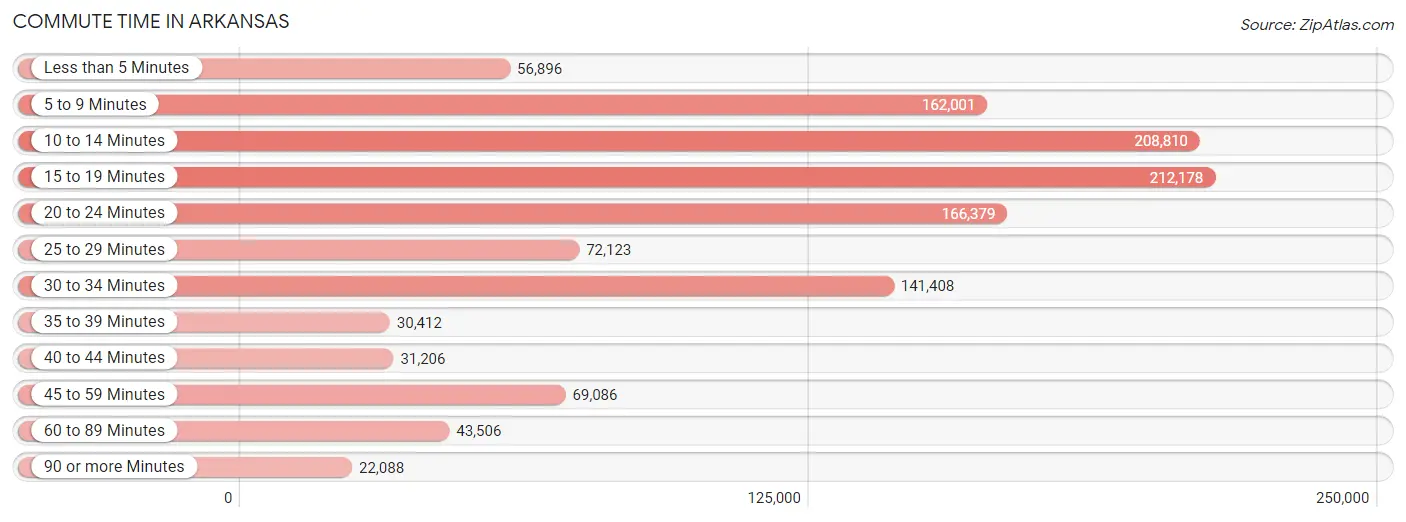
| Commute Time | # Commuters | % Commuters |
| Less than 5 Minutes | 56,896 | 4.7% |
| 5 to 9 Minutes | 162,001 | 13.3% |
| 10 to 14 Minutes | 208,810 | 17.2% |
| 15 to 19 Minutes | 212,178 | 17.4% |
| 20 to 24 Minutes | 166,379 | 13.7% |
| 25 to 29 Minutes | 72,123 | 5.9% |
| 30 to 34 Minutes | 141,408 | 11.6% |
| 35 to 39 Minutes | 30,412 | 2.5% |
| 40 to 44 Minutes | 31,206 | 2.6% |
| 45 to 59 Minutes | 69,086 | 5.7% |
| 60 to 89 Minutes | 43,506 | 3.6% |
| 90 or more Minutes | 22,088 | 1.8% |
Commute Time by Sex in Arkansas
The most common commute times in Arkansas are 15 to 19 minutes (109,261 commuters, 16.9%) for males and 10 to 14 minutes (103,475 commuters, 18.1%) for females.
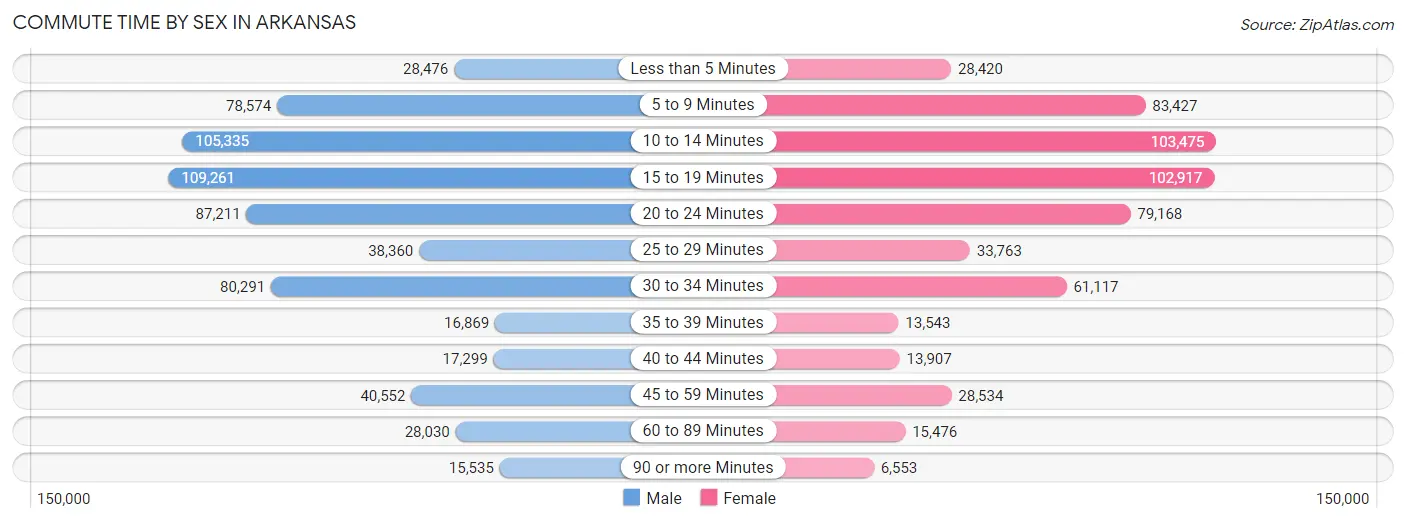
| Commute Time | Male | Female |
| Less than 5 Minutes | 28,476 (4.4%) | 28,420 (5.0%) |
| 5 to 9 Minutes | 78,574 (12.2%) | 83,427 (14.6%) |
| 10 to 14 Minutes | 105,335 (16.3%) | 103,475 (18.1%) |
| 15 to 19 Minutes | 109,261 (16.9%) | 102,917 (18.0%) |
| 20 to 24 Minutes | 87,211 (13.5%) | 79,168 (13.9%) |
| 25 to 29 Minutes | 38,360 (5.9%) | 33,763 (5.9%) |
| 30 to 34 Minutes | 80,291 (12.4%) | 61,117 (10.7%) |
| 35 to 39 Minutes | 16,869 (2.6%) | 13,543 (2.4%) |
| 40 to 44 Minutes | 17,299 (2.7%) | 13,907 (2.4%) |
| 45 to 59 Minutes | 40,552 (6.3%) | 28,534 (5.0%) |
| 60 to 89 Minutes | 28,030 (4.3%) | 15,476 (2.7%) |
| 90 or more Minutes | 15,535 (2.4%) | 6,553 (1.1%) |
Time of Departure to Work by Sex in Arkansas
The most frequent times of departure to work in Arkansas are 7:00 AM to 7:29 AM (100,868, 15.6%) for males and 7:00 AM to 7:29 AM (110,193, 19.3%) for females.
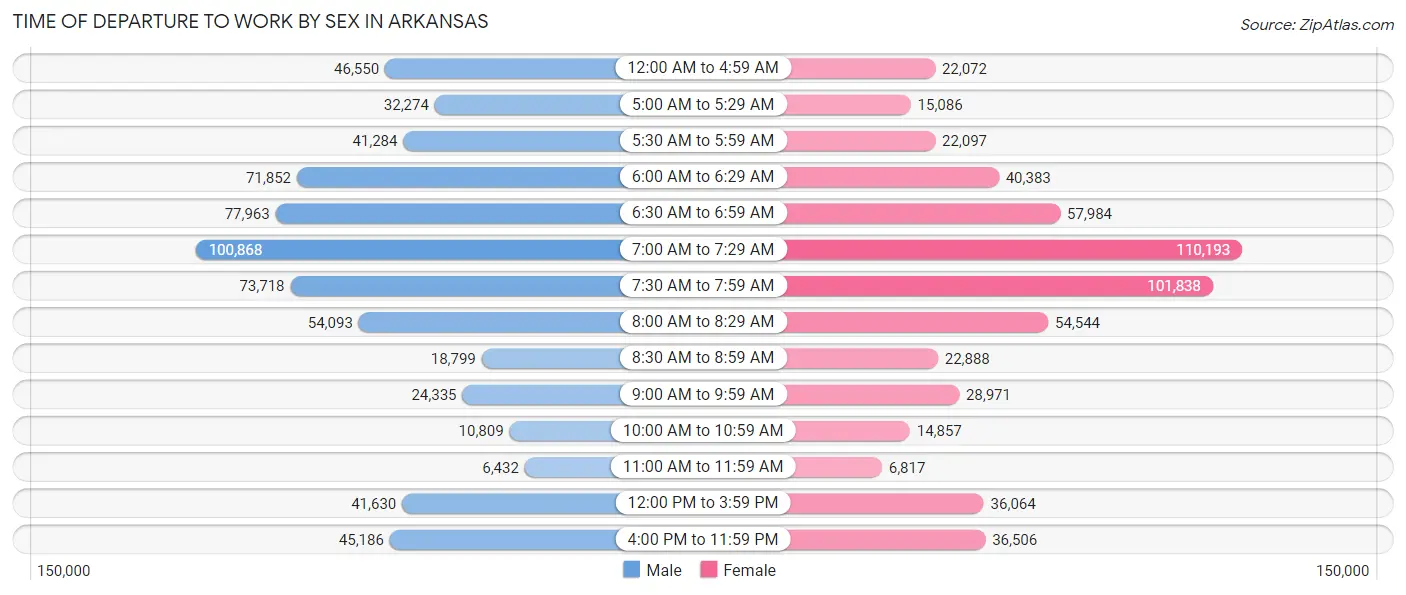
| Time of Departure | Male | Female |
| 12:00 AM to 4:59 AM | 46,550 (7.2%) | 22,072 (3.9%) |
| 5:00 AM to 5:29 AM | 32,274 (5.0%) | 15,086 (2.6%) |
| 5:30 AM to 5:59 AM | 41,284 (6.4%) | 22,097 (3.9%) |
| 6:00 AM to 6:29 AM | 71,852 (11.1%) | 40,383 (7.1%) |
| 6:30 AM to 6:59 AM | 77,963 (12.1%) | 57,984 (10.2%) |
| 7:00 AM to 7:29 AM | 100,868 (15.6%) | 110,193 (19.3%) |
| 7:30 AM to 7:59 AM | 73,718 (11.4%) | 101,838 (17.9%) |
| 8:00 AM to 8:29 AM | 54,093 (8.4%) | 54,544 (9.6%) |
| 8:30 AM to 8:59 AM | 18,799 (2.9%) | 22,888 (4.0%) |
| 9:00 AM to 9:59 AM | 24,335 (3.8%) | 28,971 (5.1%) |
| 10:00 AM to 10:59 AM | 10,809 (1.7%) | 14,857 (2.6%) |
| 11:00 AM to 11:59 AM | 6,432 (1.0%) | 6,817 (1.2%) |
| 12:00 PM to 3:59 PM | 41,630 (6.5%) | 36,064 (6.3%) |
| 4:00 PM to 11:59 PM | 45,186 (7.0%) | 36,506 (6.4%) |
| Total | 645,793 (100.0%) | 570,300 (100.0%) |
Housing Occupancy in Arkansas
Occupancy by Ownership in Arkansas
Of the total 1,171,694 dwellings in Arkansas, owner-occupied units account for 775,956 (66.2%), while renter-occupied units make up 395,738 (33.8%).
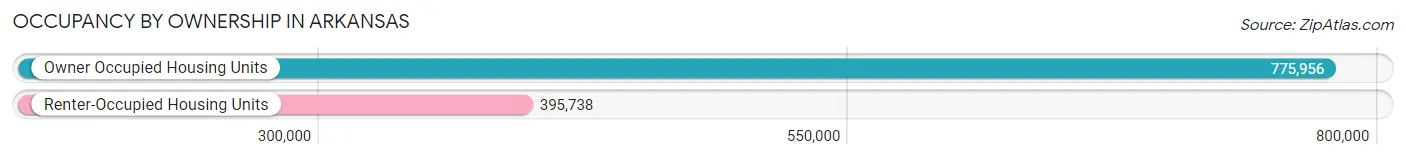
| Occupancy | # Housing Units | % Housing Units |
| Owner Occupied Housing Units | 775,956 | 66.2% |
| Renter-Occupied Housing Units | 395,738 | 33.8% |
| Total Occupied Housing Units | 1,171,694 | 100.0% |
Occupancy by Household Size in Arkansas
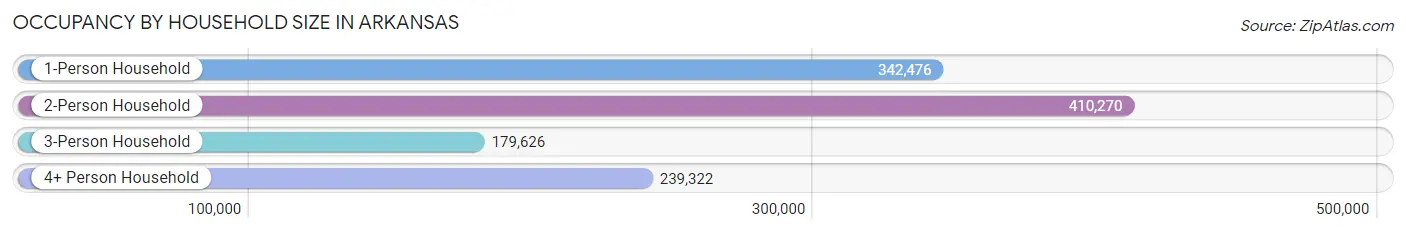
| Household Size | # Housing Units | % Housing Units |
| 1-Person Household | 342,476 | 29.2% |
| 2-Person Household | 410,270 | 35.0% |
| 3-Person Household | 179,626 | 15.3% |
| 4+ Person Household | 239,322 | 20.4% |
| Total Housing Units | 1,171,694 | 100.0% |
Occupancy by Ownership by Household Size in Arkansas
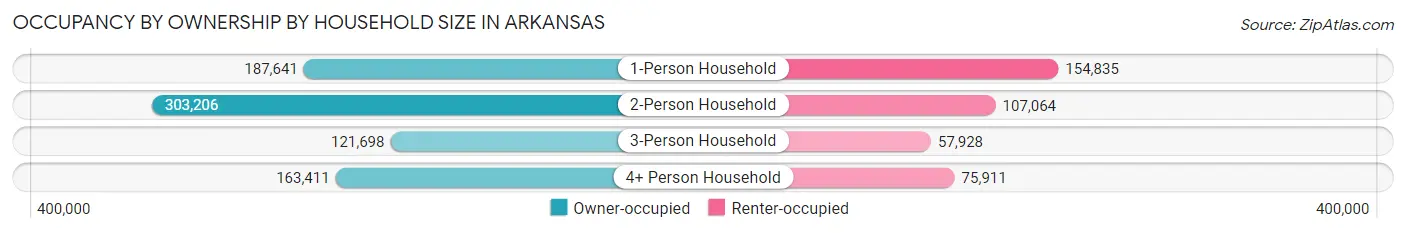
| Household Size | Owner-occupied | Renter-occupied |
| 1-Person Household | 187,641 (54.8%) | 154,835 (45.2%) |
| 2-Person Household | 303,206 (73.9%) | 107,064 (26.1%) |
| 3-Person Household | 121,698 (67.7%) | 57,928 (32.3%) |
| 4+ Person Household | 163,411 (68.3%) | 75,911 (31.7%) |
| Total Housing Units | 775,956 (66.2%) | 395,738 (33.8%) |
Occupancy by Educational Attainment in Arkansas
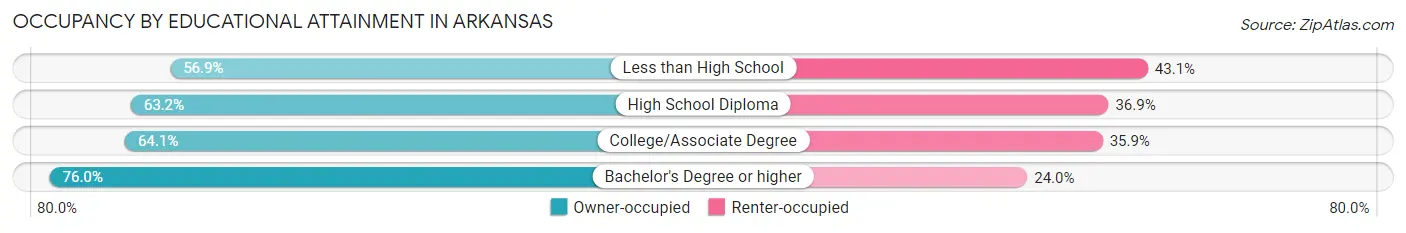
| Household Size | Owner-occupied | Renter-occupied |
| Less than High School | 69,609 (56.9%) | 52,719 (43.1%) |
| High School Diploma | 230,133 (63.1%) | 134,279 (36.8%) |
| College/Associate Degree | 238,530 (64.1%) | 133,792 (35.9%) |
| Bachelor's Degree or higher | 237,684 (76.0%) | 74,948 (24.0%) |
Occupancy by Age of Householder in Arkansas
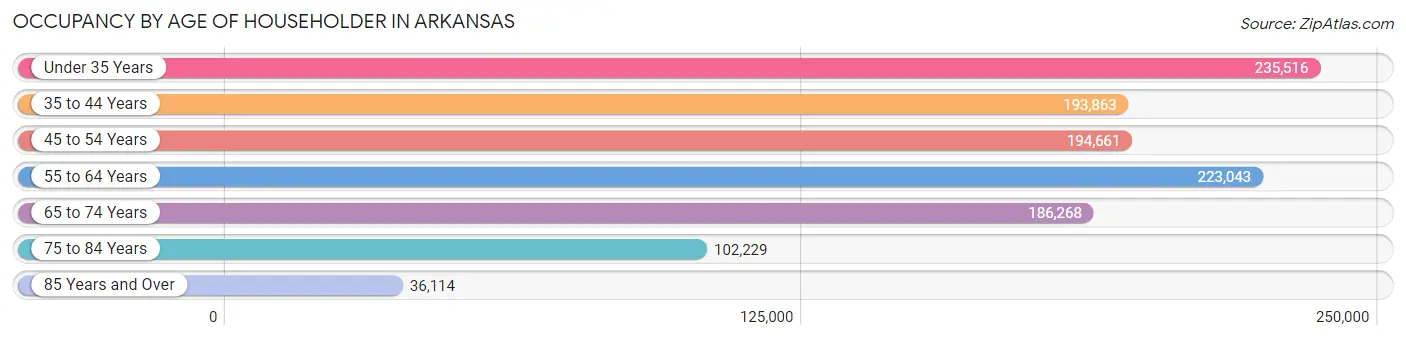
| Age Bracket | # Households | % Households |
| Under 35 Years | 235,516 | 20.1% |
| 35 to 44 Years | 193,863 | 16.6% |
| 45 to 54 Years | 194,661 | 16.6% |
| 55 to 64 Years | 223,043 | 19.0% |
| 65 to 74 Years | 186,268 | 15.9% |
| 75 to 84 Years | 102,229 | 8.7% |
| 85 Years and Over | 36,114 | 3.1% |
| Total | 1,171,694 | 100.0% |
Housing Finances in Arkansas
Median Income by Occupancy in Arkansas
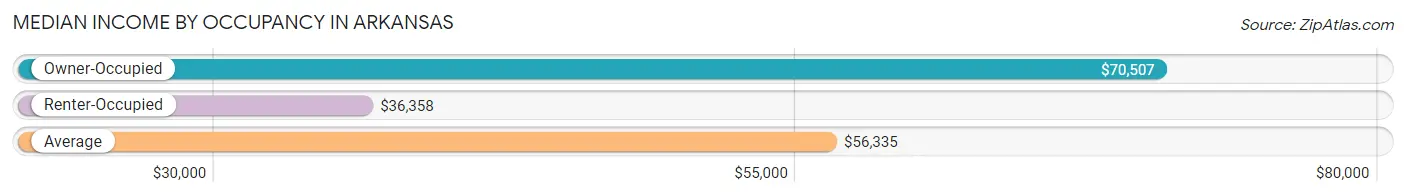
| Occupancy Type | # Households | Median Income |
| Owner-Occupied | 775,956 (66.2%) | $70,507 |
| Renter-Occupied | 395,738 (33.8%) | $36,358 |
| Average | 1,171,694 (100.0%) | $56,335 |
Occupancy by Householder Income Bracket in Arkansas
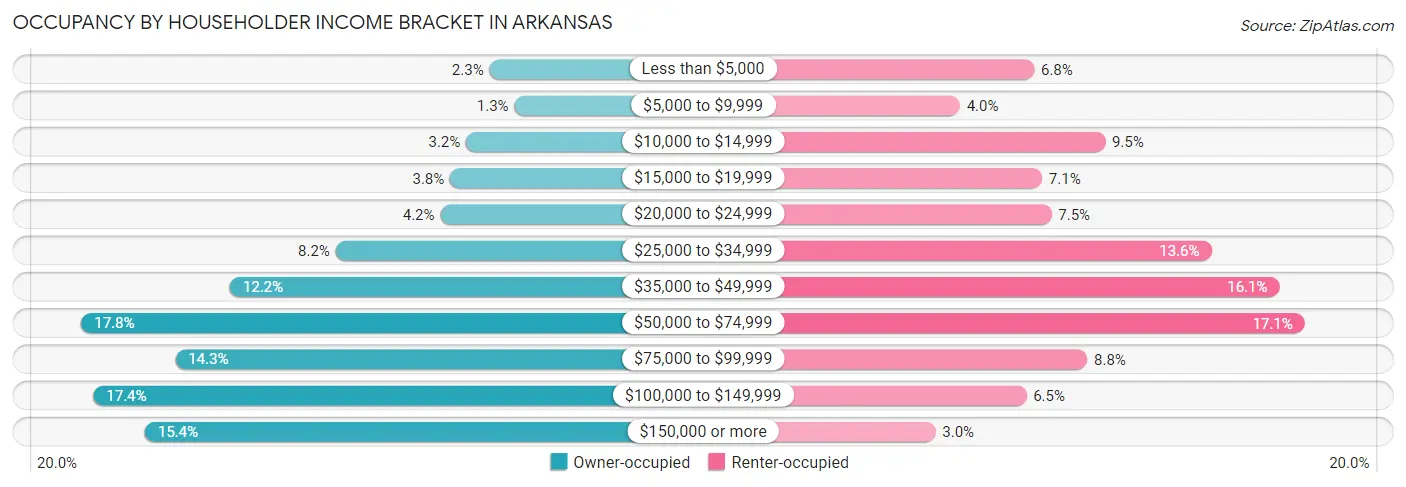
| Income Bracket | Owner-occupied | Renter-occupied |
| Less than $5,000 | 17,731 (2.3%) | 26,917 (6.8%) |
| $5,000 to $9,999 | 10,423 (1.3%) | 15,703 (4.0%) |
| $10,000 to $14,999 | 24,711 (3.2%) | 37,581 (9.5%) |
| $15,000 to $19,999 | 29,416 (3.8%) | 28,108 (7.1%) |
| $20,000 to $24,999 | 32,252 (4.2%) | 29,529 (7.5%) |
| $25,000 to $34,999 | 63,242 (8.2%) | 53,627 (13.6%) |
| $35,000 to $49,999 | 94,530 (12.2%) | 63,888 (16.1%) |
| $50,000 to $74,999 | 138,463 (17.8%) | 67,721 (17.1%) |
| $75,000 to $99,999 | 110,684 (14.3%) | 34,893 (8.8%) |
| $100,000 to $149,999 | 134,846 (17.4%) | 25,741 (6.5%) |
| $150,000 or more | 119,658 (15.4%) | 12,030 (3.0%) |
| Total | 775,956 (100.0%) | 395,738 (100.0%) |
Monthly Housing Cost Tiers in Arkansas
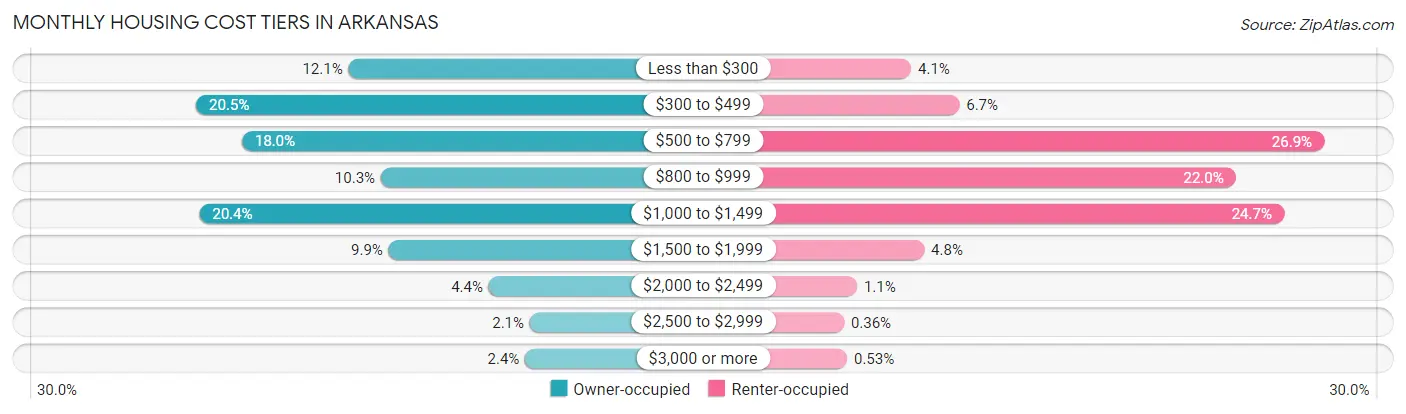
| Monthly Cost | Owner-occupied | Renter-occupied |
| Less than $300 | 93,933 (12.1%) | 16,115 (4.1%) |
| $300 to $499 | 159,288 (20.5%) | 26,640 (6.7%) |
| $500 to $799 | 139,656 (18.0%) | 106,339 (26.9%) |
| $800 to $999 | 80,101 (10.3%) | 87,021 (22.0%) |
| $1,000 to $1,499 | 157,912 (20.3%) | 97,552 (24.6%) |
| $1,500 to $1,999 | 76,768 (9.9%) | 18,952 (4.8%) |
| $2,000 to $2,499 | 33,851 (4.4%) | 4,266 (1.1%) |
| $2,500 to $2,999 | 16,235 (2.1%) | 1,426 (0.4%) |
| $3,000 or more | 18,212 (2.4%) | 2,088 (0.5%) |
| Total | 775,956 (100.0%) | 395,738 (100.0%) |
Physical Housing Characteristics in Arkansas
Housing Structures in Arkansas
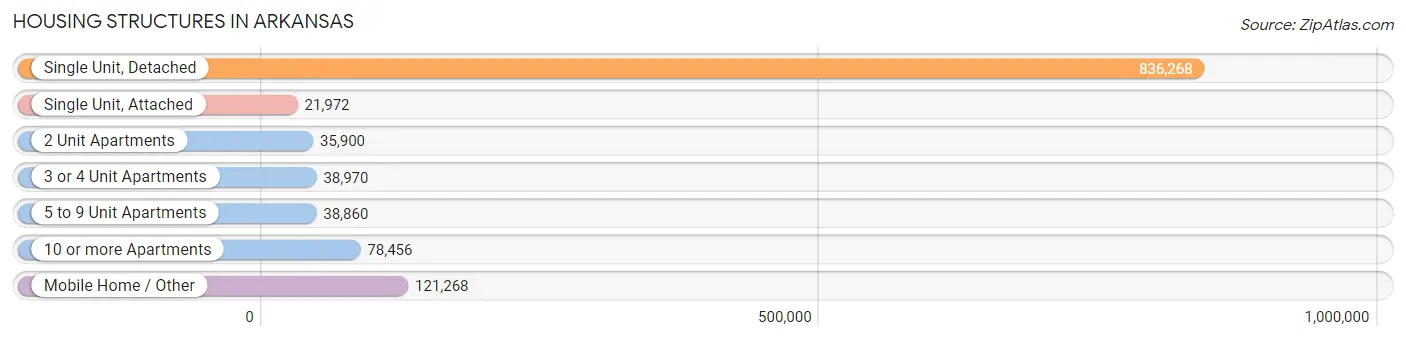
| Structure Type | # Housing Units | % Housing Units |
| Single Unit, Detached | 836,268 | 71.4% |
| Single Unit, Attached | 21,972 | 1.9% |
| 2 Unit Apartments | 35,900 | 3.1% |
| 3 or 4 Unit Apartments | 38,970 | 3.3% |
| 5 to 9 Unit Apartments | 38,860 | 3.3% |
| 10 or more Apartments | 78,456 | 6.7% |
| Mobile Home / Other | 121,268 | 10.3% |
| Total | 1,171,694 | 100.0% |
Housing Structures by Occupancy in Arkansas
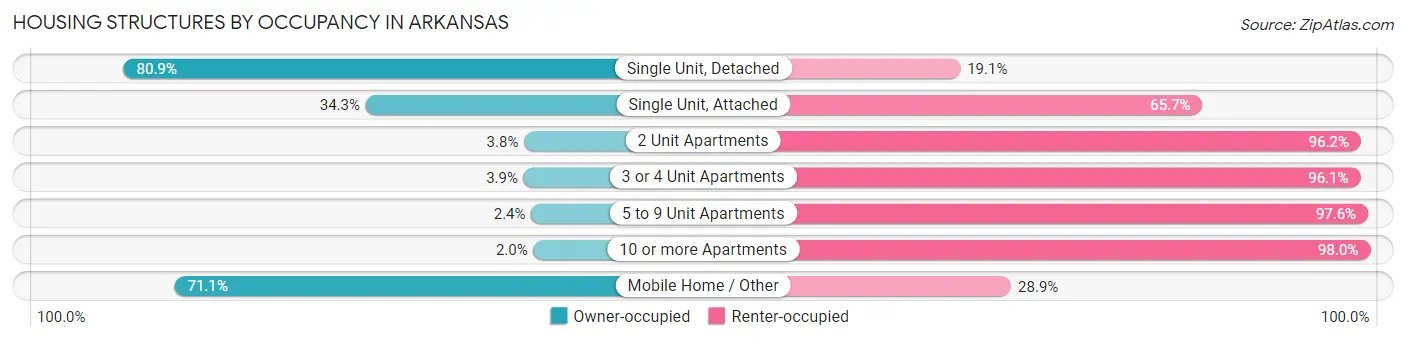
| Structure Type | Owner-occupied | Renter-occupied |
| Single Unit, Detached | 676,773 (80.9%) | 159,495 (19.1%) |
| Single Unit, Attached | 7,539 (34.3%) | 14,433 (65.7%) |
| 2 Unit Apartments | 1,363 (3.8%) | 34,537 (96.2%) |
| 3 or 4 Unit Apartments | 1,516 (3.9%) | 37,454 (96.1%) |
| 5 to 9 Unit Apartments | 944 (2.4%) | 37,916 (97.6%) |
| 10 or more Apartments | 1,578 (2.0%) | 76,878 (98.0%) |
| Mobile Home / Other | 86,243 (71.1%) | 35,025 (28.9%) |
| Total | 775,956 (66.2%) | 395,738 (33.8%) |
Housing Structures by Number of Rooms in Arkansas
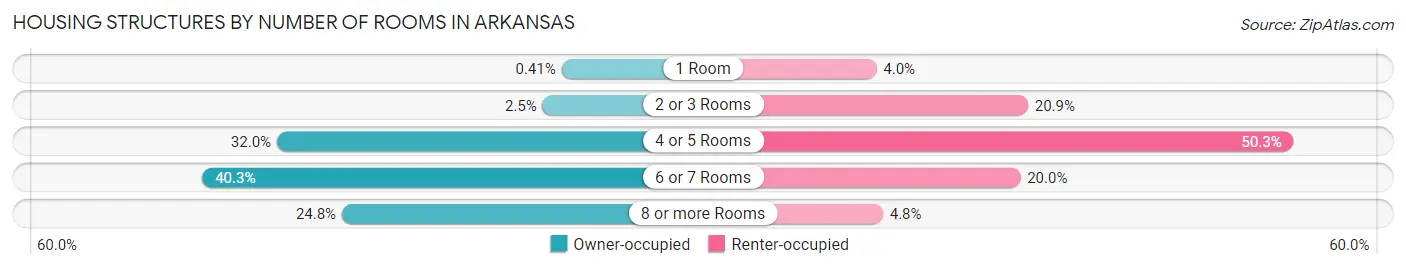
| Number of Rooms | Owner-occupied | Renter-occupied |
| 1 Room | 3,204 (0.4%) | 15,980 (4.0%) |
| 2 or 3 Rooms | 19,584 (2.5%) | 82,503 (20.8%) |
| 4 or 5 Rooms | 248,327 (32.0%) | 199,197 (50.3%) |
| 6 or 7 Rooms | 312,588 (40.3%) | 79,202 (20.0%) |
| 8 or more Rooms | 192,253 (24.8%) | 18,856 (4.8%) |
| Total | 775,956 (100.0%) | 395,738 (100.0%) |
Housing Structure by Heating Type in Arkansas
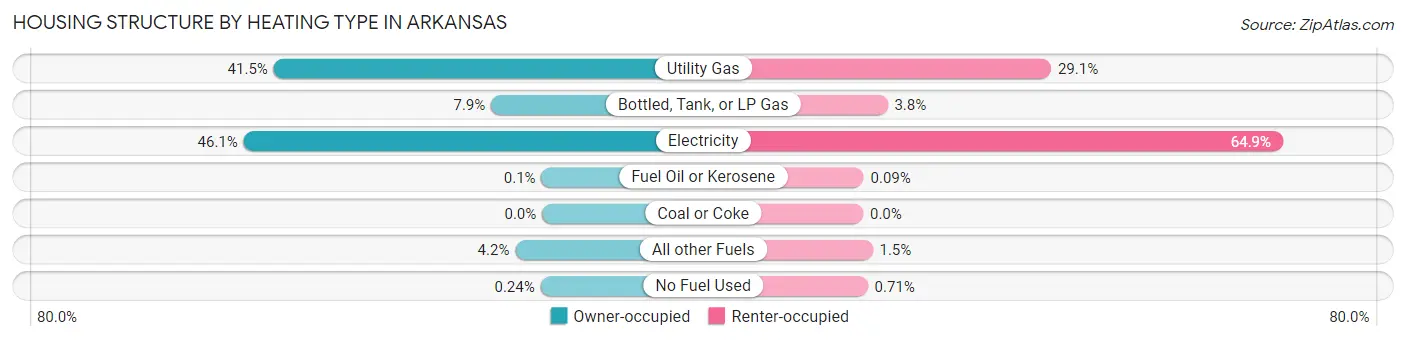
| Heating Type | Owner-occupied | Renter-occupied |
| Utility Gas | 321,999 (41.5%) | 114,960 (29.0%) |
| Bottled, Tank, or LP Gas | 61,107 (7.9%) | 14,965 (3.8%) |
| Electricity | 358,012 (46.1%) | 256,795 (64.9%) |
| Fuel Oil or Kerosene | 749 (0.1%) | 374 (0.1%) |
| Coal or Coke | 32 (0.0%) | 0 (0.0%) |
| All other Fuels | 32,219 (4.2%) | 5,820 (1.5%) |
| No Fuel Used | 1,838 (0.2%) | 2,824 (0.7%) |
| Total | 775,956 (100.0%) | 395,738 (100.0%) |
Household Vehicle Usage in Arkansas
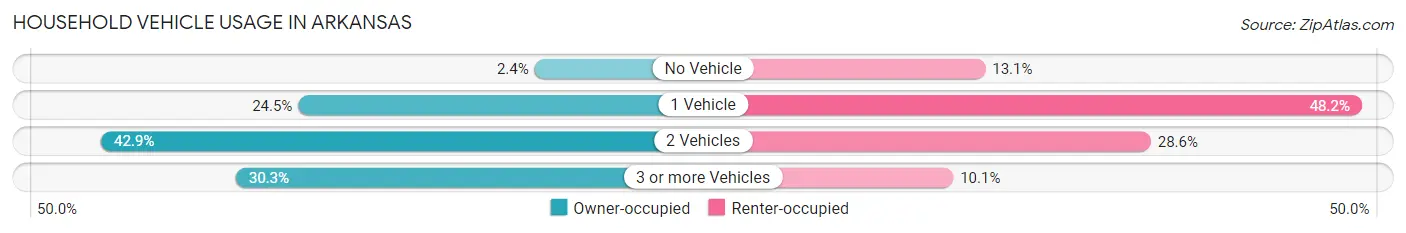
| Vehicles per Household | Owner-occupied | Renter-occupied |
| No Vehicle | 18,633 (2.4%) | 51,855 (13.1%) |
| 1 Vehicle | 189,768 (24.5%) | 190,912 (48.2%) |
| 2 Vehicles | 332,590 (42.9%) | 112,974 (28.5%) |
| 3 or more Vehicles | 234,965 (30.3%) | 39,997 (10.1%) |
| Total | 775,956 (100.0%) | 395,738 (100.0%) |
Real Estate & Mortgages in Arkansas
Real Estate and Mortgage Overview in Arkansas
| Characteristic | Without Mortgage | With Mortgage |
| Housing Units | 360,075 | 415,881 |
| Median Property Value | $132,500 | $181,600 |
| Median Household Income | $52,672 | $84,783 |
| Monthly Housing Costs | $406 | $17,744 |
| Real Estate Taxes | $748 | $22,758 |
Property Value by Mortgage Status in Arkansas
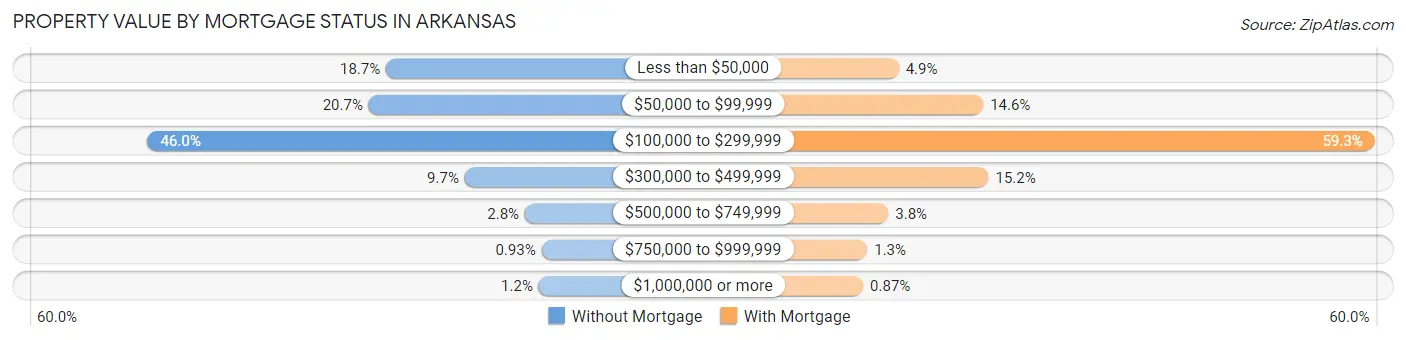
| Property Value | Without Mortgage | With Mortgage |
| Less than $50,000 | 67,289 (18.7%) | 20,487 (4.9%) |
| $50,000 to $99,999 | 74,434 (20.7%) | 60,665 (14.6%) |
| $100,000 to $299,999 | 165,453 (46.0%) | 246,748 (59.3%) |
| $300,000 to $499,999 | 34,922 (9.7%) | 63,196 (15.2%) |
| $500,000 to $749,999 | 10,144 (2.8%) | 15,587 (3.7%) |
| $750,000 to $999,999 | 3,356 (0.9%) | 5,564 (1.3%) |
| $1,000,000 or more | 4,477 (1.2%) | 3,634 (0.9%) |
| Total | 360,075 (100.0%) | 415,881 (100.0%) |
Household Income by Mortgage Status in Arkansas
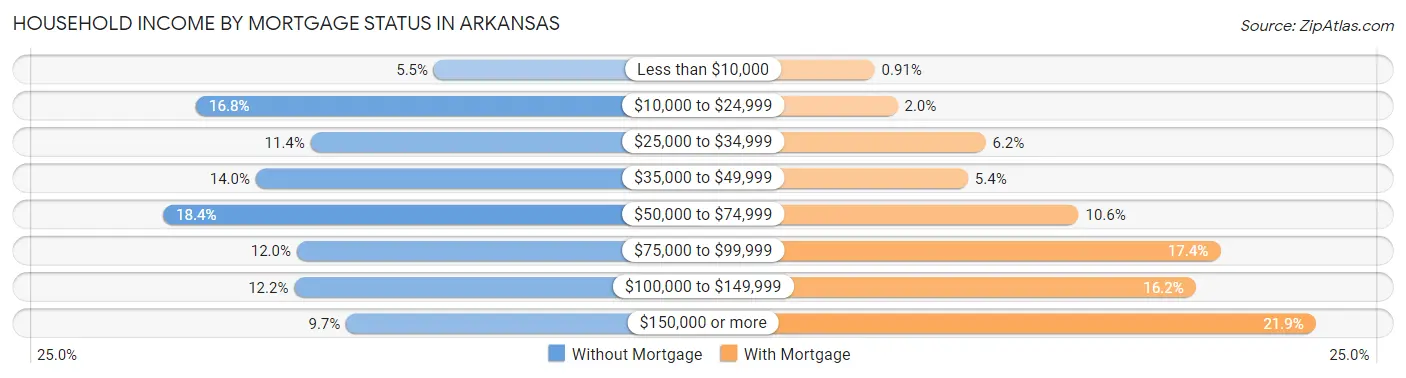
| Household Income | Without Mortgage | With Mortgage |
| Less than $10,000 | 19,850 (5.5%) | 3,777 (0.9%) |
| $10,000 to $24,999 | 60,618 (16.8%) | 8,304 (2.0%) |
| $25,000 to $34,999 | 40,992 (11.4%) | 25,761 (6.2%) |
| $35,000 to $49,999 | 50,371 (14.0%) | 22,250 (5.3%) |
| $50,000 to $74,999 | 66,255 (18.4%) | 44,159 (10.6%) |
| $75,000 to $99,999 | 43,338 (12.0%) | 72,208 (17.4%) |
| $100,000 to $149,999 | 43,776 (12.2%) | 67,346 (16.2%) |
| $150,000 or more | 34,875 (9.7%) | 91,070 (21.9%) |
| Total | 360,075 (100.0%) | 415,881 (100.0%) |
Property Value to Household Income Ratio in Arkansas
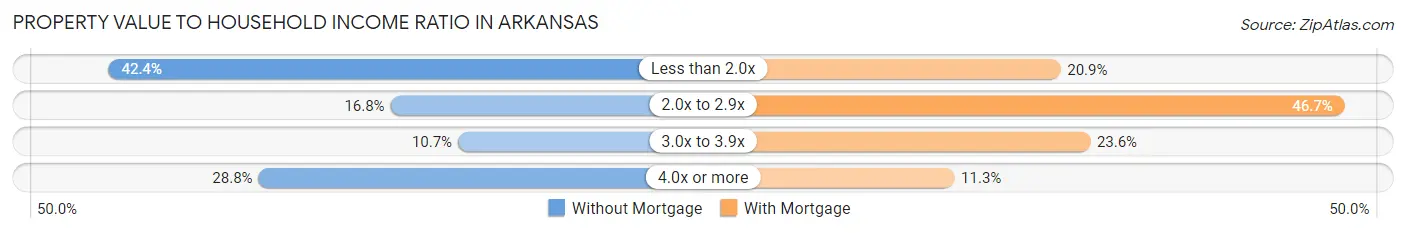
| Value-to-Income Ratio | Without Mortgage | With Mortgage |
| Less than 2.0x | 152,562 (42.4%) | 86,985 (20.9%) |
| 2.0x to 2.9x | 60,413 (16.8%) | 194,376 (46.7%) |
| 3.0x to 3.9x | 38,341 (10.6%) | 98,184 (23.6%) |
| 4.0x or more | 103,576 (28.8%) | 46,931 (11.3%) |
| Total | 360,075 (100.0%) | 415,881 (100.0%) |
Real Estate Taxes by Mortgage Status in Arkansas
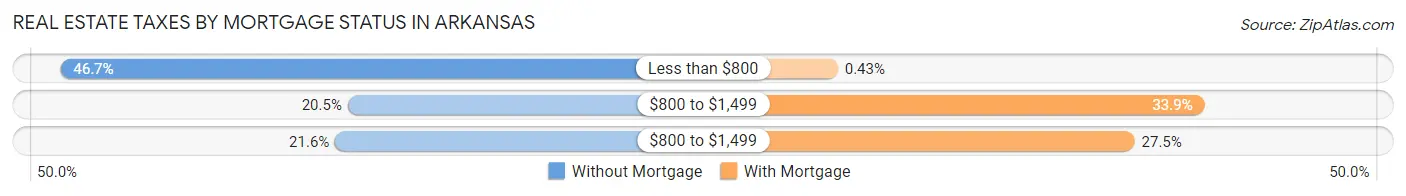
| Property Taxes | Without Mortgage | With Mortgage |
| Less than $800 | 168,266 (46.7%) | 1,768 (0.4%) |
| $800 to $1,499 | 73,764 (20.5%) | 141,068 (33.9%) |
| $800 to $1,499 | 77,926 (21.6%) | 114,553 (27.5%) |
| Total | 360,075 (100.0%) | 415,881 (100.0%) |
Health & Disability in Arkansas
Health Insurance Coverage by Age in Arkansas
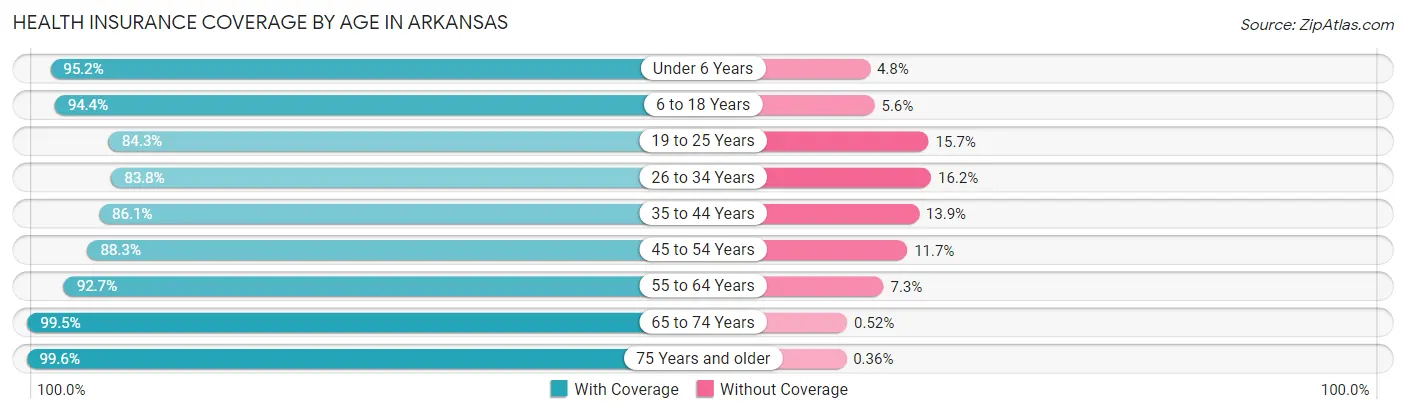
| Age Bracket | With Coverage | Without Coverage |
| Under 6 Years | 207,868 (95.2%) | 10,458 (4.8%) |
| 6 to 18 Years | 492,125 (94.4%) | 29,400 (5.6%) |
| 19 to 25 Years | 235,185 (84.3%) | 43,892 (15.7%) |
| 26 to 34 Years | 286,106 (83.8%) | 55,222 (16.2%) |
| 35 to 44 Years | 316,613 (86.1%) | 51,146 (13.9%) |
| 45 to 54 Years | 312,439 (88.3%) | 41,534 (11.7%) |
| 55 to 64 Years | 351,555 (92.7%) | 27,746 (7.3%) |
| 65 to 74 Years | 297,836 (99.5%) | 1,562 (0.5%) |
| 75 Years and older | 202,854 (99.6%) | 731 (0.4%) |
| Total | 2,702,581 (91.2%) | 261,691 (8.8%) |
Health Insurance Coverage by Citizenship Status in Arkansas
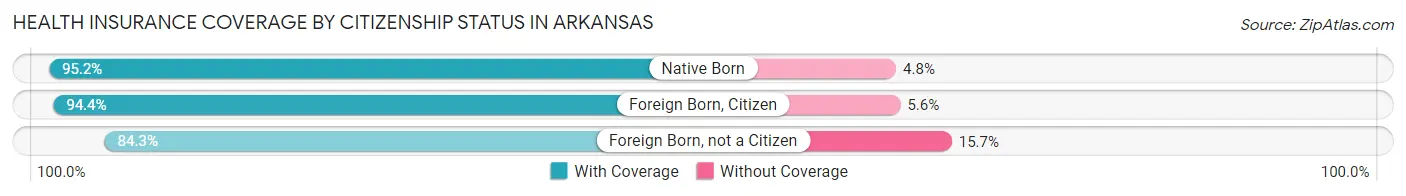
| Citizenship Status | With Coverage | Without Coverage |
| Native Born | 207,868 (95.2%) | 10,458 (4.8%) |
| Foreign Born, Citizen | 492,125 (94.4%) | 29,400 (5.6%) |
| Foreign Born, not a Citizen | 235,185 (84.3%) | 43,892 (15.7%) |
Health Insurance Coverage by Household Income in Arkansas
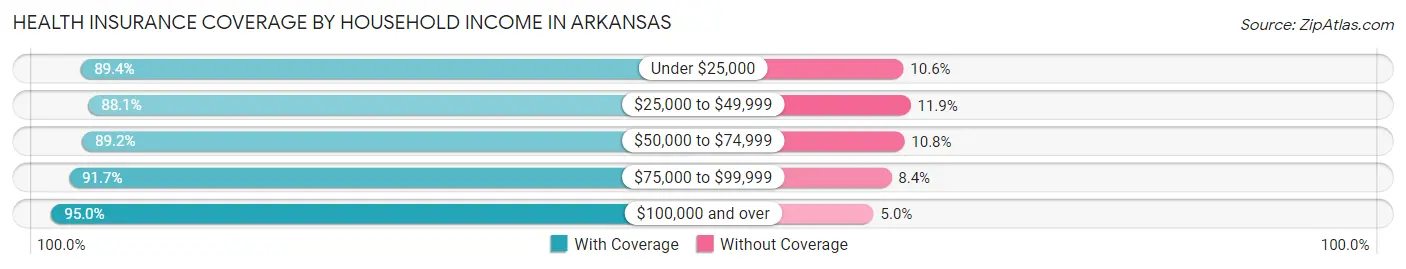
| Household Income | With Coverage | Without Coverage |
| Under $25,000 | 401,315 (89.4%) | 47,649 (10.6%) |
| $25,000 to $49,999 | 540,612 (88.1%) | 73,325 (11.9%) |
| $50,000 to $74,999 | 481,092 (89.2%) | 58,206 (10.8%) |
| $75,000 to $99,999 | 382,012 (91.6%) | 34,788 (8.4%) |
| $100,000 and over | 865,493 (95.0%) | 45,758 (5.0%) |
Public vs Private Health Insurance Coverage by Age in Arkansas
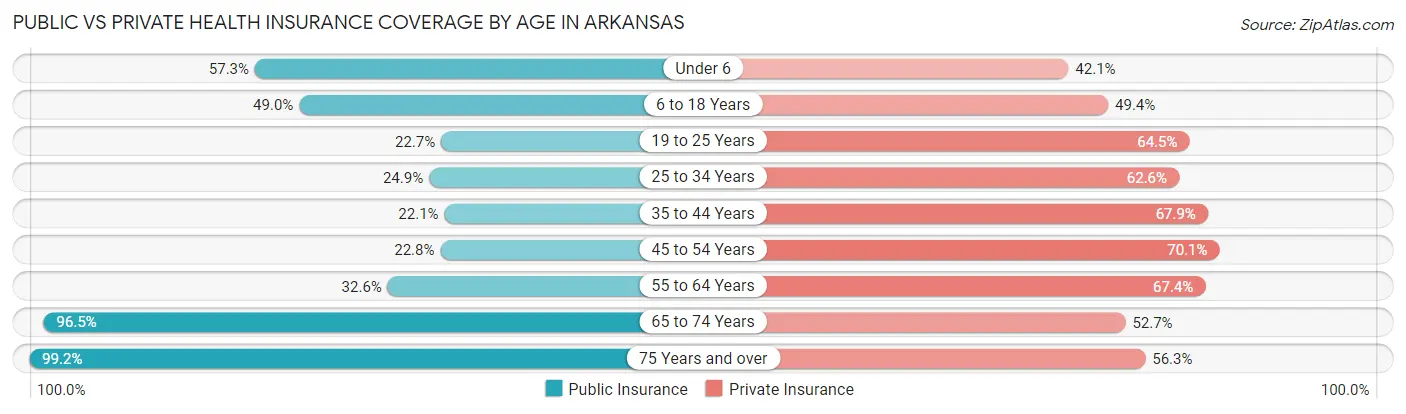
| Age Bracket | Public Insurance | Private Insurance |
| Under 6 | 125,015 (57.3%) | 91,832 (42.1%) |
| 6 to 18 Years | 255,748 (49.0%) | 257,795 (49.4%) |
| 19 to 25 Years | 63,347 (22.7%) | 180,012 (64.5%) |
| 25 to 34 Years | 85,144 (24.9%) | 213,524 (62.6%) |
| 35 to 44 Years | 81,187 (22.1%) | 249,738 (67.9%) |
| 45 to 54 Years | 80,851 (22.8%) | 248,039 (70.1%) |
| 55 to 64 Years | 123,676 (32.6%) | 255,790 (67.4%) |
| 65 to 74 Years | 288,908 (96.5%) | 157,633 (52.6%) |
| 75 Years and over | 201,869 (99.2%) | 114,671 (56.3%) |
| Total | 1,305,745 (44.1%) | 1,769,034 (59.7%) |
Disability Status by Sex by Age in Arkansas
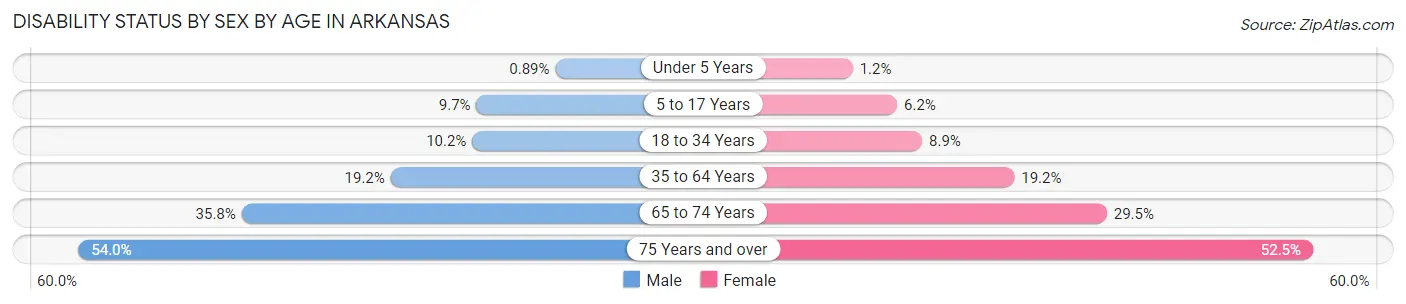
| Age Bracket | Male | Female |
| Under 5 Years | 834 (0.9%) | 1,070 (1.2%) |
| 5 to 17 Years | 25,502 (9.7%) | 15,480 (6.2%) |
| 18 to 34 Years | 33,720 (10.2%) | 29,678 (8.9%) |
| 35 to 64 Years | 103,789 (19.2%) | 107,866 (19.2%) |
| 65 to 74 Years | 50,135 (35.8%) | 47,070 (29.5%) |
| 75 Years and over | 46,284 (54.0%) | 61,851 (52.5%) |
Disability Class by Sex by Age in Arkansas
Disability Class: Hearing Difficulty
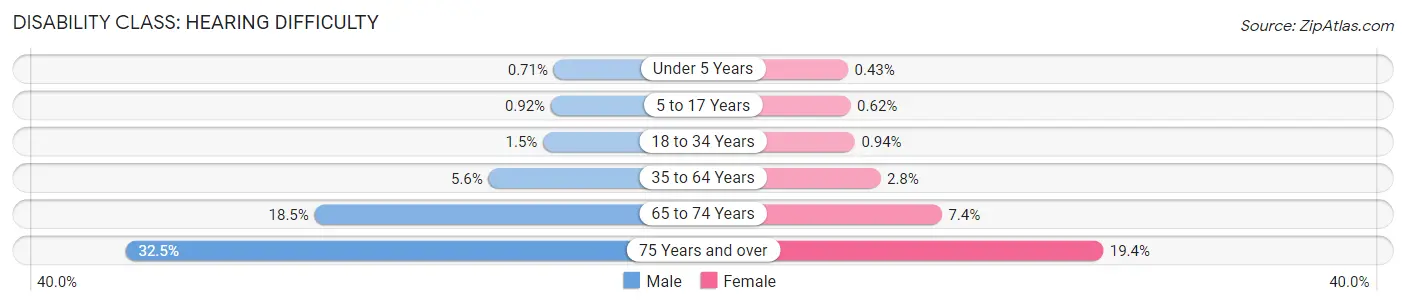
| Age Bracket | Male | Female |
| Under 5 Years | 660 (0.7%) | 377 (0.4%) |
| 5 to 17 Years | 2,431 (0.9%) | 1,570 (0.6%) |
| 18 to 34 Years | 4,970 (1.5%) | 3,124 (0.9%) |
| 35 to 64 Years | 29,959 (5.6%) | 15,923 (2.8%) |
| 65 to 74 Years | 25,845 (18.5%) | 11,805 (7.4%) |
| 75 Years and over | 27,852 (32.5%) | 22,849 (19.4%) |
Disability Class: Vision Difficulty
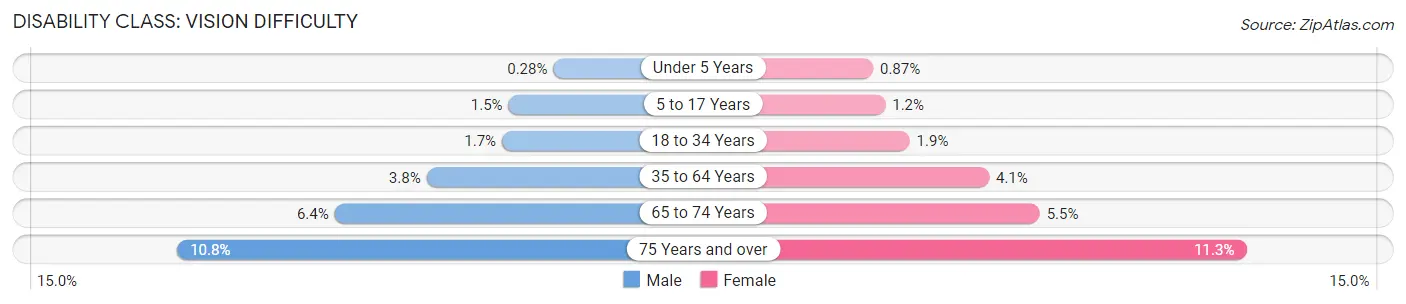
| Age Bracket | Male | Female |
| Under 5 Years | 264 (0.3%) | 764 (0.9%) |
| 5 to 17 Years | 4,035 (1.5%) | 3,032 (1.2%) |
| 18 to 34 Years | 5,683 (1.7%) | 6,264 (1.9%) |
| 35 to 64 Years | 20,568 (3.8%) | 23,000 (4.1%) |
| 65 to 74 Years | 8,916 (6.4%) | 8,790 (5.5%) |
| 75 Years and over | 9,208 (10.7%) | 13,274 (11.3%) |
Disability Class: Cognitive Difficulty
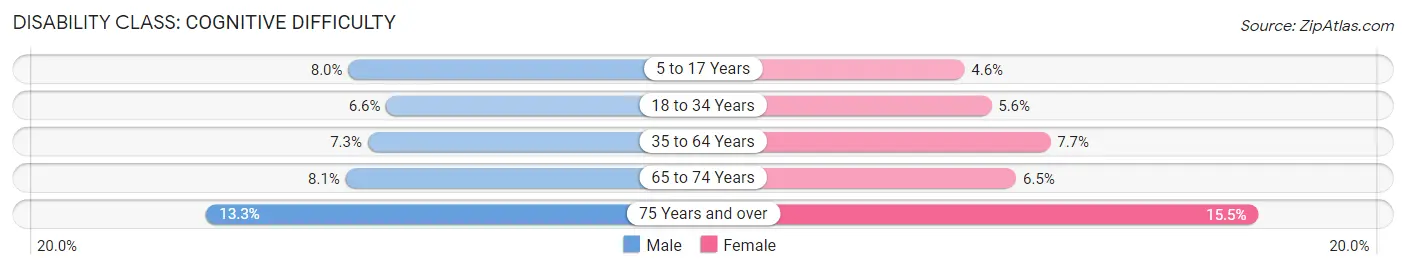
| Age Bracket | Male | Female |
| 5 to 17 Years | 21,015 (8.0%) | 11,427 (4.5%) |
| 18 to 34 Years | 21,809 (6.6%) | 18,432 (5.6%) |
| 35 to 64 Years | 39,178 (7.3%) | 43,457 (7.7%) |
| 65 to 74 Years | 11,310 (8.1%) | 10,321 (6.5%) |
| 75 Years and over | 11,356 (13.3%) | 18,223 (15.5%) |
Disability Class: Ambulatory Difficulty
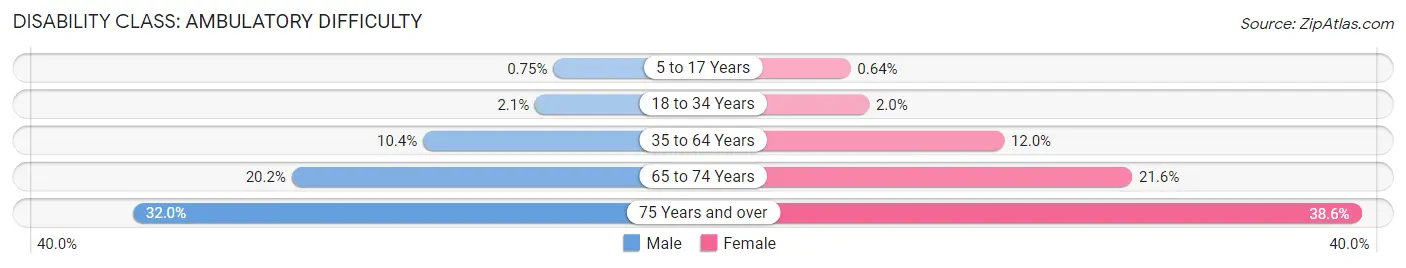
| Age Bracket | Male | Female |
| 5 to 17 Years | 1,975 (0.7%) | 1,603 (0.6%) |
| 18 to 34 Years | 6,983 (2.1%) | 6,719 (2.0%) |
| 35 to 64 Years | 56,223 (10.4%) | 67,608 (12.0%) |
| 65 to 74 Years | 28,216 (20.2%) | 34,369 (21.5%) |
| 75 Years and over | 27,386 (32.0%) | 45,485 (38.6%) |
Disability Class: Self-Care Difficulty
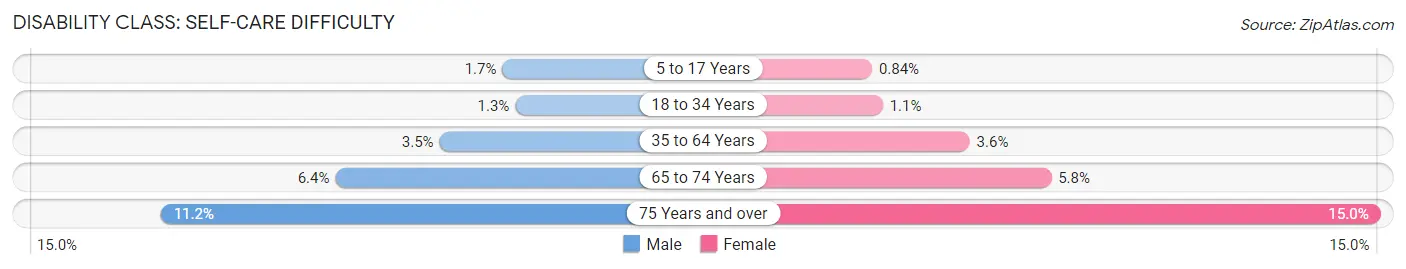
| Age Bracket | Male | Female |
| 5 to 17 Years | 4,475 (1.7%) | 2,106 (0.8%) |
| 18 to 34 Years | 4,444 (1.3%) | 3,782 (1.1%) |
| 35 to 64 Years | 18,627 (3.5%) | 20,016 (3.6%) |
| 65 to 74 Years | 8,881 (6.4%) | 9,295 (5.8%) |
| 75 Years and over | 9,605 (11.2%) | 17,680 (15.0%) |
Technology Access in Arkansas
Computing Device Access in Arkansas
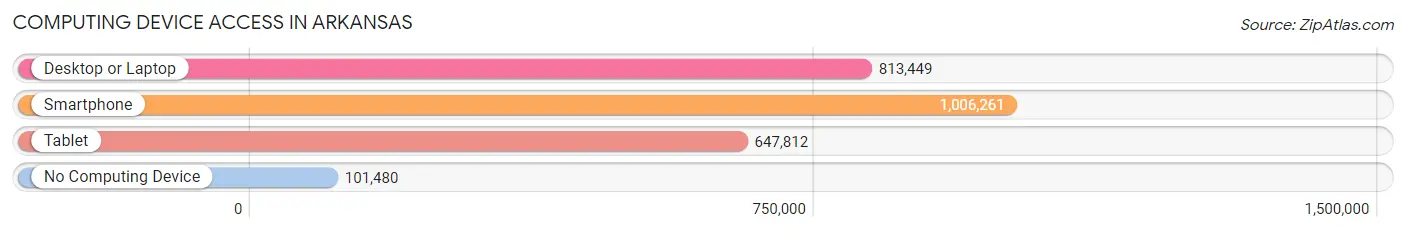
| Device Type | # Households | % Households |
| Desktop or Laptop | 813,449 | 69.4% |
| Smartphone | 1,006,261 | 85.9% |
| Tablet | 647,812 | 55.3% |
| No Computing Device | 101,480 | 8.7% |
| Total | 1,171,694 | 100.0% |
Internet Access in Arkansas
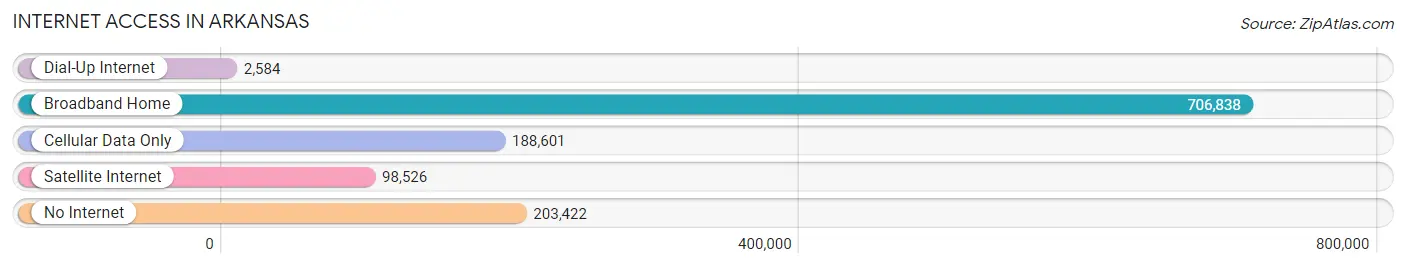
| Internet Type | # Households | % Households |
| Dial-Up Internet | 2,584 | 0.2% |
| Broadband Home | 706,838 | 60.3% |
| Cellular Data Only | 188,601 | 16.1% |
| Satellite Internet | 98,526 | 8.4% |
| No Internet | 203,422 | 17.4% |
| Total | 1,171,694 | 100.0% |
Arkansas Summary
Arkansas is a state located in the Southern United States. It is bordered by Missouri to the north, Tennessee and Mississippi to the east, Louisiana to the south, and Texas and Oklahoma to the west. Arkansas is the 33rd largest state by area and the 25th most populous state in the United States. The capital and most populous city is Little Rock, located in the central portion of the state.
History
The area now known as Arkansas was first inhabited by Native Americans, including the Caddo, Osage, and Quapaw tribes. The first Europeans to explore the area were the Spanish in the 16th century. The region was later claimed by the French, who established the Arkansas Post in 1686. The area was ceded to the United States in 1803 as part of the Louisiana Purchase.
Arkansas became the 25th state on June 15, 1836. During the Civil War, Arkansas was a Confederate state, and was the site of several battles. After the war, the state was readmitted to the Union in 1868.
Geography
Arkansas is located in the south-central region of the United States. It is bordered by Missouri to the north, Tennessee and Mississippi to the east, Louisiana to the south, and Texas and Oklahoma to the west. The state has a total area of 53,179 square miles, making it the 33rd largest state in the country.
The landscape of Arkansas is diverse, with the Ozark Mountains in the northwest and the Ouachita Mountains in the south. The state also has several rivers, including the Arkansas River, the White River, and the Red River.
Economy
Arkansas’s economy is largely based on agriculture, forestry, and manufacturing. The state’s major agricultural products include rice, soybeans, cotton, and poultry. The state is also a major producer of timber, and is home to several large paper mills.
Manufacturing is also an important part of the state’s economy. Major industries include food processing, automotive parts, chemicals, and steel. Arkansas is also home to several large companies, including Walmart, Tyson Foods, and J.B. Hunt.
Demographics
As of the 2010 census, Arkansas had a population of 2,915,918. The state is racially diverse, with the largest racial group being white (78.3%), followed by black (15.4%), Hispanic (6.0%), and Asian (1.3%).
The median household income in Arkansas is $41,371, and the median age is 37.7. The state’s largest cities are Little Rock, Fort Smith, Fayetteville, Springdale, and Jonesboro.
Arkansas is also home to several major universities, including the University of Arkansas, Arkansas State University, and the University of Central Arkansas. The state is also home to several professional sports teams, including the Arkansas Razorbacks (NCAA Division I) and the Arkansas Travelers (Minor League Baseball).
Common Questions
When was Arkansas Incorporated?
Arkansas was Incorporated into the Union on Jun 15, 1836.
What is the Total Area of Arkansas?
Total Area of Arkansas is 53,178 Square Miles.
What is the Total Land Area of Arkansas?
Total Land Area of Arkansas is 52,030 Square Miles.
What is the Total Water Area of Arkansas?
Total Water Area of Arkansas is 1,149 Square Miles.
What is the Average Elevation in Arkansas?
Average Elevation in Arkansas is 650 Feet.
What is the Highest Elevation in Arkansas?
Highest Elevation in Arkansas is 2,753 Feet.
What is the Lowest Elevation in Arkansas?
Lowest Elevation in Arkansas is 55 Feet.
What is the Population Density in Arkansas?
Population Density in Arkansas is 58.0 People per Square Mile.
What is Per Capita Income in Arkansas?
Per Capita income in Arkansas is $31,868.
What is the Median Family Income in Arkansas?
Median Family Income in Arkansas is $71,437.
What is the Median Household income in Arkansas?
Median Household Income in Arkansas is $56,335.
What is Income or Wage Gap in Arkansas?
Income or Wage Gap in Arkansas is 26.0%.
Women in Arkansas earn 74.0 cents for every dollar earned by a man.
What is Family Income Deficit in Arkansas?
Family Income Deficit in Arkansas is $10,633.
Families that are below poverty line in Arkansas earn $10,633 less on average than the poverty threshold level.
What is Inequality or Gini Index in Arkansas?
Inequality or Gini Index in Arkansas is 0.48.
What is the Total Population of Arkansas?
Total Population of Arkansas is 3,018,669.
What is the Total Male Population of Arkansas?
Total Male Population of Arkansas is 1,491,622.
What is the Total Female Population of Arkansas?
Total Female Population of Arkansas is 1,527,047.
What is the Ratio of Males per 100 Females in Arkansas?
There are 97.68 Males per 100 Females in Arkansas.
What is the Ratio of Females per 100 Males in Arkansas?
There are 102.37 Females per 100 Males in Arkansas.
What is the Median Population Age in Arkansas?
Median Population Age in Arkansas is 38.4 Years.
What is the Average Family Size in Arkansas
Average Family Size in Arkansas is 3.1 People.
What is the Average Household Size in Arkansas
Average Household Size in Arkansas is 2.5 People.
How Large is the Labor Force in Arkansas?
There are 1,398,233 People in the Labor Forcein in Arkansas.
What is the Percentage of People in the Labor Force in Arkansas?
58.2% of People are in the Labor Force in Arkansas.
What is the Unemployment Rate in Arkansas?
Unemployment Rate in Arkansas is 5.1%.