Cities with the Highest Percentage of Cypriot Population in the United States
RELATED REPORTS & OPTIONS
Cypriot
United States
Compare Cities
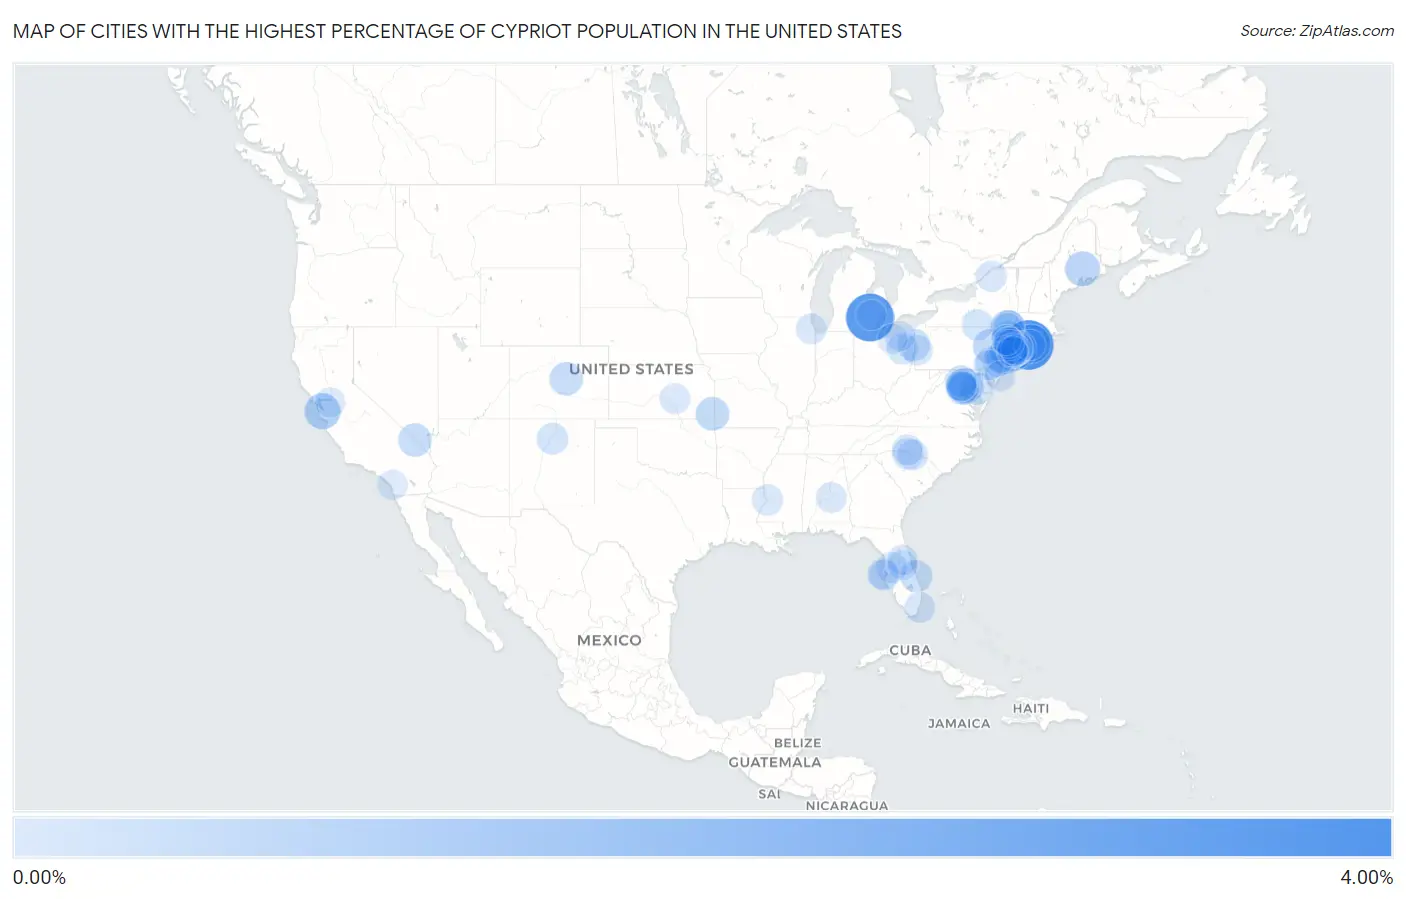
Map of Cities with the Highest Percentage of Cypriot Population in the United States
0.00%
4.00%
Cities with the Highest Percentage of Cypriot Population in the United States
| City | Cypriot | vs State | vs National | |
| 1. | Cutchogue | 3.26% | 0.014%(+3.25)#1 | 0.0033%(+3.26)#1 |
| 2. | South Lansing | 3.19% | 0.014%(+3.17)#2 | 0.0033%(+3.18)#2 |
| 3. | South Lyon | 2.99% | 0.0051%(+2.98)#1 | 0.0033%(+2.98)#3 |
| 4. | Closter Borough | 1.48% | 0.011%(+1.47)#1 | 0.0033%(+1.48)#4 |
| 5. | East Marion | 1.41% | 0.014%(+1.39)#3 | 0.0033%(+1.40)#5 |
| 6. | North Great River | 1.01% | 0.014%(+0.991)#4 | 0.0033%(+1.00)#6 |
| 7. | Stanford | 1.00% | 0.0020%(+1.00)#1 | 0.0033%(+0.999)#7 |
| 8. | National Harbor | 0.98% | 0.0045%(+0.980)#1 | 0.0033%(+0.981)#8 |
| 9. | Goldsboro Borough | 0.98% | 0.0035%(+0.974)#1 | 0.0033%(+0.974)#9 |
| 10. | Barnum Island | 0.93% | 0.014%(+0.921)#5 | 0.0033%(+0.932)#10 |
| 11. | Old Greenwich | 0.93% | 0.0055%(+0.929)#1 | 0.0033%(+0.932)#11 |
| 12. | Englewood Cliffs Borough | 0.86% | 0.011%(+0.849)#2 | 0.0033%(+0.857)#12 |
| 13. | Old Town | 0.80% | 0.0046%(+0.800)#1 | 0.0033%(+0.801)#13 |
| 14. | Laurel Hollow | 0.78% | 0.014%(+0.766)#6 | 0.0033%(+0.777)#14 |
| 15. | Lincoln Park | 0.76% | 0.014%(+0.744)#7 | 0.0033%(+0.755)#15 |
| 16. | Plandome Manor | 0.75% | 0.014%(+0.738)#8 | 0.0033%(+0.749)#16 |
| 17. | West Hills | 0.72% | 0.014%(+0.706)#9 | 0.0033%(+0.717)#17 |
| 18. | Dumont Borough | 0.71% | 0.011%(+0.694)#3 | 0.0033%(+0.702)#18 |
| 19. | Arlington Heights | 0.67% | 0.0035%(+0.664)#2 | 0.0033%(+0.664)#19 |
| 20. | Weir | 0.62% | 0.00034%(+0.622)#1 | 0.0033%(+0.619)#20 |
| 21. | Perry Park | 0.58% | 0.0017%(+0.582)#1 | 0.0033%(+0.581)#21 |
| 22. | Sandy Valley | 0.57% | 0.0013%(+0.573)#1 | 0.0033%(+0.571)#22 |
| 23. | Kean University | 0.53% | 0.011%(+0.522)#4 | 0.0033%(+0.530)#23 |
| 24. | Huntington Bay | 0.51% | 0.014%(+0.493)#10 | 0.0033%(+0.503)#24 |
| 25. | Eatons Neck | 0.48% | 0.014%(+0.463)#11 | 0.0033%(+0.474)#25 |
| 26. | West Grove Borough | 0.47% | 0.0035%(+0.463)#3 | 0.0033%(+0.464)#26 |
| 27. | Poland | 0.43% | 0.0022%(+0.425)#1 | 0.0033%(+0.424)#27 |
| 28. | Indian River Shores | 0.40% | 0.0042%(+0.394)#1 | 0.0033%(+0.395)#28 |
| 29. | Upper Brookville | 0.37% | 0.014%(+0.358)#12 | 0.0033%(+0.369)#29 |
| 30. | Oxford | 0.37% | 0.0045%(+0.363)#2 | 0.0033%(+0.364)#30 |
| 31. | Mason Neck | 0.36% | 0.0067%(+0.356)#1 | 0.0033%(+0.359)#31 |
| 32. | Saugerties South | 0.36% | 0.014%(+0.345)#13 | 0.0033%(+0.356)#32 |
| 33. | East Meadow | 0.36% | 0.014%(+0.341)#14 | 0.0033%(+0.352)#33 |
| 34. | Balmville | 0.34% | 0.014%(+0.330)#15 | 0.0033%(+0.341)#34 |
| 35. | North Potomac | 0.34% | 0.0045%(+0.332)#3 | 0.0033%(+0.333)#35 |
| 36. | Plandome Heights | 0.32% | 0.014%(+0.306)#16 | 0.0033%(+0.317)#36 |
| 37. | Groveton | 0.30% | 0.0067%(+0.294)#2 | 0.0033%(+0.298)#37 |
| 38. | Willow Grove | 0.30% | 0.0035%(+0.295)#4 | 0.0033%(+0.295)#38 |
| 39. | White Haven Borough | 0.28% | 0.0035%(+0.277)#5 | 0.0033%(+0.278)#39 |
| 40. | Jacona | 0.28% | 0.0011%(+0.277)#1 | 0.0033%(+0.275)#40 |
| 41. | Westbury | 0.27% | 0.014%(+0.258)#17 | 0.0033%(+0.269)#41 |
| 42. | Hillside | 0.27% | 0.014%(+0.251)#18 | 0.0033%(+0.262)#42 |
| 43. | Lincroft | 0.26% | 0.011%(+0.254)#5 | 0.0033%(+0.262)#43 |
| 44. | Vienna | 0.26% | 0.0067%(+0.249)#3 | 0.0033%(+0.253)#44 |
| 45. | Yorketown | 0.25% | 0.011%(+0.238)#6 | 0.0033%(+0.247)#45 |
| 46. | Meyers Lake | 0.24% | 0.0022%(+0.237)#2 | 0.0033%(+0.236)#46 |
| 47. | Endicott | 0.23% | 0.014%(+0.215)#19 | 0.0033%(+0.226)#47 |
| 48. | Shamokin Dam Borough | 0.22% | 0.0035%(+0.215)#6 | 0.0033%(+0.215)#48 |
| 49. | Tega Cay | 0.22% | 0.0047%(+0.214)#1 | 0.0033%(+0.215)#49 |
| 50. | Vicksburg | 0.22% | 0.0016%(+0.214)#1 | 0.0033%(+0.212)#50 |
| 51. | Elwood | 0.21% | 0.014%(+0.193)#20 | 0.0033%(+0.203)#51 |
| 52. | Locust Valley | 0.19% | 0.014%(+0.180)#21 | 0.0033%(+0.191)#52 |
| 53. | Canton | 0.19% | 0.014%(+0.179)#22 | 0.0033%(+0.190)#53 |
| 54. | Redington Shores | 0.19% | 0.0042%(+0.188)#2 | 0.0033%(+0.189)#54 |
| 55. | Oceanside | 0.19% | 0.014%(+0.176)#23 | 0.0033%(+0.187)#55 |
| 56. | Mineral Springs | 0.19% | 0.0021%(+0.186)#1 | 0.0033%(+0.185)#56 |
| 57. | Leonia Borough | 0.18% | 0.011%(+0.172)#7 | 0.0033%(+0.180)#57 |
| 58. | Poquott | 0.18% | 0.014%(+0.166)#24 | 0.0033%(+0.177)#58 |
| 59. | Haverstraw | 0.18% | 0.014%(+0.165)#25 | 0.0033%(+0.176)#59 |
| 60. | Key Biscayne | 0.18% | 0.0042%(+0.174)#3 | 0.0033%(+0.175)#60 |
| 61. | Malverne | 0.18% | 0.014%(+0.162)#26 | 0.0033%(+0.173)#61 |
| 62. | Holden Lakes | 0.17% | 0.0042%(+0.163)#4 | 0.0033%(+0.164)#62 |
| 63. | North New Hyde Park | 0.16% | 0.014%(+0.143)#27 | 0.0033%(+0.154)#63 |
| 64. | Millbrook | 0.16% | 0.00052%(+0.156)#1 | 0.0033%(+0.153)#64 |
| 65. | Zephyrhills | 0.15% | 0.0042%(+0.149)#5 | 0.0033%(+0.150)#65 |
| 66. | White Plains | 0.15% | 0.014%(+0.137)#28 | 0.0033%(+0.148)#66 |
| 67. | Cramerton | 0.15% | 0.0021%(+0.149)#2 | 0.0033%(+0.148)#67 |
| 68. | Harrison | 0.15% | 0.011%(+0.140)#8 | 0.0033%(+0.148)#68 |
| 69. | Bordentown | 0.15% | 0.011%(+0.139)#9 | 0.0033%(+0.147)#69 |
| 70. | South Pasadena | 0.15% | 0.0042%(+0.146)#6 | 0.0033%(+0.147)#70 |
| 71. | Haworth Borough | 0.15% | 0.011%(+0.138)#10 | 0.0033%(+0.146)#71 |
| 72. | Monmouth Junction | 0.14% | 0.011%(+0.132)#11 | 0.0033%(+0.140)#72 |
| 73. | Tappan | 0.14% | 0.014%(+0.128)#29 | 0.0033%(+0.139)#73 |
| 74. | Port Washington | 0.14% | 0.014%(+0.127)#30 | 0.0033%(+0.138)#74 |
| 75. | Hesston | 0.14% | 0.00034%(+0.135)#2 | 0.0033%(+0.132)#75 |
| 76. | Bergenfield Borough | 0.13% | 0.011%(+0.123)#12 | 0.0033%(+0.131)#76 |
| 77. | Beaver Falls | 0.13% | 0.0035%(+0.131)#7 | 0.0033%(+0.131)#77 |
| 78. | Bogota Borough | 0.13% | 0.011%(+0.123)#13 | 0.0033%(+0.131)#78 |
| 79. | River Forest | 0.13% | 0.0023%(+0.127)#1 | 0.0033%(+0.126)#79 |
| 80. | Southold | 0.13% | 0.014%(+0.111)#31 | 0.0033%(+0.122)#80 |
| 81. | Ridgefield Borough | 0.12% | 0.011%(+0.111)#14 | 0.0033%(+0.119)#81 |
| 82. | Kings Park West | 0.12% | 0.0067%(+0.114)#4 | 0.0033%(+0.117)#82 |
| 83. | The Hills | 0.12% | 0.011%(+0.108)#15 | 0.0033%(+0.116)#83 |
| 84. | Melville | 0.12% | 0.014%(+0.105)#32 | 0.0033%(+0.115)#84 |
| 85. | Altamonte Springs | 0.12% | 0.0042%(+0.114)#7 | 0.0033%(+0.115)#85 |
| 86. | University Heights | 0.12% | 0.0022%(+0.115)#3 | 0.0033%(+0.114)#86 |
| 87. | Linwood | 0.12% | 0.011%(+0.104)#16 | 0.0033%(+0.112)#87 |
| 88. | Congers | 0.11% | 0.014%(+0.100)#33 | 0.0033%(+0.111)#88 |
| 89. | Meadow Woods | 0.11% | 0.0042%(+0.109)#8 | 0.0033%(+0.110)#89 |
| 90. | Butler Borough | 0.11% | 0.011%(+0.101)#17 | 0.0033%(+0.109)#90 |
| 91. | Franklin Square | 0.11% | 0.014%(+0.095)#34 | 0.0033%(+0.106)#91 |
| 92. | Rutherford Borough | 0.11% | 0.011%(+0.095)#18 | 0.0033%(+0.103)#92 |
| 93. | Elyria | 0.11% | 0.0022%(+0.104)#4 | 0.0033%(+0.103)#93 |
| 94. | Woodbury | 0.11% | 0.014%(+0.091)#35 | 0.0033%(+0.102)#94 |
| 95. | Broomall | 0.10% | 0.0035%(+0.100)#8 | 0.0033%(+0.100)#95 |
| 96. | Elkins Park | 0.10% | 0.0035%(+0.097)#9 | 0.0033%(+0.097)#96 |
| 97. | Milford | 0.093% | 0.0051%(+0.087)#2 | 0.0033%(+0.089)#97 |
| 98. | Vista | 0.092% | 0.0020%(+0.091)#2 | 0.0033%(+0.089)#98 |
| 99. | Discovery Bay | 0.091% | 0.0020%(+0.089)#3 | 0.0033%(+0.088)#99 |
| 100. | Lake Worth Beach | 0.088% | 0.0042%(+0.083)#9 | 0.0033%(+0.084)#100 |
Common Questions
What are the Top 10 Cities with the Highest Percentage of Cypriot Population in the United States?
Top 10 Cities with the Highest Percentage of Cypriot Population in the United States are:
#1
3.26%
#2
2.99%
#3
1.41%
#4
1.01%
#5
1.00%
#6
0.98%
#7
0.93%
#8
0.93%
#9
0.80%
#10
0.78%
What city has the Highest Percentage of Cypriot Population in the United States?
Cutchogue has the Highest Percentage of Cypriot Population in the United States with 3.26%.
What is the Percentage of Cypriot Population in the United States?
Percentage of Cypriot Population in the United States is 0.0033%.