Oconee County, SC Map & Demographics
Oconee County Map
Oconee County Overview
$35,315
PER CAPITA INCOME
$73,382
AVG FAMILY INCOME
$56,710
AVG HOUSEHOLD INCOME
30.1%
WAGE / INCOME GAP [ % ]
69.9¢/ $1
WAGE / INCOME GAP [ $ ]
$10,511
FAMILY INCOME DEFICIT
0.49
INEQUALITY / GINI INDEX
78,775
TOTAL POPULATION
38,804
MALE POPULATION
39,971
FEMALE POPULATION
97.08
MALES / 100 FEMALES
103.01
FEMALES / 100 MALES
46.2
MEDIAN AGE
2.9
AVG FAMILY SIZE
2.3
AVG HOUSEHOLD SIZE
34,118
LABOR FORCE [ PEOPLE ]
52.1%
PERCENT IN LABOR FORCE
5.8%
UNEMPLOYMENT RATE
Oconee County Area Codes
Income in Oconee County
Income Overview in Oconee County
Per Capita Income in Oconee County is $35,315, while median incomes of families and households are $73,382 and $56,710 respectively.
| Characteristic | Number | Measure |
| Per Capita Income | 78,775 | $35,315 |
| Median Family Income | 22,272 | $73,382 |
| Mean Family Income | 22,272 | $99,964 |
| Median Household Income | 33,240 | $56,710 |
| Mean Household Income | 33,240 | $82,716 |
| Income Deficit | 22,272 | $10,511 |
| Wage / Income Gap (%) | 78,775 | 30.13% |
| Wage / Income Gap ($) | 78,775 | 69.87¢ per $1 |
| Gini / Inequality Index | 78,775 | 0.49 |
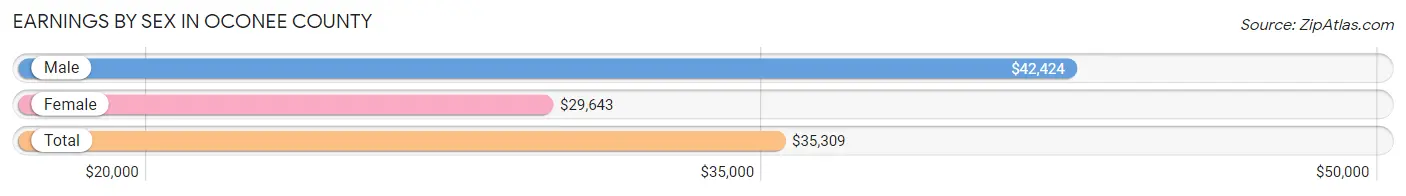
Earnings by Sex in Oconee County
Average Earnings in Oconee County are $35,309, $42,424 for men and $29,643 for women, a difference of 30.1%.
| Sex | Number | Average Earnings |
| Male | 19,761 (54.6%) | $42,424 |
| Female | 16,452 (45.4%) | $29,643 |
| Total | 36,213 (100.0%) | $35,309 |
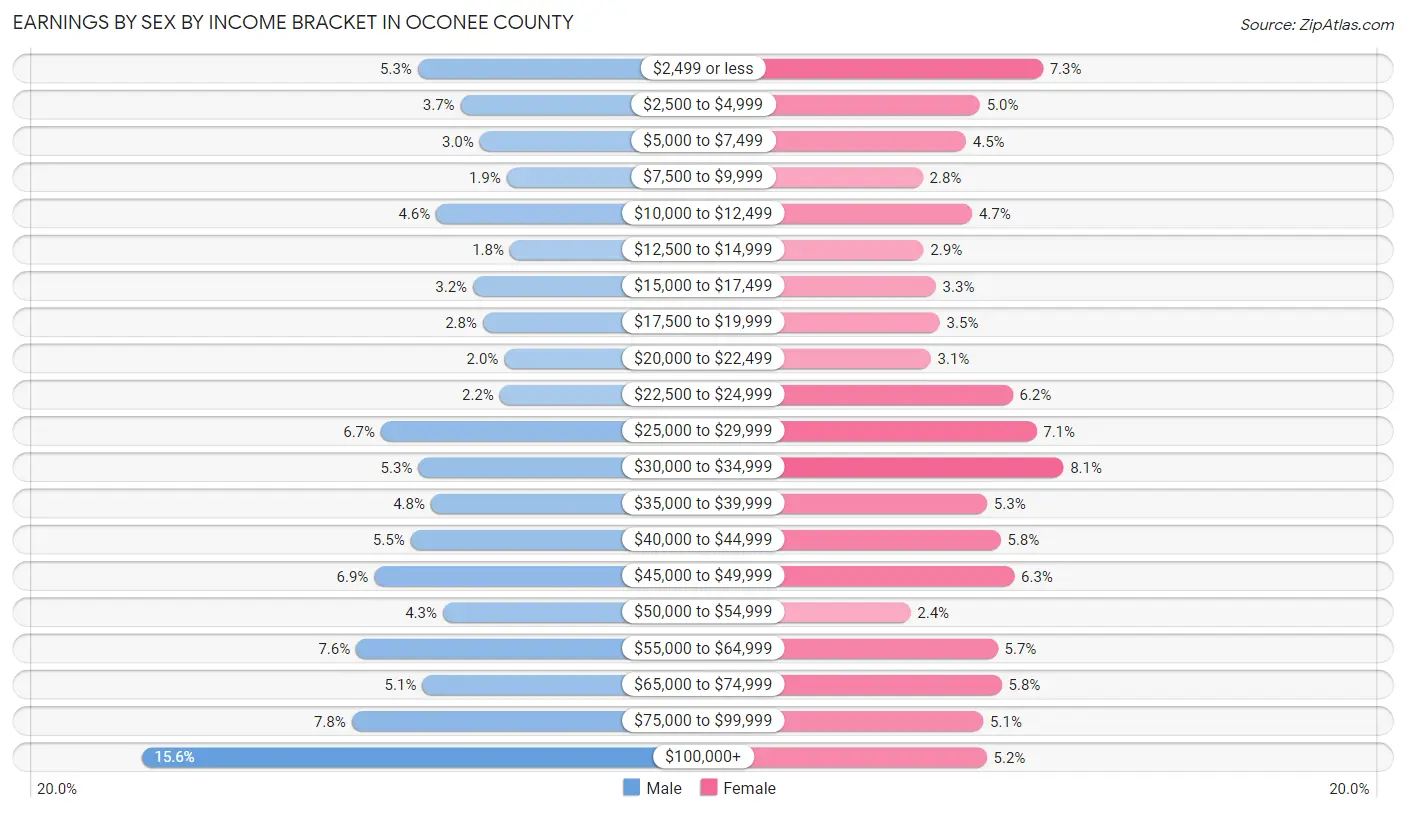
Earnings by Sex by Income Bracket in Oconee County
The most common earnings brackets in Oconee County are $100,000+ for men (3,087 | 15.6%) and $30,000 to $34,999 for women (1,334 | 8.1%).
| Income | Male | Female |
| $2,499 or less | 1,041 (5.3%) | 1,207 (7.3%) |
| $2,500 to $4,999 | 725 (3.7%) | 819 (5.0%) |
| $5,000 to $7,499 | 582 (2.9%) | 734 (4.5%) |
| $7,500 to $9,999 | 384 (1.9%) | 467 (2.8%) |
| $10,000 to $12,499 | 905 (4.6%) | 771 (4.7%) |
| $12,500 to $14,999 | 359 (1.8%) | 472 (2.9%) |
| $15,000 to $17,499 | 633 (3.2%) | 548 (3.3%) |
| $17,500 to $19,999 | 560 (2.8%) | 573 (3.5%) |
| $20,000 to $22,499 | 402 (2.0%) | 516 (3.1%) |
| $22,500 to $24,999 | 434 (2.2%) | 1,022 (6.2%) |
| $25,000 to $29,999 | 1,314 (6.7%) | 1,168 (7.1%) |
| $30,000 to $34,999 | 1,038 (5.2%) | 1,334 (8.1%) |
| $35,000 to $39,999 | 944 (4.8%) | 864 (5.2%) |
| $40,000 to $44,999 | 1,095 (5.5%) | 947 (5.8%) |
| $45,000 to $49,999 | 1,364 (6.9%) | 1,031 (6.3%) |
| $50,000 to $54,999 | 856 (4.3%) | 391 (2.4%) |
| $55,000 to $64,999 | 1,498 (7.6%) | 930 (5.7%) |
| $65,000 to $74,999 | 1,008 (5.1%) | 955 (5.8%) |
| $75,000 to $99,999 | 1,532 (7.7%) | 841 (5.1%) |
| $100,000+ | 3,087 (15.6%) | 862 (5.2%) |
| Total | 19,761 (100.0%) | 16,452 (100.0%) |
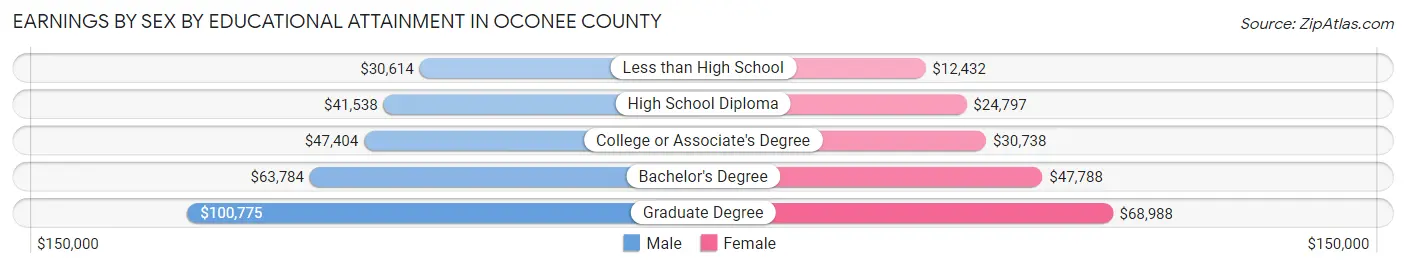
Earnings by Sex by Educational Attainment in Oconee County
Average earnings in Oconee County are $48,038 for men and $32,434 for women, a difference of 32.5%. Men with an educational attainment of graduate degree enjoy the highest average annual earnings of $100,775, while those with less than high school education earn the least with $30,614. Women with an educational attainment of graduate degree earn the most with the average annual earnings of $68,988, while those with less than high school education have the smallest earnings of $12,432.
| Educational Attainment | Male Income | Female Income |
| Less than High School | $30,614 | $12,432 |
| High School Diploma | $41,538 | $24,797 |
| College or Associate's Degree | $47,404 | $30,738 |
| Bachelor's Degree | $63,784 | $47,788 |
| Graduate Degree | $100,775 | $68,988 |
| Total | $48,038 | $32,434 |
Family Income in Oconee County
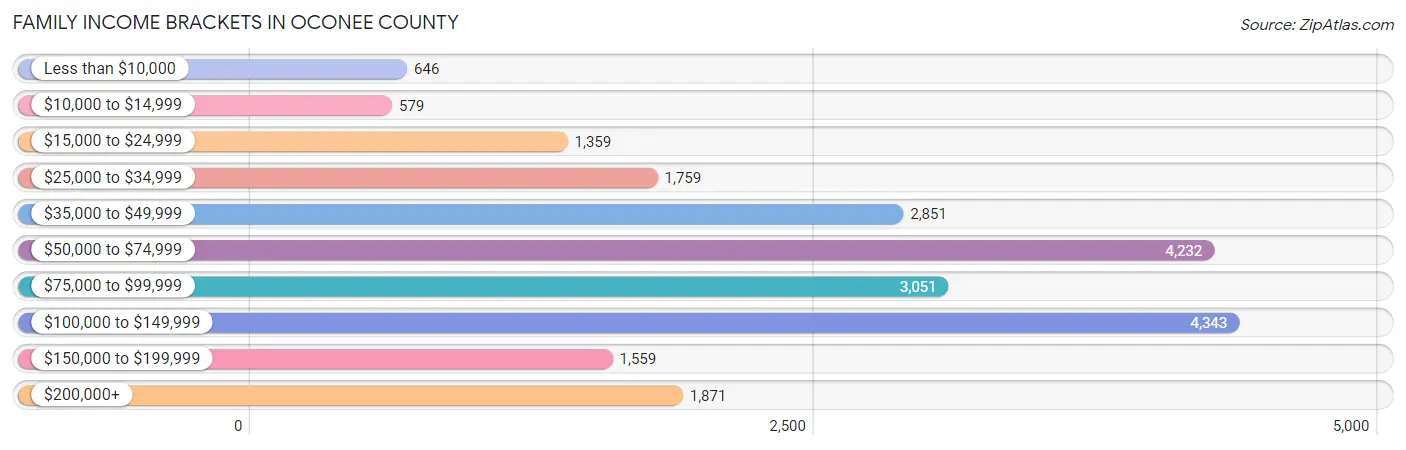
Family Income Brackets in Oconee County
According to the Oconee County family income data, there are 4,343 families falling into the $100,000 to $149,999 income range, which is the most common income bracket and makes up 19.5% of all families. Conversely, the $10,000 to $14,999 income bracket is the least frequent group with only 579 families (2.6%) belonging to this category.
| Income Bracket | # Families | % Families |
| Less than $10,000 | 646 | 2.9% |
| $10,000 to $14,999 | 579 | 2.6% |
| $15,000 to $24,999 | 1,359 | 6.1% |
| $25,000 to $34,999 | 1,759 | 7.9% |
| $35,000 to $49,999 | 2,851 | 12.8% |
| $50,000 to $74,999 | 4,232 | 19.0% |
| $75,000 to $99,999 | 3,051 | 13.7% |
| $100,000 to $149,999 | 4,343 | 19.5% |
| $150,000 to $199,999 | 1,559 | 7.0% |
| $200,000+ | 1,871 | 8.4% |
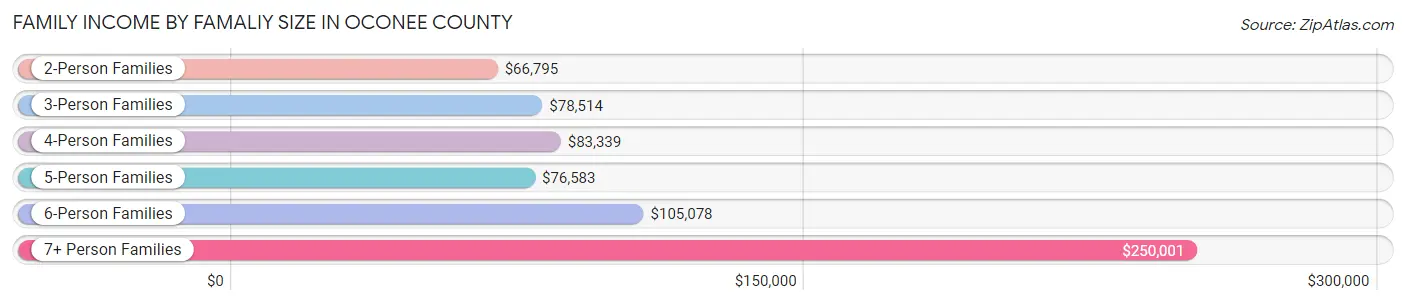
Family Income by Famaliy Size in Oconee County
7+ person families (127 | 0.6%) account for the highest median family income in Oconee County with $250,001 per family, while 7+ person families (127 | 0.6%) have the highest median income of $35,714 per family member.
| Income Bracket | # Families | Median Income |
| 2-Person Families | 12,502 (56.1%) | $66,795 |
| 3-Person Families | 4,959 (22.3%) | $78,514 |
| 4-Person Families | 3,081 (13.8%) | $83,339 |
| 5-Person Families | 1,259 (5.7%) | $76,583 |
| 6-Person Families | 344 (1.5%) | $105,078 |
| 7+ Person Families | 127 (0.6%) | $250,001 |
| Total | 22,272 (100.0%) | $73,382 |
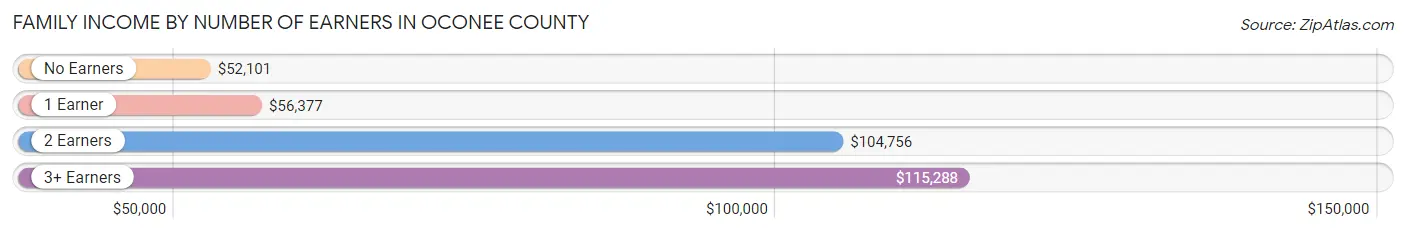
Family Income by Number of Earners in Oconee County
The median family income in Oconee County is $73,382, with families comprising 3+ earners (1,610) having the highest median family income of $115,288, while families with no earners (5,915) have the lowest median family income of $52,101, accounting for 7.2% and 26.6% of families, respectively.
| Number of Earners | # Families | Median Income |
| No Earners | 5,915 (26.6%) | $52,101 |
| 1 Earner | 7,601 (34.1%) | $56,377 |
| 2 Earners | 7,146 (32.1%) | $104,756 |
| 3+ Earners | 1,610 (7.2%) | $115,288 |
| Total | 22,272 (100.0%) | $73,382 |
Household Income in Oconee County
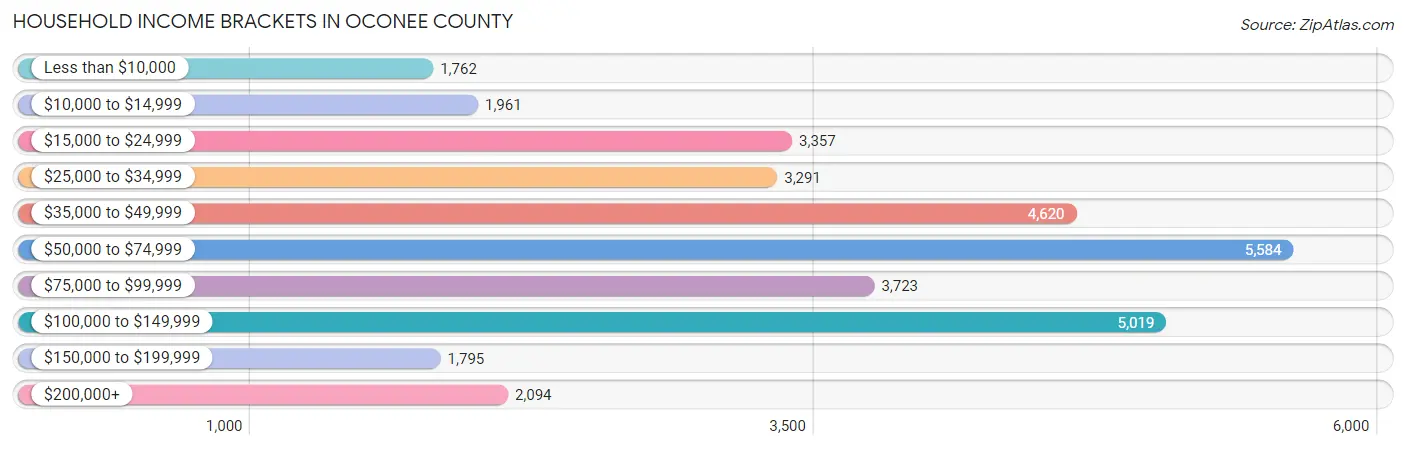
Household Income Brackets in Oconee County
With 5,584 households falling in the category, the $50,000 to $74,999 income range is the most frequent in Oconee County, accounting for 16.8% of all households. In contrast, only 1,762 households (5.3%) fall into the less than $10,000 income bracket, making it the least populous group.
| Income Bracket | # Households | % Households |
| Less than $10,000 | 1,762 | 5.3% |
| $10,000 to $14,999 | 1,961 | 5.9% |
| $15,000 to $24,999 | 3,357 | 10.1% |
| $25,000 to $34,999 | 3,291 | 9.9% |
| $35,000 to $49,999 | 4,620 | 13.9% |
| $50,000 to $74,999 | 5,584 | 16.8% |
| $75,000 to $99,999 | 3,723 | 11.2% |
| $100,000 to $149,999 | 5,019 | 15.1% |
| $150,000 to $199,999 | 1,795 | 5.4% |
| $200,000+ | 2,094 | 6.3% |
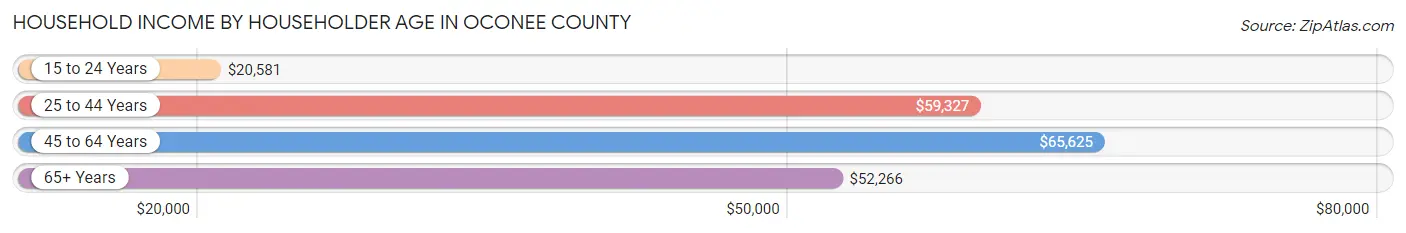
Household Income by Householder Age in Oconee County
The median household income in Oconee County is $56,710, with the highest median household income of $65,625 found in the 45 to 64 years age bracket for the primary householder. A total of 12,463 households (37.5%) fall into this category. Meanwhile, the 15 to 24 years age bracket for the primary householder has the lowest median household income of $20,581, with 1,262 households (3.8%) in this group.
| Income Bracket | # Households | Median Income |
| 15 to 24 Years | 1,262 (3.8%) | $20,581 |
| 25 to 44 Years | 8,151 (24.5%) | $59,327 |
| 45 to 64 Years | 12,463 (37.5%) | $65,625 |
| 65+ Years | 11,364 (34.2%) | $52,266 |
| Total | 33,240 (100.0%) | $56,710 |
Poverty in Oconee County
Income Below Poverty by Sex and Age in Oconee County
With 15.5% poverty level for males and 15.9% for females among the residents of Oconee County, 15 year old males and 18 to 24 year old females are the most vulnerable to poverty, with 148 males (34.4%) and 1,088 females (40.8%) in their respective age groups living below the poverty level.
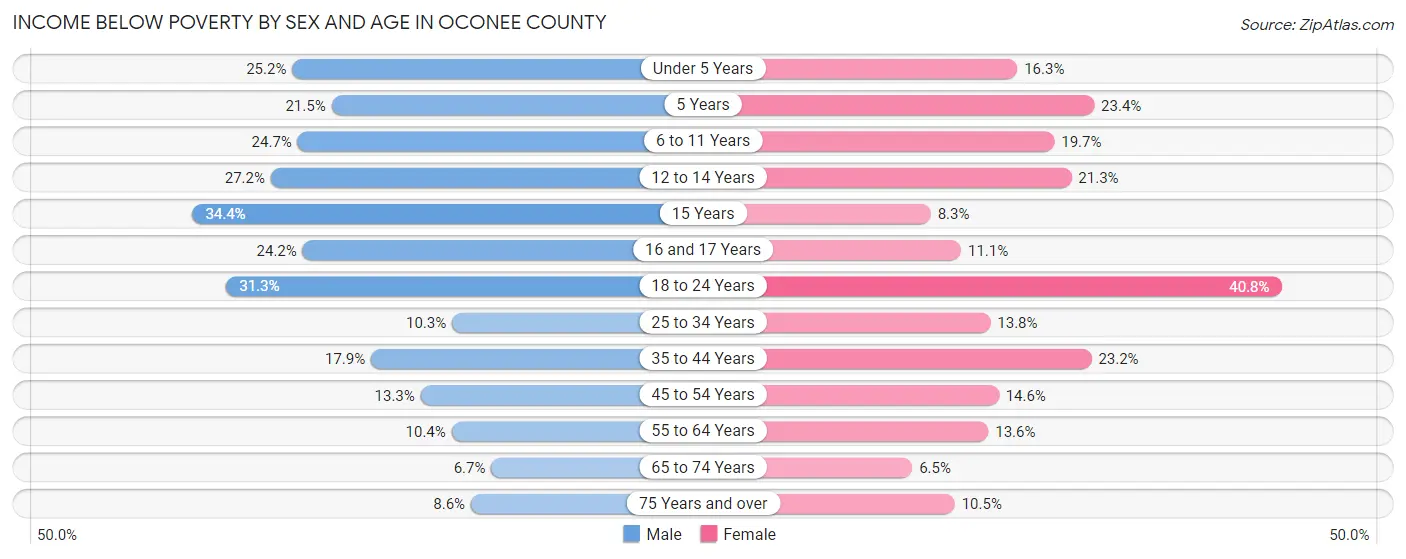
| Age Bracket | Male | Female |
| Under 5 Years | 420 (25.2%) | 304 (16.3%) |
| 5 Years | 88 (21.5%) | 78 (23.4%) |
| 6 to 11 Years | 623 (24.7%) | 507 (19.7%) |
| 12 to 14 Years | 388 (27.2%) | 277 (21.3%) |
| 15 Years | 148 (34.4%) | 40 (8.3%) |
| 16 and 17 Years | 228 (24.2%) | 117 (11.1%) |
| 18 to 24 Years | 983 (31.3%) | 1,088 (40.8%) |
| 25 to 34 Years | 459 (10.3%) | 633 (13.8%) |
| 35 to 44 Years | 689 (17.8%) | 933 (23.2%) |
| 45 to 54 Years | 641 (13.3%) | 688 (14.6%) |
| 55 to 64 Years | 626 (10.4%) | 848 (13.6%) |
| 65 to 74 Years | 362 (6.7%) | 384 (6.5%) |
| 75 Years and over | 275 (8.6%) | 412 (10.5%) |
| Total | 5,930 (15.5%) | 6,309 (15.9%) |
Income Above Poverty by Sex and Age in Oconee County
According to the poverty statistics in Oconee County, males aged 65 to 74 years and females aged 65 to 74 years are the age groups that are most secure financially, with 93.3% of males and 93.5% of females in these age groups living above the poverty line.
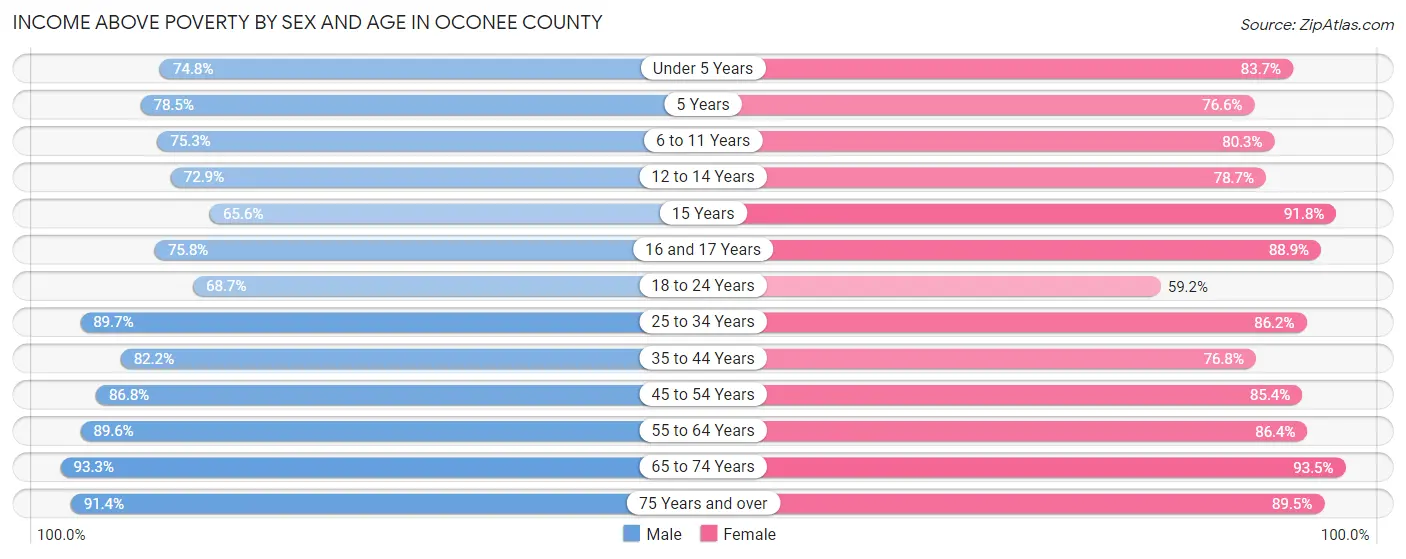
| Age Bracket | Male | Female |
| Under 5 Years | 1,249 (74.8%) | 1,563 (83.7%) |
| 5 Years | 321 (78.5%) | 255 (76.6%) |
| 6 to 11 Years | 1,903 (75.3%) | 2,064 (80.3%) |
| 12 to 14 Years | 1,041 (72.9%) | 1,023 (78.7%) |
| 15 Years | 282 (65.6%) | 445 (91.7%) |
| 16 and 17 Years | 714 (75.8%) | 940 (88.9%) |
| 18 to 24 Years | 2,160 (68.7%) | 1,579 (59.2%) |
| 25 to 34 Years | 3,985 (89.7%) | 3,957 (86.2%) |
| 35 to 44 Years | 3,171 (82.2%) | 3,094 (76.8%) |
| 45 to 54 Years | 4,198 (86.8%) | 4,038 (85.4%) |
| 55 to 64 Years | 5,413 (89.6%) | 5,387 (86.4%) |
| 65 to 74 Years | 5,050 (93.3%) | 5,489 (93.5%) |
| 75 Years and over | 2,929 (91.4%) | 3,518 (89.5%) |
| Total | 32,416 (84.5%) | 33,352 (84.1%) |
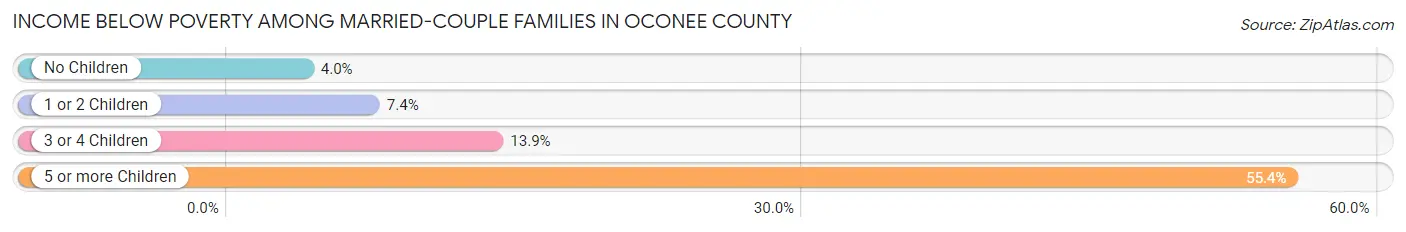
Income Below Poverty Among Married-Couple Families in Oconee County
The poverty statistics for married-couple families in Oconee County show that 5.5% or 947 of the total 17,194 families live below the poverty line. Families with 5 or more children have the highest poverty rate of 55.4%, comprising of 36 families. On the other hand, families with no children have the lowest poverty rate of 4.0%, which includes 478 families.
| Children | Above Poverty | Below Poverty |
| No Children | 11,606 (96.0%) | 478 (4.0%) |
| 1 or 2 Children | 3,823 (92.6%) | 306 (7.4%) |
| 3 or 4 Children | 789 (86.1%) | 127 (13.9%) |
| 5 or more Children | 29 (44.6%) | 36 (55.4%) |
| Total | 16,247 (94.5%) | 947 (5.5%) |
Income Below Poverty Among Single-Parent Households in Oconee County
According to the poverty data in Oconee County, 16.5% or 212 single-father households and 26.9% or 1,021 single-mother households are living below the poverty line. Among single-father households, those with 3 or 4 children have the highest poverty rate, with 56 households (40.9%) experiencing poverty. Likewise, among single-mother households, those with 3 or 4 children have the highest poverty rate, with 172 households (68.0%) falling below the poverty line.
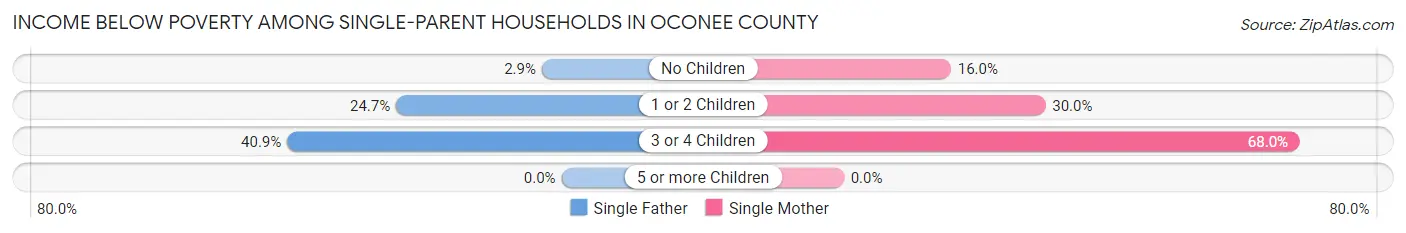
| Children | Single Father | Single Mother |
| No Children | 17 (2.9%) | 243 (16.0%) |
| 1 or 2 Children | 139 (24.6%) | 606 (30.0%) |
| 3 or 4 Children | 56 (40.9%) | 172 (68.0%) |
| 5 or more Children | 0 (0.0%) | 0 (0.0%) |
| Total | 212 (16.5%) | 1,021 (26.9%) |
Income Below Poverty Among Married-Couple vs Single-Parent Households in Oconee County
The poverty data for Oconee County shows that 947 of the married-couple family households (5.5%) and 1,233 of the single-parent households (24.3%) are living below the poverty level. Within the married-couple family households, those with 5 or more children have the highest poverty rate, with 36 households (55.4%) falling below the poverty line. Among the single-parent households, those with 3 or 4 children have the highest poverty rate, with 228 household (58.5%) living below poverty.
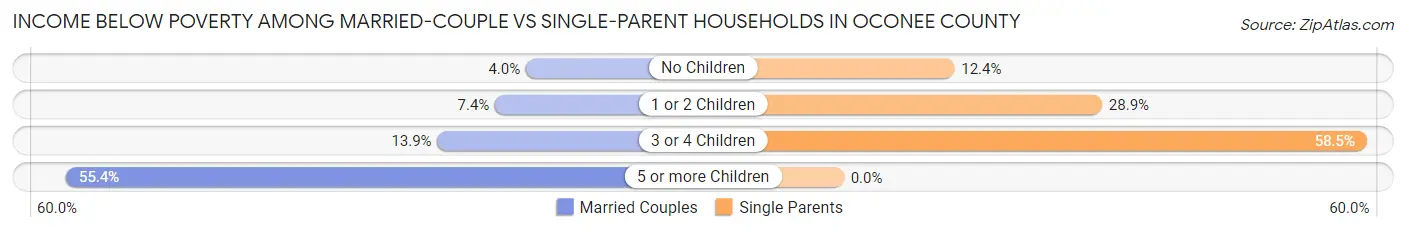
| Children | Married-Couple Families | Single-Parent Households |
| No Children | 478 (4.0%) | 260 (12.4%) |
| 1 or 2 Children | 306 (7.4%) | 745 (28.9%) |
| 3 or 4 Children | 127 (13.9%) | 228 (58.5%) |
| 5 or more Children | 36 (55.4%) | 0 (0.0%) |
| Total | 947 (5.5%) | 1,233 (24.3%) |
Race in Oconee County
The most populous races in Oconee County are White / Caucasian (67,134 | 85.2%), Black / African American (5,312 | 6.7%), and Hispanic or Latino (4,586 | 5.8%).
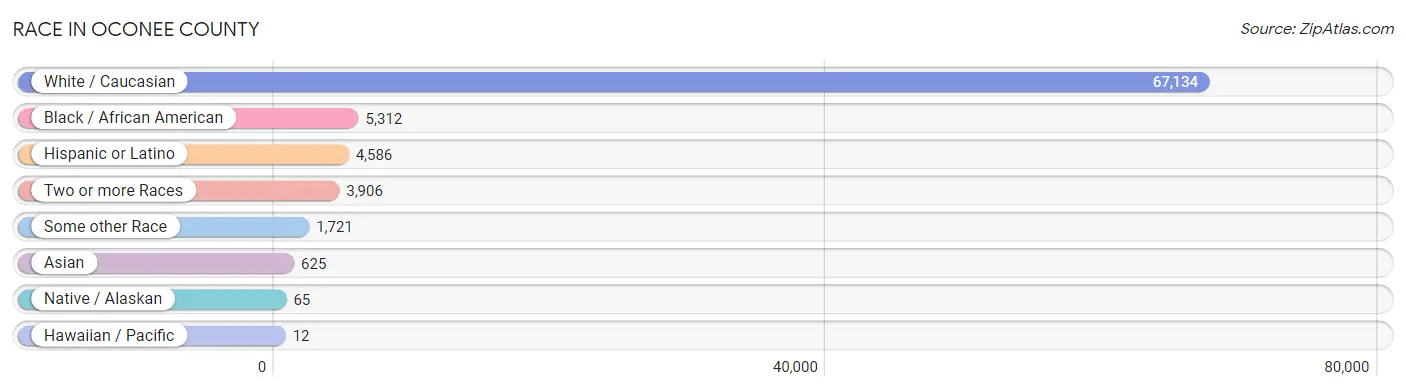
| Race | # Population | % Population |
| Asian | 625 | 0.8% |
| Black / African American | 5,312 | 6.7% |
| Hawaiian / Pacific | 12 | 0.0% |
| Hispanic or Latino | 4,586 | 5.8% |
| Native / Alaskan | 65 | 0.1% |
| White / Caucasian | 67,134 | 85.2% |
| Two or more Races | 3,906 | 5.0% |
| Some other Race | 1,721 | 2.2% |
| Total | 78,775 | 100.0% |
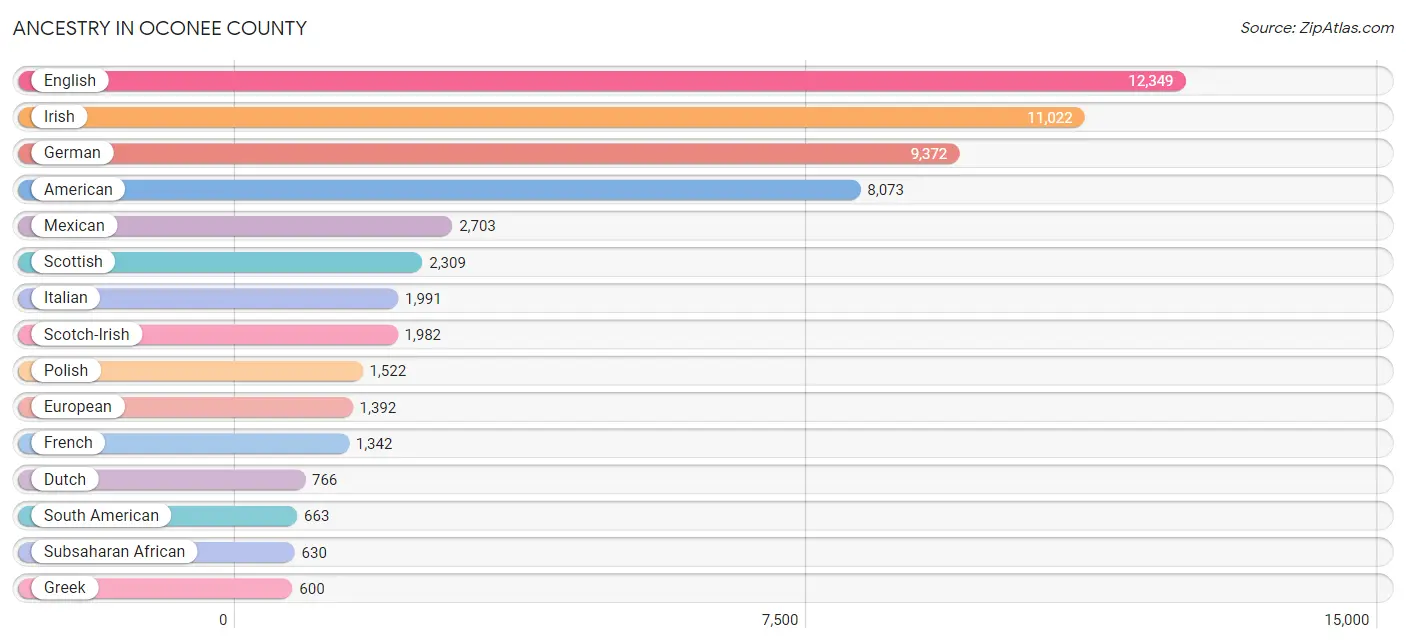
Ancestry in Oconee County
The most populous ancestries reported in Oconee County are English (12,349 | 15.7%), Irish (11,022 | 14.0%), German (9,372 | 11.9%), American (8,073 | 10.2%), and Mexican (2,703 | 3.4%), together accounting for 55.2% of all Oconee County residents.
| Ancestry | # Population | % Population |
| African | 315 | 0.4% |
| American | 8,073 | 10.2% |
| Apache | 5 | 0.0% |
| Arab | 62 | 0.1% |
| Austrian | 64 | 0.1% |
| Belgian | 67 | 0.1% |
| Bhutanese | 128 | 0.2% |
| Blackfeet | 6 | 0.0% |
| Bolivian | 334 | 0.4% |
| Brazilian | 36 | 0.1% |
| British | 494 | 0.6% |
| Bulgarian | 21 | 0.0% |
| Burmese | 29 | 0.0% |
| Canadian | 57 | 0.1% |
| Celtic | 44 | 0.1% |
| Central American | 329 | 0.4% |
| Cherokee | 523 | 0.7% |
| Colombian | 28 | 0.0% |
| Comanche | 1 | 0.0% |
| Creek | 2 | 0.0% |
| Croatian | 28 | 0.0% |
| Cuban | 111 | 0.1% |
| Czech | 79 | 0.1% |
| Czechoslovakian | 141 | 0.2% |
| Danish | 150 | 0.2% |
| Dominican | 94 | 0.1% |
| Dutch | 766 | 1.0% |
| Eastern European | 82 | 0.1% |
| Ecuadorian | 288 | 0.4% |
| Egyptian | 13 | 0.0% |
| English | 12,349 | 15.7% |
| European | 1,392 | 1.8% |
| Finnish | 43 | 0.1% |
| French | 1,342 | 1.7% |
| French Canadian | 135 | 0.2% |
| German | 9,372 | 11.9% |
| Ghanaian | 49 | 0.1% |
| Greek | 600 | 0.8% |
| Guamanian / Chamorro | 12 | 0.0% |
| Guatemalan | 80 | 0.1% |
| Honduran | 207 | 0.3% |
| Hungarian | 97 | 0.1% |
| Indian (Asian) | 112 | 0.1% |
| Iranian | 14 | 0.0% |
| Irish | 11,022 | 14.0% |
| Iroquois | 18 | 0.0% |
| Italian | 1,991 | 2.5% |
| Jamaican | 1 | 0.0% |
| Korean | 120 | 0.2% |
| Laotian | 10 | 0.0% |
| Lithuanian | 104 | 0.1% |
| Menominee | 6 | 0.0% |
| Mexican | 2,703 | 3.4% |
| Mexican American Indian | 12 | 0.0% |
| Nicaraguan | 11 | 0.0% |
| Nigerian | 49 | 0.1% |
| Northern European | 289 | 0.4% |
| Norwegian | 471 | 0.6% |
| Pakistani | 60 | 0.1% |
| Pennsylvania German | 240 | 0.3% |
| Peruvian | 4 | 0.0% |
| Polish | 1,522 | 1.9% |
| Portuguese | 95 | 0.1% |
| Puerto Rican | 433 | 0.5% |
| Romanian | 216 | 0.3% |
| Russian | 412 | 0.5% |
| Salvadoran | 31 | 0.0% |
| Scandinavian | 374 | 0.5% |
| Scotch-Irish | 1,982 | 2.5% |
| Scottish | 2,309 | 2.9% |
| Serbian | 13 | 0.0% |
| Slovak | 71 | 0.1% |
| Slovene | 21 | 0.0% |
| South African | 243 | 0.3% |
| South American | 663 | 0.8% |
| Spaniard | 38 | 0.1% |
| Sri Lankan | 94 | 0.1% |
| Subsaharan African | 630 | 0.8% |
| Swedish | 351 | 0.4% |
| Swiss | 83 | 0.1% |
| Thai | 354 | 0.4% |
| Ukrainian | 83 | 0.1% |
| Uruguayan | 9 | 0.0% |
| Welsh | 382 | 0.5% | View All 84 Rows |
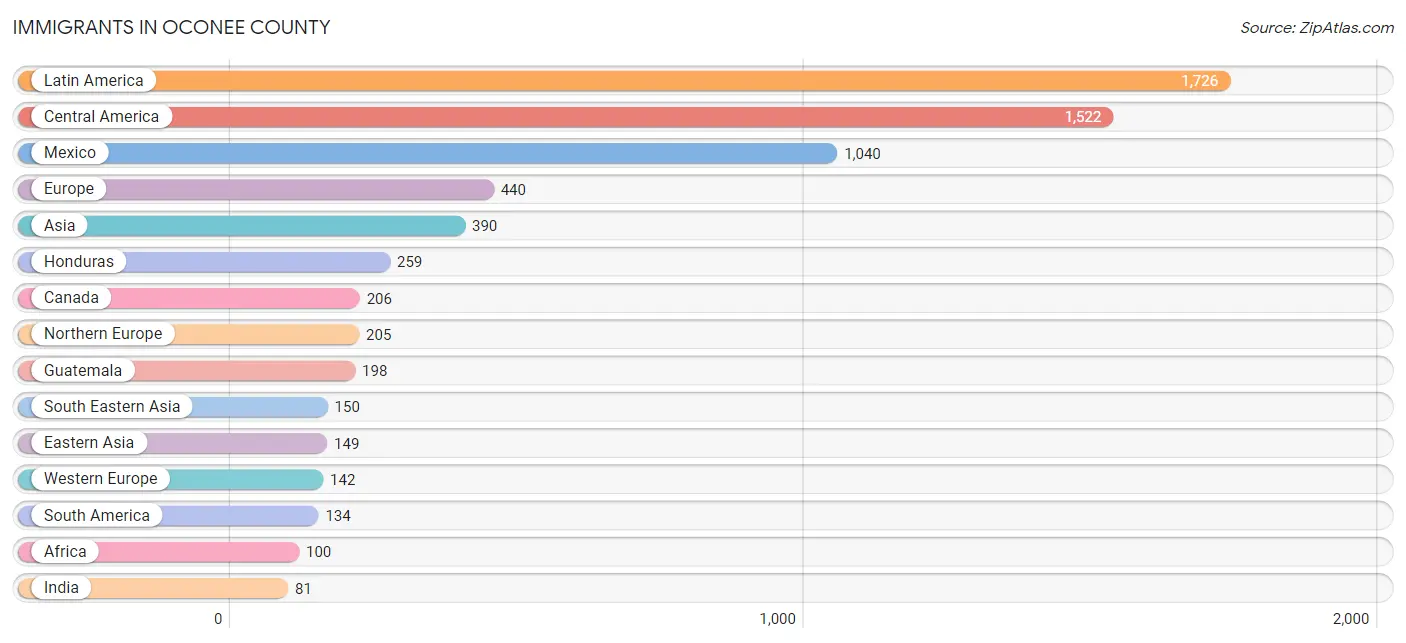
Immigrants in Oconee County
The most numerous immigrant groups reported in Oconee County came from Latin America (1,726 | 2.2%), Central America (1,522 | 1.9%), Mexico (1,040 | 1.3%), Europe (440 | 0.6%), and Asia (390 | 0.5%), together accounting for 6.5% of all Oconee County residents.
| Immigration Origin | # Population | % Population |
| Africa | 100 | 0.1% |
| Asia | 390 | 0.5% |
| Bolivia | 26 | 0.0% |
| Canada | 206 | 0.3% |
| Caribbean | 70 | 0.1% |
| Central America | 1,522 | 1.9% |
| China | 70 | 0.1% |
| Colombia | 19 | 0.0% |
| Cuba | 7 | 0.0% |
| Czechoslovakia | 12 | 0.0% |
| Dominican Republic | 63 | 0.1% |
| Eastern Asia | 149 | 0.2% |
| Eastern Europe | 71 | 0.1% |
| Ecuador | 76 | 0.1% |
| Egypt | 13 | 0.0% |
| El Salvador | 25 | 0.0% |
| England | 44 | 0.1% |
| Europe | 440 | 0.6% |
| France | 72 | 0.1% |
| Germany | 66 | 0.1% |
| Greece | 22 | 0.0% |
| Guatemala | 198 | 0.3% |
| Honduras | 259 | 0.3% |
| Hong Kong | 30 | 0.0% |
| India | 81 | 0.1% |
| Indonesia | 10 | 0.0% |
| Ireland | 43 | 0.1% |
| Japan | 68 | 0.1% |
| Jordan | 10 | 0.0% |
| Korea | 11 | 0.0% |
| Latin America | 1,726 | 2.2% |
| Mexico | 1,040 | 1.3% |
| Northern Africa | 13 | 0.0% |
| Northern Europe | 205 | 0.3% |
| Peru | 4 | 0.0% |
| Philippines | 72 | 0.1% |
| Romania | 17 | 0.0% |
| Russia | 28 | 0.0% |
| South Africa | 14 | 0.0% |
| South America | 134 | 0.2% |
| South Central Asia | 81 | 0.1% |
| South Eastern Asia | 150 | 0.2% |
| Southern Europe | 22 | 0.0% |
| Switzerland | 4 | 0.0% |
| Uruguay | 9 | 0.0% |
| Vietnam | 68 | 0.1% |
| Western Africa | 71 | 0.1% |
| Western Asia | 10 | 0.0% |
| Western Europe | 142 | 0.2% | View All 49 Rows |
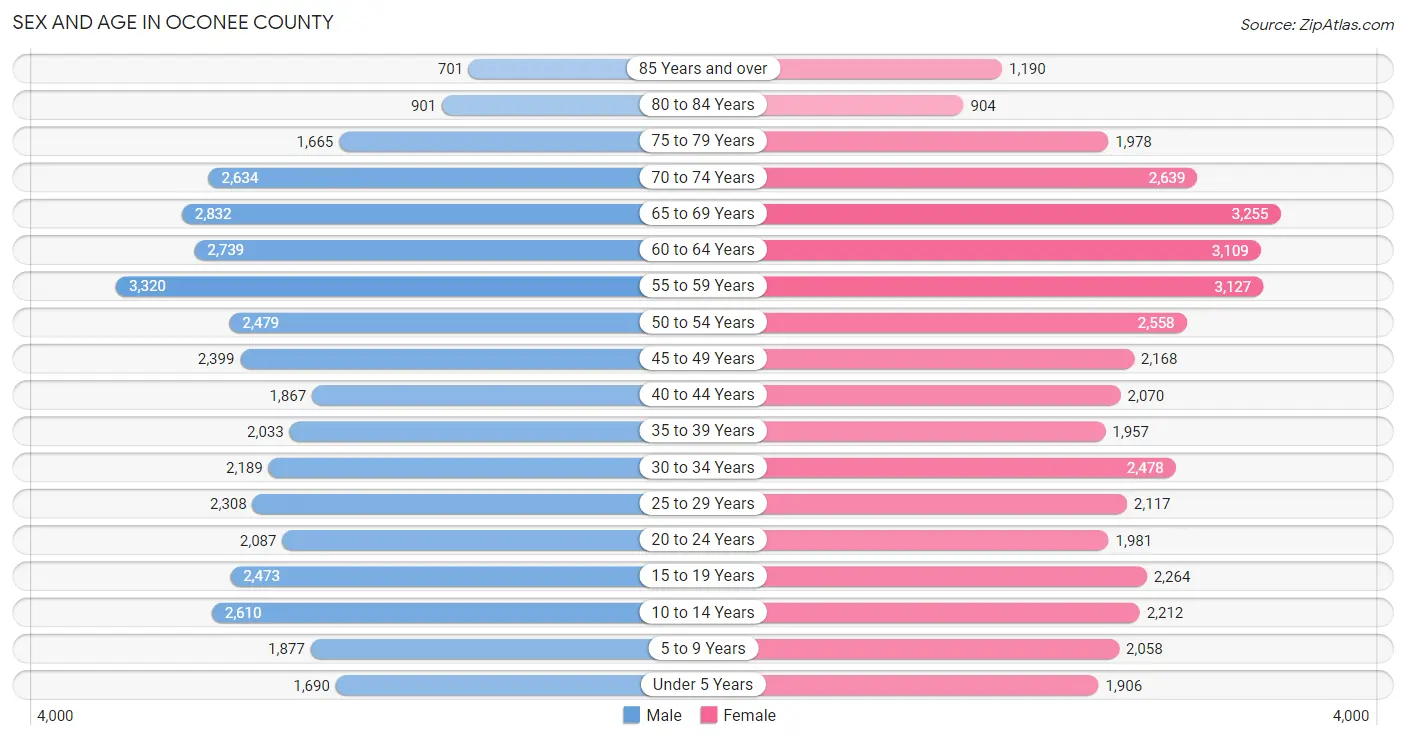
Sex and Age in Oconee County
Sex and Age in Oconee County
The most populous age groups in Oconee County are 55 to 59 Years (3,320 | 8.6%) for men and 65 to 69 Years (3,255 | 8.1%) for women.
| Age Bracket | Male | Female |
| Under 5 Years | 1,690 (4.4%) | 1,906 (4.8%) |
| 5 to 9 Years | 1,877 (4.8%) | 2,058 (5.1%) |
| 10 to 14 Years | 2,610 (6.7%) | 2,212 (5.5%) |
| 15 to 19 Years | 2,473 (6.4%) | 2,264 (5.7%) |
| 20 to 24 Years | 2,087 (5.4%) | 1,981 (5.0%) |
| 25 to 29 Years | 2,308 (5.9%) | 2,117 (5.3%) |
| 30 to 34 Years | 2,189 (5.6%) | 2,478 (6.2%) |
| 35 to 39 Years | 2,033 (5.2%) | 1,957 (4.9%) |
| 40 to 44 Years | 1,867 (4.8%) | 2,070 (5.2%) |
| 45 to 49 Years | 2,399 (6.2%) | 2,168 (5.4%) |
| 50 to 54 Years | 2,479 (6.4%) | 2,558 (6.4%) |
| 55 to 59 Years | 3,320 (8.6%) | 3,127 (7.8%) |
| 60 to 64 Years | 2,739 (7.1%) | 3,109 (7.8%) |
| 65 to 69 Years | 2,832 (7.3%) | 3,255 (8.1%) |
| 70 to 74 Years | 2,634 (6.8%) | 2,639 (6.6%) |
| 75 to 79 Years | 1,665 (4.3%) | 1,978 (5.0%) |
| 80 to 84 Years | 901 (2.3%) | 904 (2.3%) |
| 85 Years and over | 701 (1.8%) | 1,190 (3.0%) |
| Total | 38,804 (100.0%) | 39,971 (100.0%) |
Families and Households in Oconee County
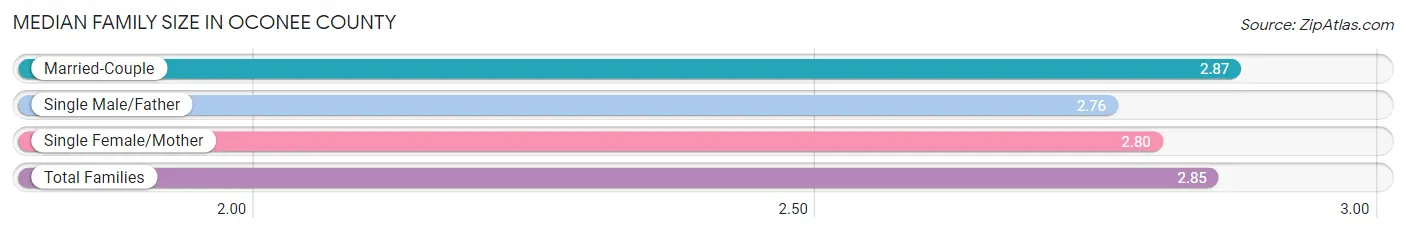
Median Family Size in Oconee County
The median family size in Oconee County is 2.85 persons per family, with married-couple families (17,194 | 77.2%) accounting for the largest median family size of 2.87 persons per family. On the other hand, single male/father families (1,285 | 5.8%) represent the smallest median family size with 2.76 persons per family.
| Family Type | # Families | Family Size |
| Married-Couple | 17,194 (77.2%) | 2.87 |
| Single Male/Father | 1,285 (5.8%) | 2.76 |
| Single Female/Mother | 3,793 (17.0%) | 2.80 |
| Total Families | 22,272 (100.0%) | 2.85 |
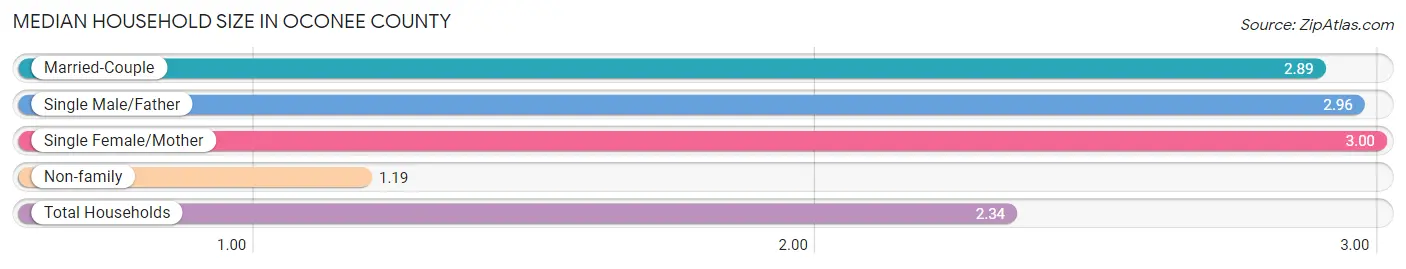
Median Household Size in Oconee County
The median household size in Oconee County is 2.34 persons per household, with single female/mother households (3,793 | 11.4%) accounting for the largest median household size of 3 persons per household. non-family households (10,968 | 33.0%) represent the smallest median household size with 1.19 persons per household.
| Household Type | # Households | Household Size |
| Married-Couple | 17,194 (51.7%) | 2.89 |
| Single Male/Father | 1,285 (3.9%) | 2.96 |
| Single Female/Mother | 3,793 (11.4%) | 3.00 |
| Non-family | 10,968 (33.0%) | 1.19 |
| Total Households | 33,240 (100.0%) | 2.34 |
Household Size by Marriage Status in Oconee County
Out of a total of 33,240 households in Oconee County, 22,272 (67.0%) are family households, while 10,968 (33.0%) are nonfamily households. The most numerous type of family households are 2-person households, comprising 11,941, and the most common type of nonfamily households are 1-person households, comprising 9,557.
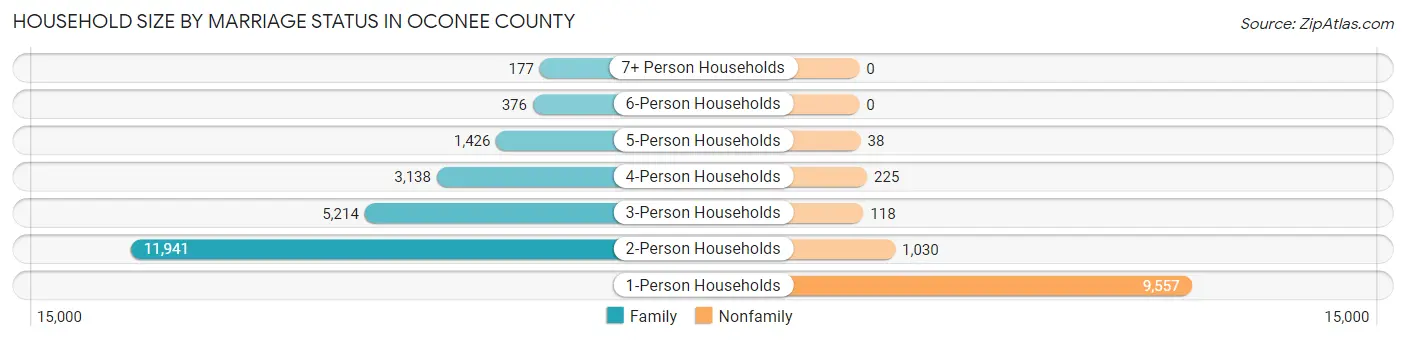
| Household Size | Family Households | Nonfamily Households |
| 1-Person Households | - | 9,557 (28.7%) |
| 2-Person Households | 11,941 (35.9%) | 1,030 (3.1%) |
| 3-Person Households | 5,214 (15.7%) | 118 (0.4%) |
| 4-Person Households | 3,138 (9.4%) | 225 (0.7%) |
| 5-Person Households | 1,426 (4.3%) | 38 (0.1%) |
| 6-Person Households | 376 (1.1%) | 0 (0.0%) |
| 7+ Person Households | 177 (0.5%) | 0 (0.0%) |
| Total | 22,272 (67.0%) | 10,968 (33.0%) |
Female Fertility in Oconee County
Fertility by Age in Oconee County
Average fertility rate in Oconee County is 40.0 births per 1,000 women. Women in the age bracket of 20 to 34 years have the highest fertility rate with 73.0 births per 1,000 women. Women in the age bracket of 20 to 34 years acount for 76.8% of all women with births.
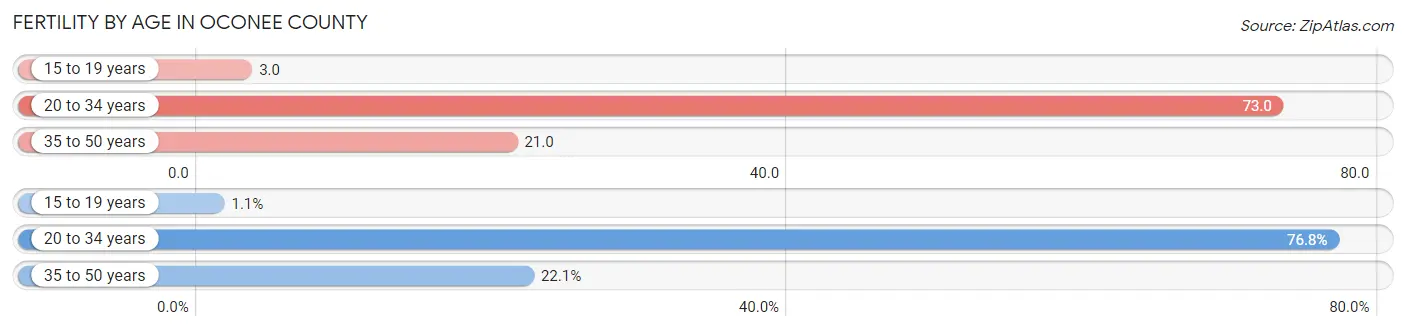
| Age Bracket | Women with Births | Births / 1,000 Women |
| 15 to 19 years | 7 (1.1%) | 3.0 |
| 20 to 34 years | 479 (76.8%) | 73.0 |
| 35 to 50 years | 138 (22.1%) | 21.0 |
| Total | 624 (100.0%) | 40.0 |
Fertility by Age by Marriage Status in Oconee County
80.3% of women with births (624) in Oconee County are married. The highest percentage of unmarried women with births falls into 15 to 19 years age bracket with 100.0% of them unmarried at the time of birth, while the lowest percentage of unmarried women with births belong to 20 to 34 years age bracket with 14.6% of them unmarried.
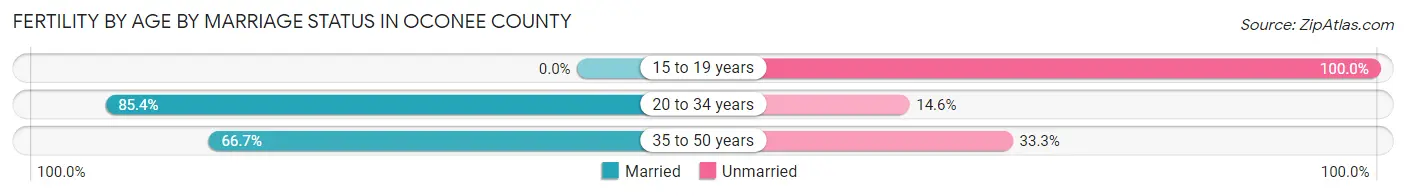
| Age Bracket | Married | Unmarried |
| 15 to 19 years | 0 (0.0%) | 7 (100.0%) |
| 20 to 34 years | 409 (85.4%) | 70 (14.6%) |
| 35 to 50 years | 92 (66.7%) | 46 (33.3%) |
| Total | 501 (80.3%) | 123 (19.7%) |
Fertility by Education in Oconee County
Average fertility rate in Oconee County is 40.0 births per 1,000 women. Women with the education attainment of bachelor's degree have the highest fertility rate of 93.0 births per 1,000 women, while women with the education attainment of graduate degree have the lowest fertility at 12.0 births per 1,000 women. Women with the education attainment of college or associate's degree represent 34.3% of all women with births.
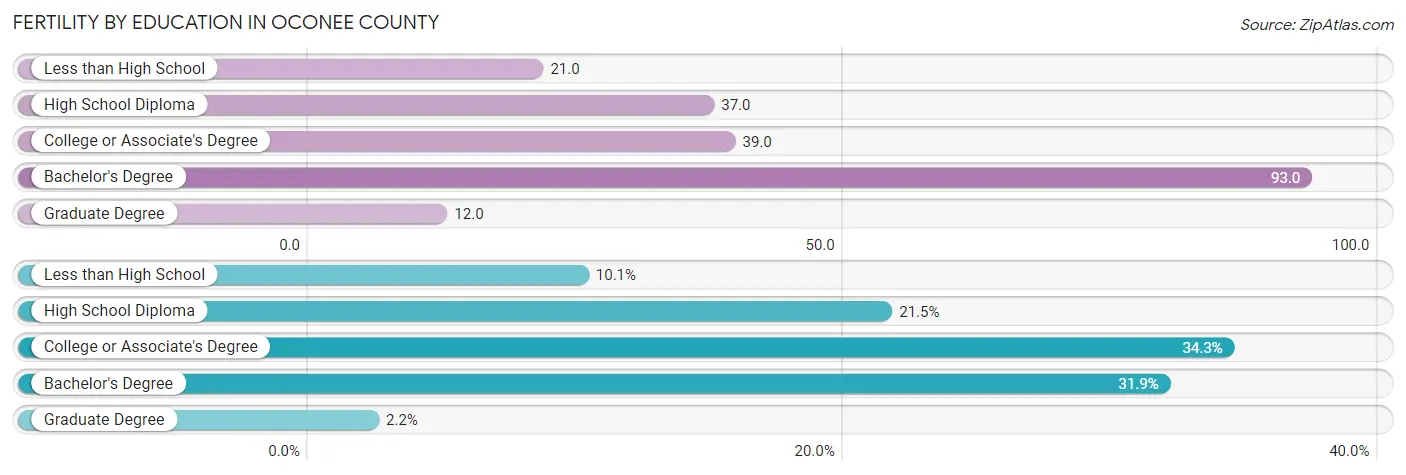
| Educational Attainment | Women with Births | Births / 1,000 Women |
| Less than High School | 63 (10.1%) | 21.0 |
| High School Diploma | 134 (21.5%) | 37.0 |
| College or Associate's Degree | 214 (34.3%) | 39.0 |
| Bachelor's Degree | 199 (31.9%) | 93.0 |
| Graduate Degree | 14 (2.2%) | 12.0 |
| Total | 624 (100.0%) | 40.0 |
Fertility by Education by Marriage Status in Oconee County
19.7% of women with births in Oconee County are unmarried. Women with the educational attainment of graduate degree are most likely to be married with 100.0% of them married at childbirth, while women with the educational attainment of high school diploma are least likely to be married with 45.5% of them unmarried at childbirth.
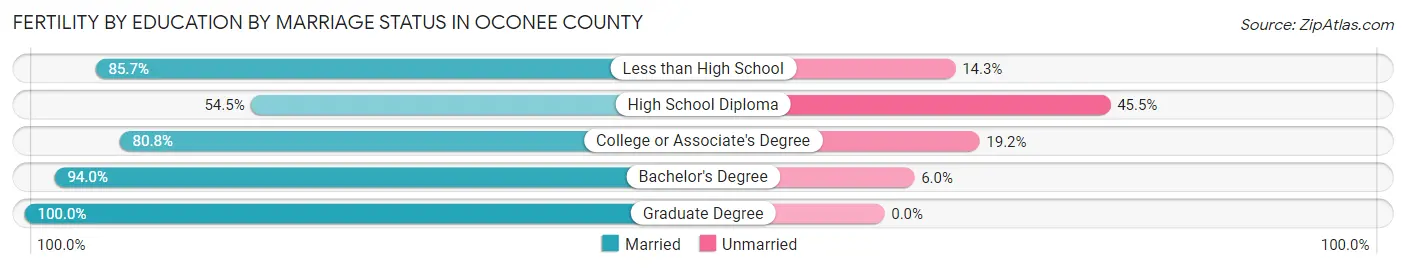
| Educational Attainment | Married | Unmarried |
| Less than High School | 54 (85.7%) | 9 (14.3%) |
| High School Diploma | 73 (54.5%) | 61 (45.5%) |
| College or Associate's Degree | 173 (80.8%) | 41 (19.2%) |
| Bachelor's Degree | 187 (94.0%) | 12 (6.0%) |
| Graduate Degree | 14 (100.0%) | 0 (0.0%) |
| Total | 501 (80.3%) | 123 (19.7%) |
Employment Characteristics in Oconee County
Employment by Class of Employer in Oconee County
Among the 31,671 employed individuals in Oconee County, private company employees (20,595 | 65.0%), self-employed (not incorporated) (3,135 | 9.9%), and not-for-profit organizations (2,488 | 7.9%) make up the most common classes of employment.
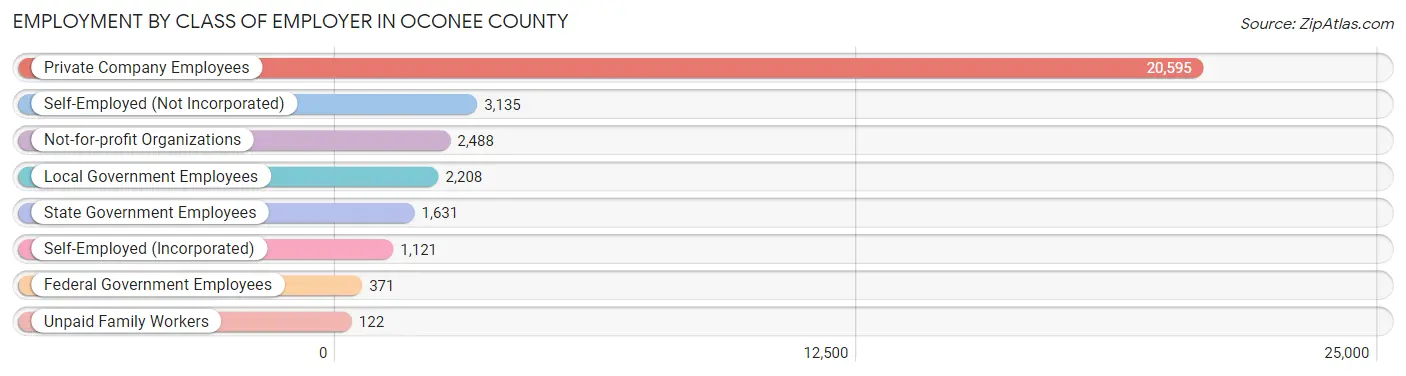
| Employer Class | # Employees | % Employees |
| Private Company Employees | 20,595 | 65.0% |
| Self-Employed (Incorporated) | 1,121 | 3.5% |
| Self-Employed (Not Incorporated) | 3,135 | 9.9% |
| Not-for-profit Organizations | 2,488 | 7.9% |
| Local Government Employees | 2,208 | 7.0% |
| State Government Employees | 1,631 | 5.1% |
| Federal Government Employees | 371 | 1.2% |
| Unpaid Family Workers | 122 | 0.4% |
| Total | 31,671 | 100.0% |
Employment Status by Age in Oconee County
According to the labor force statistics for Oconee County, out of the total population over 16 years of age (65,486), 52.1% or 34,118 individuals are in the labor force, with 5.8% or 1,979 of them unemployed. The age group with the highest labor force participation rate is 25 to 29 years, with 84.1% or 3,721 individuals in the labor force. Within the labor force, the 16 to 19 years age range has the highest percentage of unemployed individuals, with 22.7% or 321 of them being unemployed.
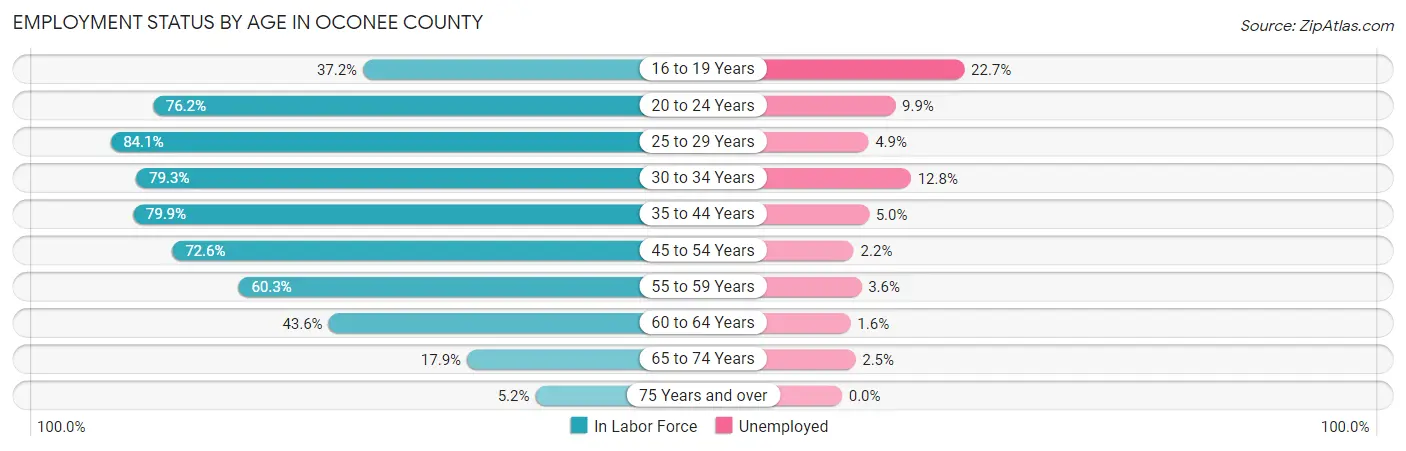
| Age Bracket | In Labor Force | Unemployed |
| 16 to 19 Years | 1,414 (37.2%) | 321 (22.7%) |
| 20 to 24 Years | 3,100 (76.2%) | 307 (9.9%) |
| 25 to 29 Years | 3,721 (84.1%) | 182 (4.9%) |
| 30 to 34 Years | 3,701 (79.3%) | 474 (12.8%) |
| 35 to 44 Years | 6,334 (79.9%) | 317 (5.0%) |
| 45 to 54 Years | 6,973 (72.6%) | 153 (2.2%) |
| 55 to 59 Years | 3,888 (60.3%) | 140 (3.6%) |
| 60 to 64 Years | 2,550 (43.6%) | 41 (1.6%) |
| 65 to 74 Years | 2,033 (17.9%) | 51 (2.5%) |
| 75 Years and over | 382 (5.2%) | 0 (0.0%) |
| Total | 34,118 (52.1%) | 1,979 (5.8%) |
Employment Status by Educational Attainment in Oconee County
According to labor force statistics for Oconee County, 69.8% of individuals (27,165) out of the total population between 25 and 64 years of age (38,918) are in the labor force, with 4.8% or 1,304 of them being unemployed. The group with the highest labor force participation rate are those with the educational attainment of bachelor's degree or higher, with 80.6% or 8,348 individuals in the labor force. Within the labor force, individuals with less than high school education have the highest percentage of unemployment, with 20.4% or 445 of them being unemployed.
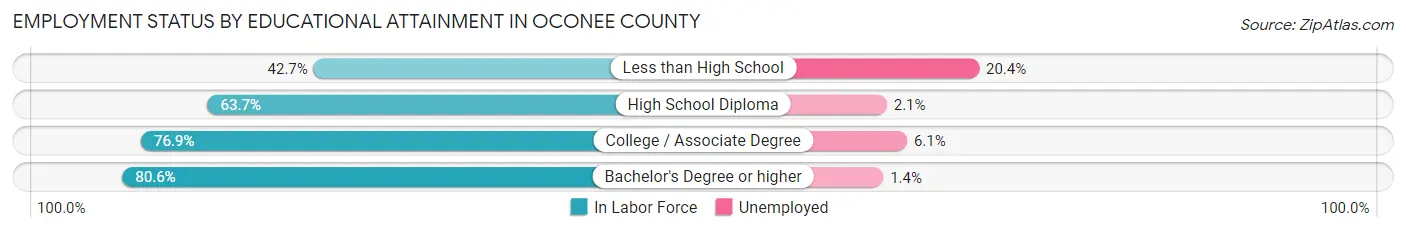
| Educational Attainment | In Labor Force | Unemployed |
| Less than High School | 2,179 (42.7%) | 1,041 (20.4%) |
| High School Diploma | 6,735 (63.7%) | 222 (2.1%) |
| College / Associate Degree | 9,908 (76.9%) | 786 (6.1%) |
| Bachelor's Degree or higher | 8,348 (80.6%) | 145 (1.4%) |
| Total | 27,165 (69.8%) | 1,868 (4.8%) |
Employment Occupations by Sex in Oconee County
Management, Business, Science and Arts Occupations
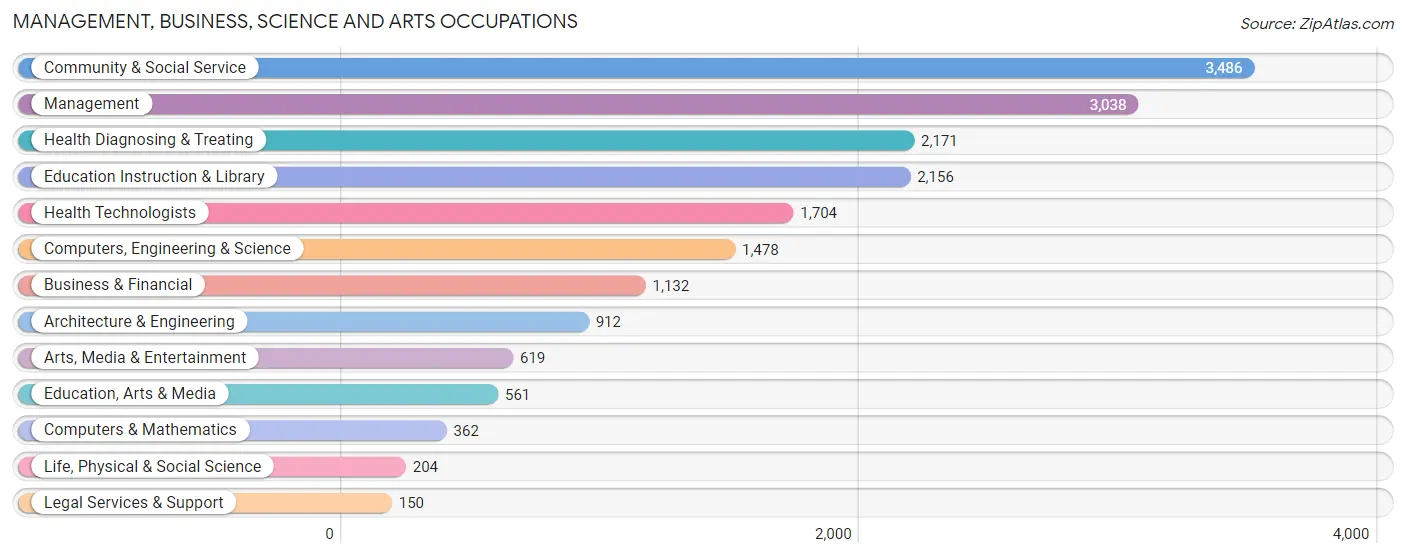
The most common Management, Business, Science and Arts occupations in Oconee County are Community & Social Service (3,486 | 10.9%), Management (3,038 | 9.5%), Health Diagnosing & Treating (2,171 | 6.8%), Education Instruction & Library (2,156 | 6.7%), and Health Technologists (1,704 | 5.3%).
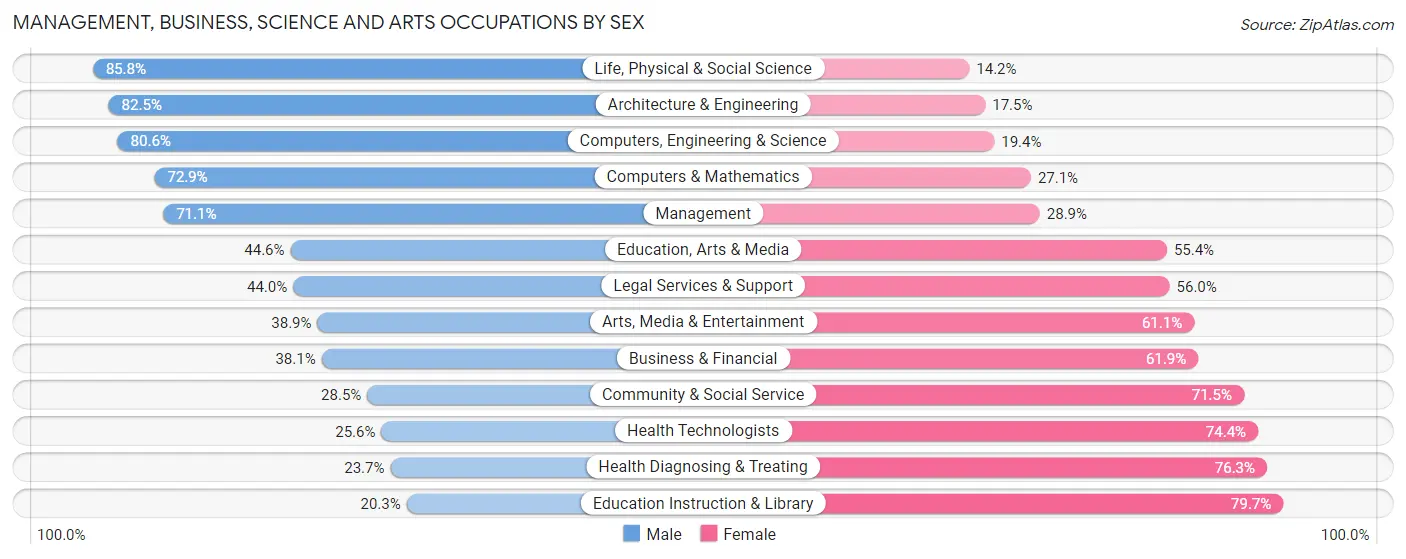
Management, Business, Science and Arts Occupations by Sex
Within the Management, Business, Science and Arts occupations in Oconee County, the most male-oriented occupations are Life, Physical & Social Science (85.8%), Architecture & Engineering (82.5%), and Computers, Engineering & Science (80.6%), while the most female-oriented occupations are Education Instruction & Library (79.7%), Health Diagnosing & Treating (76.3%), and Health Technologists (74.4%).
| Occupation | Male | Female |
| Management | 2,159 (71.1%) | 879 (28.9%) |
| Business & Financial | 431 (38.1%) | 701 (61.9%) |
| Computers, Engineering & Science | 1,191 (80.6%) | 287 (19.4%) |
| Computers & Mathematics | 264 (72.9%) | 98 (27.1%) |
| Architecture & Engineering | 752 (82.5%) | 160 (17.5%) |
| Life, Physical & Social Science | 175 (85.8%) | 29 (14.2%) |
| Community & Social Service | 995 (28.5%) | 2,491 (71.5%) |
| Education, Arts & Media | 250 (44.6%) | 311 (55.4%) |
| Legal Services & Support | 66 (44.0%) | 84 (56.0%) |
| Education Instruction & Library | 438 (20.3%) | 1,718 (79.7%) |
| Arts, Media & Entertainment | 241 (38.9%) | 378 (61.1%) |
| Health Diagnosing & Treating | 515 (23.7%) | 1,656 (76.3%) |
| Health Technologists | 436 (25.6%) | 1,268 (74.4%) |
| Total (Category) | 5,291 (46.8%) | 6,014 (53.2%) |
| Total (Overall) | 17,654 (55.0%) | 14,425 (45.0%) |
Services Occupations
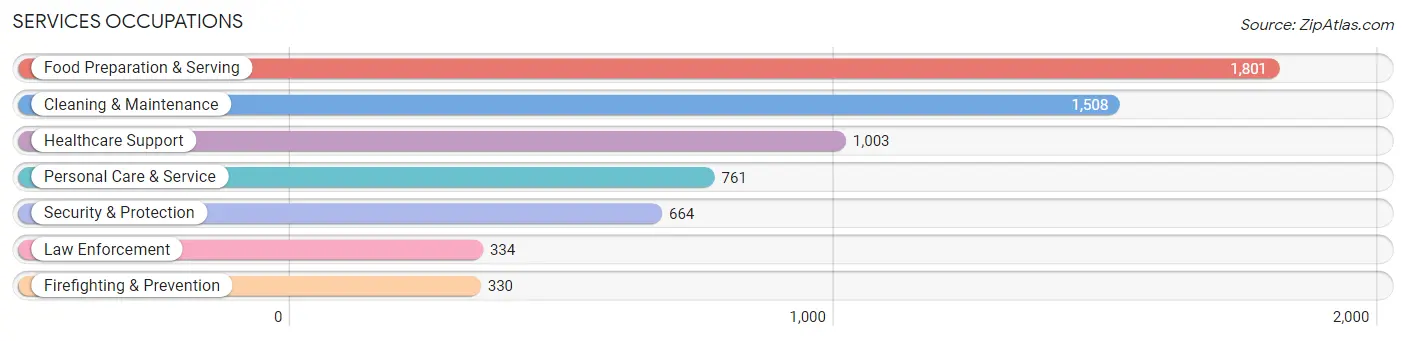
The most common Services occupations in Oconee County are Food Preparation & Serving (1,801 | 5.6%), Cleaning & Maintenance (1,508 | 4.7%), Healthcare Support (1,003 | 3.1%), Personal Care & Service (761 | 2.4%), and Security & Protection (664 | 2.1%).
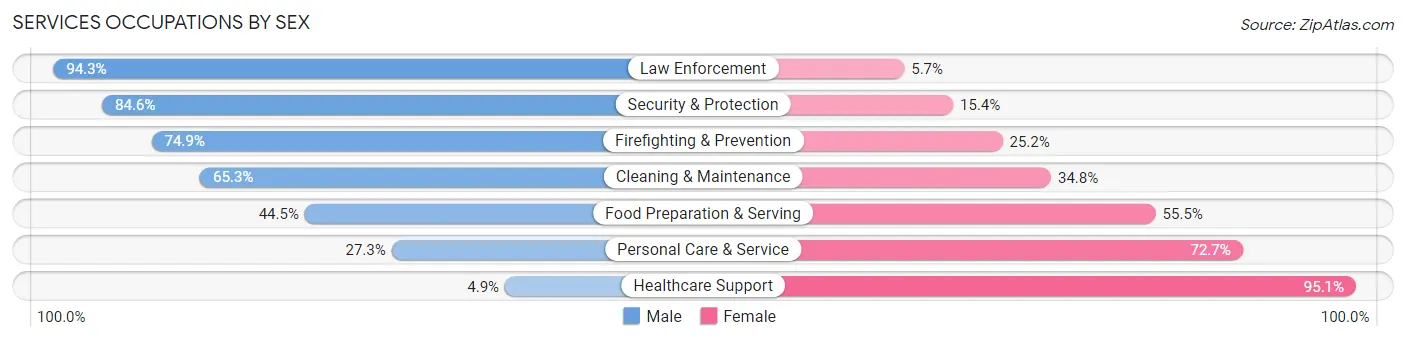
Services Occupations by Sex
Within the Services occupations in Oconee County, the most male-oriented occupations are Law Enforcement (94.3%), Security & Protection (84.6%), and Firefighting & Prevention (74.9%), while the most female-oriented occupations are Healthcare Support (95.1%), Personal Care & Service (72.7%), and Food Preparation & Serving (55.5%).
| Occupation | Male | Female |
| Healthcare Support | 49 (4.9%) | 954 (95.1%) |
| Security & Protection | 562 (84.6%) | 102 (15.4%) |
| Firefighting & Prevention | 247 (74.9%) | 83 (25.2%) |
| Law Enforcement | 315 (94.3%) | 19 (5.7%) |
| Food Preparation & Serving | 802 (44.5%) | 999 (55.5%) |
| Cleaning & Maintenance | 984 (65.2%) | 524 (34.7%) |
| Personal Care & Service | 208 (27.3%) | 553 (72.7%) |
| Total (Category) | 2,605 (45.4%) | 3,132 (54.6%) |
| Total (Overall) | 17,654 (55.0%) | 14,425 (45.0%) |
Sales and Office Occupations
The most common Sales and Office occupations in Oconee County are Sales & Related (3,029 | 9.4%), and Office & Administration (2,591 | 8.1%).

Sales and Office Occupations by Sex

| Occupation | Male | Female |
| Sales & Related | 1,355 (44.7%) | 1,674 (55.3%) |
| Office & Administration | 662 (25.6%) | 1,929 (74.5%) |
| Total (Category) | 2,017 (35.9%) | 3,603 (64.1%) |
| Total (Overall) | 17,654 (55.0%) | 14,425 (45.0%) |
Natural Resources, Construction and Maintenance Occupations
The most common Natural Resources, Construction and Maintenance occupations in Oconee County are Construction & Extraction (2,191 | 6.8%), Installation, Maintenance & Repair (1,248 | 3.9%), and Farming, Fishing & Forestry (136 | 0.4%).

Natural Resources, Construction and Maintenance Occupations by Sex

| Occupation | Male | Female |
| Farming, Fishing & Forestry | 88 (64.7%) | 48 (35.3%) |
| Construction & Extraction | 2,083 (95.1%) | 108 (4.9%) |
| Installation, Maintenance & Repair | 1,228 (98.4%) | 20 (1.6%) |
| Total (Category) | 3,399 (95.1%) | 176 (4.9%) |
| Total (Overall) | 17,654 (55.0%) | 14,425 (45.0%) |
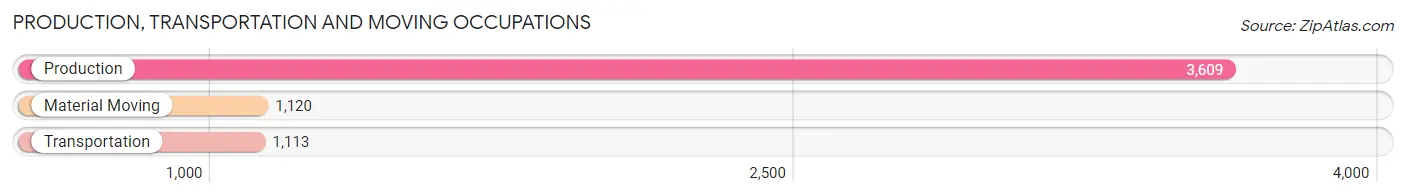
Production, Transportation and Moving Occupations
The most common Production, Transportation and Moving occupations in Oconee County are Production (3,609 | 11.3%), Material Moving (1,120 | 3.5%), and Transportation (1,113 | 3.5%).
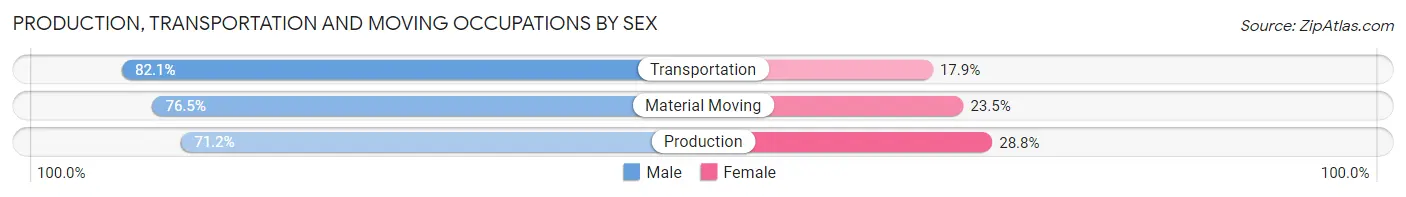
Production, Transportation and Moving Occupations by Sex
| Occupation | Male | Female |
| Production | 2,571 (71.2%) | 1,038 (28.8%) |
| Transportation | 914 (82.1%) | 199 (17.9%) |
| Material Moving | 857 (76.5%) | 263 (23.5%) |
| Total (Category) | 4,342 (74.3%) | 1,500 (25.7%) |
| Total (Overall) | 17,654 (55.0%) | 14,425 (45.0%) |
Employment Industries by Sex in Oconee County
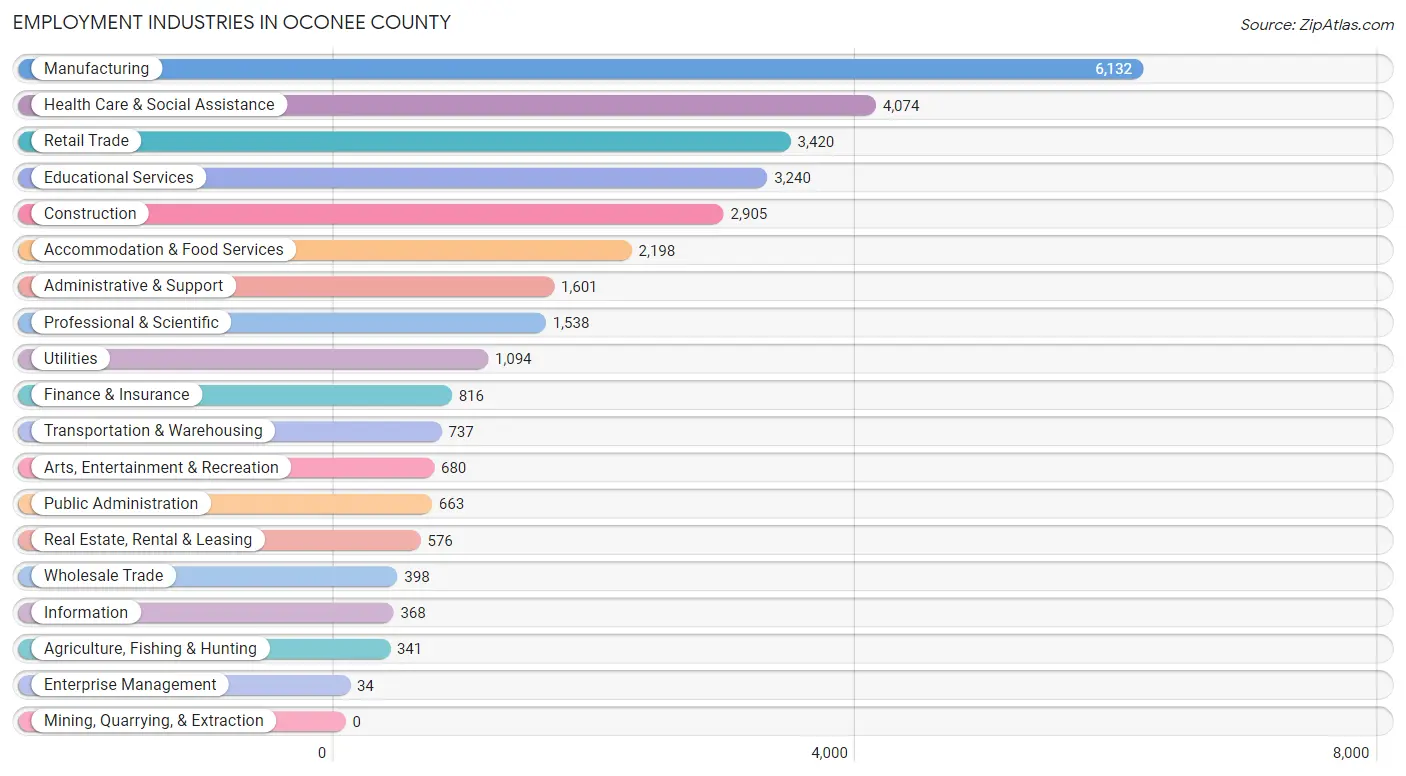
Employment Industries in Oconee County
The major employment industries in Oconee County include Manufacturing (6,132 | 19.1%), Health Care & Social Assistance (4,074 | 12.7%), Retail Trade (3,420 | 10.7%), Educational Services (3,240 | 10.1%), and Construction (2,905 | 9.1%).
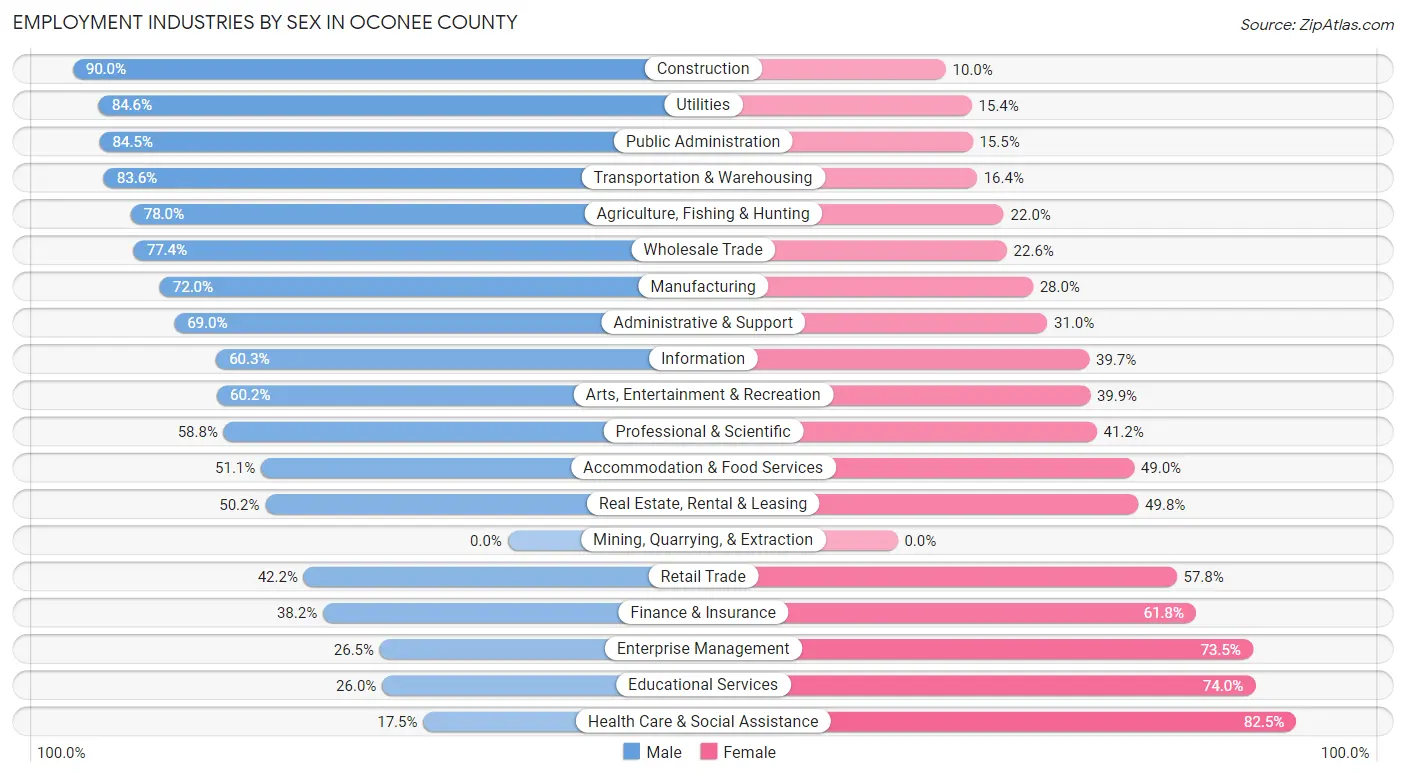
Employment Industries by Sex in Oconee County
The Oconee County industries that see more men than women are Construction (90.0%), Utilities (84.6%), and Public Administration (84.5%), whereas the industries that tend to have a higher number of women are Health Care & Social Assistance (82.5%), Educational Services (74.0%), and Enterprise Management (73.5%).
| Industry | Male | Female |
| Agriculture, Fishing & Hunting | 266 (78.0%) | 75 (22.0%) |
| Mining, Quarrying, & Extraction | 0 (0.0%) | 0 (0.0%) |
| Construction | 2,615 (90.0%) | 290 (10.0%) |
| Manufacturing | 4,415 (72.0%) | 1,717 (28.0%) |
| Wholesale Trade | 308 (77.4%) | 90 (22.6%) |
| Retail Trade | 1,444 (42.2%) | 1,976 (57.8%) |
| Transportation & Warehousing | 616 (83.6%) | 121 (16.4%) |
| Utilities | 926 (84.6%) | 168 (15.4%) |
| Information | 222 (60.3%) | 146 (39.7%) |
| Finance & Insurance | 312 (38.2%) | 504 (61.8%) |
| Real Estate, Rental & Leasing | 289 (50.2%) | 287 (49.8%) |
| Professional & Scientific | 904 (58.8%) | 634 (41.2%) |
| Enterprise Management | 9 (26.5%) | 25 (73.5%) |
| Administrative & Support | 1,105 (69.0%) | 496 (31.0%) |
| Educational Services | 842 (26.0%) | 2,398 (74.0%) |
| Health Care & Social Assistance | 712 (17.5%) | 3,362 (82.5%) |
| Arts, Entertainment & Recreation | 409 (60.2%) | 271 (39.9%) |
| Accommodation & Food Services | 1,122 (51.0%) | 1,076 (48.9%) |
| Public Administration | 560 (84.5%) | 103 (15.5%) |
| Total | 17,654 (55.0%) | 14,425 (45.0%) |
Education in Oconee County
School Enrollment in Oconee County
The most common levels of schooling among the 16,393 students in Oconee County are middle school (4,134 | 25.2%), high school (3,596 | 21.9%), and elementary school (3,254 | 19.9%).
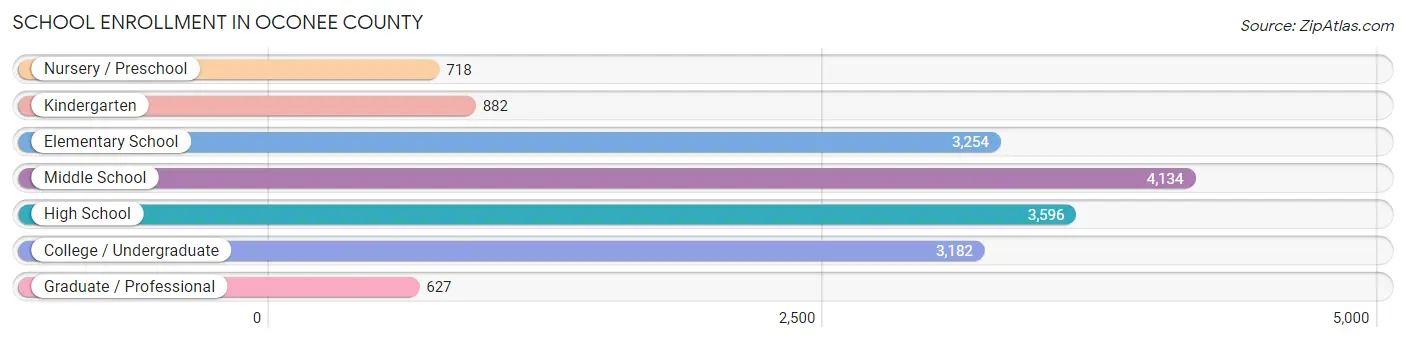
| School Level | # Students | % Students |
| Nursery / Preschool | 718 | 4.4% |
| Kindergarten | 882 | 5.4% |
| Elementary School | 3,254 | 19.9% |
| Middle School | 4,134 | 25.2% |
| High School | 3,596 | 21.9% |
| College / Undergraduate | 3,182 | 19.4% |
| Graduate / Professional | 627 | 3.8% |
| Total | 16,393 | 100.0% |
School Enrollment by Age by Funding Source in Oconee County
Out of a total of 16,393 students who are enrolled in schools in Oconee County, 2,623 (16.0%) attend a private institution, while the remaining 13,770 (84.0%) are enrolled in public schools. The age group of 3 to 4 year olds has the highest likelihood of being enrolled in private schools, with 304 (48.2% in the age bracket) enrolled. Conversely, the age group of 18 to 19 year olds has the lowest likelihood of being enrolled in a private school, with 1,217 (97.4% in the age bracket) attending a public institution.
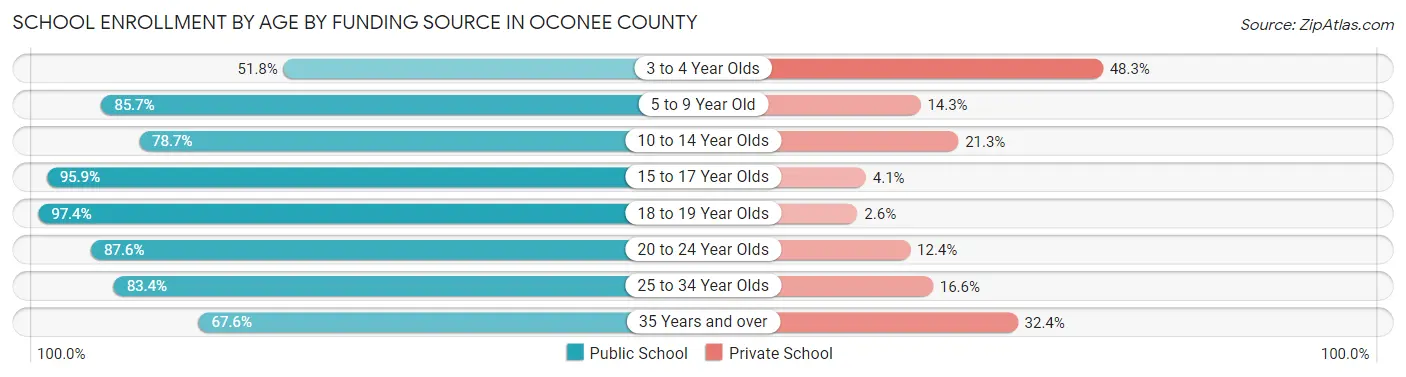
| Age Bracket | Public School | Private School |
| 3 to 4 Year Olds | 326 (51.7%) | 304 (48.2%) |
| 5 to 9 Year Old | 3,225 (85.7%) | 538 (14.3%) |
| 10 to 14 Year Olds | 3,773 (78.7%) | 1,023 (21.3%) |
| 15 to 17 Year Olds | 2,719 (95.9%) | 117 (4.1%) |
| 18 to 19 Year Olds | 1,217 (97.4%) | 32 (2.6%) |
| 20 to 24 Year Olds | 1,211 (87.6%) | 171 (12.4%) |
| 25 to 34 Year Olds | 648 (83.4%) | 129 (16.6%) |
| 35 Years and over | 649 (67.6%) | 311 (32.4%) |
| Total | 13,770 (84.0%) | 2,623 (16.0%) |
Educational Attainment by Field of Study in Oconee County
Education (3,081 | 17.8%), business (3,013 | 17.4%), science & technology (1,968 | 11.4%), engineering (1,725 | 10.0%), and bio, nature & agricultural (1,403 | 8.1%) are the most common fields of study among 17,341 individuals in Oconee County who have obtained a bachelor's degree or higher.
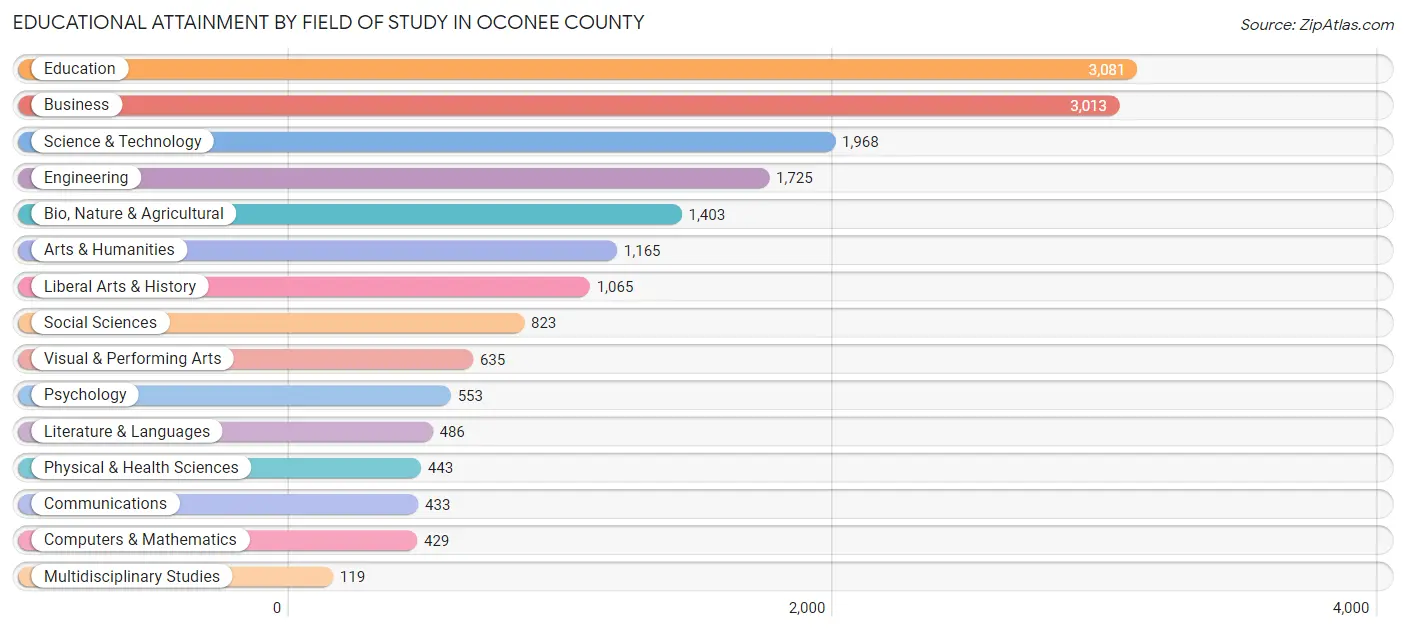
| Field of Study | # Graduates | % Graduates |
| Computers & Mathematics | 429 | 2.5% |
| Bio, Nature & Agricultural | 1,403 | 8.1% |
| Physical & Health Sciences | 443 | 2.5% |
| Psychology | 553 | 3.2% |
| Social Sciences | 823 | 4.8% |
| Engineering | 1,725 | 10.0% |
| Multidisciplinary Studies | 119 | 0.7% |
| Science & Technology | 1,968 | 11.4% |
| Business | 3,013 | 17.4% |
| Education | 3,081 | 17.8% |
| Literature & Languages | 486 | 2.8% |
| Liberal Arts & History | 1,065 | 6.1% |
| Visual & Performing Arts | 635 | 3.7% |
| Communications | 433 | 2.5% |
| Arts & Humanities | 1,165 | 6.7% |
| Total | 17,341 | 100.0% |
Transportation & Commute in Oconee County
Vehicle Availability by Sex in Oconee County
The most prevalent vehicle ownership categories in Oconee County are males with 2 vehicles (6,819, accounting for 39.1%) and females with 2 vehicles (5,249, making up 48.2%).
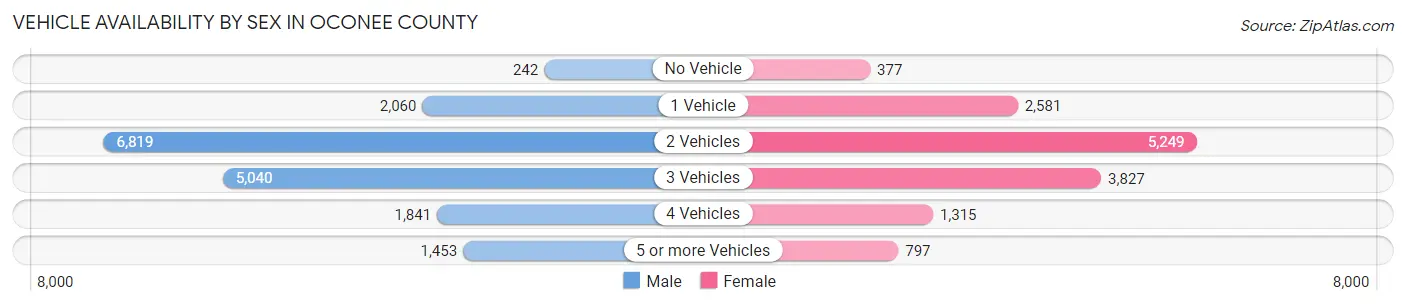
| Vehicles Available | Male | Female |
| No Vehicle | 242 (1.4%) | 377 (2.7%) |
| 1 Vehicle | 2,060 (11.8%) | 2,581 (18.2%) |
| 2 Vehicles | 6,819 (39.1%) | 5,249 (37.1%) |
| 3 Vehicles | 5,040 (28.9%) | 3,827 (27.1%) |
| 4 Vehicles | 1,841 (10.5%) | 1,315 (9.3%) |
| 5 or more Vehicles | 1,453 (8.3%) | 797 (5.6%) |
| Total | 17,455 (100.0%) | 14,146 (100.0%) |
Commute Time in Oconee County
The most frequently occuring commute durations in Oconee County are 15 to 19 minutes (5,595 commuters, 18.9%), 10 to 14 minutes (4,685 commuters, 15.9%), and 20 to 24 minutes (4,251 commuters, 14.4%).
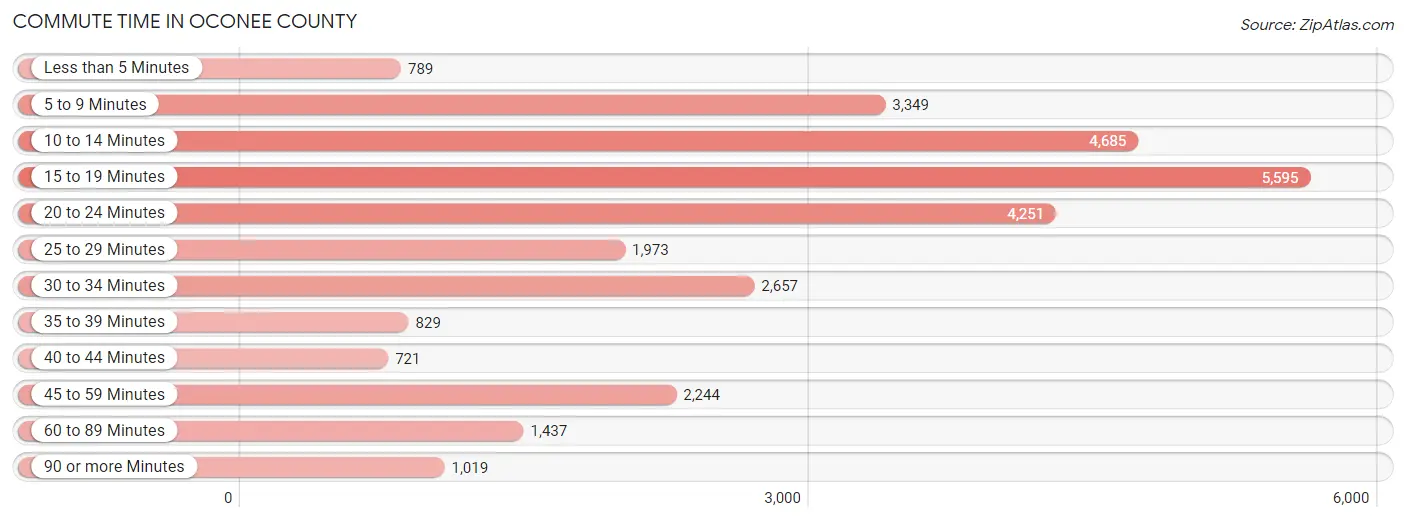
| Commute Time | # Commuters | % Commuters |
| Less than 5 Minutes | 789 | 2.7% |
| 5 to 9 Minutes | 3,349 | 11.3% |
| 10 to 14 Minutes | 4,685 | 15.9% |
| 15 to 19 Minutes | 5,595 | 18.9% |
| 20 to 24 Minutes | 4,251 | 14.4% |
| 25 to 29 Minutes | 1,973 | 6.7% |
| 30 to 34 Minutes | 2,657 | 9.0% |
| 35 to 39 Minutes | 829 | 2.8% |
| 40 to 44 Minutes | 721 | 2.4% |
| 45 to 59 Minutes | 2,244 | 7.6% |
| 60 to 89 Minutes | 1,437 | 4.9% |
| 90 or more Minutes | 1,019 | 3.5% |
Commute Time by Sex in Oconee County
The most common commute times in Oconee County are 15 to 19 minutes (2,931 commuters, 17.9%) for males and 15 to 19 minutes (2,664 commuters, 20.2%) for females.
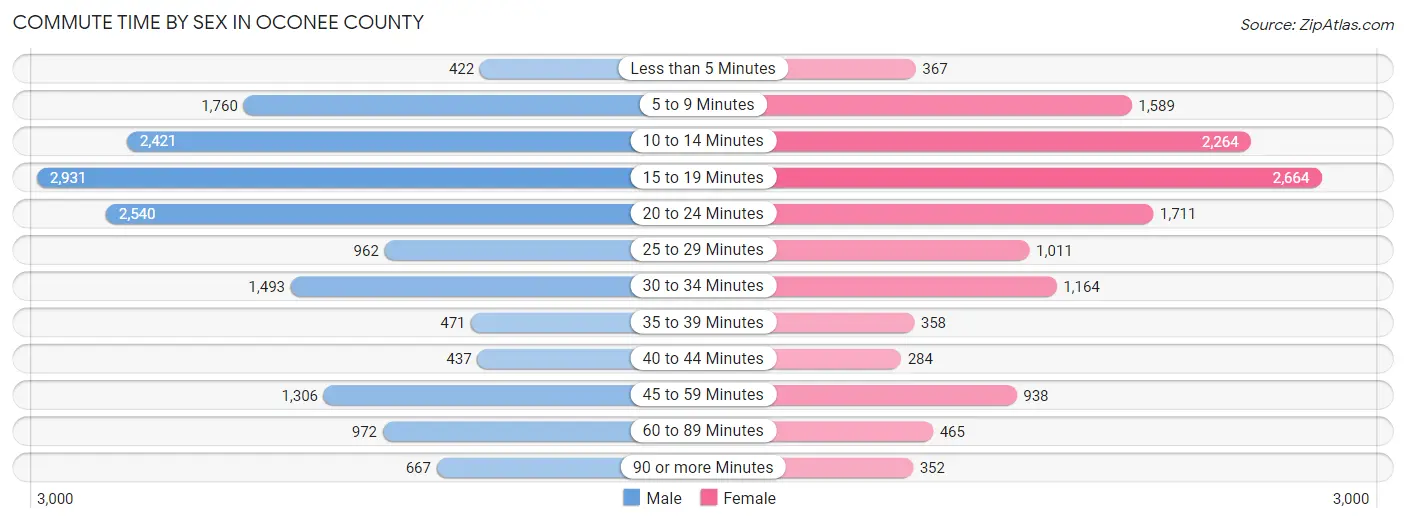
| Commute Time | Male | Female |
| Less than 5 Minutes | 422 (2.6%) | 367 (2.8%) |
| 5 to 9 Minutes | 1,760 (10.7%) | 1,589 (12.1%) |
| 10 to 14 Minutes | 2,421 (14.8%) | 2,264 (17.2%) |
| 15 to 19 Minutes | 2,931 (17.9%) | 2,664 (20.2%) |
| 20 to 24 Minutes | 2,540 (15.5%) | 1,711 (13.0%) |
| 25 to 29 Minutes | 962 (5.9%) | 1,011 (7.7%) |
| 30 to 34 Minutes | 1,493 (9.1%) | 1,164 (8.8%) |
| 35 to 39 Minutes | 471 (2.9%) | 358 (2.7%) |
| 40 to 44 Minutes | 437 (2.7%) | 284 (2.2%) |
| 45 to 59 Minutes | 1,306 (8.0%) | 938 (7.1%) |
| 60 to 89 Minutes | 972 (5.9%) | 465 (3.5%) |
| 90 or more Minutes | 667 (4.1%) | 352 (2.7%) |
Time of Departure to Work by Sex in Oconee County
The most frequent times of departure to work in Oconee County are 6:00 AM to 6:29 AM (2,162, 13.2%) for males and 7:00 AM to 7:29 AM (2,188, 16.6%) for females.
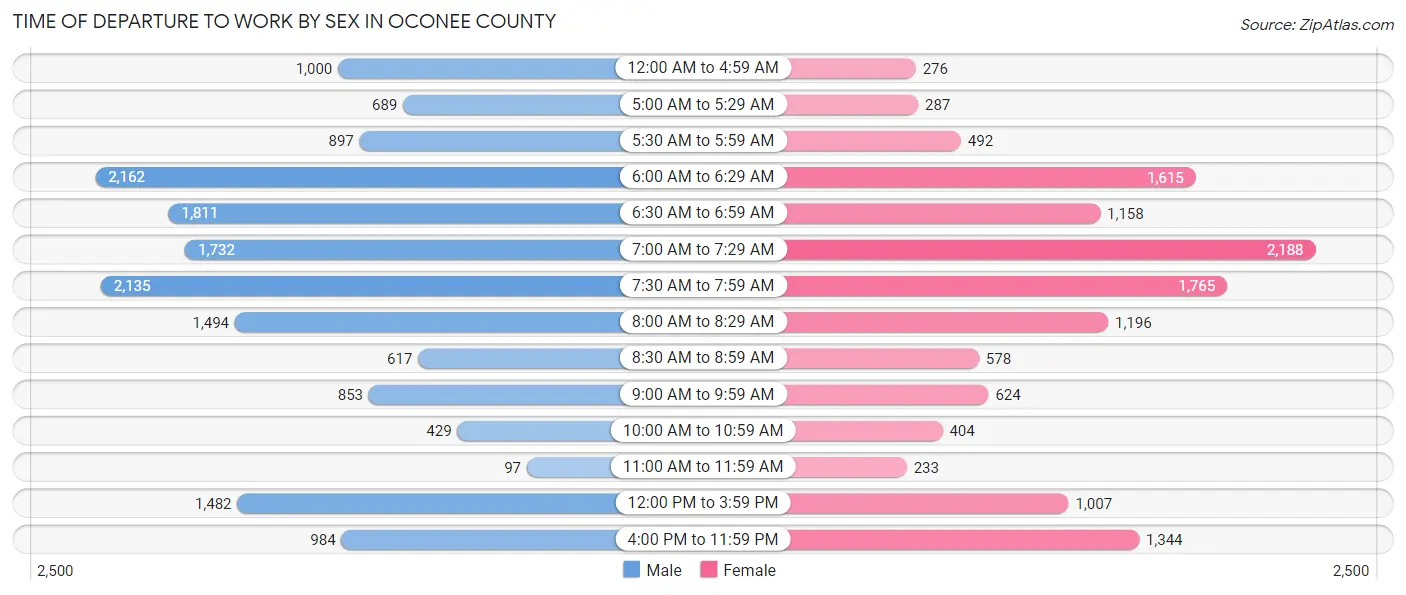
| Time of Departure | Male | Female |
| 12:00 AM to 4:59 AM | 1,000 (6.1%) | 276 (2.1%) |
| 5:00 AM to 5:29 AM | 689 (4.2%) | 287 (2.2%) |
| 5:30 AM to 5:59 AM | 897 (5.5%) | 492 (3.7%) |
| 6:00 AM to 6:29 AM | 2,162 (13.2%) | 1,615 (12.3%) |
| 6:30 AM to 6:59 AM | 1,811 (11.1%) | 1,158 (8.8%) |
| 7:00 AM to 7:29 AM | 1,732 (10.6%) | 2,188 (16.6%) |
| 7:30 AM to 7:59 AM | 2,135 (13.0%) | 1,765 (13.4%) |
| 8:00 AM to 8:29 AM | 1,494 (9.1%) | 1,196 (9.1%) |
| 8:30 AM to 8:59 AM | 617 (3.8%) | 578 (4.4%) |
| 9:00 AM to 9:59 AM | 853 (5.2%) | 624 (4.7%) |
| 10:00 AM to 10:59 AM | 429 (2.6%) | 404 (3.1%) |
| 11:00 AM to 11:59 AM | 97 (0.6%) | 233 (1.8%) |
| 12:00 PM to 3:59 PM | 1,482 (9.0%) | 1,007 (7.6%) |
| 4:00 PM to 11:59 PM | 984 (6.0%) | 1,344 (10.2%) |
| Total | 16,382 (100.0%) | 13,167 (100.0%) |
Housing Occupancy in Oconee County
Occupancy by Ownership in Oconee County
Of the total 33,240 dwellings in Oconee County, owner-occupied units account for 25,002 (75.2%), while renter-occupied units make up 8,238 (24.8%).
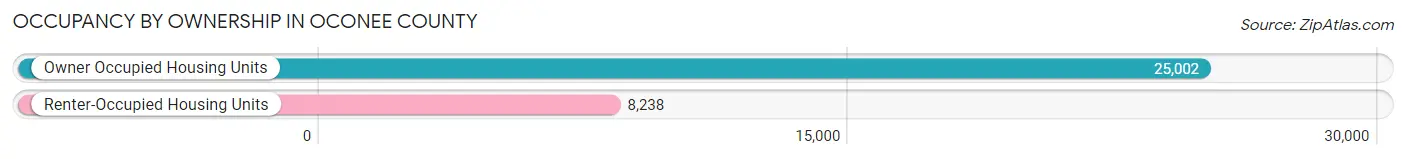
| Occupancy | # Housing Units | % Housing Units |
| Owner Occupied Housing Units | 25,002 | 75.2% |
| Renter-Occupied Housing Units | 8,238 | 24.8% |
| Total Occupied Housing Units | 33,240 | 100.0% |
Occupancy by Household Size in Oconee County
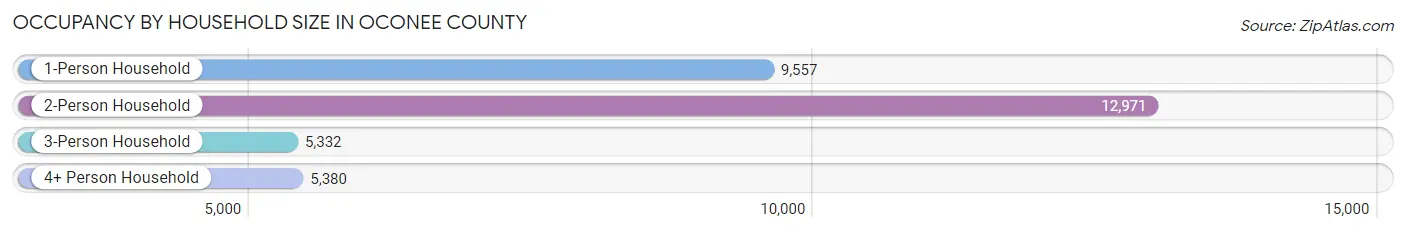
| Household Size | # Housing Units | % Housing Units |
| 1-Person Household | 9,557 | 28.7% |
| 2-Person Household | 12,971 | 39.0% |
| 3-Person Household | 5,332 | 16.0% |
| 4+ Person Household | 5,380 | 16.2% |
| Total Housing Units | 33,240 | 100.0% |
Occupancy by Ownership by Household Size in Oconee County
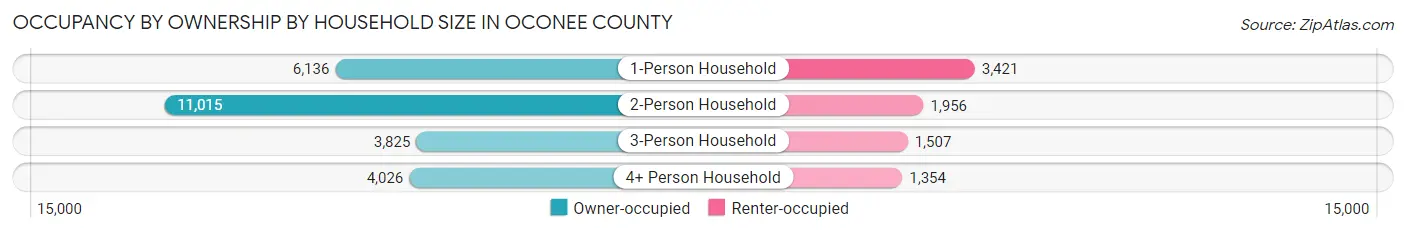
| Household Size | Owner-occupied | Renter-occupied |
| 1-Person Household | 6,136 (64.2%) | 3,421 (35.8%) |
| 2-Person Household | 11,015 (84.9%) | 1,956 (15.1%) |
| 3-Person Household | 3,825 (71.7%) | 1,507 (28.3%) |
| 4+ Person Household | 4,026 (74.8%) | 1,354 (25.2%) |
| Total Housing Units | 25,002 (75.2%) | 8,238 (24.8%) |
Occupancy by Educational Attainment in Oconee County
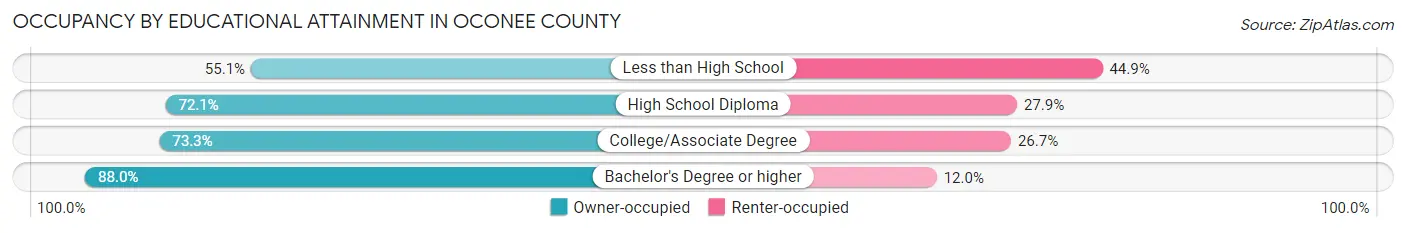
| Household Size | Owner-occupied | Renter-occupied |
| Less than High School | 2,047 (55.1%) | 1,666 (44.9%) |
| High School Diploma | 6,871 (72.1%) | 2,663 (27.9%) |
| College/Associate Degree | 7,507 (73.3%) | 2,738 (26.7%) |
| Bachelor's Degree or higher | 8,577 (88.0%) | 1,171 (12.0%) |
Occupancy by Age of Householder in Oconee County
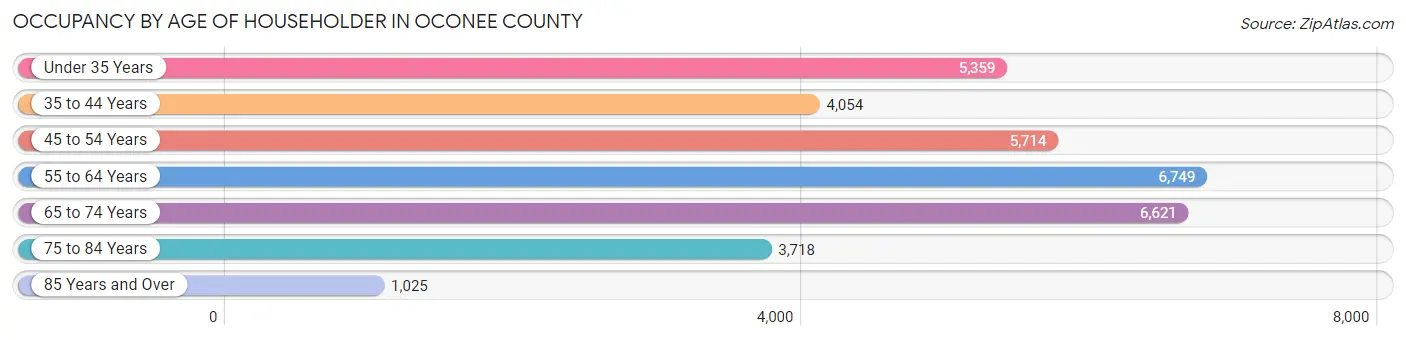
| Age Bracket | # Households | % Households |
| Under 35 Years | 5,359 | 16.1% |
| 35 to 44 Years | 4,054 | 12.2% |
| 45 to 54 Years | 5,714 | 17.2% |
| 55 to 64 Years | 6,749 | 20.3% |
| 65 to 74 Years | 6,621 | 19.9% |
| 75 to 84 Years | 3,718 | 11.2% |
| 85 Years and Over | 1,025 | 3.1% |
| Total | 33,240 | 100.0% |
Housing Finances in Oconee County
Median Income by Occupancy in Oconee County
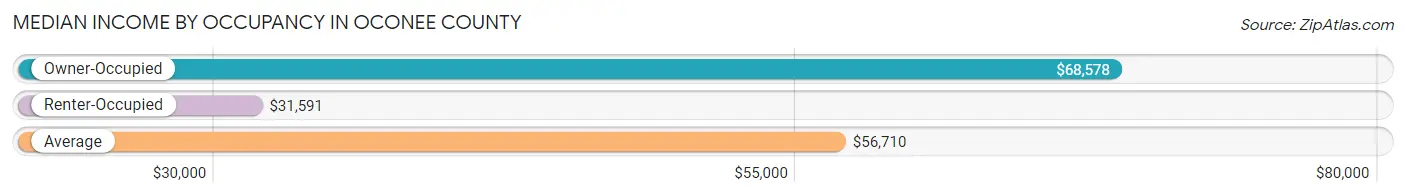
| Occupancy Type | # Households | Median Income |
| Owner-Occupied | 25,002 (75.2%) | $68,578 |
| Renter-Occupied | 8,238 (24.8%) | $31,591 |
| Average | 33,240 (100.0%) | $56,710 |
Occupancy by Householder Income Bracket in Oconee County
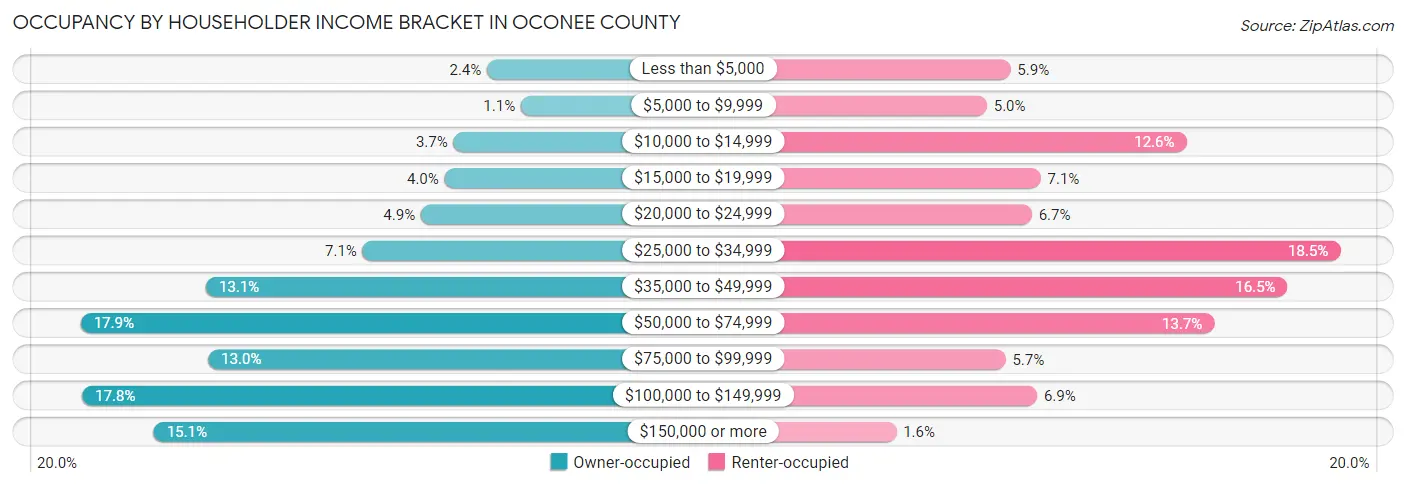
| Income Bracket | Owner-occupied | Renter-occupied |
| Less than $5,000 | 595 (2.4%) | 486 (5.9%) |
| $5,000 to $9,999 | 272 (1.1%) | 412 (5.0%) |
| $10,000 to $14,999 | 916 (3.7%) | 1,038 (12.6%) |
| $15,000 to $19,999 | 1,000 (4.0%) | 581 (7.0%) |
| $20,000 to $24,999 | 1,224 (4.9%) | 553 (6.7%) |
| $25,000 to $34,999 | 1,781 (7.1%) | 1,521 (18.5%) |
| $35,000 to $49,999 | 3,272 (13.1%) | 1,355 (16.5%) |
| $50,000 to $74,999 | 4,465 (17.9%) | 1,125 (13.7%) |
| $75,000 to $99,999 | 3,253 (13.0%) | 470 (5.7%) |
| $100,000 to $149,999 | 4,454 (17.8%) | 569 (6.9%) |
| $150,000 or more | 3,770 (15.1%) | 128 (1.5%) |
| Total | 25,002 (100.0%) | 8,238 (100.0%) |
Monthly Housing Cost Tiers in Oconee County
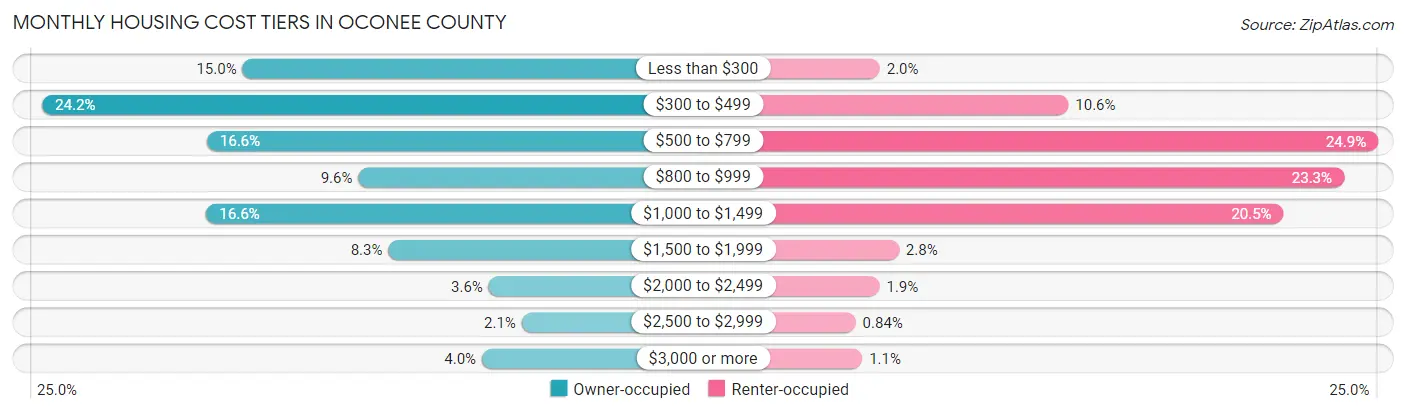
| Monthly Cost | Owner-occupied | Renter-occupied |
| Less than $300 | 3,742 (15.0%) | 161 (1.9%) |
| $300 to $499 | 6,047 (24.2%) | 876 (10.6%) |
| $500 to $799 | 4,154 (16.6%) | 2,050 (24.9%) |
| $800 to $999 | 2,410 (9.6%) | 1,920 (23.3%) |
| $1,000 to $1,499 | 4,158 (16.6%) | 1,691 (20.5%) |
| $1,500 to $1,999 | 2,065 (8.3%) | 233 (2.8%) |
| $2,000 to $2,499 | 909 (3.6%) | 160 (1.9%) |
| $2,500 to $2,999 | 530 (2.1%) | 69 (0.8%) |
| $3,000 or more | 987 (4.0%) | 94 (1.1%) |
| Total | 25,002 (100.0%) | 8,238 (100.0%) |
Physical Housing Characteristics in Oconee County
Housing Structures in Oconee County
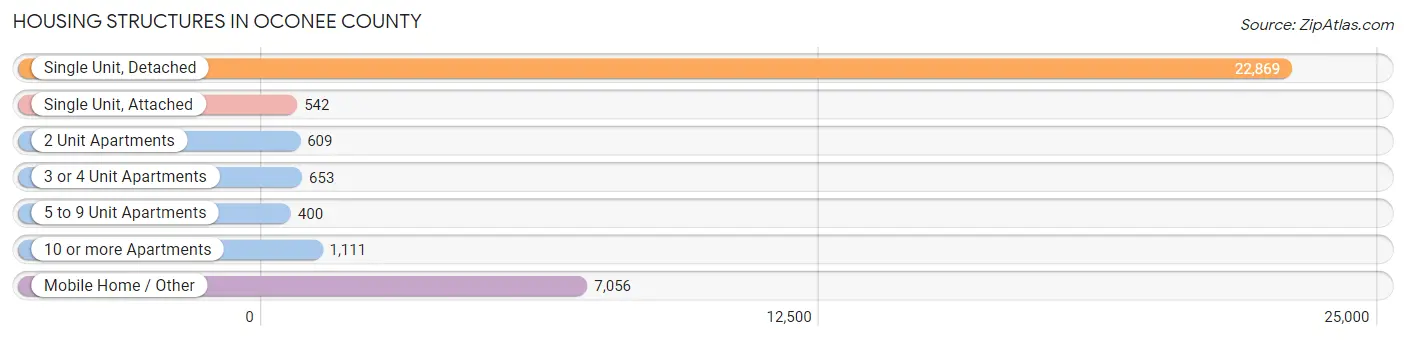
| Structure Type | # Housing Units | % Housing Units |
| Single Unit, Detached | 22,869 | 68.8% |
| Single Unit, Attached | 542 | 1.6% |
| 2 Unit Apartments | 609 | 1.8% |
| 3 or 4 Unit Apartments | 653 | 2.0% |
| 5 to 9 Unit Apartments | 400 | 1.2% |
| 10 or more Apartments | 1,111 | 3.3% |
| Mobile Home / Other | 7,056 | 21.2% |
| Total | 33,240 | 100.0% |
Housing Structures by Occupancy in Oconee County
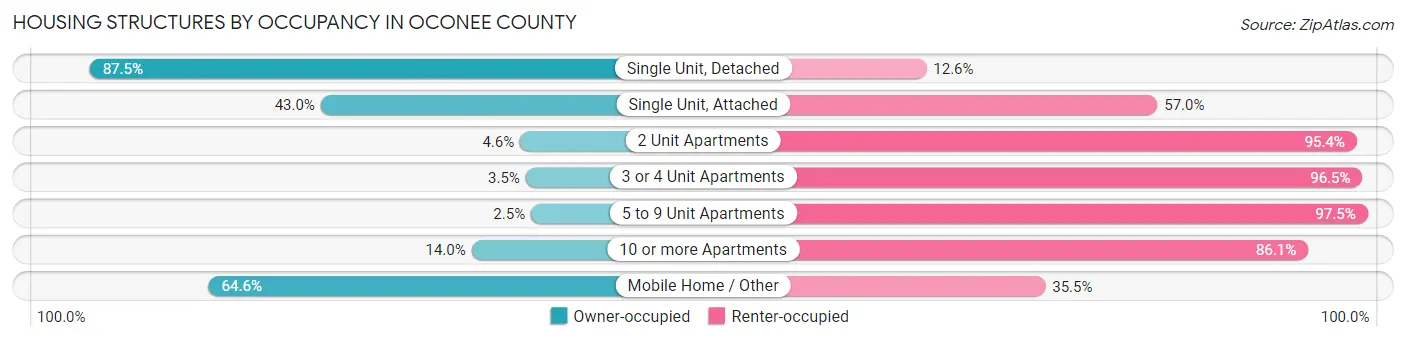
| Structure Type | Owner-occupied | Renter-occupied |
| Single Unit, Detached | 19,998 (87.5%) | 2,871 (12.6%) |
| Single Unit, Attached | 233 (43.0%) | 309 (57.0%) |
| 2 Unit Apartments | 28 (4.6%) | 581 (95.4%) |
| 3 or 4 Unit Apartments | 23 (3.5%) | 630 (96.5%) |
| 5 to 9 Unit Apartments | 10 (2.5%) | 390 (97.5%) |
| 10 or more Apartments | 155 (14.0%) | 956 (86.1%) |
| Mobile Home / Other | 4,555 (64.5%) | 2,501 (35.4%) |
| Total | 25,002 (75.2%) | 8,238 (24.8%) |
Housing Structures by Number of Rooms in Oconee County
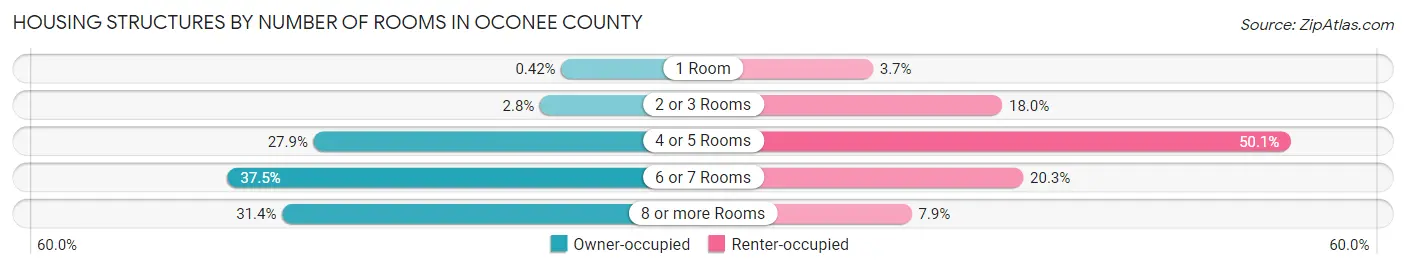
| Number of Rooms | Owner-occupied | Renter-occupied |
| 1 Room | 105 (0.4%) | 301 (3.6%) |
| 2 or 3 Rooms | 695 (2.8%) | 1,482 (18.0%) |
| 4 or 5 Rooms | 6,977 (27.9%) | 4,126 (50.1%) |
| 6 or 7 Rooms | 9,374 (37.5%) | 1,675 (20.3%) |
| 8 or more Rooms | 7,851 (31.4%) | 654 (7.9%) |
| Total | 25,002 (100.0%) | 8,238 (100.0%) |
Housing Structure by Heating Type in Oconee County
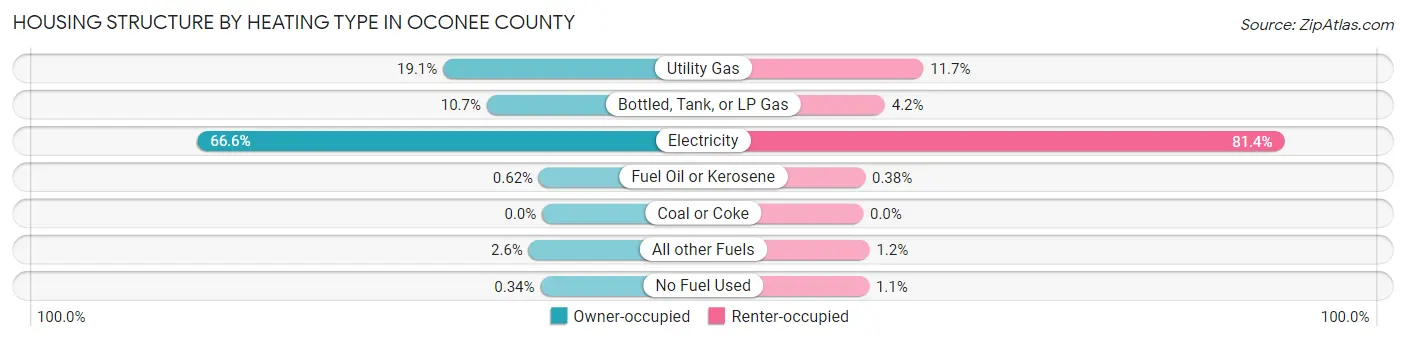
| Heating Type | Owner-occupied | Renter-occupied |
| Utility Gas | 4,784 (19.1%) | 960 (11.7%) |
| Bottled, Tank, or LP Gas | 2,672 (10.7%) | 346 (4.2%) |
| Electricity | 16,657 (66.6%) | 6,705 (81.4%) |
| Fuel Oil or Kerosene | 156 (0.6%) | 31 (0.4%) |
| Coal or Coke | 0 (0.0%) | 0 (0.0%) |
| All other Fuels | 648 (2.6%) | 102 (1.2%) |
| No Fuel Used | 85 (0.3%) | 94 (1.1%) |
| Total | 25,002 (100.0%) | 8,238 (100.0%) |
Household Vehicle Usage in Oconee County
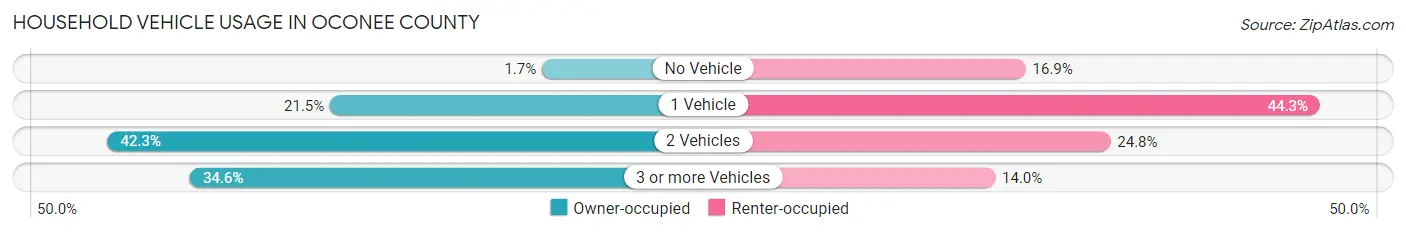
| Vehicles per Household | Owner-occupied | Renter-occupied |
| No Vehicle | 426 (1.7%) | 1,390 (16.9%) |
| 1 Vehicle | 5,370 (21.5%) | 3,652 (44.3%) |
| 2 Vehicles | 10,565 (42.3%) | 2,041 (24.8%) |
| 3 or more Vehicles | 8,641 (34.6%) | 1,155 (14.0%) |
| Total | 25,002 (100.0%) | 8,238 (100.0%) |
Real Estate & Mortgages in Oconee County
Real Estate and Mortgage Overview in Oconee County
| Characteristic | Without Mortgage | With Mortgage |
| Housing Units | 13,295 | 11,707 |
| Median Property Value | $176,300 | $215,900 |
| Median Household Income | $55,017 | $2,340 |
| Monthly Housing Costs | $376 | $946 |
| Real Estate Taxes | $676 | $381 |
Property Value by Mortgage Status in Oconee County
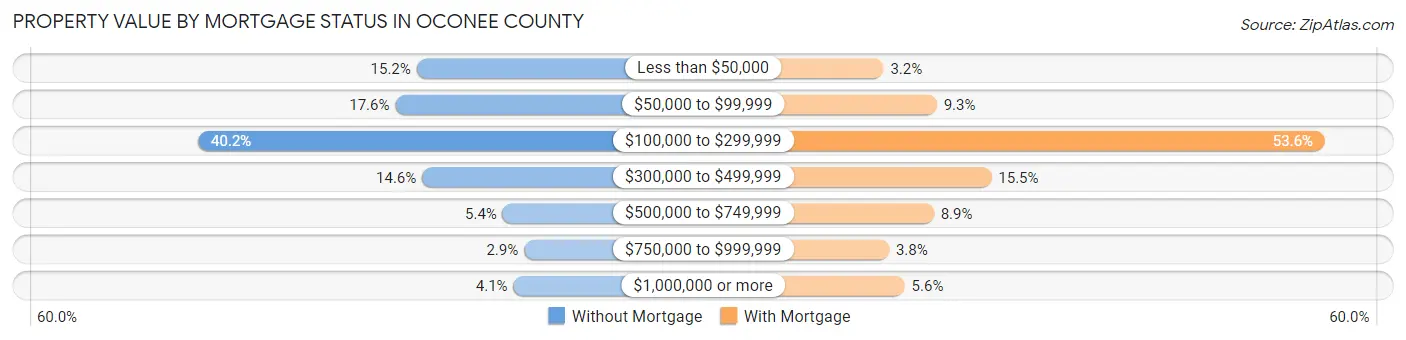
| Property Value | Without Mortgage | With Mortgage |
| Less than $50,000 | 2,021 (15.2%) | 374 (3.2%) |
| $50,000 to $99,999 | 2,344 (17.6%) | 1,086 (9.3%) |
| $100,000 to $299,999 | 5,343 (40.2%) | 6,280 (53.6%) |
| $300,000 to $499,999 | 1,937 (14.6%) | 1,817 (15.5%) |
| $500,000 to $749,999 | 713 (5.4%) | 1,046 (8.9%) |
| $750,000 to $999,999 | 388 (2.9%) | 447 (3.8%) |
| $1,000,000 or more | 549 (4.1%) | 657 (5.6%) |
| Total | 13,295 (100.0%) | 11,707 (100.0%) |
Household Income by Mortgage Status in Oconee County
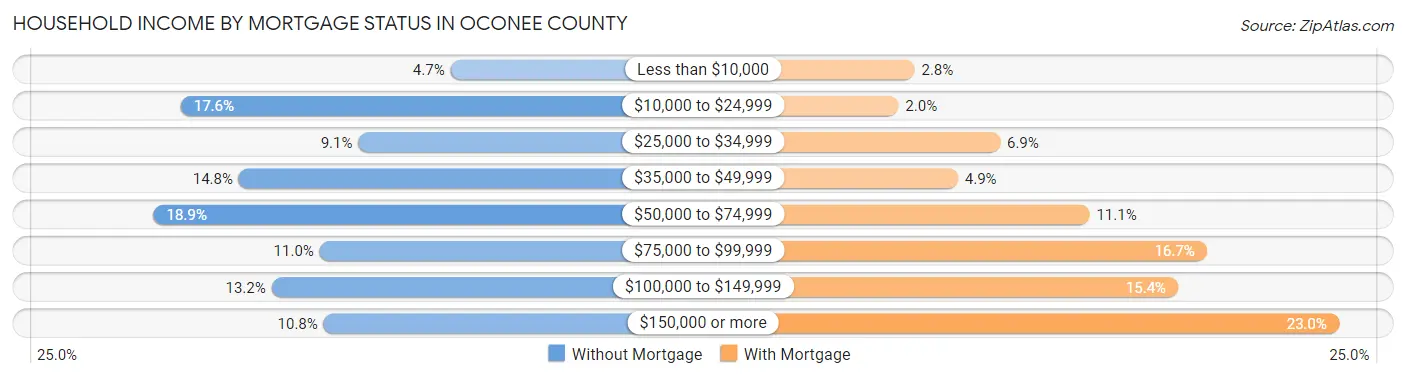
| Household Income | Without Mortgage | With Mortgage |
| Less than $10,000 | 628 (4.7%) | 329 (2.8%) |
| $10,000 to $24,999 | 2,334 (17.6%) | 239 (2.0%) |
| $25,000 to $34,999 | 1,211 (9.1%) | 806 (6.9%) |
| $35,000 to $49,999 | 1,968 (14.8%) | 570 (4.9%) |
| $50,000 to $74,999 | 2,508 (18.9%) | 1,304 (11.1%) |
| $75,000 to $99,999 | 1,456 (11.0%) | 1,957 (16.7%) |
| $100,000 to $149,999 | 1,760 (13.2%) | 1,797 (15.3%) |
| $150,000 or more | 1,430 (10.8%) | 2,694 (23.0%) |
| Total | 13,295 (100.0%) | 11,707 (100.0%) |
Property Value to Household Income Ratio in Oconee County
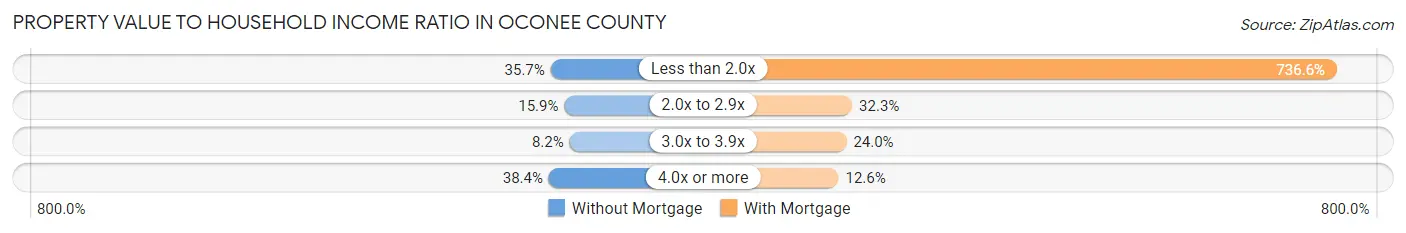
| Value-to-Income Ratio | Without Mortgage | With Mortgage |
| Less than 2.0x | 4,752 (35.7%) | 86,228 (736.5%) |
| 2.0x to 2.9x | 2,112 (15.9%) | 3,782 (32.3%) |
| 3.0x to 3.9x | 1,093 (8.2%) | 2,813 (24.0%) |
| 4.0x or more | 5,104 (38.4%) | 1,473 (12.6%) |
| Total | 13,295 (100.0%) | 11,707 (100.0%) |
Real Estate Taxes by Mortgage Status in Oconee County

| Property Taxes | Without Mortgage | With Mortgage |
| Less than $800 | 6,674 (50.2%) | 18 (0.2%) |
| $800 to $1,499 | 2,639 (19.9%) | 4,800 (41.0%) |
| $800 to $1,499 | 2,408 (18.1%) | 3,182 (27.2%) |
| Total | 13,295 (100.0%) | 11,707 (100.0%) |
Health & Disability in Oconee County
Health Insurance Coverage by Age in Oconee County
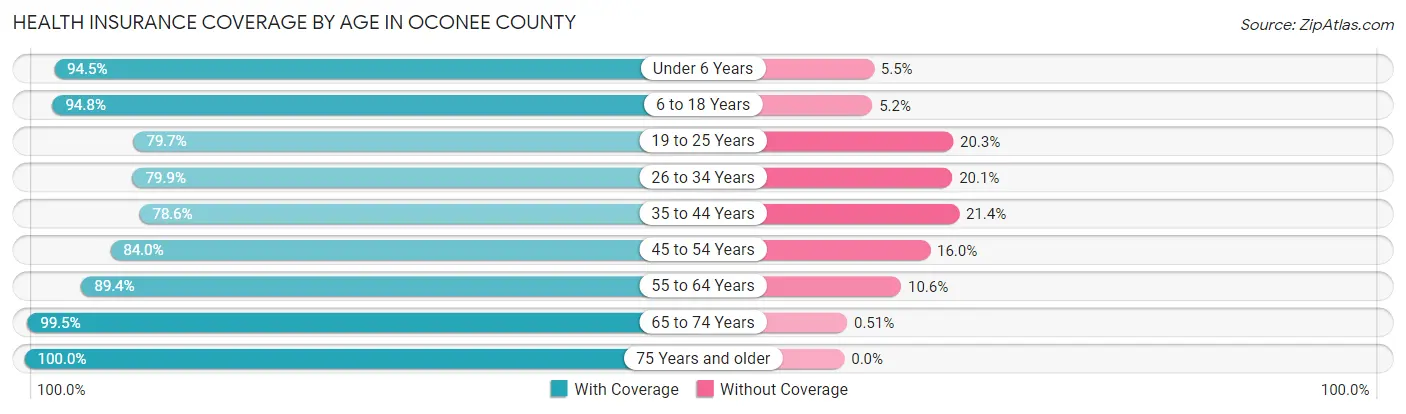
| Age Bracket | With Coverage | Without Coverage |
| Under 6 Years | 4,099 (94.5%) | 239 (5.5%) |
| 6 to 18 Years | 11,031 (94.8%) | 606 (5.2%) |
| 19 to 25 Years | 4,588 (79.7%) | 1,167 (20.3%) |
| 26 to 34 Years | 6,638 (79.9%) | 1,672 (20.1%) |
| 35 to 44 Years | 6,173 (78.6%) | 1,681 (21.4%) |
| 45 to 54 Years | 8,036 (84.0%) | 1,529 (16.0%) |
| 55 to 64 Years | 10,974 (89.4%) | 1,300 (10.6%) |
| 65 to 74 Years | 11,228 (99.5%) | 57 (0.5%) |
| 75 Years and older | 7,134 (100.0%) | 0 (0.0%) |
| Total | 69,901 (89.4%) | 8,251 (10.6%) |
Health Insurance Coverage by Citizenship Status in Oconee County

| Citizenship Status | With Coverage | Without Coverage |
| Native Born | 4,099 (94.5%) | 239 (5.5%) |
| Foreign Born, Citizen | 11,031 (94.8%) | 606 (5.2%) |
| Foreign Born, not a Citizen | 4,588 (79.7%) | 1,167 (20.3%) |
Health Insurance Coverage by Household Income in Oconee County
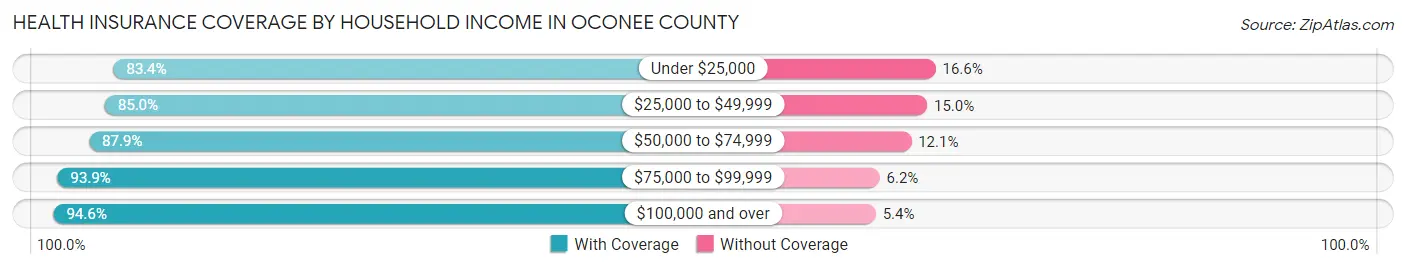
| Household Income | With Coverage | Without Coverage |
| Under $25,000 | 10,531 (83.4%) | 2,100 (16.6%) |
| $25,000 to $49,999 | 14,178 (85.0%) | 2,509 (15.0%) |
| $50,000 to $74,999 | 11,624 (87.9%) | 1,595 (12.1%) |
| $75,000 to $99,999 | 9,057 (93.9%) | 594 (6.1%) |
| $100,000 and over | 24,283 (94.6%) | 1,392 (5.4%) |
Public vs Private Health Insurance Coverage by Age in Oconee County
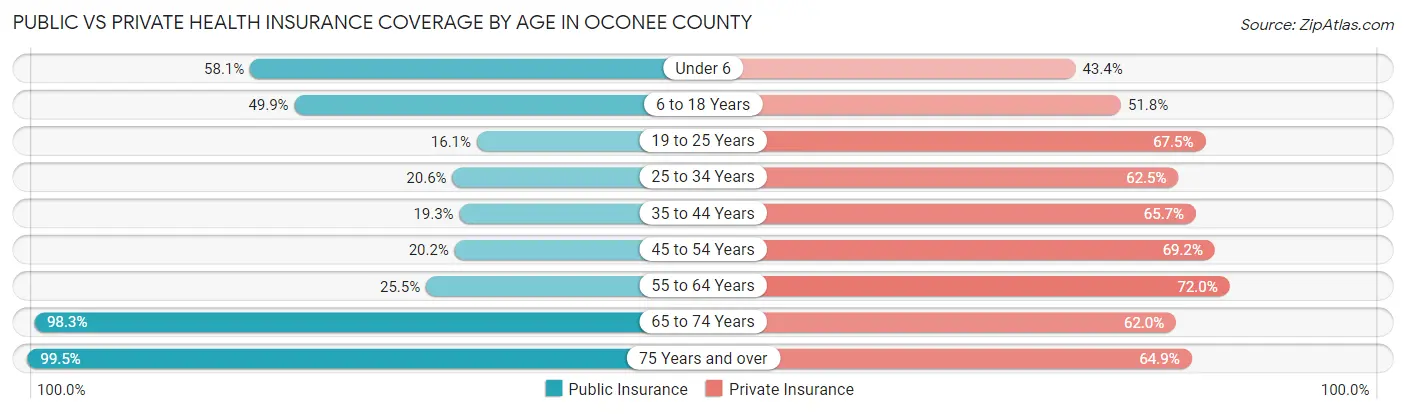
| Age Bracket | Public Insurance | Private Insurance |
| Under 6 | 2,522 (58.1%) | 1,882 (43.4%) |
| 6 to 18 Years | 5,808 (49.9%) | 6,032 (51.8%) |
| 19 to 25 Years | 924 (16.1%) | 3,882 (67.4%) |
| 25 to 34 Years | 1,711 (20.6%) | 5,191 (62.5%) |
| 35 to 44 Years | 1,515 (19.3%) | 5,161 (65.7%) |
| 45 to 54 Years | 1,929 (20.2%) | 6,621 (69.2%) |
| 55 to 64 Years | 3,128 (25.5%) | 8,833 (72.0%) |
| 65 to 74 Years | 11,087 (98.3%) | 7,000 (62.0%) |
| 75 Years and over | 7,096 (99.5%) | 4,630 (64.9%) |
| Total | 35,720 (45.7%) | 49,232 (63.0%) |
Disability Status by Sex by Age in Oconee County
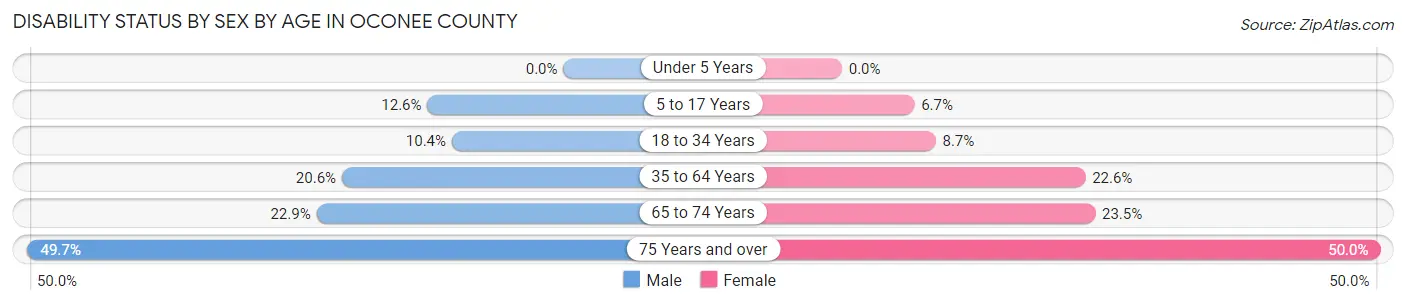
| Age Bracket | Male | Female |
| Under 5 Years | 0 (0.0%) | 0 (0.0%) |
| 5 to 17 Years | 729 (12.6%) | 390 (6.7%) |
| 18 to 34 Years | 786 (10.3%) | 632 (8.7%) |
| 35 to 64 Years | 3,025 (20.5%) | 3,382 (22.6%) |
| 65 to 74 Years | 1,240 (22.9%) | 1,380 (23.5%) |
| 75 Years and over | 1,593 (49.7%) | 1,964 (50.0%) |
Disability Class by Sex by Age in Oconee County
Disability Class: Hearing Difficulty
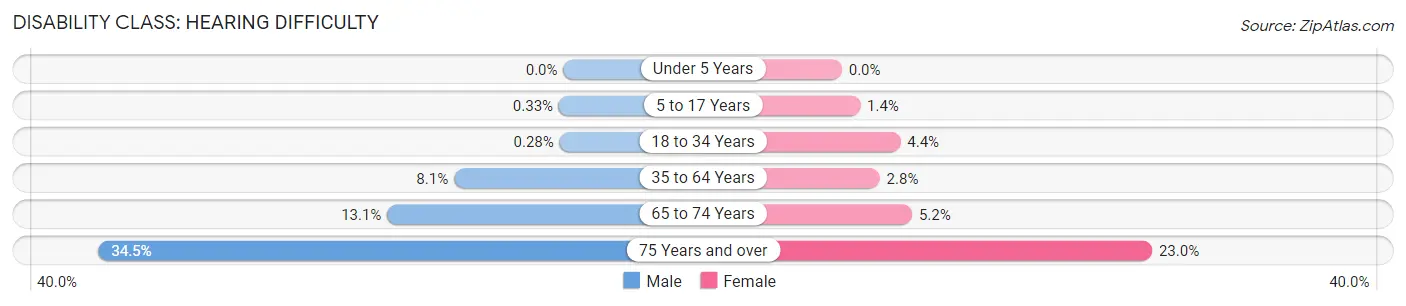
| Age Bracket | Male | Female |
| Under 5 Years | 0 (0.0%) | 0 (0.0%) |
| 5 to 17 Years | 19 (0.3%) | 79 (1.4%) |
| 18 to 34 Years | 21 (0.3%) | 316 (4.3%) |
| 35 to 64 Years | 1,195 (8.1%) | 420 (2.8%) |
| 65 to 74 Years | 708 (13.1%) | 306 (5.2%) |
| 75 Years and over | 1,106 (34.5%) | 905 (23.0%) |
Disability Class: Vision Difficulty
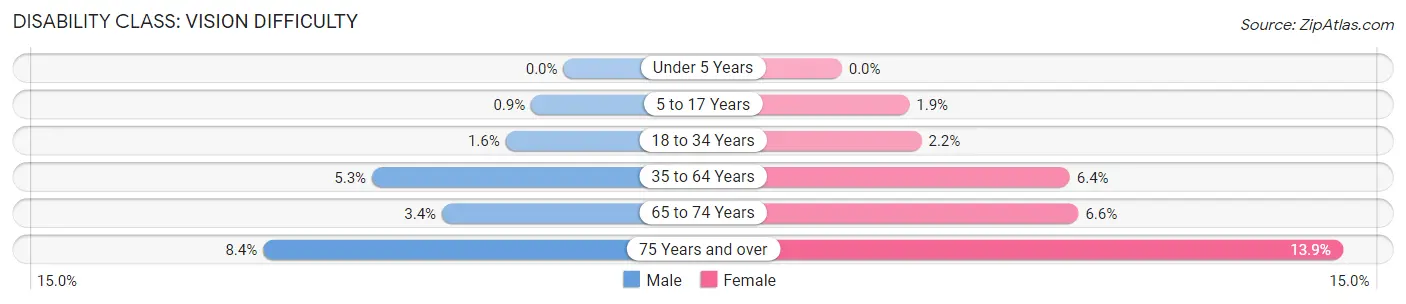
| Age Bracket | Male | Female |
| Under 5 Years | 0 (0.0%) | 0 (0.0%) |
| 5 to 17 Years | 52 (0.9%) | 109 (1.9%) |
| 18 to 34 Years | 122 (1.6%) | 161 (2.2%) |
| 35 to 64 Years | 784 (5.3%) | 951 (6.4%) |
| 65 to 74 Years | 183 (3.4%) | 387 (6.6%) |
| 75 Years and over | 268 (8.4%) | 548 (13.9%) |
Disability Class: Cognitive Difficulty
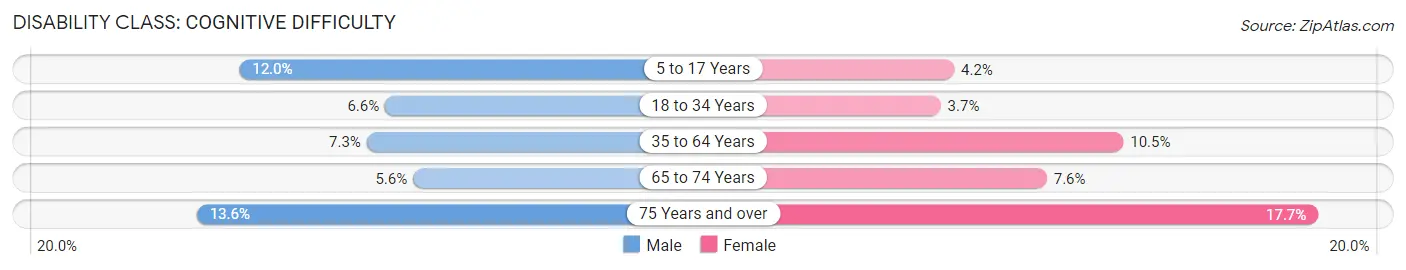
| Age Bracket | Male | Female |
| 5 to 17 Years | 695 (12.0%) | 242 (4.2%) |
| 18 to 34 Years | 503 (6.6%) | 267 (3.7%) |
| 35 to 64 Years | 1,074 (7.3%) | 1,564 (10.4%) |
| 65 to 74 Years | 302 (5.6%) | 447 (7.6%) |
| 75 Years and over | 436 (13.6%) | 695 (17.7%) |
Disability Class: Ambulatory Difficulty
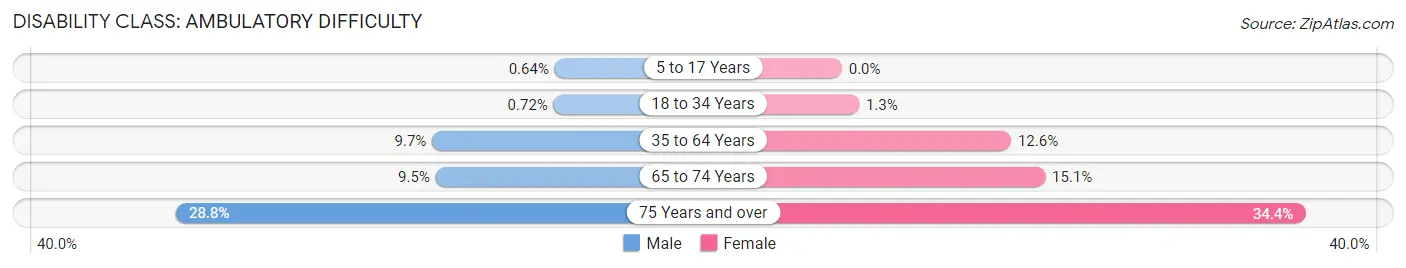
| Age Bracket | Male | Female |
| 5 to 17 Years | 37 (0.6%) | 0 (0.0%) |
| 18 to 34 Years | 55 (0.7%) | 93 (1.3%) |
| 35 to 64 Years | 1,433 (9.7%) | 1,881 (12.6%) |
| 65 to 74 Years | 513 (9.5%) | 887 (15.1%) |
| 75 Years and over | 921 (28.7%) | 1,352 (34.4%) |
Disability Class: Self-Care Difficulty
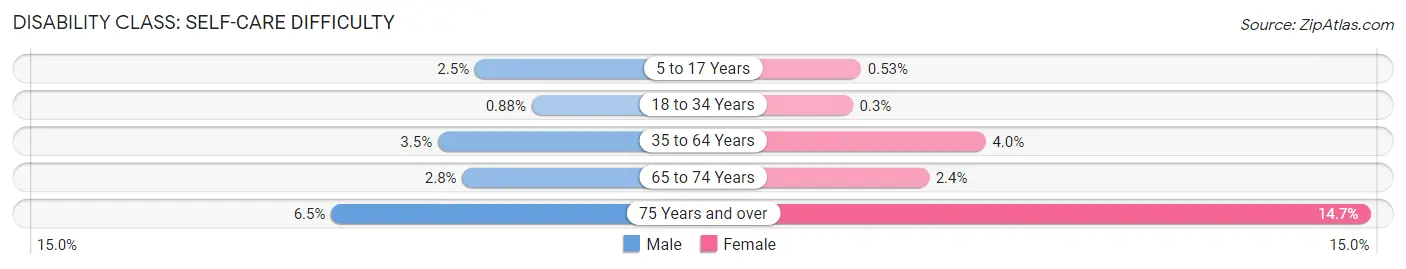
| Age Bracket | Male | Female |
| 5 to 17 Years | 142 (2.5%) | 31 (0.5%) |
| 18 to 34 Years | 67 (0.9%) | 22 (0.3%) |
| 35 to 64 Years | 514 (3.5%) | 599 (4.0%) |
| 65 to 74 Years | 152 (2.8%) | 142 (2.4%) |
| 75 Years and over | 207 (6.5%) | 578 (14.7%) |
Technology Access in Oconee County
Computing Device Access in Oconee County
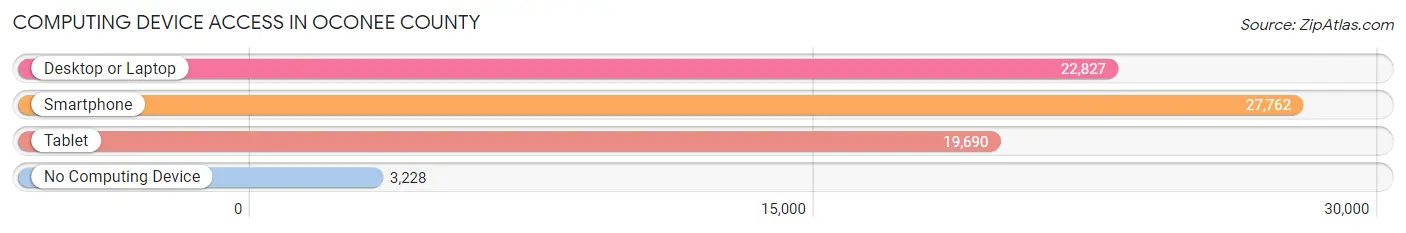
| Device Type | # Households | % Households |
| Desktop or Laptop | 22,827 | 68.7% |
| Smartphone | 27,762 | 83.5% |
| Tablet | 19,690 | 59.2% |
| No Computing Device | 3,228 | 9.7% |
| Total | 33,240 | 100.0% |
Internet Access in Oconee County
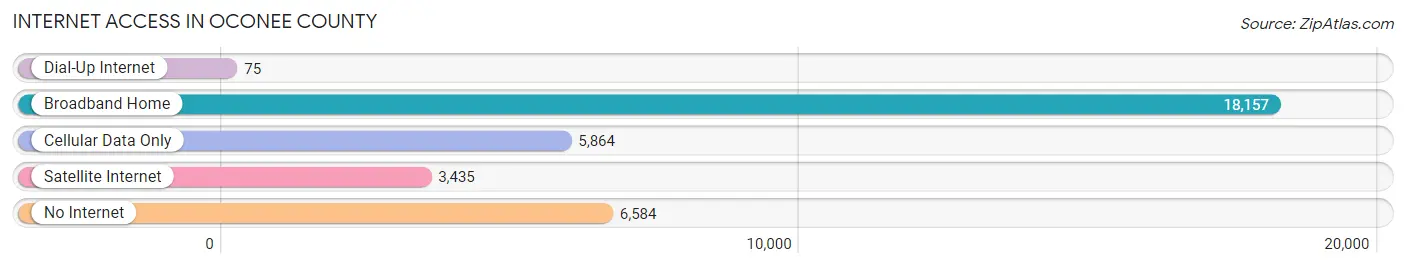
| Internet Type | # Households | % Households |
| Dial-Up Internet | 75 | 0.2% |
| Broadband Home | 18,157 | 54.6% |
| Cellular Data Only | 5,864 | 17.6% |
| Satellite Internet | 3,435 | 10.3% |
| No Internet | 6,584 | 19.8% |
| Total | 33,240 | 100.0% |
Oconee County Summary
Oconee County is located in the northwest corner of South Carolina, and is part of the Upstate region of the state. It is bordered by Pickens County to the north, Anderson County to the east, and Greenville and Spartanburg Counties to the south. The county seat is Walhalla, and the largest city is Seneca. The county was formed in 1868 from parts of Pickens and Anderson Counties, and was named for the Cherokee chief Oconee.
Geography
Oconee County is located in the foothills of the Blue Ridge Mountains, and is part of the Piedmont region of South Carolina. The county is mostly mountainous, with the highest point being Sassafras Mountain at 3,553 feet. The county is drained by the Keowee River, which flows through the county from north to south. The county is also home to several lakes, including Lake Keowee, Lake Jocassee, and Lake Hartwell.
The county has a total area of 441 square miles, of which 437 square miles is land and 4.2 square miles is water.
Demographics
As of the 2010 census, Oconee County had a population of 74,273. The racial makeup of the county was 87.2% White, 8.3% Black or African American, 0.4% Native American, 1.2% Asian, 0.1% Pacific Islander, 1.3% from other races, and 1.5% from two or more races. Hispanic or Latino of any race were 3.2% of the population.
The median income for a household in the county was $45,945, and the median income for a family was $54,817. The per capita income for the county was $24,845. About 8.7% of families and 11.7% of the population were below the poverty line, including 15.2% of those under age 18 and 8.2% of those age 65 or over.
Economy
Oconee County is home to several major employers, including Duke Energy, Oconee Nuclear Station, and Oconee Medical Center. The county is also home to several manufacturing companies, including Oconee Textiles, Oconee Plastics, and Oconee Metal Products.
The county is also home to several tourist attractions, including the Oconee State Park, the Oconee Heritage Center, and the Oconee County Museum.
The county is served by the Oconee County School District, which includes seven elementary schools, three middle schools, and two high schools. The county is also home to several private schools, including the Oconee Christian Academy and the Oconee Academy.
Conclusion
Oconee County is a rural county located in the northwest corner of South Carolina. It is home to several major employers, tourist attractions, and educational institutions. The county has a diverse population and a strong economy, and is a great place to live and work.
Common Questions
What is Per Capita Income in Oconee County?
Per Capita income in Oconee County is $35,315.
What is the Median Family Income in Oconee County?
Median Family Income in Oconee County is $73,382.
What is the Median Household income in Oconee County?
Median Household Income in Oconee County is $56,710.
What is Income or Wage Gap in Oconee County?
Income or Wage Gap in Oconee County is 30.1%.
Women in Oconee County earn 69.9 cents for every dollar earned by a man.
What is Family Income Deficit in Oconee County?
Family Income Deficit in Oconee County is $10,511.
Families that are below poverty line in Oconee County earn $10,511 less on average than the poverty threshold level.
What is Inequality or Gini Index in Oconee County?
Inequality or Gini Index in Oconee County is 0.49.
What is the Total Population of Oconee County?
Total Population of Oconee County is 78,775.
What is the Total Male Population of Oconee County?
Total Male Population of Oconee County is 38,804.
What is the Total Female Population of Oconee County?
Total Female Population of Oconee County is 39,971.
What is the Ratio of Males per 100 Females in Oconee County?
There are 97.08 Males per 100 Females in Oconee County.
What is the Ratio of Females per 100 Males in Oconee County?
There are 103.01 Females per 100 Males in Oconee County.
What is the Median Population Age in Oconee County?
Median Population Age in Oconee County is 46.2 Years.
What is the Average Family Size in Oconee County
Average Family Size in Oconee County is 2.9 People.
What is the Average Household Size in Oconee County
Average Household Size in Oconee County is 2.3 People.
How Large is the Labor Force in Oconee County?
There are 34,118 People in the Labor Forcein in Oconee County.
What is the Percentage of People in the Labor Force in Oconee County?
52.1% of People are in the Labor Force in Oconee County.
What is the Unemployment Rate in Oconee County?
Unemployment Rate in Oconee County is 5.8%.