Cities with the Largest Laotian Community in the United States
RELATED REPORTS & OPTIONS
Laotian
United States
Compare Cities
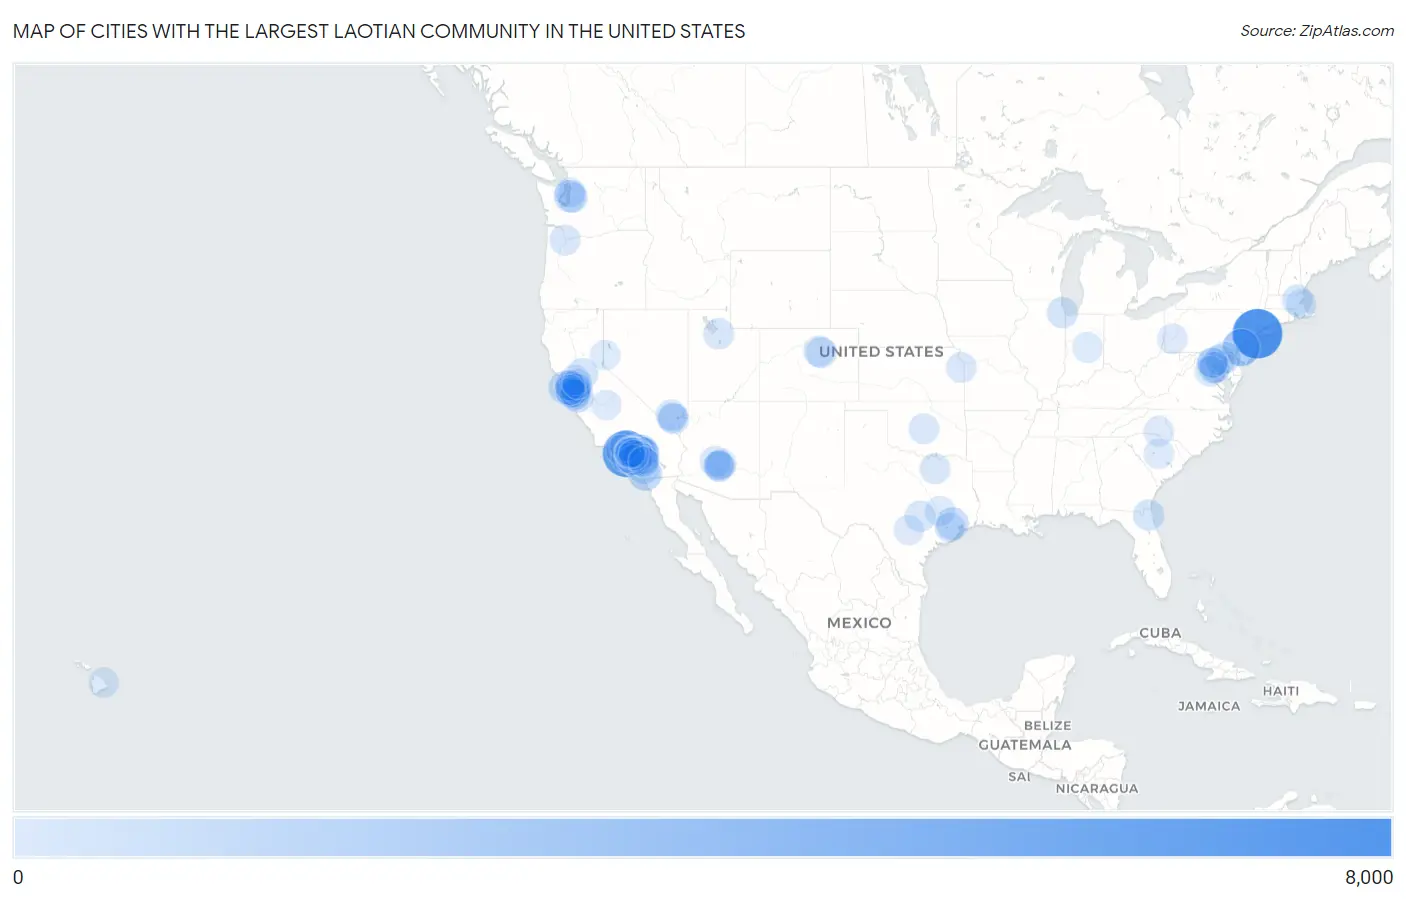
Map of Cities with the Largest Laotian Community in the United States
0
8,000
Cities with the Largest Laotian Community in the United States
| City | Laotian | vs State | vs National | |
| 1. | New York | 6,736 | 8,672(77.68%)#1 | 145,031(4.64%)#1 |
| 2. | Los Angeles | 5,803 | 54,262(10.69%)#1 | 145,031(4.00%)#2 |
| 3. | Philadelphia | 2,594 | 5,158(50.29%)#1 | 145,031(1.79%)#3 |
| 4. | San Diego | 1,445 | 54,262(2.66%)#2 | 145,031(1.00%)#4 |
| 5. | Rancho Cucamonga | 1,286 | 54,262(2.37%)#3 | 145,031(0.89%)#5 |
| 6. | San Francisco | 1,160 | 54,262(2.14%)#4 | 145,031(0.80%)#6 |
| 7. | San Bernardino | 1,111 | 54,262(2.05%)#5 | 145,031(0.77%)#7 |
| 8. | Loma Linda | 1,082 | 54,262(1.99%)#6 | 145,031(0.75%)#8 |
| 9. | Houston | 1,070 | 11,304(9.47%)#1 | 145,031(0.74%)#9 |
| 10. | Fontana | 1,059 | 54,262(1.95%)#7 | 145,031(0.73%)#10 |
| 11. | Irvine | 995 | 54,262(1.83%)#8 | 145,031(0.69%)#11 |
| 12. | San Jose | 985 | 54,262(1.82%)#9 | 145,031(0.68%)#12 |
| 13. | Seattle | 881 | 5,455(16.15%)#1 | 145,031(0.61%)#13 |
| 14. | Mission Viejo | 878 | 54,262(1.62%)#10 | 145,031(0.61%)#14 |
| 15. | Hayward | 709 | 54,262(1.31%)#11 | 145,031(0.49%)#15 |
| 16. | Edgewood | 695 | 4,341(16.01%)#1 | 145,031(0.48%)#16 |
| 17. | Chino Hills | 669 | 54,262(1.23%)#12 | 145,031(0.46%)#17 |
| 18. | Chino | 615 | 54,262(1.13%)#13 | 145,031(0.42%)#18 |
| 19. | Anaheim | 603 | 54,262(1.11%)#14 | 145,031(0.42%)#19 |
| 20. | San Marcos | 583 | 54,262(1.07%)#15 | 145,031(0.40%)#20 |
| 21. | Sacramento | 579 | 54,262(1.07%)#16 | 145,031(0.40%)#21 |
| 22. | Jacksonville | 555 | 4,571(12.14%)#1 | 145,031(0.38%)#22 |
| 23. | Chicago | 552 | 2,678(20.61%)#1 | 145,031(0.38%)#23 |
| 24. | Denver | 531 | 3,077(17.26%)#1 | 145,031(0.37%)#24 |
| 25. | Las Vegas | 523 | 2,280(22.94%)#1 | 145,031(0.36%)#25 |
| 26. | Aurora | 518 | 3,077(16.83%)#2 | 145,031(0.36%)#26 |
| 27. | South Salt Lake | 505 | 1,284(39.33%)#1 | 145,031(0.35%)#27 |
| 28. | Austin | 495 | 11,304(4.38%)#2 | 145,031(0.34%)#28 |
| 29. | Arlington | 491 | 3,534(13.89%)#1 | 145,031(0.34%)#29 |
| 30. | Rockville | 491 | 4,341(11.31%)#2 | 145,031(0.34%)#30 |
| 31. | Arcadia | 466 | 54,262(0.86%)#17 | 145,031(0.32%)#31 |
| 32. | Daly City | 465 | 54,262(0.86%)#18 | 145,031(0.32%)#32 |
| 33. | Union City | 461 | 54,262(0.85%)#19 | 145,031(0.32%)#33 |
| 34. | Portland | 440 | 2,540(17.32%)#1 | 145,031(0.30%)#34 |
| 35. | Woburn | 434 | 3,673(11.82%)#1 | 145,031(0.30%)#35 |
| 36. | Rowland Heights | 433 | 54,262(0.80%)#20 | 145,031(0.30%)#36 |
| 37. | Baltimore | 432 | 4,341(9.95%)#3 | 145,031(0.30%)#37 |
| 38. | Oakland | 432 | 54,262(0.80%)#21 | 145,031(0.30%)#38 |
| 39. | Washington | 430 | 430(100.00%)#1 | 145,031(0.30%)#39 |
| 40. | Eastvale | 430 | 54,262(0.79%)#22 | 145,031(0.30%)#40 |
| 41. | Allen | 428 | 11,304(3.79%)#3 | 145,031(0.30%)#41 |
| 42. | Milpitas | 408 | 54,262(0.75%)#23 | 145,031(0.28%)#42 |
| 43. | Simi Valley | 404 | 54,262(0.74%)#24 | 145,031(0.28%)#43 |
| 44. | Alhambra | 400 | 54,262(0.74%)#25 | 145,031(0.28%)#44 |
| 45. | Diamond Bar | 400 | 54,262(0.74%)#26 | 145,031(0.28%)#45 |
| 46. | Oklahoma City | 396 | 893(44.34%)#1 | 145,031(0.27%)#46 |
| 47. | San Ramon | 395 | 54,262(0.73%)#27 | 145,031(0.27%)#47 |
| 48. | Ontario | 390 | 54,262(0.72%)#28 | 145,031(0.27%)#48 |
| 49. | Lake Ridge | 390 | 3,534(11.04%)#2 | 145,031(0.27%)#49 |
| 50. | Fremont | 388 | 54,262(0.72%)#29 | 145,031(0.27%)#50 |
| 51. | Santa Clara | 380 | 54,262(0.70%)#30 | 145,031(0.26%)#51 |
| 52. | Upland | 375 | 54,262(0.69%)#31 | 145,031(0.26%)#52 |
| 53. | Redlands | 373 | 54,262(0.69%)#32 | 145,031(0.26%)#53 |
| 54. | Phoenix | 371 | 3,298(11.25%)#1 | 145,031(0.26%)#54 |
| 55. | Henderson | 356 | 2,280(15.61%)#2 | 145,031(0.25%)#55 |
| 56. | Huntington Beach | 350 | 54,262(0.65%)#33 | 145,031(0.24%)#56 |
| 57. | Gilbert | 348 | 3,298(10.55%)#2 | 145,031(0.24%)#57 |
| 58. | Olathe | 345 | 705(48.94%)#1 | 145,031(0.24%)#58 |
| 59. | Lake Forest | 344 | 54,262(0.63%)#34 | 145,031(0.24%)#59 |
| 60. | Bellevue | 343 | 5,455(6.29%)#2 | 145,031(0.24%)#60 |
| 61. | Chandler | 334 | 3,298(10.13%)#3 | 145,031(0.23%)#61 |
| 62. | Pasadena | 333 | 54,262(0.61%)#35 | 145,031(0.23%)#62 |
| 63. | Long Beach | 331 | 54,262(0.61%)#36 | 145,031(0.23%)#63 |
| 64. | East San Gabriel | 331 | 54,262(0.61%)#37 | 145,031(0.23%)#64 |
| 65. | Berkeley | 328 | 54,262(0.60%)#38 | 145,031(0.23%)#65 |
| 66. | Fullerton | 326 | 54,262(0.60%)#39 | 145,031(0.22%)#66 |
| 67. | Montgomery Village | 324 | 4,341(7.46%)#4 | 145,031(0.22%)#67 |
| 68. | Fairfield | 320 | 54,262(0.59%)#40 | 145,031(0.22%)#68 |
| 69. | San Antonio | 317 | 11,304(2.80%)#4 | 145,031(0.22%)#69 |
| 70. | College Station | 317 | 11,304(2.80%)#5 | 145,031(0.22%)#70 |
| 71. | Mount Holly | 313 | 1,940(16.13%)#1 | 145,031(0.22%)#71 |
| 72. | Boston | 312 | 3,673(8.49%)#2 | 145,031(0.22%)#72 |
| 73. | Dublin | 308 | 54,262(0.57%)#41 | 145,031(0.21%)#73 |
| 74. | Lynnwood | 306 | 5,455(5.61%)#3 | 145,031(0.21%)#74 |
| 75. | Temple City | 306 | 54,262(0.56%)#42 | 145,031(0.21%)#75 |
| 76. | Pittsburgh | 305 | 5,158(5.91%)#2 | 145,031(0.21%)#76 |
| 77. | Mesa | 304 | 3,298(9.22%)#4 | 145,031(0.21%)#77 |
| 78. | Fishers | 303 | 1,441(21.03%)#1 | 145,031(0.21%)#78 |
| 79. | Menifee | 295 | 54,262(0.54%)#43 | 145,031(0.20%)#79 |
| 80. | Torrance | 293 | 54,262(0.54%)#44 | 145,031(0.20%)#80 |
| 81. | Hilo | 293 | 1,169(25.06%)#1 | 145,031(0.20%)#81 |
| 82. | Home Gardens | 293 | 54,262(0.54%)#45 | 145,031(0.20%)#82 |
| 83. | Santa Clarita | 289 | 54,262(0.53%)#46 | 145,031(0.20%)#83 |
| 84. | Columbia | 289 | 650(44.46%)#1 | 145,031(0.20%)#84 |
| 85. | Richmond | 289 | 54,262(0.53%)#47 | 145,031(0.20%)#85 |
| 86. | Sugar Land | 289 | 11,304(2.56%)#6 | 145,031(0.20%)#86 |
| 87. | San Carlos | 284 | 54,262(0.52%)#48 | 145,031(0.20%)#87 |
| 88. | Temecula | 282 | 54,262(0.52%)#49 | 145,031(0.19%)#88 |
| 89. | Monterey Park | 282 | 54,262(0.52%)#50 | 145,031(0.19%)#89 |
| 90. | South San Francisco | 281 | 54,262(0.52%)#51 | 145,031(0.19%)#90 |
| 91. | Antioch | 280 | 54,262(0.52%)#52 | 145,031(0.19%)#91 |
| 92. | Costa Mesa | 280 | 54,262(0.52%)#53 | 145,031(0.19%)#92 |
| 93. | Fresno | 271 | 54,262(0.50%)#54 | 145,031(0.19%)#93 |
| 94. | Covina | 270 | 54,262(0.50%)#55 | 145,031(0.19%)#94 |
| 95. | Paradise | 268 | 2,280(11.75%)#3 | 145,031(0.18%)#95 |
| 96. | San Gabriel | 267 | 54,262(0.49%)#56 | 145,031(0.18%)#96 |
| 97. | Reno | 265 | 2,280(11.62%)#4 | 145,031(0.18%)#97 |
| 98. | Brea | 265 | 54,262(0.49%)#57 | 145,031(0.18%)#98 |
| 99. | Tempe | 264 | 3,298(8.00%)#5 | 145,031(0.18%)#99 |
| 100. | Murrieta | 263 | 54,262(0.48%)#58 | 145,031(0.18%)#100 |
Common Questions
What are the Top 10 Cities with the Largest Laotian Community in the United States?
Top 10 Cities with the Largest Laotian Community in the United States are:
#1
6,736
#2
5,803
#3
2,594
#4
1,445
#5
1,286
#6
1,160
#7
1,111
#8
1,082
#9
1,070
#10
1,059
What city has the Largest Laotian Community in the United States?
New York has the Largest Laotian Community in the United States with 6,736.
What is the Total Laotian Population in the United States?
Total Laotian Population in the United States is 145,031.