Aiken County, SC Map & Demographics
Aiken County Map
Aiken County Overview
$34,786
PER CAPITA INCOME
$78,829
AVG FAMILY INCOME
$63,212
AVG HOUSEHOLD INCOME
37.4%
WAGE / INCOME GAP [ % ]
62.6¢/ $1
WAGE / INCOME GAP [ $ ]
$11,525
FAMILY INCOME DEFICIT
0.45
INEQUALITY / GINI INDEX
169,865
TOTAL POPULATION
82,326
MALE POPULATION
87,539
FEMALE POPULATION
94.04
MALES / 100 FEMALES
106.33
FEMALES / 100 MALES
41.8
MEDIAN AGE
3.0
AVG FAMILY SIZE
2.5
AVG HOUSEHOLD SIZE
79,717
LABOR FORCE [ PEOPLE ]
58.0%
PERCENT IN LABOR FORCE
6.2%
UNEMPLOYMENT RATE
Aiken County Area Codes
Income in Aiken County
Income Overview in Aiken County
Per Capita Income in Aiken County is $34,786, while median incomes of families and households are $78,829 and $63,212 respectively.
| Characteristic | Number | Measure |
| Per Capita Income | 169,865 | $34,786 |
| Median Family Income | 45,283 | $78,829 |
| Mean Family Income | 45,283 | $98,264 |
| Median Household Income | 67,904 | $63,212 |
| Mean Household Income | 67,904 | $83,690 |
| Income Deficit | 45,283 | $11,525 |
| Wage / Income Gap (%) | 169,865 | 37.38% |
| Wage / Income Gap ($) | 169,865 | 62.62¢ per $1 |
| Gini / Inequality Index | 169,865 | 0.45 |
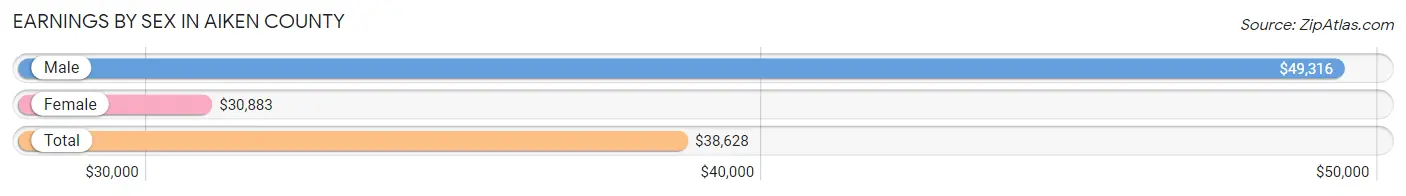
Earnings by Sex in Aiken County
Average Earnings in Aiken County are $38,628, $49,316 for men and $30,883 for women, a difference of 37.4%.
| Sex | Number | Average Earnings |
| Male | 42,247 (51.7%) | $49,316 |
| Female | 39,450 (48.3%) | $30,883 |
| Total | 81,697 (100.0%) | $38,628 |
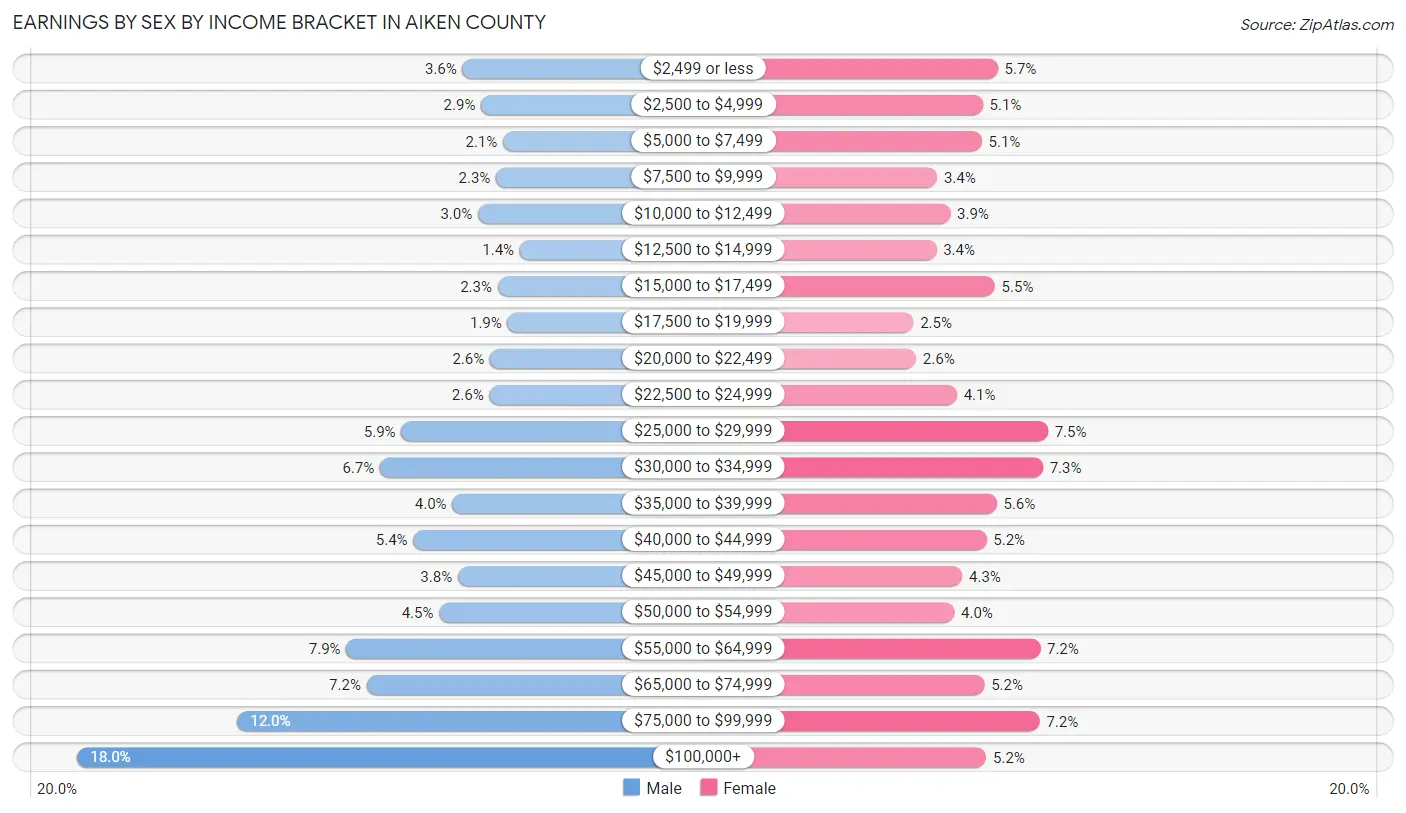
Earnings by Sex by Income Bracket in Aiken County
The most common earnings brackets in Aiken County are $100,000+ for men (7,611 | 18.0%) and $25,000 to $29,999 for women (2,970 | 7.5%).
| Income | Male | Female |
| $2,499 or less | 1,517 (3.6%) | 2,228 (5.7%) |
| $2,500 to $4,999 | 1,220 (2.9%) | 2,007 (5.1%) |
| $5,000 to $7,499 | 876 (2.1%) | 1,992 (5.1%) |
| $7,500 to $9,999 | 985 (2.3%) | 1,334 (3.4%) |
| $10,000 to $12,499 | 1,271 (3.0%) | 1,527 (3.9%) |
| $12,500 to $14,999 | 610 (1.4%) | 1,320 (3.4%) |
| $15,000 to $17,499 | 958 (2.3%) | 2,187 (5.5%) |
| $17,500 to $19,999 | 804 (1.9%) | 981 (2.5%) |
| $20,000 to $22,499 | 1,080 (2.6%) | 1,020 (2.6%) |
| $22,500 to $24,999 | 1,088 (2.6%) | 1,625 (4.1%) |
| $25,000 to $29,999 | 2,485 (5.9%) | 2,970 (7.5%) |
| $30,000 to $34,999 | 2,823 (6.7%) | 2,897 (7.3%) |
| $35,000 to $39,999 | 1,678 (4.0%) | 2,213 (5.6%) |
| $40,000 to $44,999 | 2,294 (5.4%) | 2,062 (5.2%) |
| $45,000 to $49,999 | 1,590 (3.8%) | 1,706 (4.3%) |
| $50,000 to $54,999 | 1,885 (4.5%) | 1,585 (4.0%) |
| $55,000 to $64,999 | 3,355 (7.9%) | 2,856 (7.2%) |
| $65,000 to $74,999 | 3,035 (7.2%) | 2,033 (5.1%) |
| $75,000 to $99,999 | 5,082 (12.0%) | 2,848 (7.2%) |
| $100,000+ | 7,611 (18.0%) | 2,059 (5.2%) |
| Total | 42,247 (100.0%) | 39,450 (100.0%) |
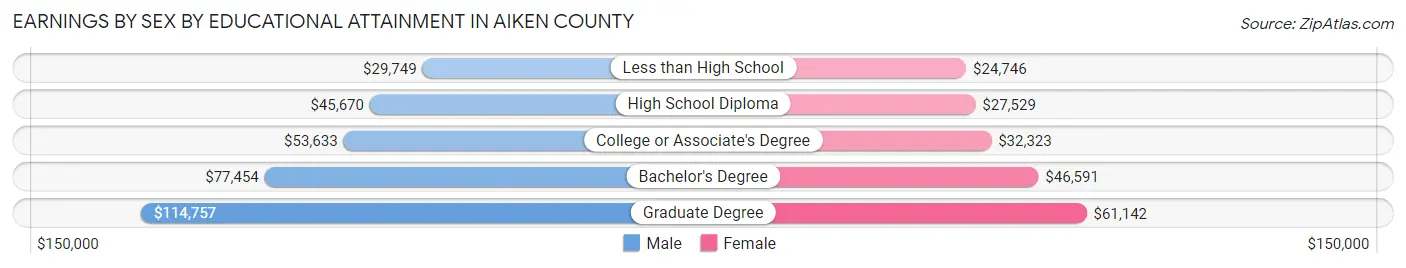
Earnings by Sex by Educational Attainment in Aiken County
Average earnings in Aiken County are $56,376 for men and $35,563 for women, a difference of 36.9%. Men with an educational attainment of graduate degree enjoy the highest average annual earnings of $114,757, while those with less than high school education earn the least with $29,749. Women with an educational attainment of graduate degree earn the most with the average annual earnings of $61,142, while those with less than high school education have the smallest earnings of $24,746.
| Educational Attainment | Male Income | Female Income |
| Less than High School | $29,749 | $24,746 |
| High School Diploma | $45,670 | $27,529 |
| College or Associate's Degree | $53,633 | $32,323 |
| Bachelor's Degree | $77,454 | $46,591 |
| Graduate Degree | $114,757 | $61,142 |
| Total | $56,376 | $35,563 |
Family Income in Aiken County
Family Income Brackets in Aiken County
According to the Aiken County family income data, there are 8,921 families falling into the $100,000 to $149,999 income range, which is the most common income bracket and makes up 19.7% of all families. Conversely, the $10,000 to $14,999 income bracket is the least frequent group with only 1,132 families (2.5%) belonging to this category.
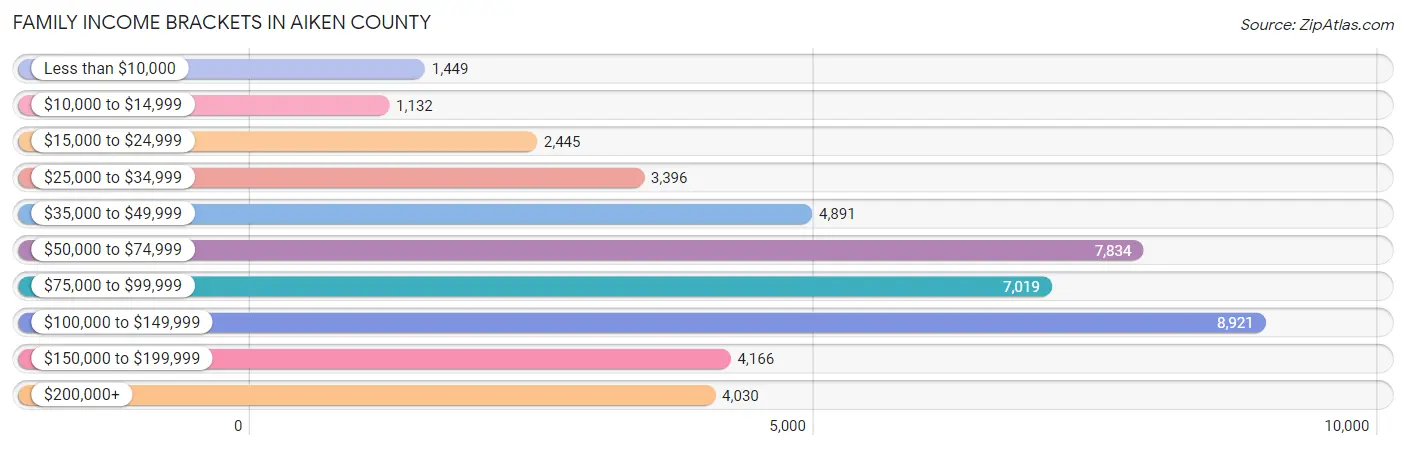
| Income Bracket | # Families | % Families |
| Less than $10,000 | 1,449 | 3.2% |
| $10,000 to $14,999 | 1,132 | 2.5% |
| $15,000 to $24,999 | 2,445 | 5.4% |
| $25,000 to $34,999 | 3,396 | 7.5% |
| $35,000 to $49,999 | 4,891 | 10.8% |
| $50,000 to $74,999 | 7,834 | 17.3% |
| $75,000 to $99,999 | 7,019 | 15.5% |
| $100,000 to $149,999 | 8,921 | 19.7% |
| $150,000 to $199,999 | 4,166 | 9.2% |
| $200,000+ | 4,030 | 8.9% |
Family Income by Famaliy Size in Aiken County
7+ person families (627 | 1.4%) account for the highest median family income in Aiken County with $107,689 per family, while 2-person families (24,259 | 53.6%) have the highest median income of $36,654 per family member.
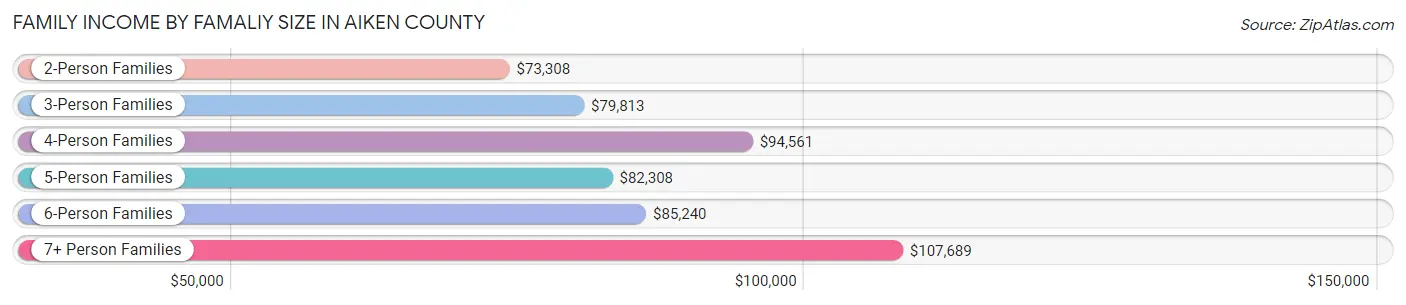
| Income Bracket | # Families | Median Income |
| 2-Person Families | 24,259 (53.6%) | $73,308 |
| 3-Person Families | 9,930 (21.9%) | $79,813 |
| 4-Person Families | 6,662 (14.7%) | $94,561 |
| 5-Person Families | 2,666 (5.9%) | $82,308 |
| 6-Person Families | 1,139 (2.5%) | $85,240 |
| 7+ Person Families | 627 (1.4%) | $107,689 |
| Total | 45,283 (100.0%) | $78,829 |
Family Income by Number of Earners in Aiken County
The median family income in Aiken County is $78,829, with families comprising 3+ earners (3,386) having the highest median family income of $125,556, while families with no earners (9,659) have the lowest median family income of $53,038, accounting for 7.5% and 21.3% of families, respectively.
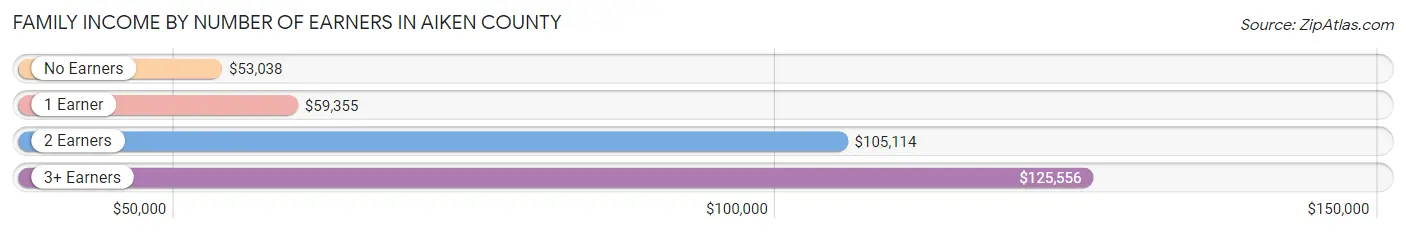
| Number of Earners | # Families | Median Income |
| No Earners | 9,659 (21.3%) | $53,038 |
| 1 Earner | 15,401 (34.0%) | $59,355 |
| 2 Earners | 16,837 (37.2%) | $105,114 |
| 3+ Earners | 3,386 (7.5%) | $125,556 |
| Total | 45,283 (100.0%) | $78,829 |
Household Income in Aiken County
Household Income Brackets in Aiken County
With 11,747 households falling in the category, the $50,000 to $74,999 income range is the most frequent in Aiken County, accounting for 17.3% of all households. In contrast, only 3,395 households (5.0%) fall into the $10,000 to $14,999 income bracket, making it the least populous group.
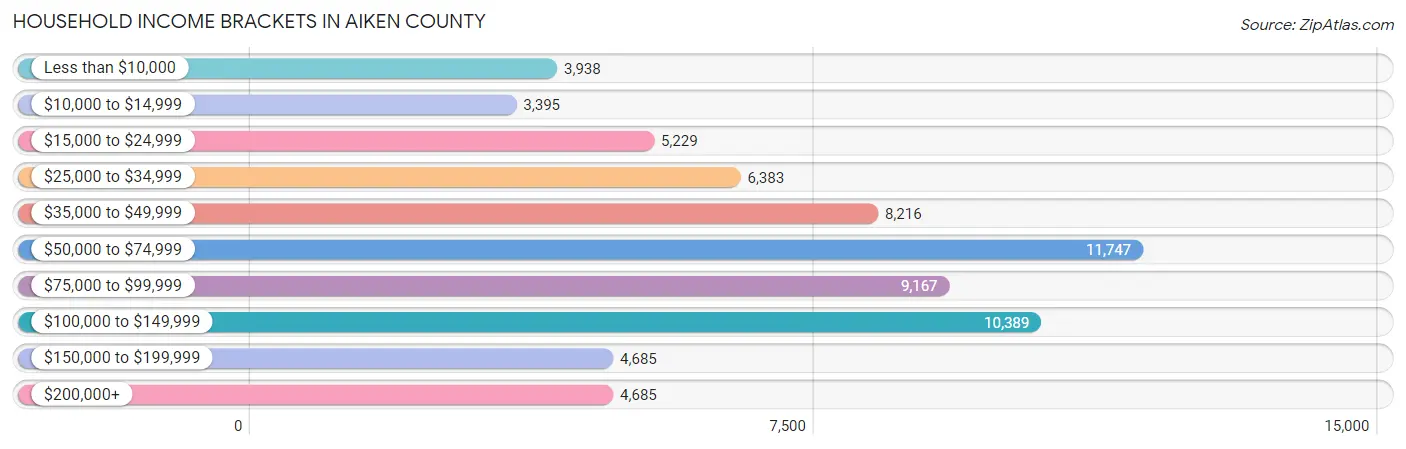
| Income Bracket | # Households | % Households |
| Less than $10,000 | 3,938 | 5.8% |
| $10,000 to $14,999 | 3,395 | 5.0% |
| $15,000 to $24,999 | 5,229 | 7.7% |
| $25,000 to $34,999 | 6,383 | 9.4% |
| $35,000 to $49,999 | 8,216 | 12.1% |
| $50,000 to $74,999 | 11,747 | 17.3% |
| $75,000 to $99,999 | 9,167 | 13.5% |
| $100,000 to $149,999 | 10,389 | 15.3% |
| $150,000 to $199,999 | 4,685 | 6.9% |
| $200,000+ | 4,685 | 6.9% |
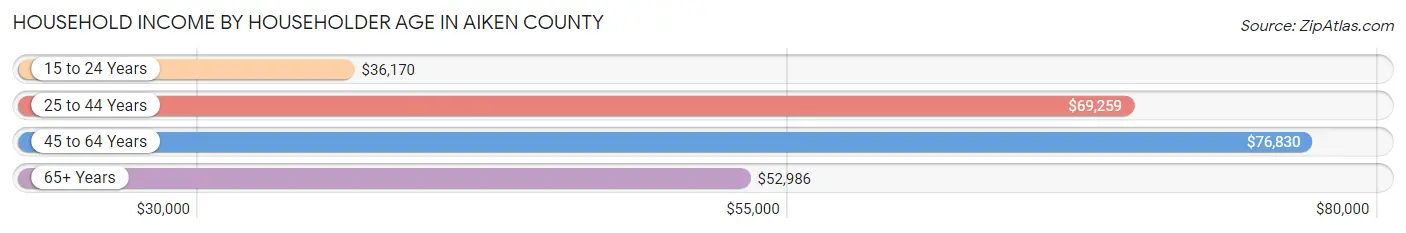
Household Income by Householder Age in Aiken County
The median household income in Aiken County is $63,212, with the highest median household income of $76,830 found in the 45 to 64 years age bracket for the primary householder. A total of 24,839 households (36.6%) fall into this category. Meanwhile, the 15 to 24 years age bracket for the primary householder has the lowest median household income of $36,170, with 1,663 households (2.5%) in this group.
| Income Bracket | # Households | Median Income |
| 15 to 24 Years | 1,663 (2.5%) | $36,170 |
| 25 to 44 Years | 20,135 (29.6%) | $69,259 |
| 45 to 64 Years | 24,839 (36.6%) | $76,830 |
| 65+ Years | 21,267 (31.3%) | $52,986 |
| Total | 67,904 (100.0%) | $63,212 |
Poverty in Aiken County
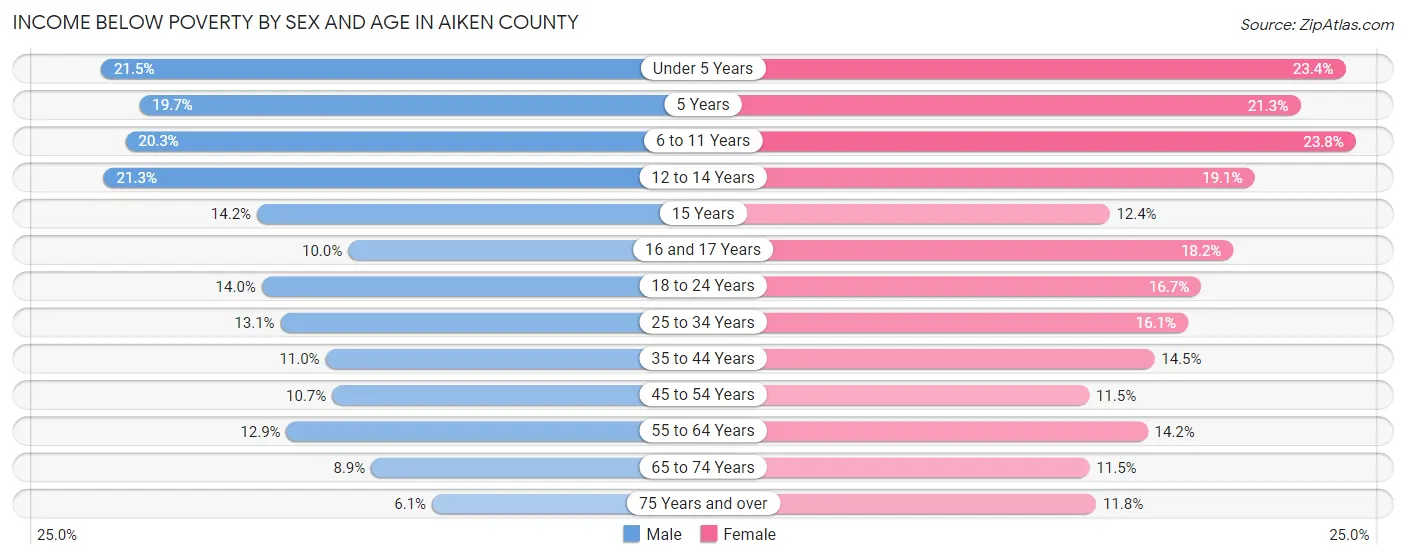
Income Below Poverty by Sex and Age in Aiken County
With 13.0% poverty level for males and 15.2% for females among the residents of Aiken County, under 5 year old males and 6 to 11 year old females are the most vulnerable to poverty, with 1,021 males (21.4%) and 1,439 females (23.8%) in their respective age groups living below the poverty level.
| Age Bracket | Male | Female |
| Under 5 Years | 1,021 (21.4%) | 1,068 (23.4%) |
| 5 Years | 178 (19.7%) | 165 (21.3%) |
| 6 to 11 Years | 1,129 (20.3%) | 1,439 (23.8%) |
| 12 to 14 Years | 773 (21.3%) | 591 (19.1%) |
| 15 Years | 213 (14.2%) | 132 (12.4%) |
| 16 and 17 Years | 167 (10.0%) | 380 (18.2%) |
| 18 to 24 Years | 887 (14.0%) | 1,036 (16.7%) |
| 25 to 34 Years | 1,383 (13.1%) | 1,737 (16.1%) |
| 35 to 44 Years | 1,052 (11.0%) | 1,483 (14.5%) |
| 45 to 54 Years | 1,078 (10.7%) | 1,201 (11.5%) |
| 55 to 64 Years | 1,496 (12.9%) | 1,732 (14.2%) |
| 65 to 74 Years | 825 (8.9%) | 1,254 (11.5%) |
| 75 Years and over | 346 (6.1%) | 887 (11.8%) |
| Total | 10,548 (13.0%) | 13,105 (15.2%) |
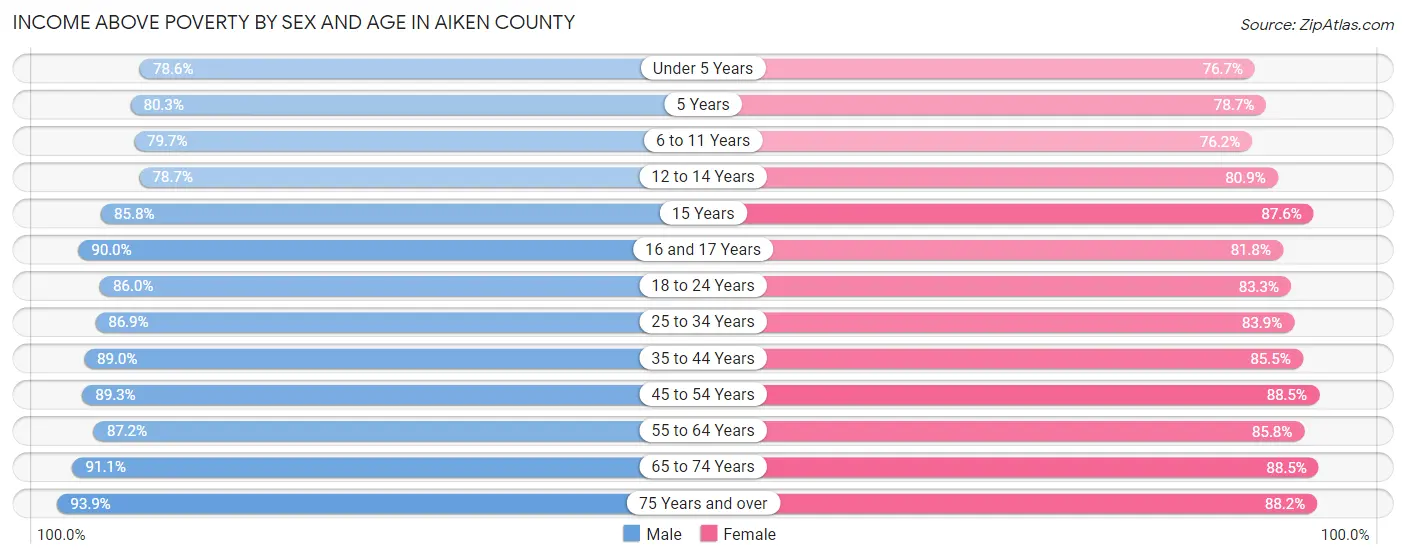
Income Above Poverty by Sex and Age in Aiken County
According to the poverty statistics in Aiken County, males aged 75 years and over and females aged 45 to 54 years are the age groups that are most secure financially, with 93.9% of males and 88.5% of females in these age groups living above the poverty line.
| Age Bracket | Male | Female |
| Under 5 Years | 3,740 (78.5%) | 3,505 (76.6%) |
| 5 Years | 727 (80.3%) | 611 (78.7%) |
| 6 to 11 Years | 4,428 (79.7%) | 4,598 (76.2%) |
| 12 to 14 Years | 2,851 (78.7%) | 2,497 (80.9%) |
| 15 Years | 1,285 (85.8%) | 931 (87.6%) |
| 16 and 17 Years | 1,504 (90.0%) | 1,713 (81.8%) |
| 18 to 24 Years | 5,449 (86.0%) | 5,177 (83.3%) |
| 25 to 34 Years | 9,147 (86.9%) | 9,076 (83.9%) |
| 35 to 44 Years | 8,477 (89.0%) | 8,745 (85.5%) |
| 45 to 54 Years | 8,970 (89.3%) | 9,272 (88.5%) |
| 55 to 64 Years | 10,143 (87.2%) | 10,472 (85.8%) |
| 65 to 74 Years | 8,421 (91.1%) | 9,661 (88.5%) |
| 75 Years and over | 5,328 (93.9%) | 6,628 (88.2%) |
| Total | 70,470 (87.0%) | 72,886 (84.8%) |
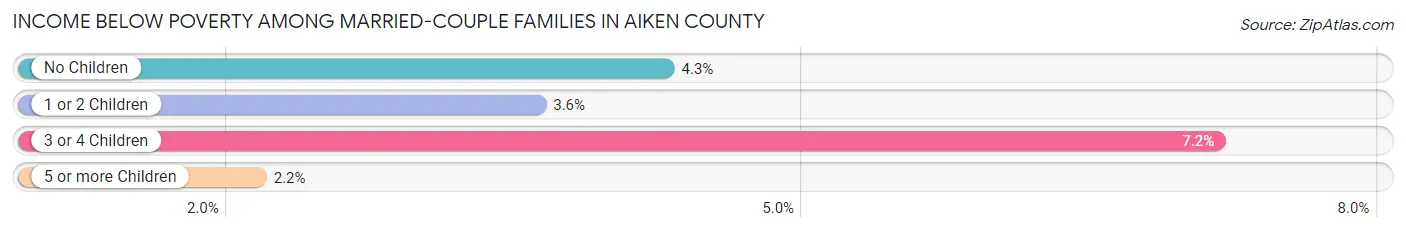
Income Below Poverty Among Married-Couple Families in Aiken County
The poverty statistics for married-couple families in Aiken County show that 4.3% or 1,437 of the total 33,560 families live below the poverty line. Families with 3 or 4 children have the highest poverty rate of 7.2%, comprising of 167 families. On the other hand, families with 5 or more children have the lowest poverty rate of 2.1%, which includes 5 families.
| Children | Above Poverty | Below Poverty |
| No Children | 20,715 (95.7%) | 927 (4.3%) |
| 1 or 2 Children | 9,014 (96.4%) | 338 (3.6%) |
| 3 or 4 Children | 2,166 (92.8%) | 167 (7.2%) |
| 5 or more Children | 228 (97.9%) | 5 (2.1%) |
| Total | 32,123 (95.7%) | 1,437 (4.3%) |
Income Below Poverty Among Single-Parent Households in Aiken County
According to the poverty data in Aiken County, 10.2% or 326 single-father households and 31.5% or 2,682 single-mother households are living below the poverty line. Among single-father households, those with 5 or more children have the highest poverty rate, with 16 households (100.0%) experiencing poverty. Likewise, among single-mother households, those with 5 or more children have the highest poverty rate, with 41 households (100.0%) falling below the poverty line.
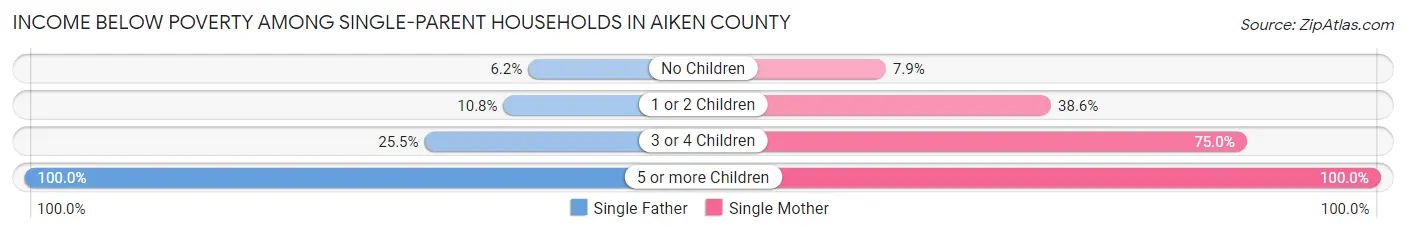
| Children | Single Father | Single Mother |
| No Children | 84 (6.2%) | 262 (7.9%) |
| 1 or 2 Children | 179 (10.8%) | 1,577 (38.6%) |
| 3 or 4 Children | 47 (25.5%) | 802 (75.0%) |
| 5 or more Children | 16 (100.0%) | 41 (100.0%) |
| Total | 326 (10.2%) | 2,682 (31.5%) |
Income Below Poverty Among Married-Couple vs Single-Parent Households in Aiken County
The poverty data for Aiken County shows that 1,437 of the married-couple family households (4.3%) and 3,008 of the single-parent households (25.7%) are living below the poverty level. Within the married-couple family households, those with 3 or 4 children have the highest poverty rate, with 167 households (7.2%) falling below the poverty line. Among the single-parent households, those with 5 or more children have the highest poverty rate, with 57 household (100.0%) living below poverty.
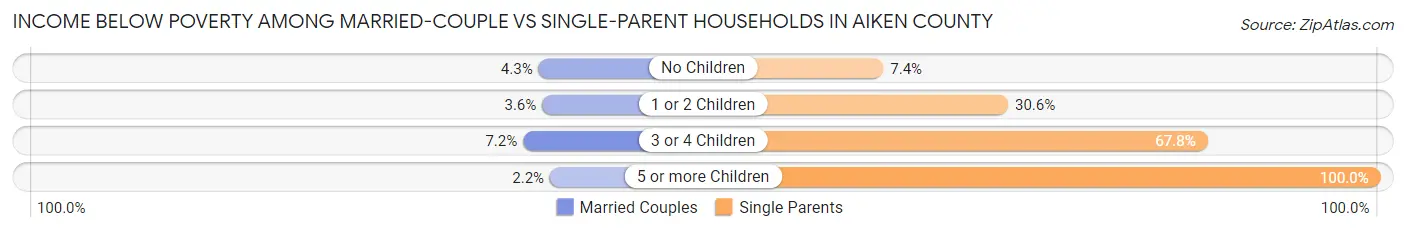
| Children | Married-Couple Families | Single-Parent Households |
| No Children | 927 (4.3%) | 346 (7.4%) |
| 1 or 2 Children | 338 (3.6%) | 1,756 (30.6%) |
| 3 or 4 Children | 167 (7.2%) | 849 (67.8%) |
| 5 or more Children | 5 (2.1%) | 57 (100.0%) |
| Total | 1,437 (4.3%) | 3,008 (25.7%) |
Race in Aiken County
The most populous races in Aiken County are White / Caucasian (114,221 | 67.2%), Black / African American (42,219 | 24.8%), and Hispanic or Latino (10,466 | 6.2%).
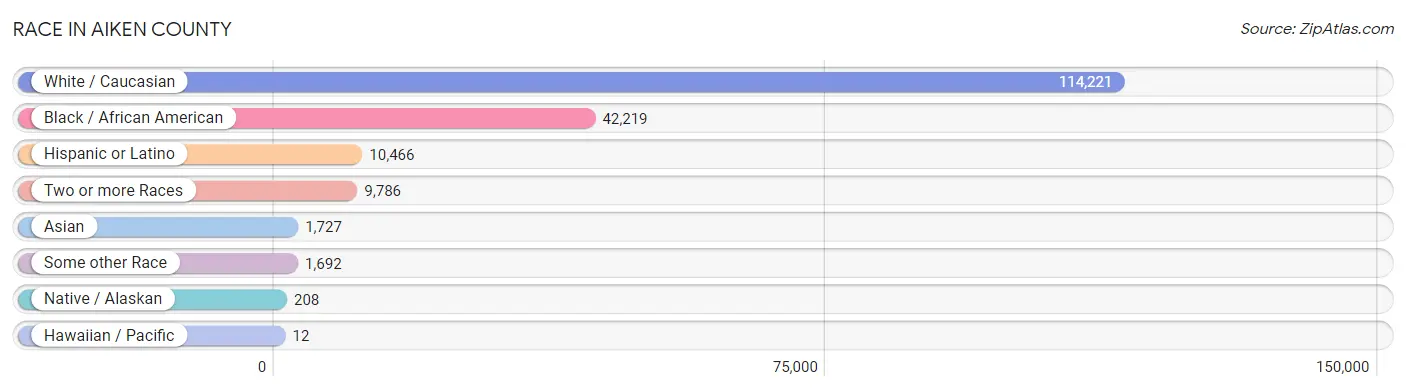
| Race | # Population | % Population |
| Asian | 1,727 | 1.0% |
| Black / African American | 42,219 | 24.8% |
| Hawaiian / Pacific | 12 | 0.0% |
| Hispanic or Latino | 10,466 | 6.2% |
| Native / Alaskan | 208 | 0.1% |
| White / Caucasian | 114,221 | 67.2% |
| Two or more Races | 9,786 | 5.8% |
| Some other Race | 1,692 | 1.0% |
| Total | 169,865 | 100.0% |
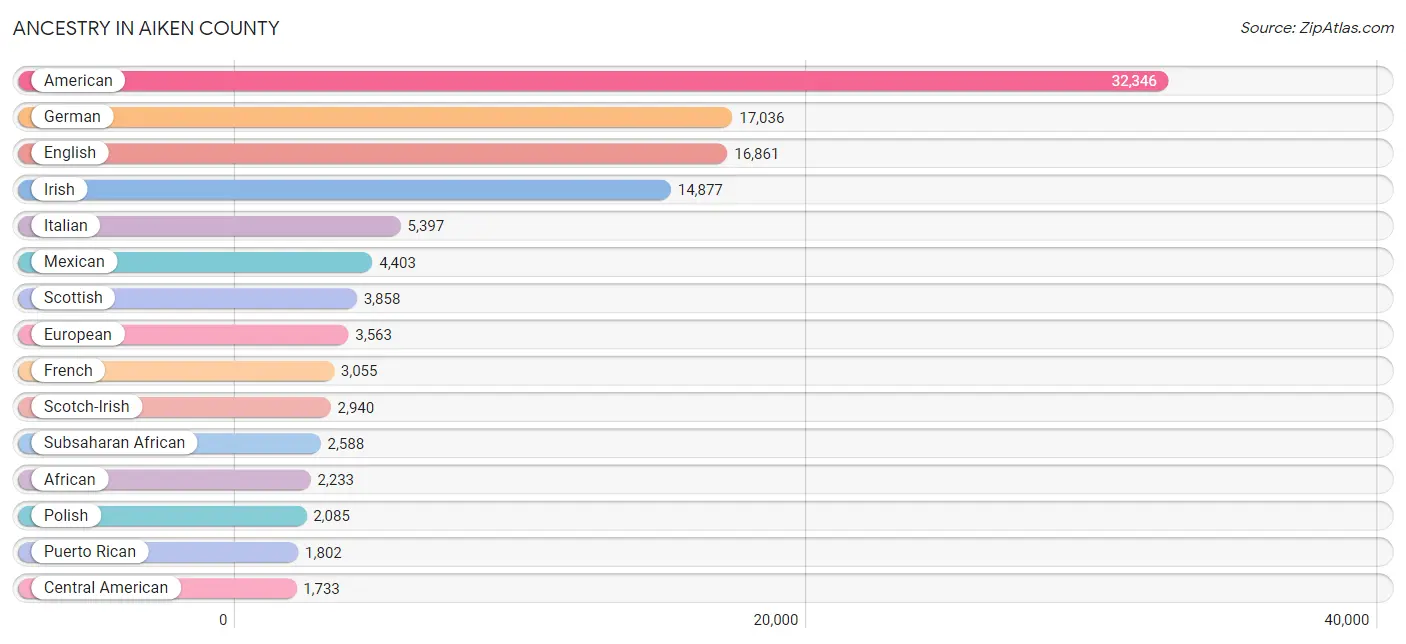
Ancestry in Aiken County
The most populous ancestries reported in Aiken County are American (32,346 | 19.0%), German (17,036 | 10.0%), English (16,861 | 9.9%), Irish (14,877 | 8.8%), and Italian (5,397 | 3.2%), together accounting for 50.9% of all Aiken County residents.
| Ancestry | # Population | % Population |
| African | 2,233 | 1.3% |
| Albanian | 123 | 0.1% |
| American | 32,346 | 19.0% |
| Apache | 15 | 0.0% |
| Arab | 229 | 0.1% |
| Armenian | 59 | 0.0% |
| Australian | 5 | 0.0% |
| Austrian | 120 | 0.1% |
| Bahamian | 80 | 0.1% |
| Bangladeshi | 4 | 0.0% |
| Basque | 1 | 0.0% |
| Belgian | 57 | 0.0% |
| Bhutanese | 698 | 0.4% |
| Blackfeet | 29 | 0.0% |
| Brazilian | 49 | 0.0% |
| British | 747 | 0.4% |
| Bulgarian | 12 | 0.0% |
| Burmese | 58 | 0.0% |
| Cajun | 37 | 0.0% |
| Canadian | 102 | 0.1% |
| Carpatho Rusyn | 14 | 0.0% |
| Celtic | 9 | 0.0% |
| Central American | 1,733 | 1.0% |
| Central American Indian | 166 | 0.1% |
| Cherokee | 736 | 0.4% |
| Chickasaw | 9 | 0.0% |
| Chilean | 43 | 0.0% |
| Choctaw | 32 | 0.0% |
| Colombian | 337 | 0.2% |
| Costa Rican | 302 | 0.2% |
| Creek | 2 | 0.0% |
| Croatian | 138 | 0.1% |
| Cuban | 714 | 0.4% |
| Czech | 381 | 0.2% |
| Czechoslovakian | 81 | 0.1% |
| Danish | 106 | 0.1% |
| Dominican | 150 | 0.1% |
| Dutch | 1,629 | 1.0% |
| Eastern European | 251 | 0.2% |
| Ecuadorian | 16 | 0.0% |
| Egyptian | 17 | 0.0% |
| English | 16,861 | 9.9% |
| European | 3,563 | 2.1% |
| Filipino | 28 | 0.0% |
| Finnish | 74 | 0.0% |
| French | 3,055 | 1.8% |
| French American Indian | 23 | 0.0% |
| French Canadian | 554 | 0.3% |
| German | 17,036 | 10.0% |
| Greek | 382 | 0.2% |
| Guatemalan | 737 | 0.4% |
| Guyanese | 81 | 0.1% |
| Haitian | 172 | 0.1% |
| Honduran | 267 | 0.2% |
| Hungarian | 463 | 0.3% |
| Icelander | 14 | 0.0% |
| Indian (Asian) | 342 | 0.2% |
| Iranian | 167 | 0.1% |
| Irish | 14,877 | 8.8% |
| Iroquois | 26 | 0.0% |
| Israeli | 46 | 0.0% |
| Italian | 5,397 | 3.2% |
| Jamaican | 464 | 0.3% |
| Kenyan | 229 | 0.1% |
| Korean | 546 | 0.3% |
| Latvian | 8 | 0.0% |
| Lithuanian | 156 | 0.1% |
| Lumbee | 10 | 0.0% |
| Mexican | 4,403 | 2.6% |
| Mexican American Indian | 1 | 0.0% |
| Mongolian | 19 | 0.0% |
| Moroccan | 118 | 0.1% |
| Native Hawaiian | 4 | 0.0% |
| Navajo | 45 | 0.0% |
| Nigerian | 49 | 0.0% |
| Northern European | 72 | 0.0% |
| Norwegian | 1,085 | 0.6% |
| Pakistani | 22 | 0.0% |
| Panamanian | 18 | 0.0% |
| Pennsylvania German | 18 | 0.0% |
| Peruvian | 16 | 0.0% |
| Polish | 2,085 | 1.2% |
| Portuguese | 408 | 0.2% |
| Puerto Rican | 1,802 | 1.1% |
| Romanian | 56 | 0.0% |
| Russian | 401 | 0.2% |
| Salvadoran | 409 | 0.2% |
| Samoan | 12 | 0.0% |
| Scandinavian | 192 | 0.1% |
| Scotch-Irish | 2,940 | 1.7% |
| Scottish | 3,858 | 2.3% |
| Seminole | 10 | 0.0% |
| Serbian | 31 | 0.0% |
| Sierra Leonean | 35 | 0.0% |
| Sioux | 10 | 0.0% |
| Slavic | 70 | 0.0% |
| Slovak | 110 | 0.1% |
| Slovene | 49 | 0.0% |
| South American | 423 | 0.3% |
| Spaniard | 708 | 0.4% |
| Spanish | 196 | 0.1% |
| Sri Lankan | 482 | 0.3% |
| Subsaharan African | 2,588 | 1.5% |
| Swedish | 835 | 0.5% |
| Swiss | 278 | 0.2% |
| Syrian | 63 | 0.0% |
| Thai | 397 | 0.2% |
| Turkish | 10 | 0.0% |
| Ukrainian | 124 | 0.1% |
| Venezuelan | 11 | 0.0% |
| Welsh | 967 | 0.6% |
| West Indian | 53 | 0.0% |
| Yugoslavian | 48 | 0.0% | View All 113 Rows |
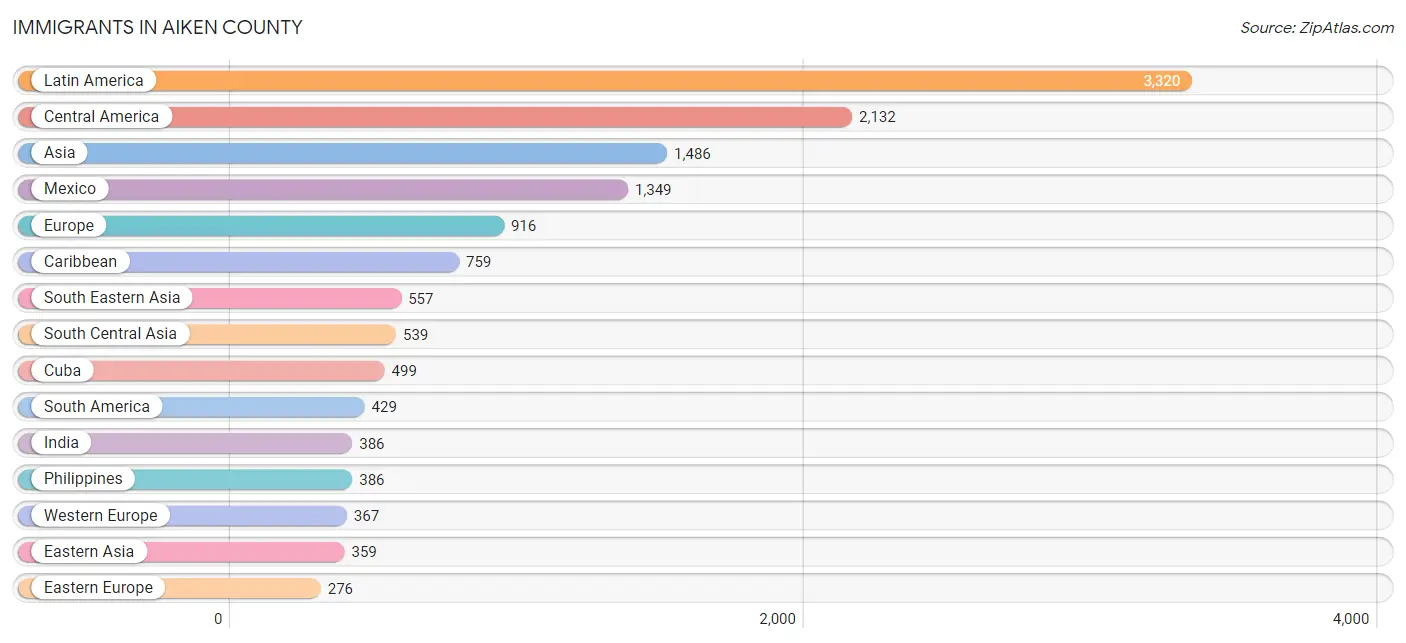
Immigrants in Aiken County
The most numerous immigrant groups reported in Aiken County came from Latin America (3,320 | 1.9%), Central America (2,132 | 1.3%), Asia (1,486 | 0.9%), Mexico (1,349 | 0.8%), and Europe (916 | 0.5%), together accounting for 5.4% of all Aiken County residents.
| Immigration Origin | # Population | % Population |
| Africa | 113 | 0.1% |
| Asia | 1,486 | 0.9% |
| Australia | 15 | 0.0% |
| Belgium | 3 | 0.0% |
| Brazil | 63 | 0.0% |
| Cameroon | 113 | 0.1% |
| Canada | 161 | 0.1% |
| Caribbean | 759 | 0.4% |
| Central America | 2,132 | 1.3% |
| Chile | 43 | 0.0% |
| China | 148 | 0.1% |
| Colombia | 268 | 0.2% |
| Costa Rica | 163 | 0.1% |
| Cuba | 499 | 0.3% |
| Denmark | 2 | 0.0% |
| Dominican Republic | 60 | 0.0% |
| Eastern Asia | 359 | 0.2% |
| Eastern Europe | 276 | 0.2% |
| Ecuador | 16 | 0.0% |
| El Salvador | 216 | 0.1% |
| England | 27 | 0.0% |
| Europe | 916 | 0.5% |
| France | 90 | 0.1% |
| Germany | 224 | 0.1% |
| Greece | 68 | 0.0% |
| Guatemala | 240 | 0.1% |
| Guyana | 29 | 0.0% |
| Honduras | 146 | 0.1% |
| Hungary | 22 | 0.0% |
| India | 386 | 0.2% |
| Iran | 143 | 0.1% |
| Italy | 7 | 0.0% |
| Jamaica | 199 | 0.1% |
| Japan | 175 | 0.1% |
| Kazakhstan | 10 | 0.0% |
| Korea | 36 | 0.0% |
| Latin America | 3,320 | 1.9% |
| Malaysia | 32 | 0.0% |
| Mexico | 1,349 | 0.8% |
| Middle Africa | 113 | 0.1% |
| Netherlands | 50 | 0.0% |
| Northern Europe | 99 | 0.1% |
| Oceania | 15 | 0.0% |
| Panama | 18 | 0.0% |
| Philippines | 386 | 0.2% |
| Poland | 123 | 0.1% |
| Portugal | 59 | 0.0% |
| Romania | 15 | 0.0% |
| Russia | 106 | 0.1% |
| Scotland | 7 | 0.0% |
| Serbia | 10 | 0.0% |
| South America | 429 | 0.3% |
| South Central Asia | 539 | 0.3% |
| South Eastern Asia | 557 | 0.3% |
| Southern Europe | 174 | 0.1% |
| Spain | 40 | 0.0% |
| Trinidad and Tobago | 1 | 0.0% |
| Turkey | 31 | 0.0% |
| Vietnam | 139 | 0.1% |
| Western Asia | 31 | 0.0% |
| Western Europe | 367 | 0.2% | View All 61 Rows |
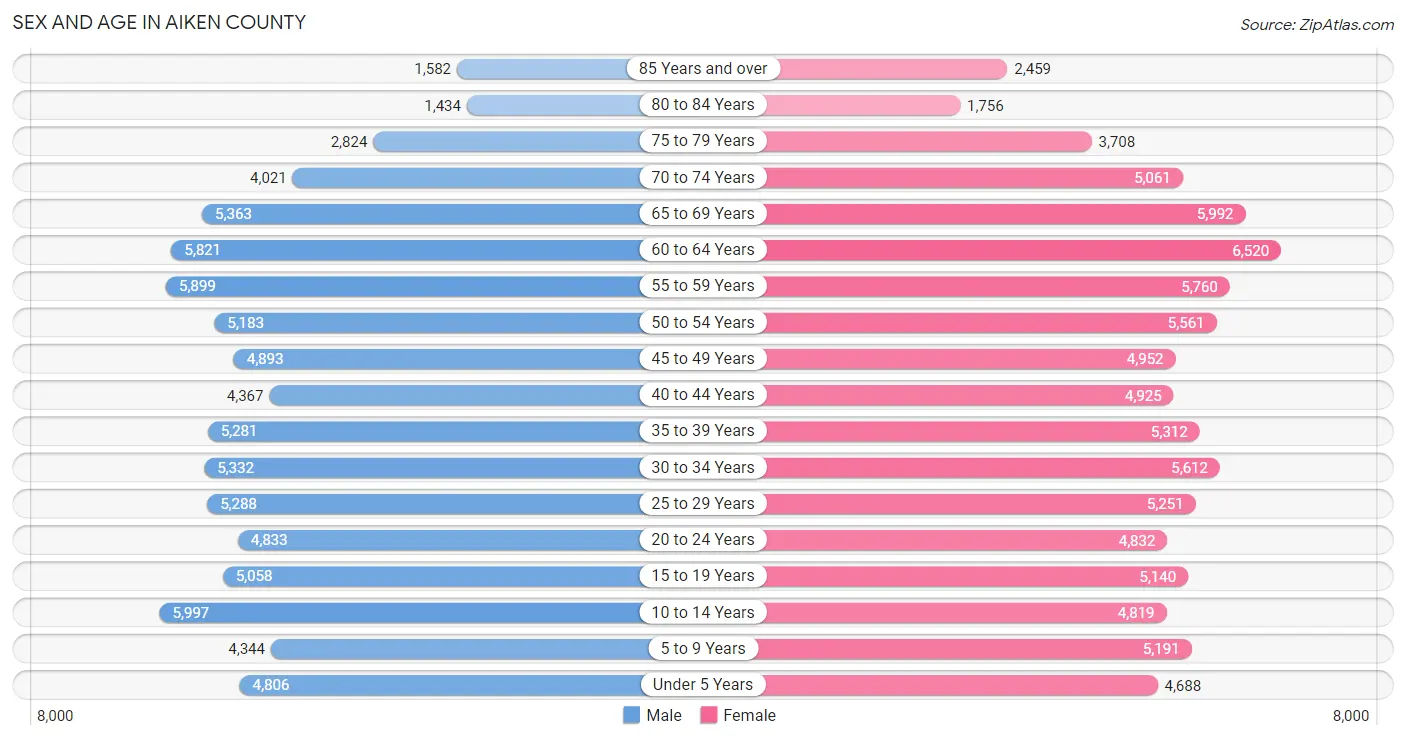
Sex and Age in Aiken County
Sex and Age in Aiken County
The most populous age groups in Aiken County are 10 to 14 Years (5,997 | 7.3%) for men and 60 to 64 Years (6,520 | 7.4%) for women.
| Age Bracket | Male | Female |
| Under 5 Years | 4,806 (5.8%) | 4,688 (5.4%) |
| 5 to 9 Years | 4,344 (5.3%) | 5,191 (5.9%) |
| 10 to 14 Years | 5,997 (7.3%) | 4,819 (5.5%) |
| 15 to 19 Years | 5,058 (6.1%) | 5,140 (5.9%) |
| 20 to 24 Years | 4,833 (5.9%) | 4,832 (5.5%) |
| 25 to 29 Years | 5,288 (6.4%) | 5,251 (6.0%) |
| 30 to 34 Years | 5,332 (6.5%) | 5,612 (6.4%) |
| 35 to 39 Years | 5,281 (6.4%) | 5,312 (6.1%) |
| 40 to 44 Years | 4,367 (5.3%) | 4,925 (5.6%) |
| 45 to 49 Years | 4,893 (5.9%) | 4,952 (5.7%) |
| 50 to 54 Years | 5,183 (6.3%) | 5,561 (6.4%) |
| 55 to 59 Years | 5,899 (7.2%) | 5,760 (6.6%) |
| 60 to 64 Years | 5,821 (7.1%) | 6,520 (7.4%) |
| 65 to 69 Years | 5,363 (6.5%) | 5,992 (6.8%) |
| 70 to 74 Years | 4,021 (4.9%) | 5,061 (5.8%) |
| 75 to 79 Years | 2,824 (3.4%) | 3,708 (4.2%) |
| 80 to 84 Years | 1,434 (1.7%) | 1,756 (2.0%) |
| 85 Years and over | 1,582 (1.9%) | 2,459 (2.8%) |
| Total | 82,326 (100.0%) | 87,539 (100.0%) |
Families and Households in Aiken County
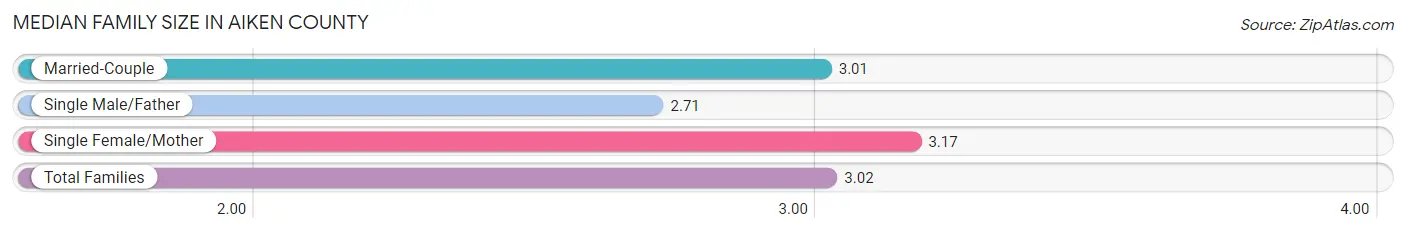
Median Family Size in Aiken County
The median family size in Aiken County is 3.02 persons per family, with single female/mother families (8,520 | 18.8%) accounting for the largest median family size of 3.17 persons per family. On the other hand, single male/father families (3,203 | 7.1%) represent the smallest median family size with 2.71 persons per family.
| Family Type | # Families | Family Size |
| Married-Couple | 33,560 (74.1%) | 3.01 |
| Single Male/Father | 3,203 (7.1%) | 2.71 |
| Single Female/Mother | 8,520 (18.8%) | 3.17 |
| Total Families | 45,283 (100.0%) | 3.02 |
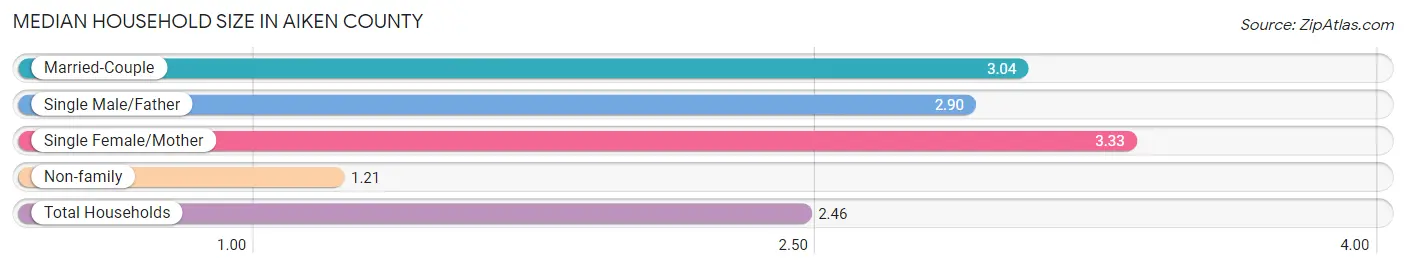
Median Household Size in Aiken County
The median household size in Aiken County is 2.46 persons per household, with single female/mother households (8,520 | 12.6%) accounting for the largest median household size of 3.33 persons per household. non-family households (22,621 | 33.3%) represent the smallest median household size with 1.21 persons per household.
| Household Type | # Households | Household Size |
| Married-Couple | 33,560 (49.4%) | 3.04 |
| Single Male/Father | 3,203 (4.7%) | 2.90 |
| Single Female/Mother | 8,520 (12.6%) | 3.33 |
| Non-family | 22,621 (33.3%) | 1.21 |
| Total Households | 67,904 (100.0%) | 2.46 |
Household Size by Marriage Status in Aiken County
Out of a total of 67,904 households in Aiken County, 45,283 (66.7%) are family households, while 22,621 (33.3%) are nonfamily households. The most numerous type of family households are 2-person households, comprising 23,292, and the most common type of nonfamily households are 1-person households, comprising 19,055.

| Household Size | Family Households | Nonfamily Households |
| 1-Person Households | - | 19,055 (28.1%) |
| 2-Person Households | 23,292 (34.3%) | 3,154 (4.6%) |
| 3-Person Households | 10,166 (15.0%) | 193 (0.3%) |
| 4-Person Households | 6,901 (10.2%) | 83 (0.1%) |
| 5-Person Households | 2,988 (4.4%) | 103 (0.2%) |
| 6-Person Households | 1,151 (1.7%) | 20 (0.0%) |
| 7+ Person Households | 785 (1.2%) | 13 (0.0%) |
| Total | 45,283 (66.7%) | 22,621 (33.3%) |
Female Fertility in Aiken County
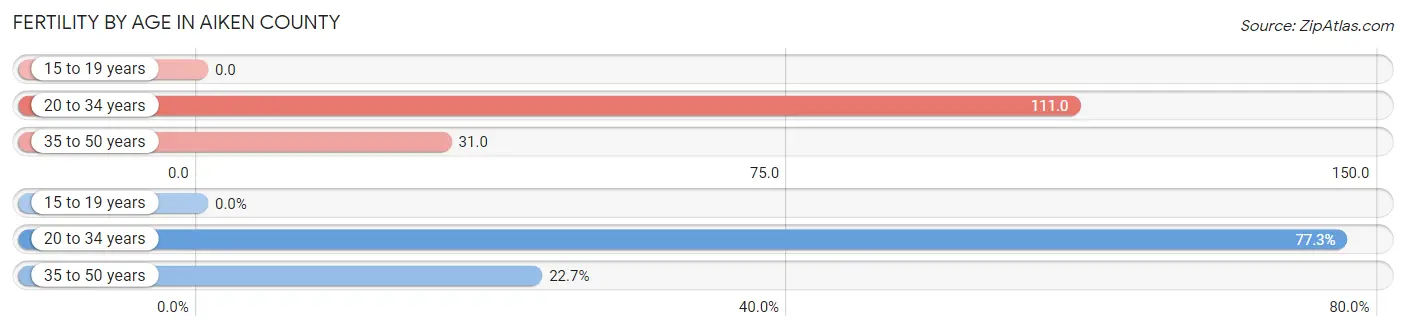
Fertility by Age in Aiken County
Average fertility rate in Aiken County is 61.0 births per 1,000 women. Women in the age bracket of 20 to 34 years have the highest fertility rate with 111.0 births per 1,000 women. Women in the age bracket of 20 to 34 years acount for 77.3% of all women with births.
| Age Bracket | Women with Births | Births / 1,000 Women |
| 15 to 19 years | 0 (0.0%) | 0.0 |
| 20 to 34 years | 1,735 (77.3%) | 111.0 |
| 35 to 50 years | 509 (22.7%) | 31.0 |
| Total | 2,244 (100.0%) | 61.0 |
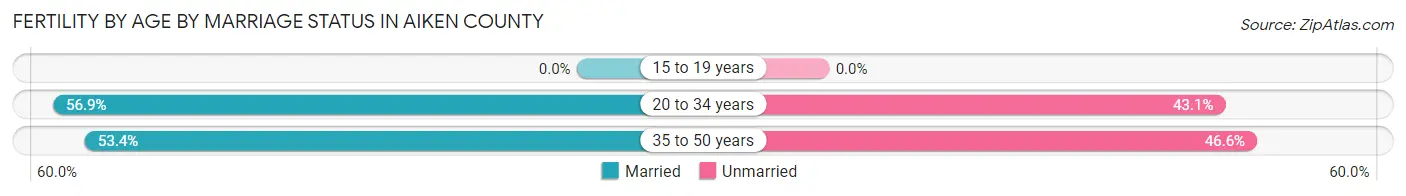
Fertility by Age by Marriage Status in Aiken County
56.1% of women with births (2,244) in Aiken County are married. The highest percentage of unmarried women with births falls into 35 to 50 years age bracket with 46.6% of them unmarried at the time of birth, while the lowest percentage of unmarried women with births belong to 20 to 34 years age bracket with 43.1% of them unmarried.
| Age Bracket | Married | Unmarried |
| 15 to 19 years | 0 (0.0%) | 0 (0.0%) |
| 20 to 34 years | 987 (56.9%) | 748 (43.1%) |
| 35 to 50 years | 272 (53.4%) | 237 (46.6%) |
| Total | 1,259 (56.1%) | 985 (43.9%) |
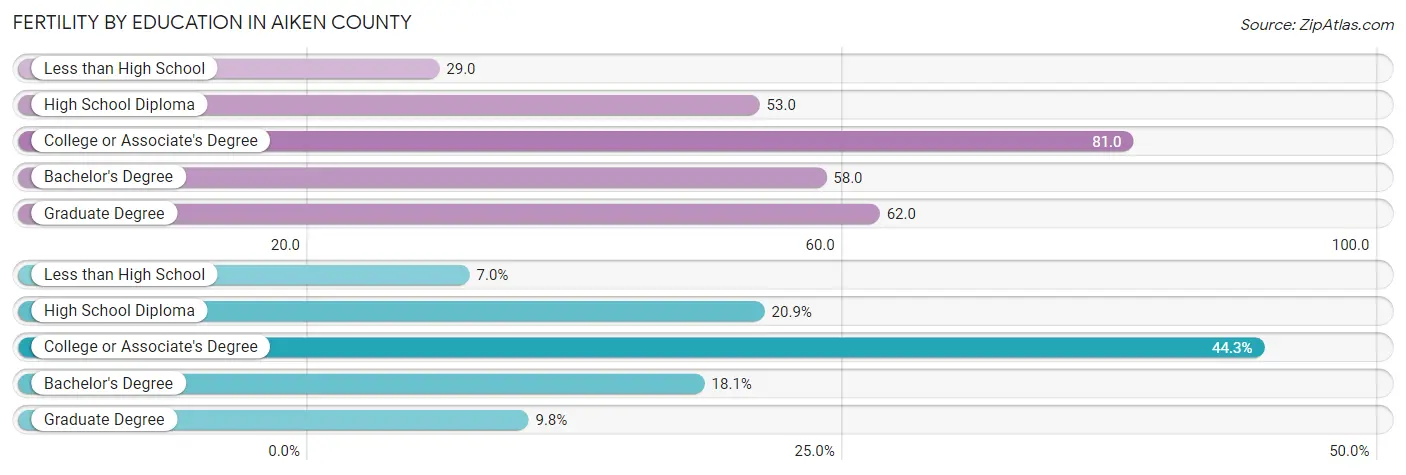
Fertility by Education in Aiken County
Average fertility rate in Aiken County is 61.0 births per 1,000 women. Women with the education attainment of college or associate's degree have the highest fertility rate of 81.0 births per 1,000 women, while women with the education attainment of less than high school have the lowest fertility at 29.0 births per 1,000 women. Women with the education attainment of college or associate's degree represent 44.3% of all women with births.
| Educational Attainment | Women with Births | Births / 1,000 Women |
| Less than High School | 158 (7.0%) | 29.0 |
| High School Diploma | 468 (20.9%) | 53.0 |
| College or Associate's Degree | 993 (44.3%) | 81.0 |
| Bachelor's Degree | 405 (18.0%) | 58.0 |
| Graduate Degree | 220 (9.8%) | 62.0 |
| Total | 2,244 (100.0%) | 61.0 |
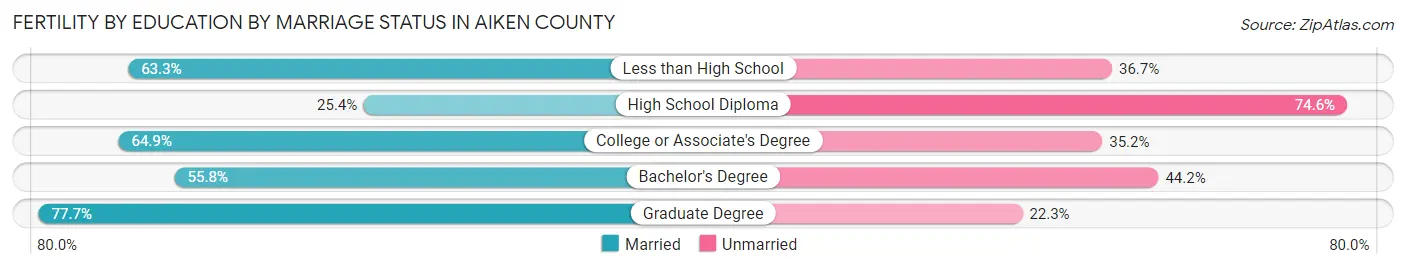
Fertility by Education by Marriage Status in Aiken County
43.9% of women with births in Aiken County are unmarried. Women with the educational attainment of graduate degree are most likely to be married with 77.7% of them married at childbirth, while women with the educational attainment of high school diploma are least likely to be married with 74.6% of them unmarried at childbirth.
| Educational Attainment | Married | Unmarried |
| Less than High School | 100 (63.3%) | 58 (36.7%) |
| High School Diploma | 119 (25.4%) | 349 (74.6%) |
| College or Associate's Degree | 644 (64.8%) | 349 (35.1%) |
| Bachelor's Degree | 226 (55.8%) | 179 (44.2%) |
| Graduate Degree | 171 (77.7%) | 49 (22.3%) |
| Total | 1,259 (56.1%) | 985 (43.9%) |
Employment Characteristics in Aiken County
Employment by Class of Employer in Aiken County
Among the 73,609 employed individuals in Aiken County, private company employees (49,303 | 67.0%), federal government employees (5,304 | 7.2%), and local government employees (4,780 | 6.5%) make up the most common classes of employment.
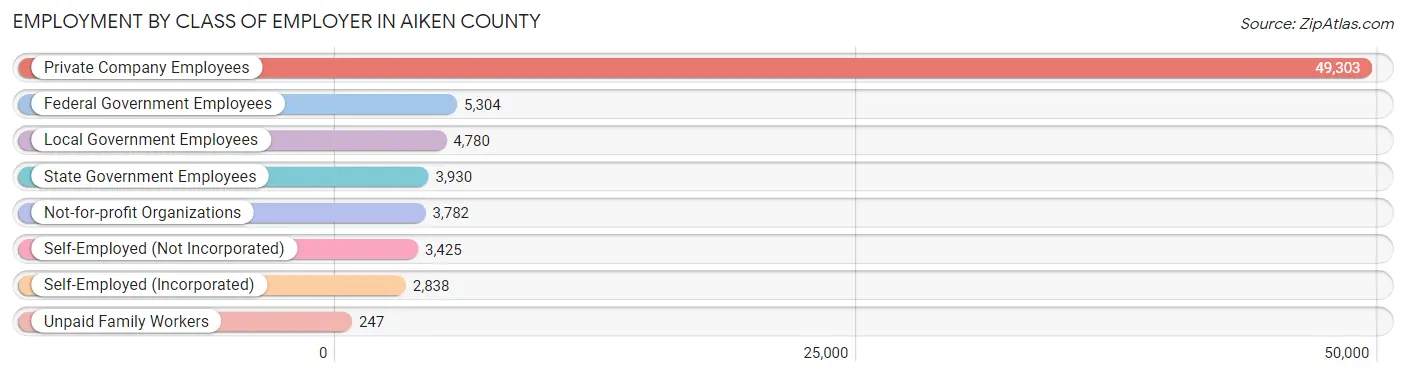
| Employer Class | # Employees | % Employees |
| Private Company Employees | 49,303 | 67.0% |
| Self-Employed (Incorporated) | 2,838 | 3.9% |
| Self-Employed (Not Incorporated) | 3,425 | 4.6% |
| Not-for-profit Organizations | 3,782 | 5.1% |
| Local Government Employees | 4,780 | 6.5% |
| State Government Employees | 3,930 | 5.3% |
| Federal Government Employees | 5,304 | 7.2% |
| Unpaid Family Workers | 247 | 0.3% |
| Total | 73,609 | 100.0% |
Employment Status by Age in Aiken County
According to the labor force statistics for Aiken County, out of the total population over 16 years of age (137,443), 58.0% or 79,717 individuals are in the labor force, with 6.2% or 4,942 of them unemployed. The age group with the highest labor force participation rate is 25 to 29 years, with 85.5% or 9,011 individuals in the labor force. Within the labor force, the 16 to 19 years age range has the highest percentage of unemployed individuals, with 16.7% or 456 of them being unemployed.
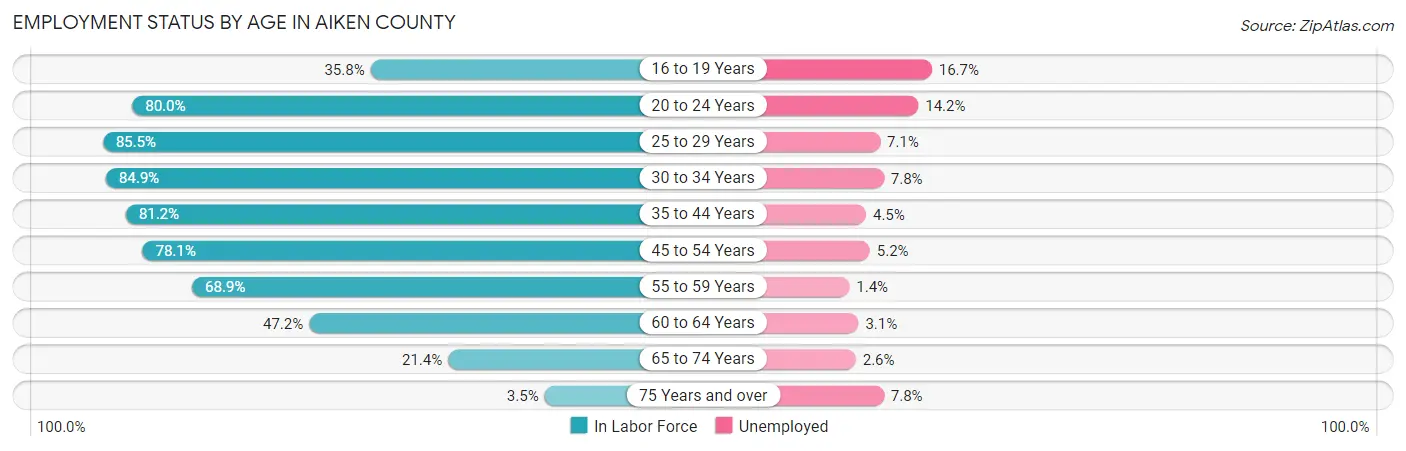
| Age Bracket | In Labor Force | Unemployed |
| 16 to 19 Years | 2,728 (35.8%) | 456 (16.7%) |
| 20 to 24 Years | 7,732 (80.0%) | 1,098 (14.2%) |
| 25 to 29 Years | 9,011 (85.5%) | 640 (7.1%) |
| 30 to 34 Years | 9,291 (84.9%) | 725 (7.8%) |
| 35 to 44 Years | 16,147 (81.2%) | 727 (4.5%) |
| 45 to 54 Years | 16,080 (78.1%) | 836 (5.2%) |
| 55 to 59 Years | 8,033 (68.9%) | 112 (1.4%) |
| 60 to 64 Years | 5,825 (47.2%) | 181 (3.1%) |
| 65 to 74 Years | 4,374 (21.4%) | 114 (2.6%) |
| 75 Years and over | 482 (3.5%) | 38 (7.8%) |
| Total | 79,717 (58.0%) | 4,942 (6.2%) |
Employment Status by Educational Attainment in Aiken County
According to labor force statistics for Aiken County, 74.9% of individuals (64,382) out of the total population between 25 and 64 years of age (85,957) are in the labor force, with 5.0% or 3,219 of them being unemployed. The group with the highest labor force participation rate are those with the educational attainment of bachelor's degree or higher, with 85.3% or 21,341 individuals in the labor force. Within the labor force, individuals with less than high school education have the highest percentage of unemployment, with 9.3% or 454 of them being unemployed.
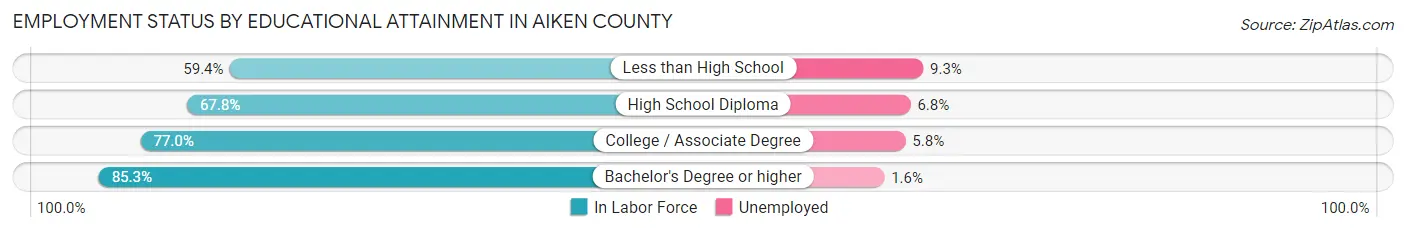
| Educational Attainment | In Labor Force | Unemployed |
| Less than High School | 4,887 (59.4%) | 765 (9.3%) |
| High School Diploma | 18,013 (67.8%) | 1,807 (6.8%) |
| College / Associate Degree | 20,130 (77.0%) | 1,516 (5.8%) |
| Bachelor's Degree or higher | 21,341 (85.3%) | 400 (1.6%) |
| Total | 64,382 (74.9%) | 4,298 (5.0%) |
Employment Occupations by Sex in Aiken County
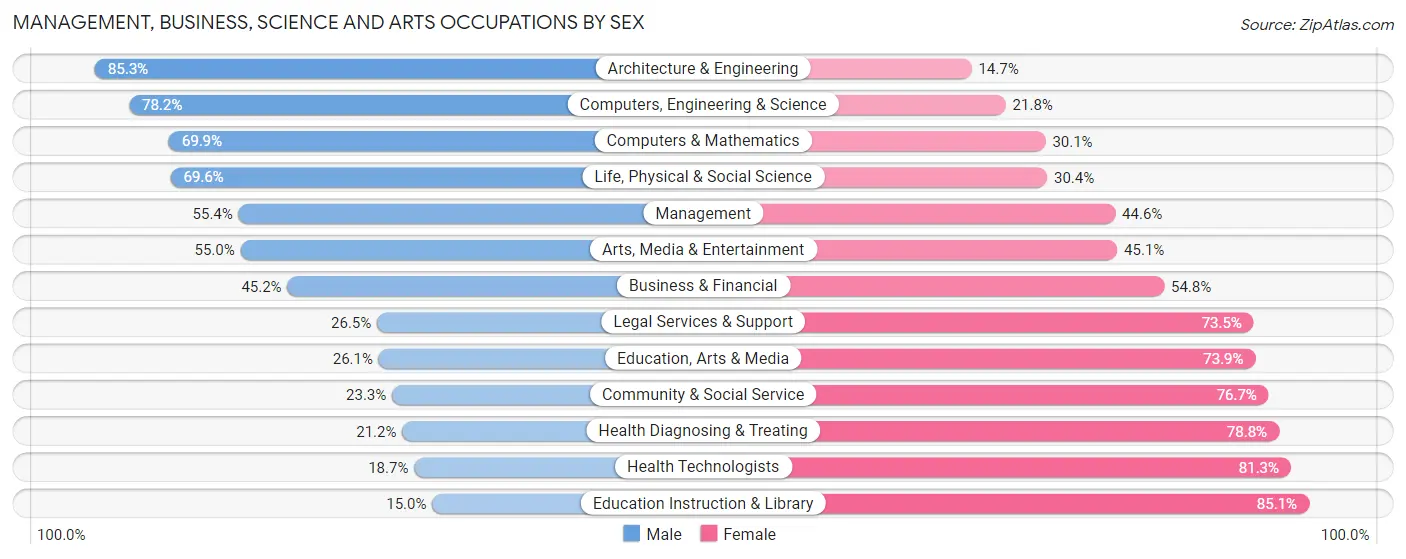
Management, Business, Science and Arts Occupations
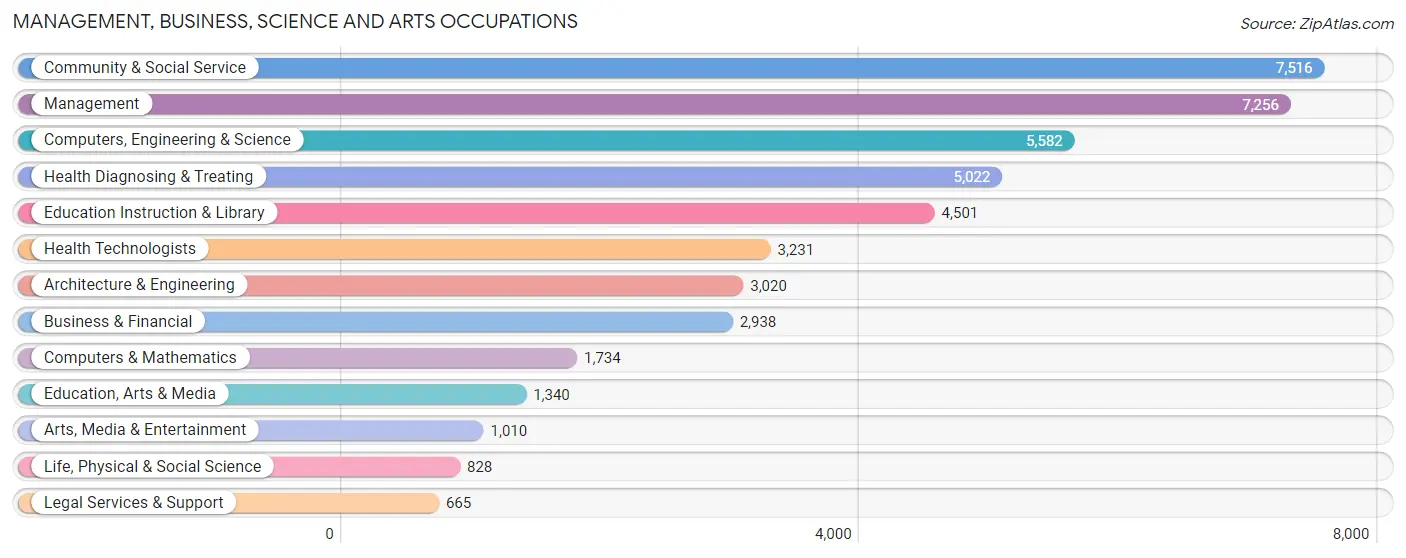
The most common Management, Business, Science and Arts occupations in Aiken County are Community & Social Service (7,516 | 10.1%), Management (7,256 | 9.8%), Computers, Engineering & Science (5,582 | 7.5%), Health Diagnosing & Treating (5,022 | 6.8%), and Education Instruction & Library (4,501 | 6.1%).
Management, Business, Science and Arts Occupations by Sex
Within the Management, Business, Science and Arts occupations in Aiken County, the most male-oriented occupations are Architecture & Engineering (85.3%), Computers, Engineering & Science (78.2%), and Computers & Mathematics (69.9%), while the most female-oriented occupations are Education Instruction & Library (85.1%), Health Technologists (81.3%), and Health Diagnosing & Treating (78.8%).
| Occupation | Male | Female |
| Management | 4,017 (55.4%) | 3,239 (44.6%) |
| Business & Financial | 1,327 (45.2%) | 1,611 (54.8%) |
| Computers, Engineering & Science | 4,365 (78.2%) | 1,217 (21.8%) |
| Computers & Mathematics | 1,212 (69.9%) | 522 (30.1%) |
| Architecture & Engineering | 2,577 (85.3%) | 443 (14.7%) |
| Life, Physical & Social Science | 576 (69.6%) | 252 (30.4%) |
| Community & Social Service | 1,754 (23.3%) | 5,762 (76.7%) |
| Education, Arts & Media | 350 (26.1%) | 990 (73.9%) |
| Legal Services & Support | 176 (26.5%) | 489 (73.5%) |
| Education Instruction & Library | 673 (14.9%) | 3,828 (85.1%) |
| Arts, Media & Entertainment | 555 (54.9%) | 455 (45.1%) |
| Health Diagnosing & Treating | 1,065 (21.2%) | 3,957 (78.8%) |
| Health Technologists | 605 (18.7%) | 2,626 (81.3%) |
| Total (Category) | 12,528 (44.3%) | 15,786 (55.7%) |
| Total (Overall) | 38,292 (51.7%) | 35,832 (48.3%) |
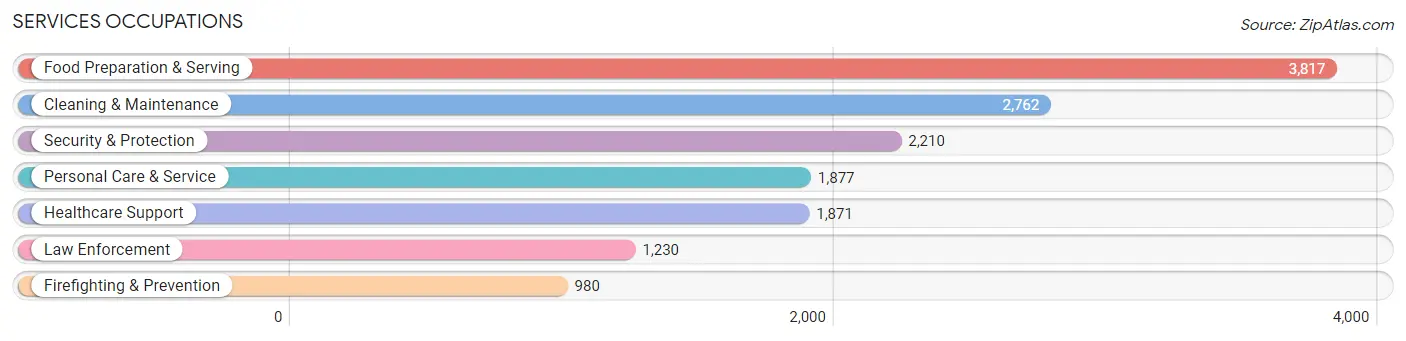
Services Occupations
The most common Services occupations in Aiken County are Food Preparation & Serving (3,817 | 5.1%), Cleaning & Maintenance (2,762 | 3.7%), Security & Protection (2,210 | 3.0%), Personal Care & Service (1,877 | 2.5%), and Healthcare Support (1,871 | 2.5%).
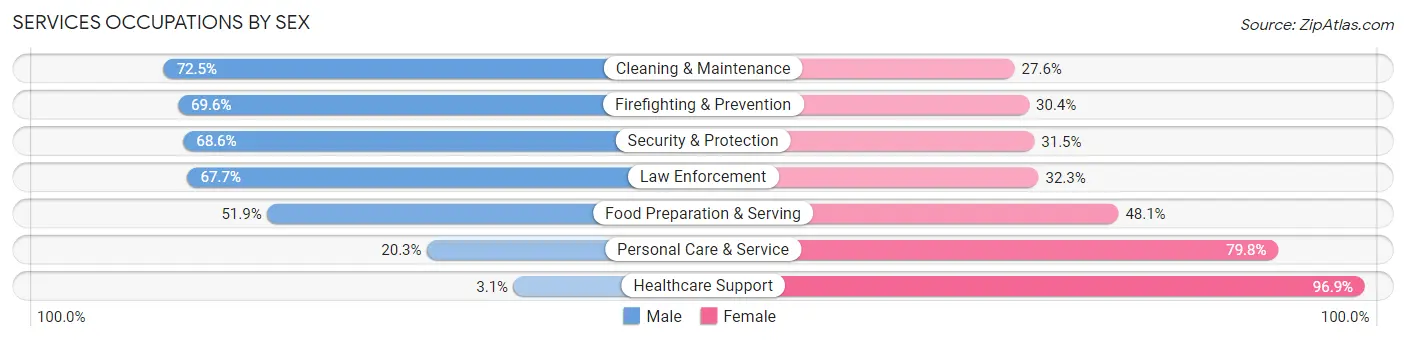
Services Occupations by Sex
Within the Services occupations in Aiken County, the most male-oriented occupations are Cleaning & Maintenance (72.5%), Firefighting & Prevention (69.6%), and Security & Protection (68.5%), while the most female-oriented occupations are Healthcare Support (96.9%), Personal Care & Service (79.7%), and Food Preparation & Serving (48.1%).
| Occupation | Male | Female |
| Healthcare Support | 58 (3.1%) | 1,813 (96.9%) |
| Security & Protection | 1,515 (68.5%) | 695 (31.5%) |
| Firefighting & Prevention | 682 (69.6%) | 298 (30.4%) |
| Law Enforcement | 833 (67.7%) | 397 (32.3%) |
| Food Preparation & Serving | 1,981 (51.9%) | 1,836 (48.1%) |
| Cleaning & Maintenance | 2,001 (72.5%) | 761 (27.6%) |
| Personal Care & Service | 380 (20.3%) | 1,497 (79.7%) |
| Total (Category) | 5,935 (47.3%) | 6,602 (52.7%) |
| Total (Overall) | 38,292 (51.7%) | 35,832 (48.3%) |
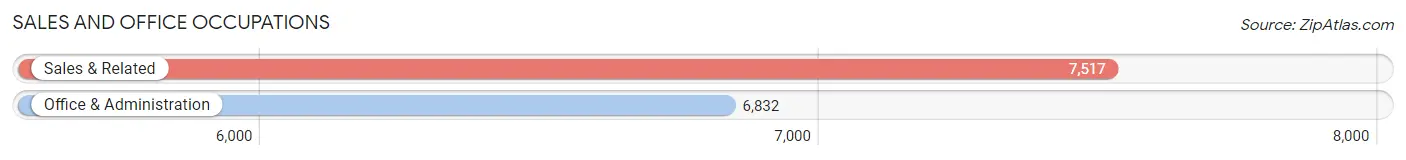
Sales and Office Occupations
The most common Sales and Office occupations in Aiken County are Sales & Related (7,517 | 10.1%), and Office & Administration (6,832 | 9.2%).
Sales and Office Occupations by Sex
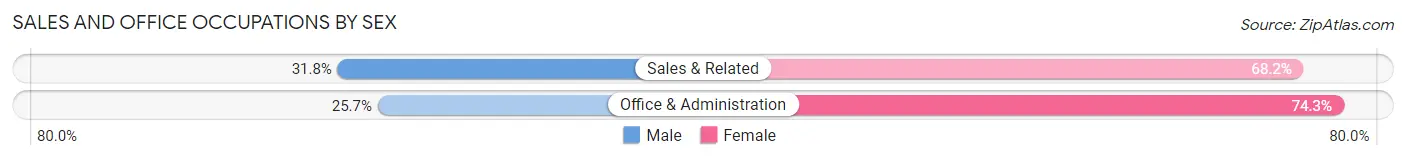
| Occupation | Male | Female |
| Sales & Related | 2,393 (31.8%) | 5,124 (68.2%) |
| Office & Administration | 1,753 (25.7%) | 5,079 (74.3%) |
| Total (Category) | 4,146 (28.9%) | 10,203 (71.1%) |
| Total (Overall) | 38,292 (51.7%) | 35,832 (48.3%) |
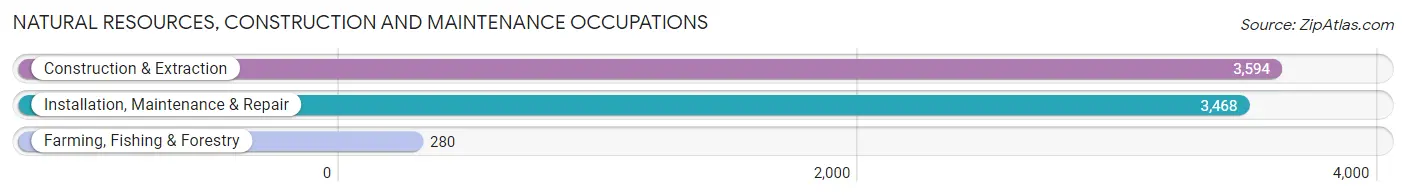
Natural Resources, Construction and Maintenance Occupations
The most common Natural Resources, Construction and Maintenance occupations in Aiken County are Construction & Extraction (3,594 | 4.9%), Installation, Maintenance & Repair (3,468 | 4.7%), and Farming, Fishing & Forestry (280 | 0.4%).
Natural Resources, Construction and Maintenance Occupations by Sex
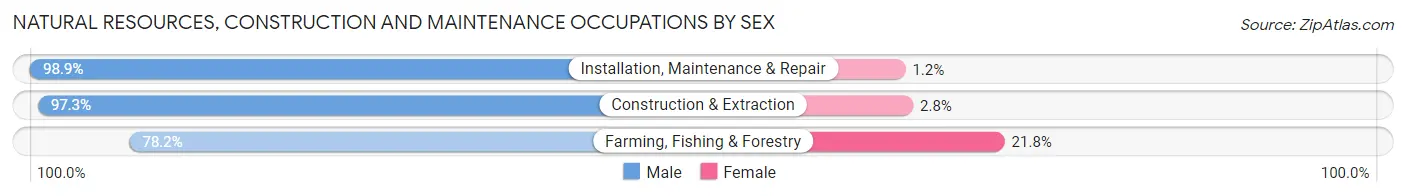
| Occupation | Male | Female |
| Farming, Fishing & Forestry | 219 (78.2%) | 61 (21.8%) |
| Construction & Extraction | 3,495 (97.3%) | 99 (2.8%) |
| Installation, Maintenance & Repair | 3,428 (98.9%) | 40 (1.1%) |
| Total (Category) | 7,142 (97.3%) | 200 (2.7%) |
| Total (Overall) | 38,292 (51.7%) | 35,832 (48.3%) |
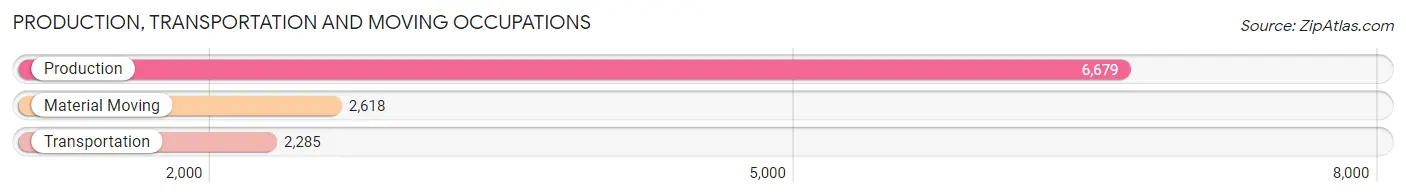
Production, Transportation and Moving Occupations
The most common Production, Transportation and Moving occupations in Aiken County are Production (6,679 | 9.0%), Material Moving (2,618 | 3.5%), and Transportation (2,285 | 3.1%).
Production, Transportation and Moving Occupations by Sex
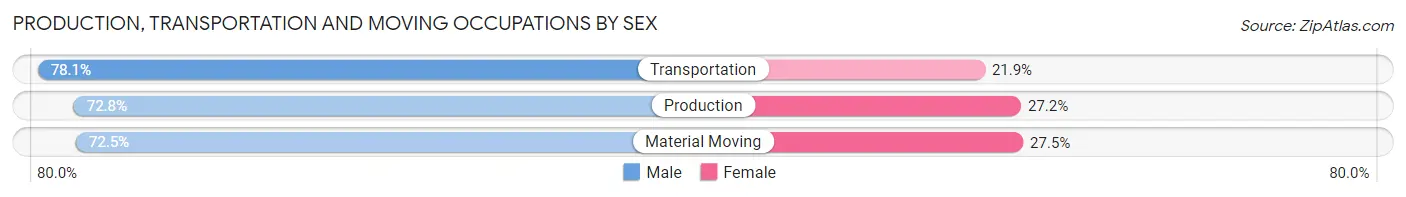
| Occupation | Male | Female |
| Production | 4,860 (72.8%) | 1,819 (27.2%) |
| Transportation | 1,784 (78.1%) | 501 (21.9%) |
| Material Moving | 1,897 (72.5%) | 721 (27.5%) |
| Total (Category) | 8,541 (73.7%) | 3,041 (26.3%) |
| Total (Overall) | 38,292 (51.7%) | 35,832 (48.3%) |
Employment Industries by Sex in Aiken County
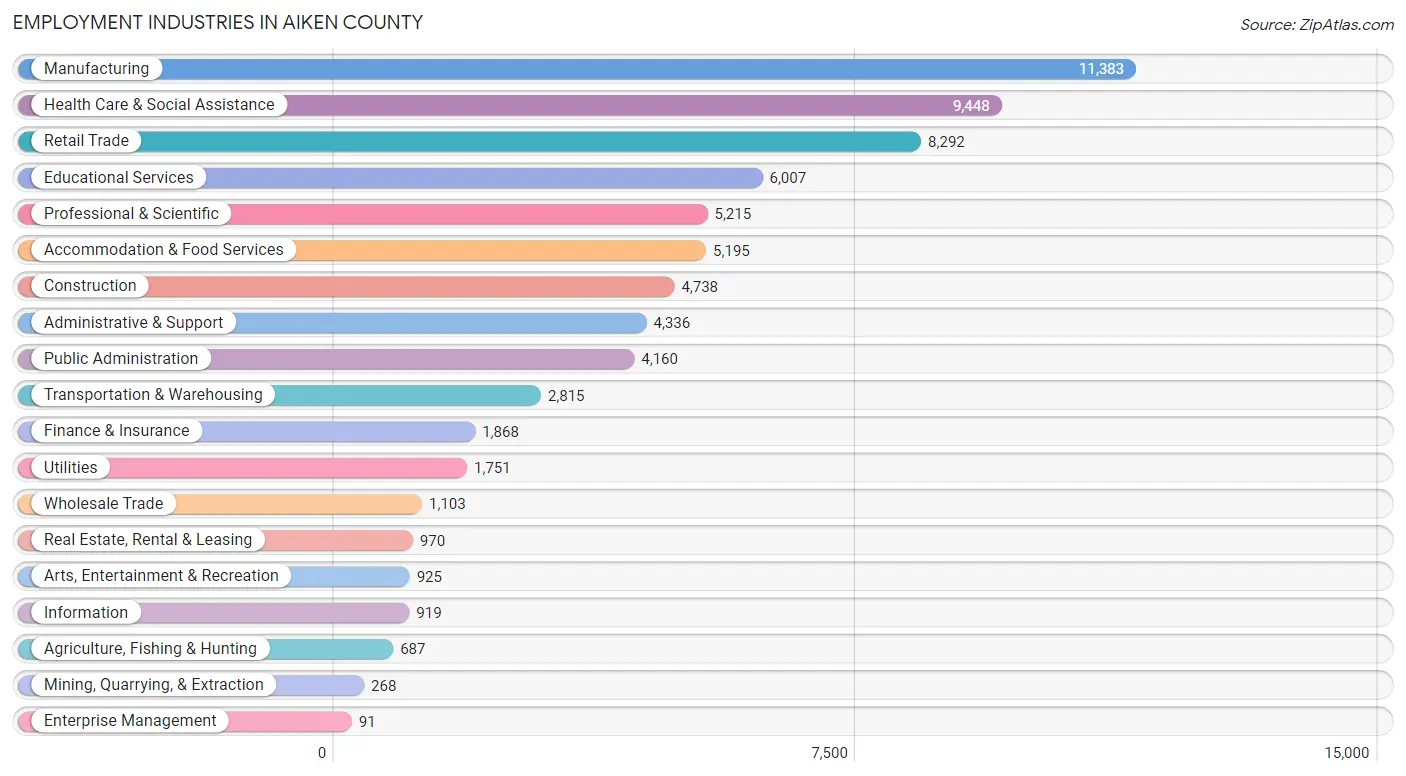
Employment Industries in Aiken County
The major employment industries in Aiken County include Manufacturing (11,383 | 15.4%), Health Care & Social Assistance (9,448 | 12.8%), Retail Trade (8,292 | 11.2%), Educational Services (6,007 | 8.1%), and Professional & Scientific (5,215 | 7.0%).
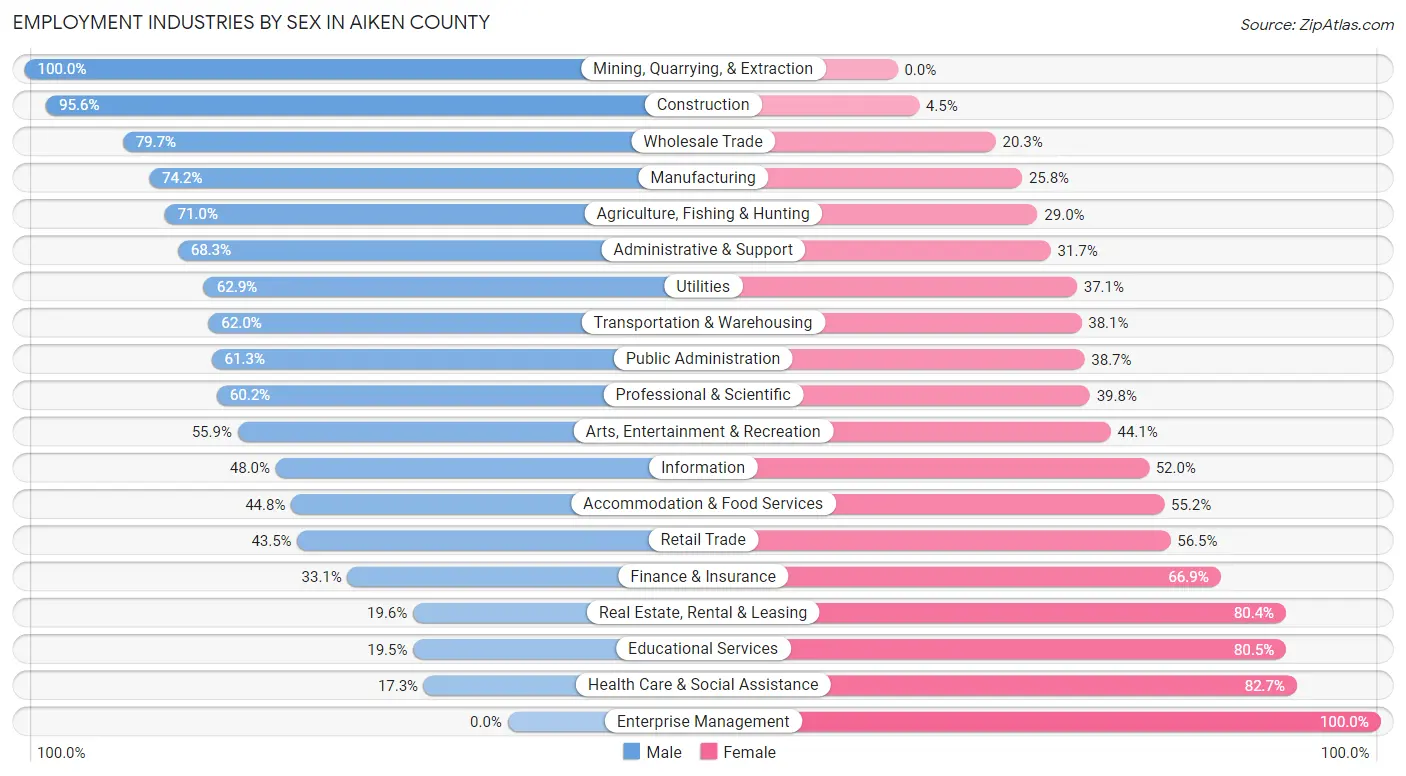
Employment Industries by Sex in Aiken County
The Aiken County industries that see more men than women are Mining, Quarrying, & Extraction (100.0%), Construction (95.6%), and Wholesale Trade (79.7%), whereas the industries that tend to have a higher number of women are Enterprise Management (100.0%), Health Care & Social Assistance (82.7%), and Educational Services (80.5%).
| Industry | Male | Female |
| Agriculture, Fishing & Hunting | 488 (71.0%) | 199 (29.0%) |
| Mining, Quarrying, & Extraction | 268 (100.0%) | 0 (0.0%) |
| Construction | 4,527 (95.6%) | 211 (4.4%) |
| Manufacturing | 8,448 (74.2%) | 2,935 (25.8%) |
| Wholesale Trade | 879 (79.7%) | 224 (20.3%) |
| Retail Trade | 3,609 (43.5%) | 4,683 (56.5%) |
| Transportation & Warehousing | 1,744 (62.0%) | 1,071 (38.1%) |
| Utilities | 1,101 (62.9%) | 650 (37.1%) |
| Information | 441 (48.0%) | 478 (52.0%) |
| Finance & Insurance | 619 (33.1%) | 1,249 (66.9%) |
| Real Estate, Rental & Leasing | 190 (19.6%) | 780 (80.4%) |
| Professional & Scientific | 3,139 (60.2%) | 2,076 (39.8%) |
| Enterprise Management | 0 (0.0%) | 91 (100.0%) |
| Administrative & Support | 2,961 (68.3%) | 1,375 (31.7%) |
| Educational Services | 1,174 (19.5%) | 4,833 (80.5%) |
| Health Care & Social Assistance | 1,638 (17.3%) | 7,810 (82.7%) |
| Arts, Entertainment & Recreation | 517 (55.9%) | 408 (44.1%) |
| Accommodation & Food Services | 2,328 (44.8%) | 2,867 (55.2%) |
| Public Administration | 2,550 (61.3%) | 1,610 (38.7%) |
| Total | 38,292 (51.7%) | 35,832 (48.3%) |
Education in Aiken County
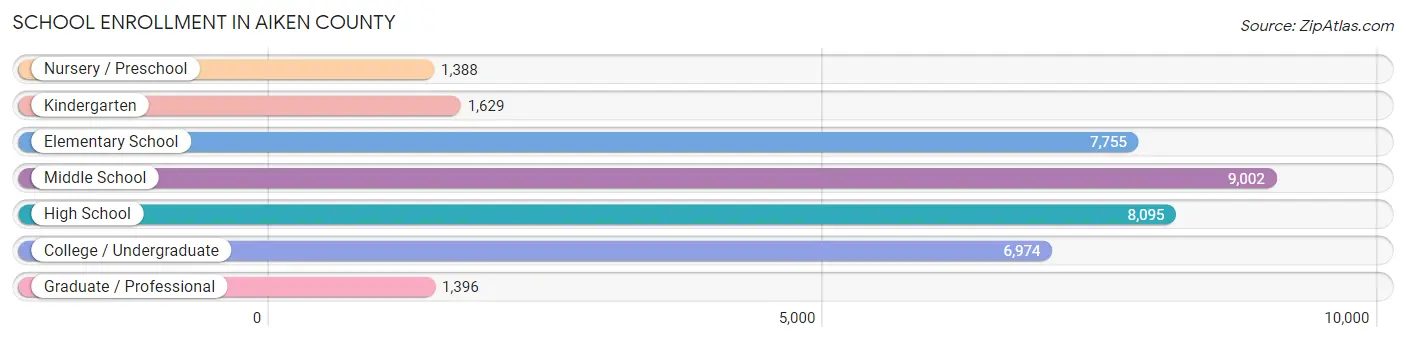
School Enrollment in Aiken County
The most common levels of schooling among the 36,239 students in Aiken County are middle school (9,002 | 24.8%), high school (8,095 | 22.3%), and elementary school (7,755 | 21.4%).
| School Level | # Students | % Students |
| Nursery / Preschool | 1,388 | 3.8% |
| Kindergarten | 1,629 | 4.5% |
| Elementary School | 7,755 | 21.4% |
| Middle School | 9,002 | 24.8% |
| High School | 8,095 | 22.3% |
| College / Undergraduate | 6,974 | 19.2% |
| Graduate / Professional | 1,396 | 3.8% |
| Total | 36,239 | 100.0% |
School Enrollment by Age by Funding Source in Aiken County
Out of a total of 36,239 students who are enrolled in schools in Aiken County, 6,451 (17.8%) attend a private institution, while the remaining 29,788 (82.2%) are enrolled in public schools. The age group of 3 to 4 year olds has the highest likelihood of being enrolled in private schools, with 606 (45.7% in the age bracket) enrolled. Conversely, the age group of 5 to 9 year old has the lowest likelihood of being enrolled in a private school, with 7,704 (87.0% in the age bracket) attending a public institution.
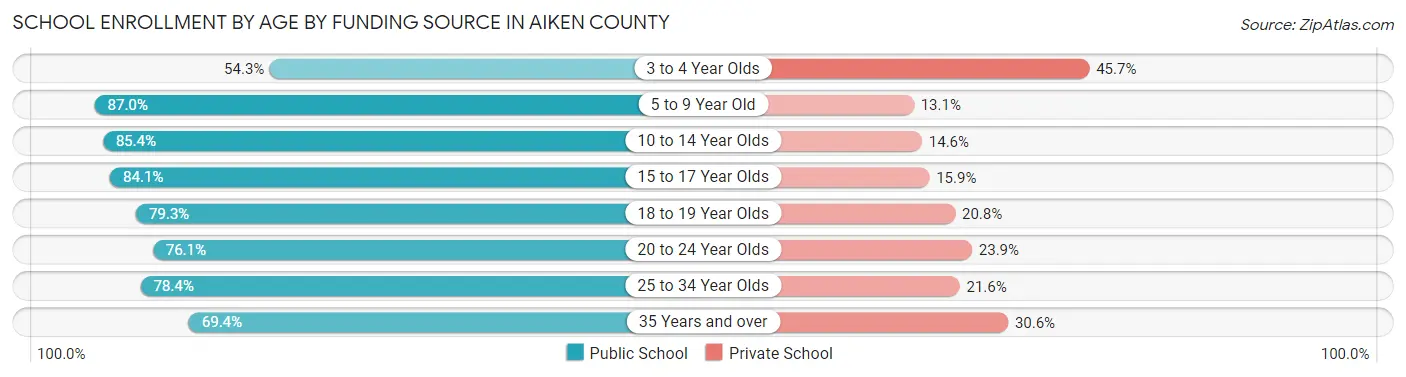
| Age Bracket | Public School | Private School |
| 3 to 4 Year Olds | 719 (54.3%) | 606 (45.7%) |
| 5 to 9 Year Old | 7,704 (87.0%) | 1,156 (13.1%) |
| 10 to 14 Year Olds | 9,048 (85.4%) | 1,542 (14.6%) |
| 15 to 17 Year Olds | 5,228 (84.1%) | 991 (15.9%) |
| 18 to 19 Year Olds | 2,376 (79.2%) | 622 (20.7%) |
| 20 to 24 Year Olds | 2,355 (76.1%) | 739 (23.9%) |
| 25 to 34 Year Olds | 1,409 (78.4%) | 388 (21.6%) |
| 35 Years and over | 941 (69.4%) | 415 (30.6%) |
| Total | 29,788 (82.2%) | 6,451 (17.8%) |
Educational Attainment by Field of Study in Aiken County
Business (7,091 | 18.9%), education (5,108 | 13.6%), engineering (4,422 | 11.7%), science & technology (4,058 | 10.8%), and bio, nature & agricultural (2,902 | 7.7%) are the most common fields of study among 37,620 individuals in Aiken County who have obtained a bachelor's degree or higher.
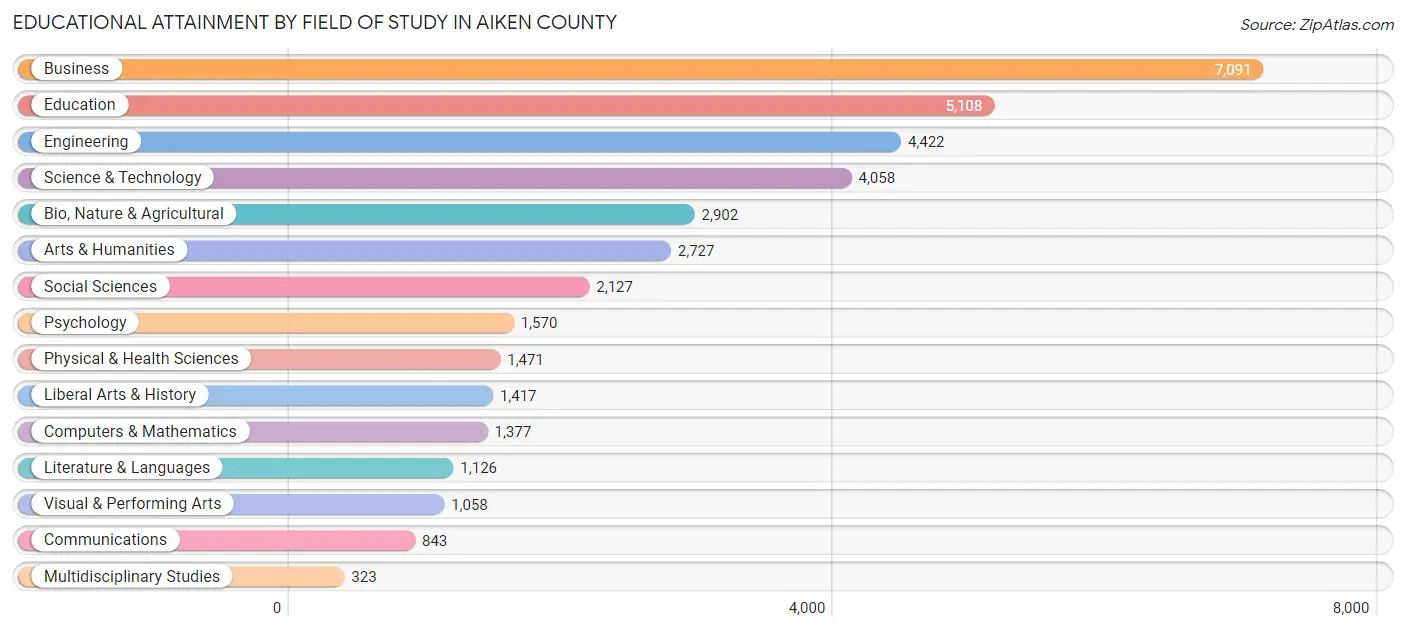
| Field of Study | # Graduates | % Graduates |
| Computers & Mathematics | 1,377 | 3.7% |
| Bio, Nature & Agricultural | 2,902 | 7.7% |
| Physical & Health Sciences | 1,471 | 3.9% |
| Psychology | 1,570 | 4.2% |
| Social Sciences | 2,127 | 5.7% |
| Engineering | 4,422 | 11.7% |
| Multidisciplinary Studies | 323 | 0.9% |
| Science & Technology | 4,058 | 10.8% |
| Business | 7,091 | 18.9% |
| Education | 5,108 | 13.6% |
| Literature & Languages | 1,126 | 3.0% |
| Liberal Arts & History | 1,417 | 3.8% |
| Visual & Performing Arts | 1,058 | 2.8% |
| Communications | 843 | 2.2% |
| Arts & Humanities | 2,727 | 7.2% |
| Total | 37,620 | 100.0% |
Transportation & Commute in Aiken County
Vehicle Availability by Sex in Aiken County
The most prevalent vehicle ownership categories in Aiken County are males with 2 vehicles (15,453, accounting for 40.5%) and females with 2 vehicles (13,363, making up 44.1%).
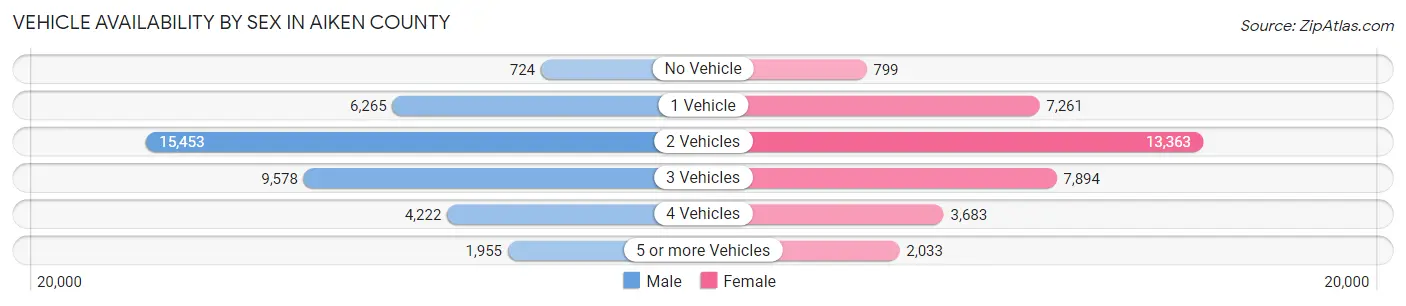
| Vehicles Available | Male | Female |
| No Vehicle | 724 (1.9%) | 799 (2.3%) |
| 1 Vehicle | 6,265 (16.4%) | 7,261 (20.7%) |
| 2 Vehicles | 15,453 (40.5%) | 13,363 (38.1%) |
| 3 Vehicles | 9,578 (25.1%) | 7,894 (22.5%) |
| 4 Vehicles | 4,222 (11.1%) | 3,683 (10.5%) |
| 5 or more Vehicles | 1,955 (5.1%) | 2,033 (5.8%) |
| Total | 38,197 (100.0%) | 35,033 (100.0%) |
Commute Time in Aiken County
The most frequently occuring commute durations in Aiken County are 15 to 19 minutes (11,895 commuters, 17.5%), 20 to 24 minutes (11,083 commuters, 16.3%), and 30 to 34 minutes (9,868 commuters, 14.5%).
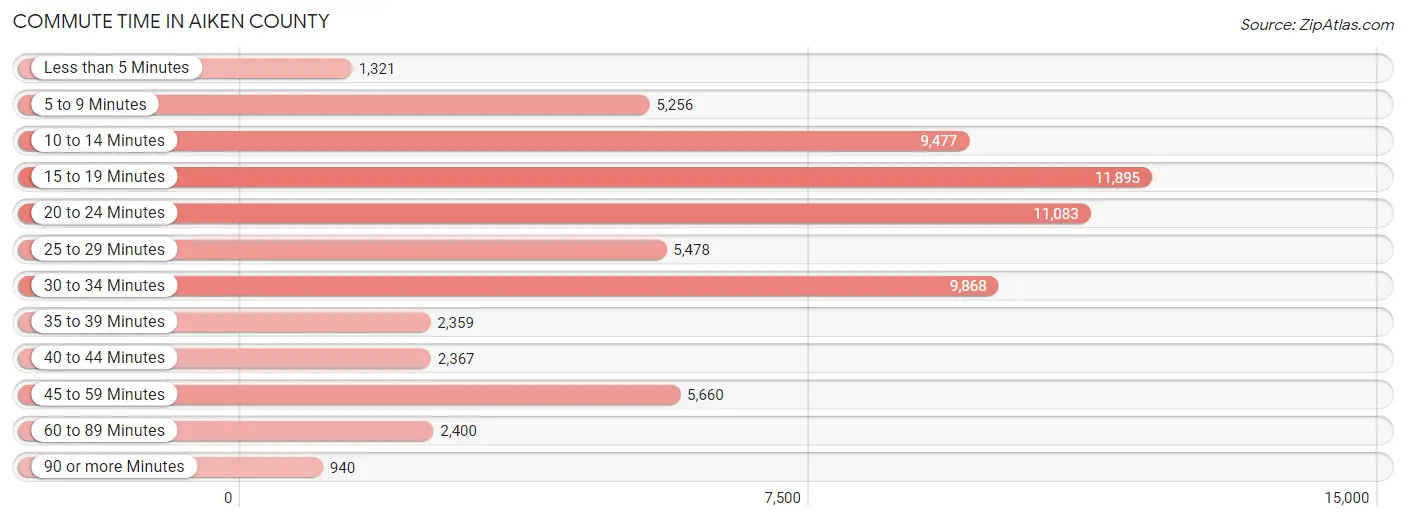
| Commute Time | # Commuters | % Commuters |
| Less than 5 Minutes | 1,321 | 1.9% |
| 5 to 9 Minutes | 5,256 | 7.7% |
| 10 to 14 Minutes | 9,477 | 13.9% |
| 15 to 19 Minutes | 11,895 | 17.5% |
| 20 to 24 Minutes | 11,083 | 16.3% |
| 25 to 29 Minutes | 5,478 | 8.0% |
| 30 to 34 Minutes | 9,868 | 14.5% |
| 35 to 39 Minutes | 2,359 | 3.5% |
| 40 to 44 Minutes | 2,367 | 3.5% |
| 45 to 59 Minutes | 5,660 | 8.3% |
| 60 to 89 Minutes | 2,400 | 3.5% |
| 90 or more Minutes | 940 | 1.4% |
Commute Time by Sex in Aiken County
The most common commute times in Aiken County are 20 to 24 minutes (6,222 commuters, 17.3%) for males and 15 to 19 minutes (6,510 commuters, 20.3%) for females.
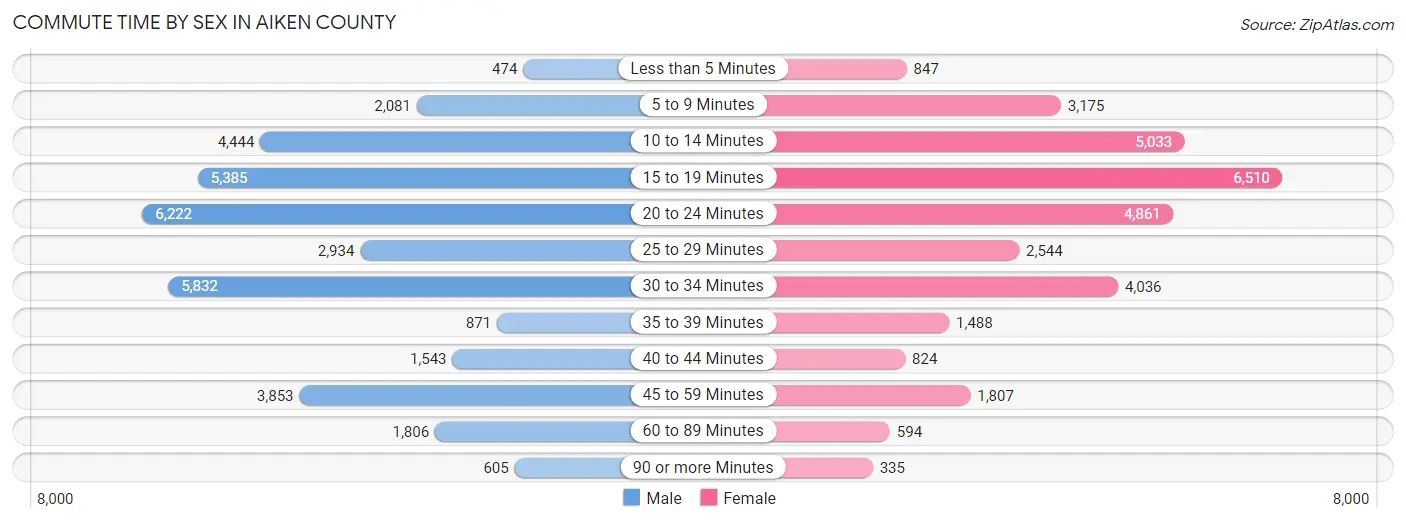
| Commute Time | Male | Female |
| Less than 5 Minutes | 474 (1.3%) | 847 (2.6%) |
| 5 to 9 Minutes | 2,081 (5.8%) | 3,175 (9.9%) |
| 10 to 14 Minutes | 4,444 (12.3%) | 5,033 (15.7%) |
| 15 to 19 Minutes | 5,385 (14.9%) | 6,510 (20.3%) |
| 20 to 24 Minutes | 6,222 (17.3%) | 4,861 (15.2%) |
| 25 to 29 Minutes | 2,934 (8.1%) | 2,544 (7.9%) |
| 30 to 34 Minutes | 5,832 (16.2%) | 4,036 (12.6%) |
| 35 to 39 Minutes | 871 (2.4%) | 1,488 (4.6%) |
| 40 to 44 Minutes | 1,543 (4.3%) | 824 (2.6%) |
| 45 to 59 Minutes | 3,853 (10.7%) | 1,807 (5.6%) |
| 60 to 89 Minutes | 1,806 (5.0%) | 594 (1.8%) |
| 90 or more Minutes | 605 (1.7%) | 335 (1.1%) |
Time of Departure to Work by Sex in Aiken County
The most frequent times of departure to work in Aiken County are 6:00 AM to 6:29 AM (5,102, 14.1%) for males and 7:00 AM to 7:29 AM (4,989, 15.6%) for females.
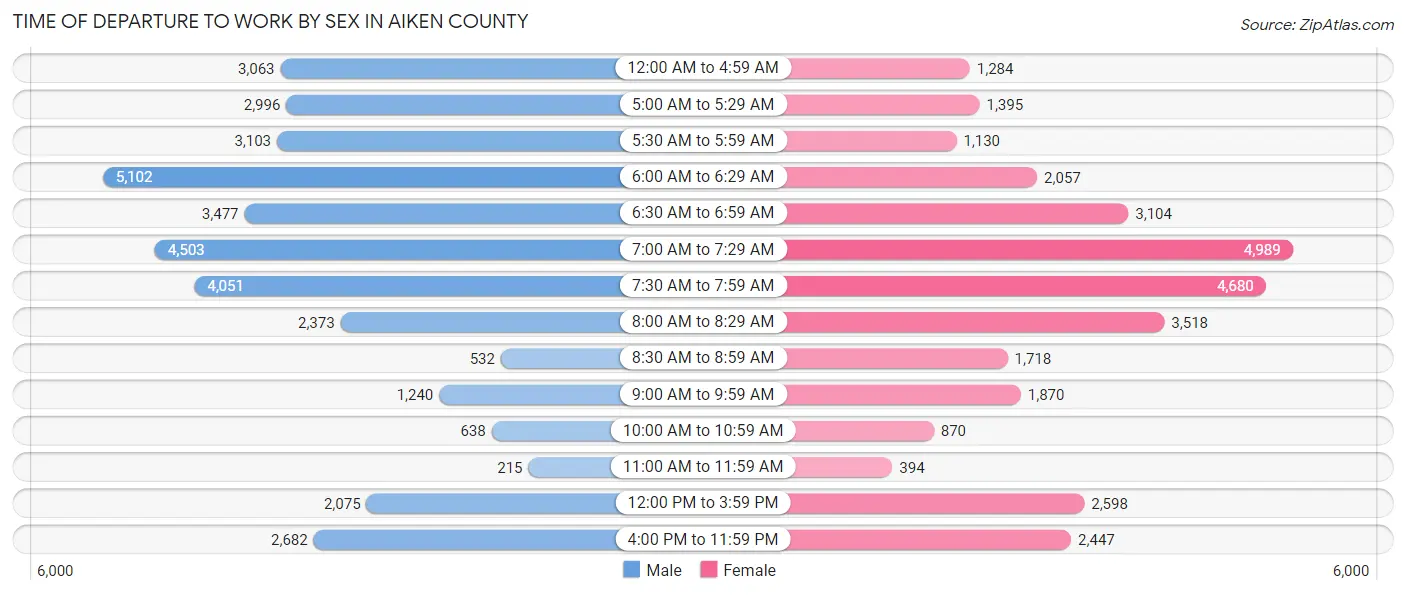
| Time of Departure | Male | Female |
| 12:00 AM to 4:59 AM | 3,063 (8.5%) | 1,284 (4.0%) |
| 5:00 AM to 5:29 AM | 2,996 (8.3%) | 1,395 (4.3%) |
| 5:30 AM to 5:59 AM | 3,103 (8.6%) | 1,130 (3.5%) |
| 6:00 AM to 6:29 AM | 5,102 (14.1%) | 2,057 (6.4%) |
| 6:30 AM to 6:59 AM | 3,477 (9.6%) | 3,104 (9.7%) |
| 7:00 AM to 7:29 AM | 4,503 (12.5%) | 4,989 (15.6%) |
| 7:30 AM to 7:59 AM | 4,051 (11.2%) | 4,680 (14.6%) |
| 8:00 AM to 8:29 AM | 2,373 (6.6%) | 3,518 (11.0%) |
| 8:30 AM to 8:59 AM | 532 (1.5%) | 1,718 (5.4%) |
| 9:00 AM to 9:59 AM | 1,240 (3.4%) | 1,870 (5.8%) |
| 10:00 AM to 10:59 AM | 638 (1.8%) | 870 (2.7%) |
| 11:00 AM to 11:59 AM | 215 (0.6%) | 394 (1.2%) |
| 12:00 PM to 3:59 PM | 2,075 (5.8%) | 2,598 (8.1%) |
| 4:00 PM to 11:59 PM | 2,682 (7.4%) | 2,447 (7.6%) |
| Total | 36,050 (100.0%) | 32,054 (100.0%) |
Housing Occupancy in Aiken County
Occupancy by Ownership in Aiken County
Of the total 67,904 dwellings in Aiken County, owner-occupied units account for 51,134 (75.3%), while renter-occupied units make up 16,770 (24.7%).
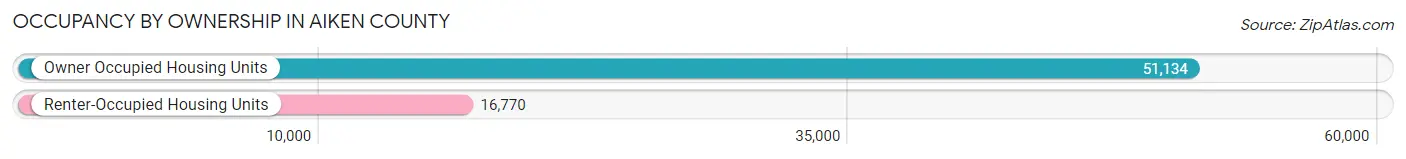
| Occupancy | # Housing Units | % Housing Units |
| Owner Occupied Housing Units | 51,134 | 75.3% |
| Renter-Occupied Housing Units | 16,770 | 24.7% |
| Total Occupied Housing Units | 67,904 | 100.0% |
Occupancy by Household Size in Aiken County
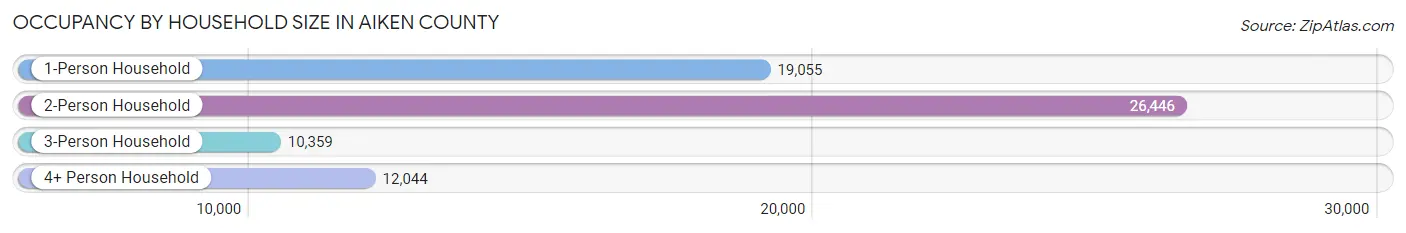
| Household Size | # Housing Units | % Housing Units |
| 1-Person Household | 19,055 | 28.1% |
| 2-Person Household | 26,446 | 39.0% |
| 3-Person Household | 10,359 | 15.3% |
| 4+ Person Household | 12,044 | 17.7% |
| Total Housing Units | 67,904 | 100.0% |
Occupancy by Ownership by Household Size in Aiken County
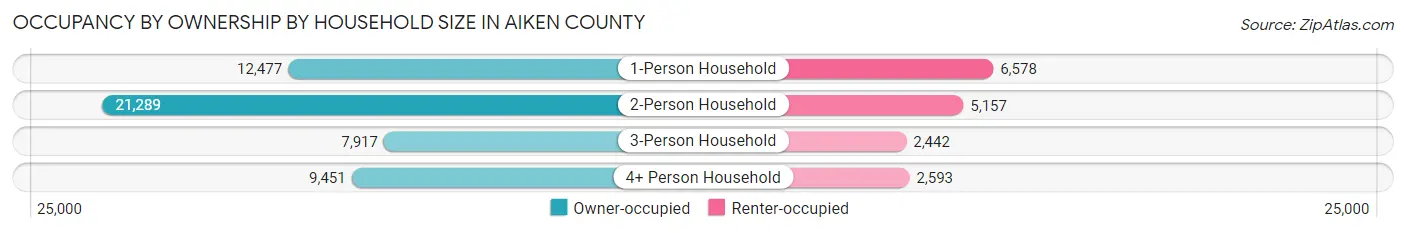
| Household Size | Owner-occupied | Renter-occupied |
| 1-Person Household | 12,477 (65.5%) | 6,578 (34.5%) |
| 2-Person Household | 21,289 (80.5%) | 5,157 (19.5%) |
| 3-Person Household | 7,917 (76.4%) | 2,442 (23.6%) |
| 4+ Person Household | 9,451 (78.5%) | 2,593 (21.5%) |
| Total Housing Units | 51,134 (75.3%) | 16,770 (24.7%) |
Occupancy by Educational Attainment in Aiken County
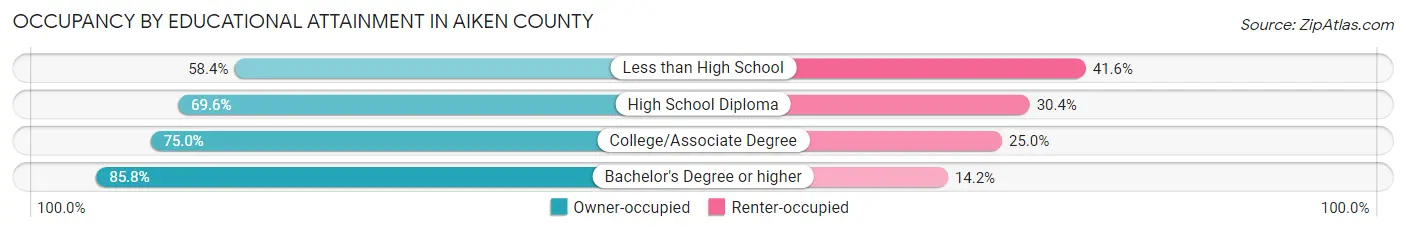
| Household Size | Owner-occupied | Renter-occupied |
| Less than High School | 3,912 (58.4%) | 2,782 (41.6%) |
| High School Diploma | 13,264 (69.6%) | 5,804 (30.4%) |
| College/Associate Degree | 15,287 (75.0%) | 5,086 (25.0%) |
| Bachelor's Degree or higher | 18,671 (85.8%) | 3,098 (14.2%) |
Occupancy by Age of Householder in Aiken County
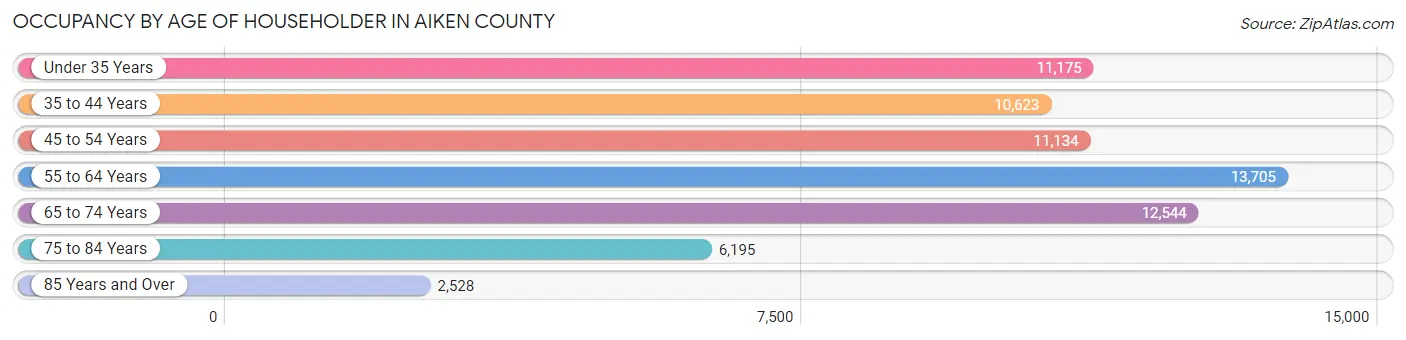
| Age Bracket | # Households | % Households |
| Under 35 Years | 11,175 | 16.5% |
| 35 to 44 Years | 10,623 | 15.6% |
| 45 to 54 Years | 11,134 | 16.4% |
| 55 to 64 Years | 13,705 | 20.2% |
| 65 to 74 Years | 12,544 | 18.5% |
| 75 to 84 Years | 6,195 | 9.1% |
| 85 Years and Over | 2,528 | 3.7% |
| Total | 67,904 | 100.0% |
Housing Finances in Aiken County
Median Income by Occupancy in Aiken County
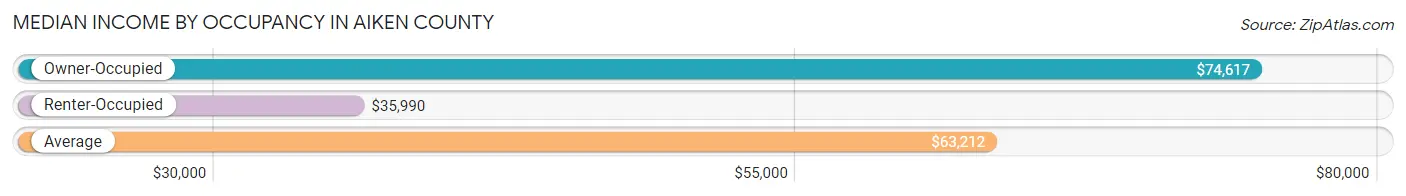
| Occupancy Type | # Households | Median Income |
| Owner-Occupied | 51,134 (75.3%) | $74,617 |
| Renter-Occupied | 16,770 (24.7%) | $35,990 |
| Average | 67,904 (100.0%) | $63,212 |
Occupancy by Householder Income Bracket in Aiken County
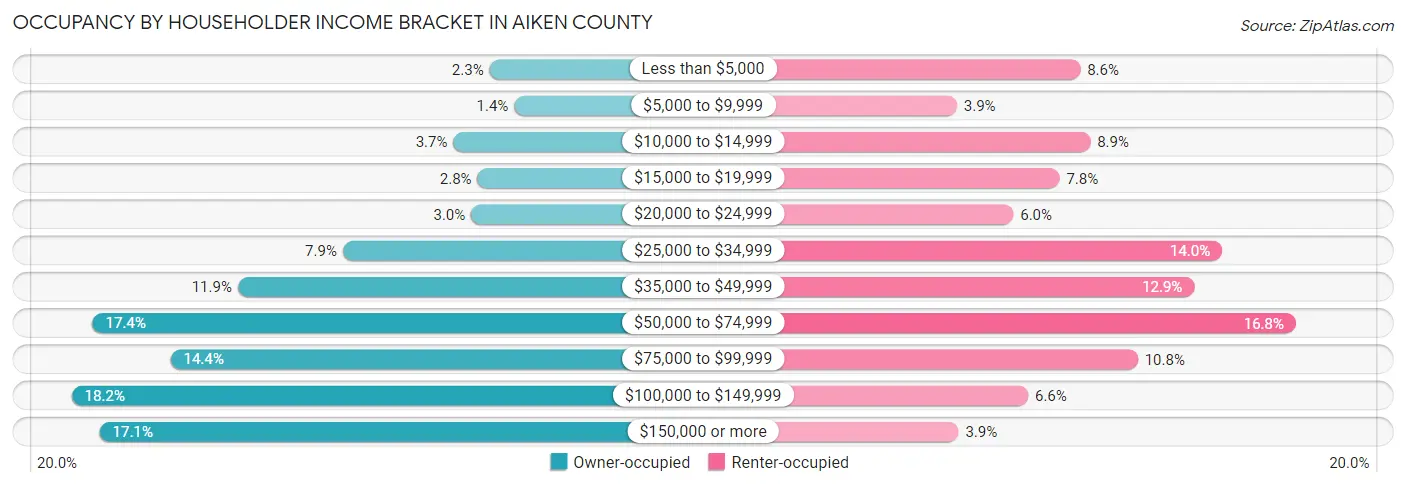
| Income Bracket | Owner-occupied | Renter-occupied |
| Less than $5,000 | 1,169 (2.3%) | 1,435 (8.6%) |
| $5,000 to $9,999 | 689 (1.3%) | 647 (3.9%) |
| $10,000 to $14,999 | 1,877 (3.7%) | 1,499 (8.9%) |
| $15,000 to $19,999 | 1,405 (2.8%) | 1,303 (7.8%) |
| $20,000 to $24,999 | 1,527 (3.0%) | 1,008 (6.0%) |
| $25,000 to $34,999 | 4,027 (7.9%) | 2,341 (14.0%) |
| $35,000 to $49,999 | 6,076 (11.9%) | 2,164 (12.9%) |
| $50,000 to $74,999 | 8,902 (17.4%) | 2,813 (16.8%) |
| $75,000 to $99,999 | 7,385 (14.4%) | 1,802 (10.7%) |
| $100,000 to $149,999 | 9,314 (18.2%) | 1,101 (6.6%) |
| $150,000 or more | 8,763 (17.1%) | 657 (3.9%) |
| Total | 51,134 (100.0%) | 16,770 (100.0%) |
Monthly Housing Cost Tiers in Aiken County
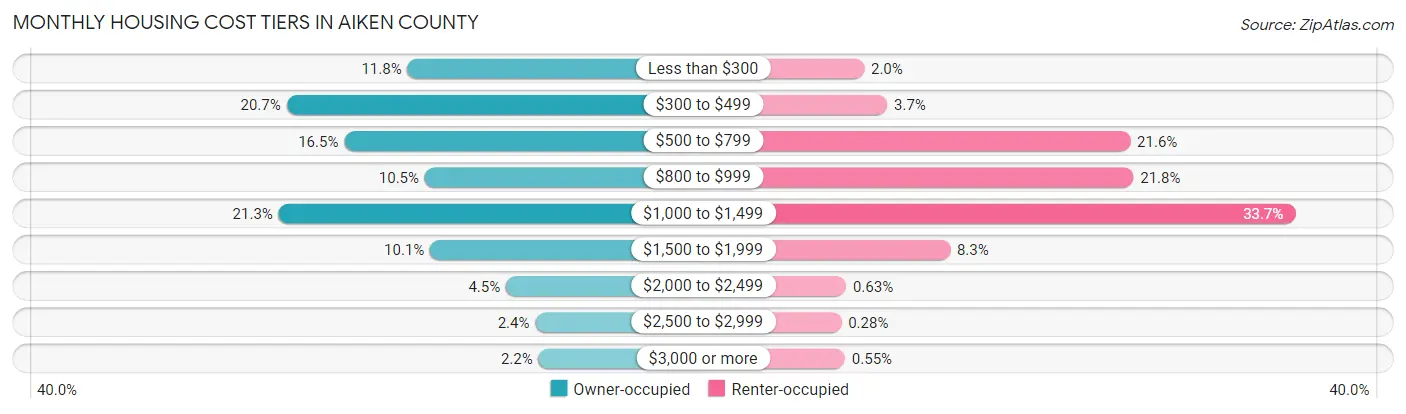
| Monthly Cost | Owner-occupied | Renter-occupied |
| Less than $300 | 6,033 (11.8%) | 329 (2.0%) |
| $300 to $499 | 10,592 (20.7%) | 614 (3.7%) |
| $500 to $799 | 8,417 (16.5%) | 3,615 (21.6%) |
| $800 to $999 | 5,381 (10.5%) | 3,654 (21.8%) |
| $1,000 to $1,499 | 10,887 (21.3%) | 5,654 (33.7%) |
| $1,500 to $1,999 | 5,181 (10.1%) | 1,390 (8.3%) |
| $2,000 to $2,499 | 2,323 (4.5%) | 105 (0.6%) |
| $2,500 to $2,999 | 1,222 (2.4%) | 47 (0.3%) |
| $3,000 or more | 1,098 (2.1%) | 92 (0.5%) |
| Total | 51,134 (100.0%) | 16,770 (100.0%) |
Physical Housing Characteristics in Aiken County
Housing Structures in Aiken County
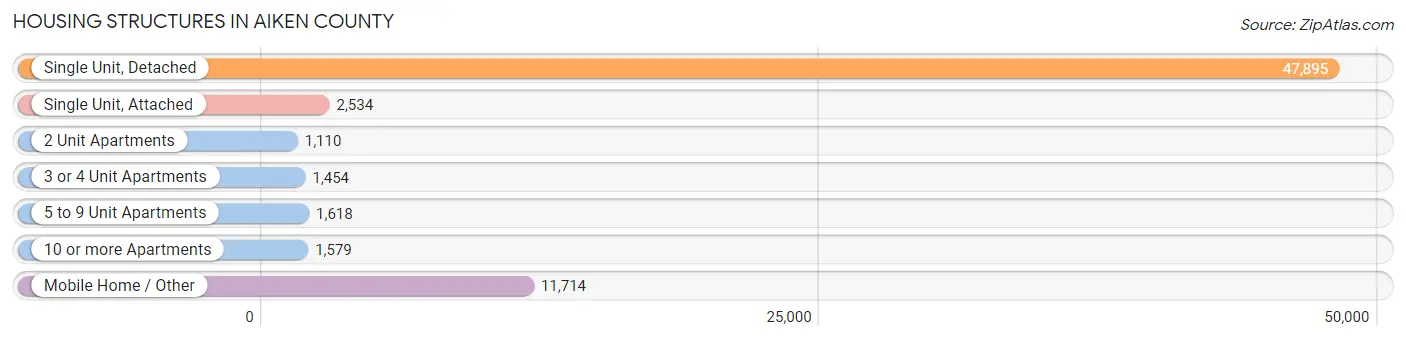
| Structure Type | # Housing Units | % Housing Units |
| Single Unit, Detached | 47,895 | 70.5% |
| Single Unit, Attached | 2,534 | 3.7% |
| 2 Unit Apartments | 1,110 | 1.6% |
| 3 or 4 Unit Apartments | 1,454 | 2.1% |
| 5 to 9 Unit Apartments | 1,618 | 2.4% |
| 10 or more Apartments | 1,579 | 2.3% |
| Mobile Home / Other | 11,714 | 17.2% |
| Total | 67,904 | 100.0% |
Housing Structures by Occupancy in Aiken County
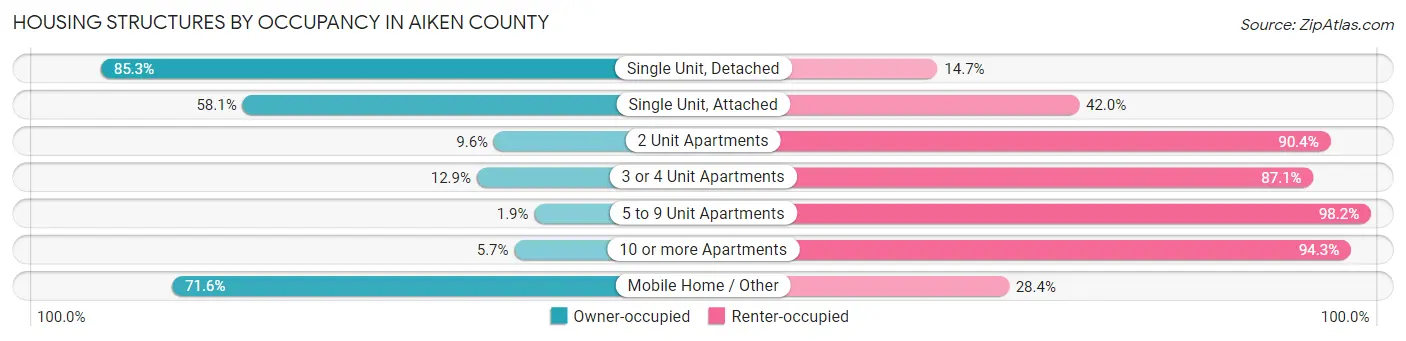
| Structure Type | Owner-occupied | Renter-occupied |
| Single Unit, Detached | 40,862 (85.3%) | 7,033 (14.7%) |
| Single Unit, Attached | 1,471 (58.1%) | 1,063 (41.9%) |
| 2 Unit Apartments | 107 (9.6%) | 1,003 (90.4%) |
| 3 or 4 Unit Apartments | 188 (12.9%) | 1,266 (87.1%) |
| 5 to 9 Unit Apartments | 30 (1.8%) | 1,588 (98.2%) |
| 10 or more Apartments | 90 (5.7%) | 1,489 (94.3%) |
| Mobile Home / Other | 8,386 (71.6%) | 3,328 (28.4%) |
| Total | 51,134 (75.3%) | 16,770 (24.7%) |
Housing Structures by Number of Rooms in Aiken County
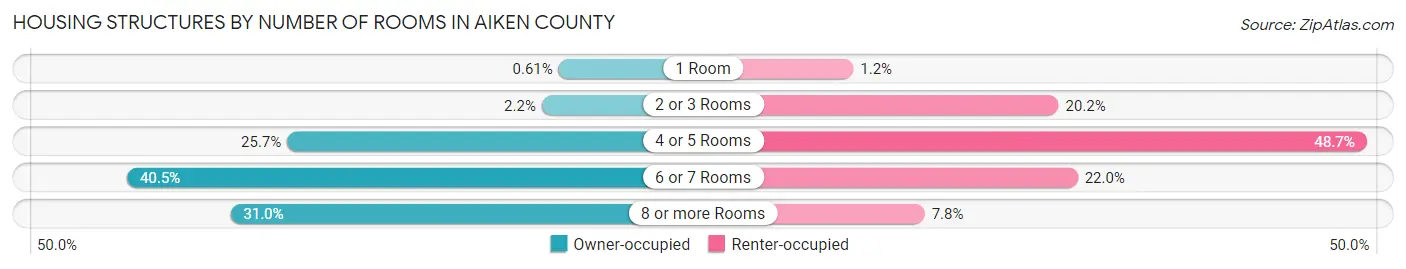
| Number of Rooms | Owner-occupied | Renter-occupied |
| 1 Room | 312 (0.6%) | 208 (1.2%) |
| 2 or 3 Rooms | 1,108 (2.2%) | 3,391 (20.2%) |
| 4 or 5 Rooms | 13,152 (25.7%) | 8,168 (48.7%) |
| 6 or 7 Rooms | 20,726 (40.5%) | 3,688 (22.0%) |
| 8 or more Rooms | 15,836 (31.0%) | 1,315 (7.8%) |
| Total | 51,134 (100.0%) | 16,770 (100.0%) |
Housing Structure by Heating Type in Aiken County
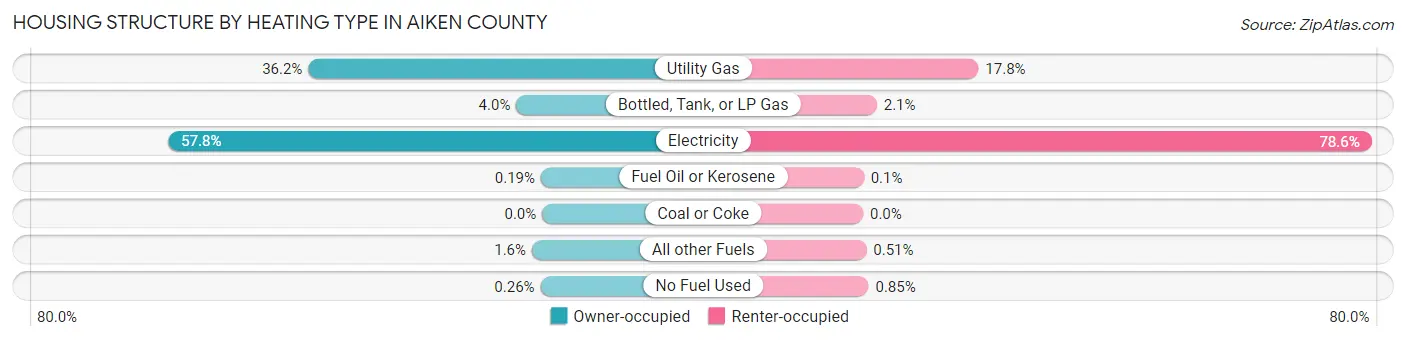
| Heating Type | Owner-occupied | Renter-occupied |
| Utility Gas | 18,488 (36.2%) | 2,990 (17.8%) |
| Bottled, Tank, or LP Gas | 2,044 (4.0%) | 356 (2.1%) |
| Electricity | 29,562 (57.8%) | 13,179 (78.6%) |
| Fuel Oil or Kerosene | 99 (0.2%) | 16 (0.1%) |
| Coal or Coke | 0 (0.0%) | 0 (0.0%) |
| All other Fuels | 810 (1.6%) | 86 (0.5%) |
| No Fuel Used | 131 (0.3%) | 143 (0.9%) |
| Total | 51,134 (100.0%) | 16,770 (100.0%) |
Household Vehicle Usage in Aiken County
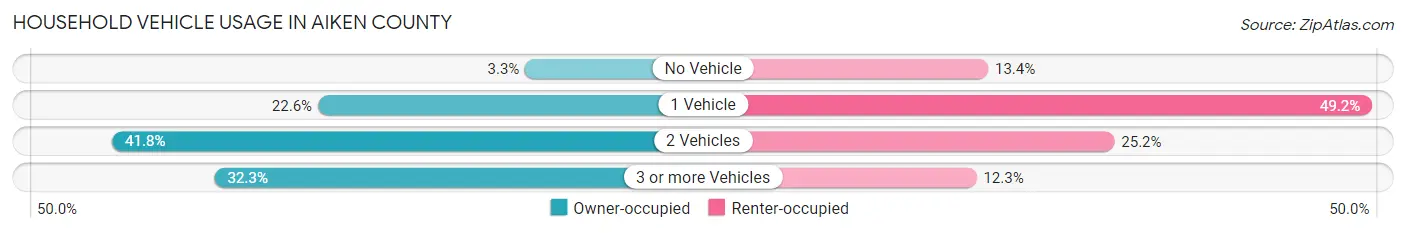
| Vehicles per Household | Owner-occupied | Renter-occupied |
| No Vehicle | 1,674 (3.3%) | 2,241 (13.4%) |
| 1 Vehicle | 11,567 (22.6%) | 8,251 (49.2%) |
| 2 Vehicles | 21,391 (41.8%) | 4,218 (25.2%) |
| 3 or more Vehicles | 16,502 (32.3%) | 2,060 (12.3%) |
| Total | 51,134 (100.0%) | 16,770 (100.0%) |
Real Estate & Mortgages in Aiken County
Real Estate and Mortgage Overview in Aiken County
| Characteristic | Without Mortgage | With Mortgage |
| Housing Units | 22,715 | 28,419 |
| Median Property Value | $154,200 | $198,500 |
| Median Household Income | $55,881 | $6,148 |
| Monthly Housing Costs | $396 | $1,082 |
| Real Estate Taxes | $622 | $541 |
Property Value by Mortgage Status in Aiken County
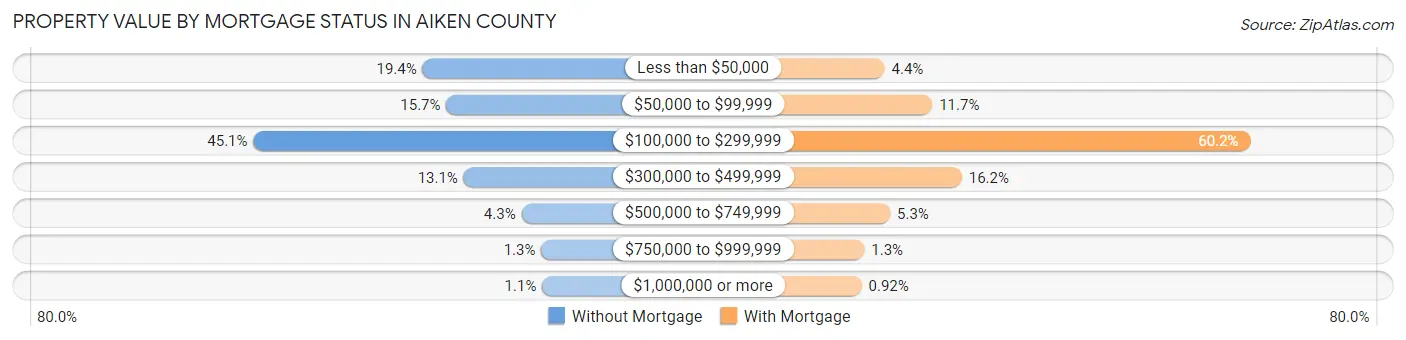
| Property Value | Without Mortgage | With Mortgage |
| Less than $50,000 | 4,398 (19.4%) | 1,259 (4.4%) |
| $50,000 to $99,999 | 3,572 (15.7%) | 3,322 (11.7%) |
| $100,000 to $299,999 | 10,254 (45.1%) | 17,099 (60.2%) |
| $300,000 to $499,999 | 2,974 (13.1%) | 4,601 (16.2%) |
| $500,000 to $749,999 | 973 (4.3%) | 1,494 (5.3%) |
| $750,000 to $999,999 | 289 (1.3%) | 382 (1.3%) |
| $1,000,000 or more | 255 (1.1%) | 262 (0.9%) |
| Total | 22,715 (100.0%) | 28,419 (100.0%) |
Household Income by Mortgage Status in Aiken County
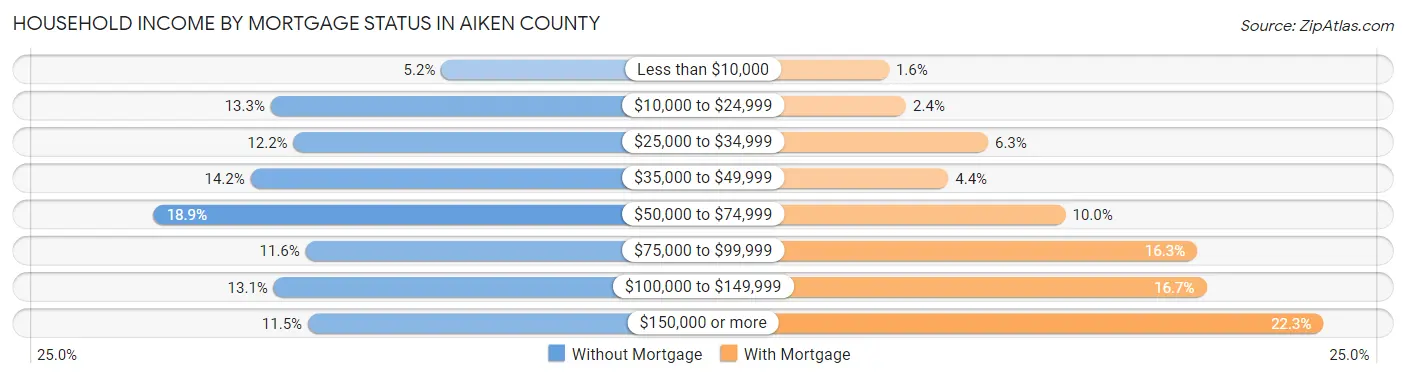
| Household Income | Without Mortgage | With Mortgage |
| Less than $10,000 | 1,172 (5.2%) | 452 (1.6%) |
| $10,000 to $24,999 | 3,016 (13.3%) | 686 (2.4%) |
| $25,000 to $34,999 | 2,771 (12.2%) | 1,793 (6.3%) |
| $35,000 to $49,999 | 3,235 (14.2%) | 1,256 (4.4%) |
| $50,000 to $74,999 | 4,282 (18.9%) | 2,841 (10.0%) |
| $75,000 to $99,999 | 2,640 (11.6%) | 4,620 (16.3%) |
| $100,000 to $149,999 | 2,984 (13.1%) | 4,745 (16.7%) |
| $150,000 or more | 2,615 (11.5%) | 6,330 (22.3%) |
| Total | 22,715 (100.0%) | 28,419 (100.0%) |
Property Value to Household Income Ratio in Aiken County
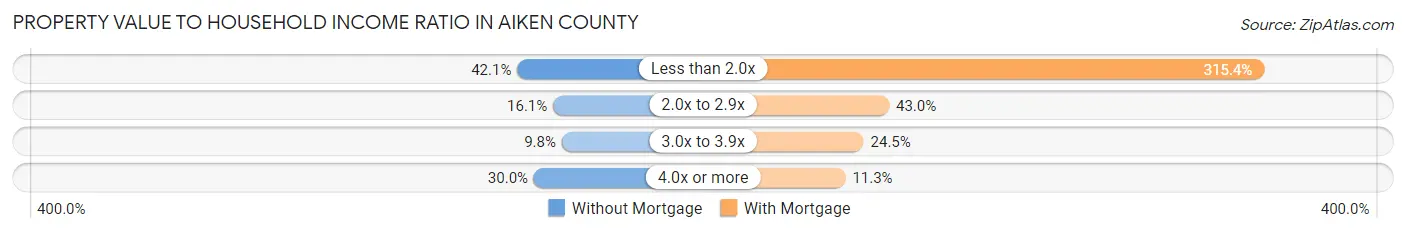
| Value-to-Income Ratio | Without Mortgage | With Mortgage |
| Less than 2.0x | 9,570 (42.1%) | 89,645 (315.4%) |
| 2.0x to 2.9x | 3,652 (16.1%) | 12,211 (43.0%) |
| 3.0x to 3.9x | 2,218 (9.8%) | 6,953 (24.5%) |
| 4.0x or more | 6,818 (30.0%) | 3,208 (11.3%) |
| Total | 22,715 (100.0%) | 28,419 (100.0%) |
Real Estate Taxes by Mortgage Status in Aiken County
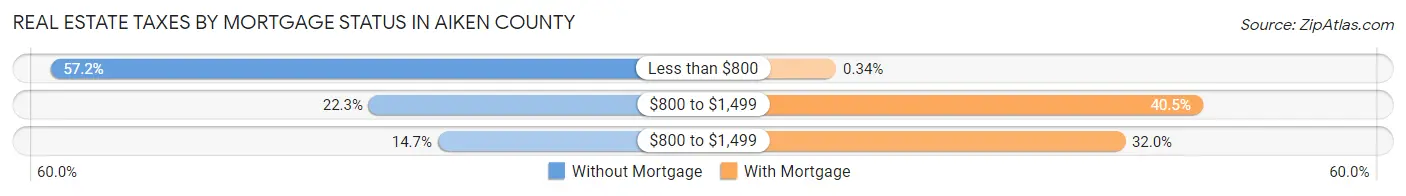
| Property Taxes | Without Mortgage | With Mortgage |
| Less than $800 | 12,986 (57.2%) | 96 (0.3%) |
| $800 to $1,499 | 5,060 (22.3%) | 11,512 (40.5%) |
| $800 to $1,499 | 3,344 (14.7%) | 9,092 (32.0%) |
| Total | 22,715 (100.0%) | 28,419 (100.0%) |
Health & Disability in Aiken County
Health Insurance Coverage by Age in Aiken County
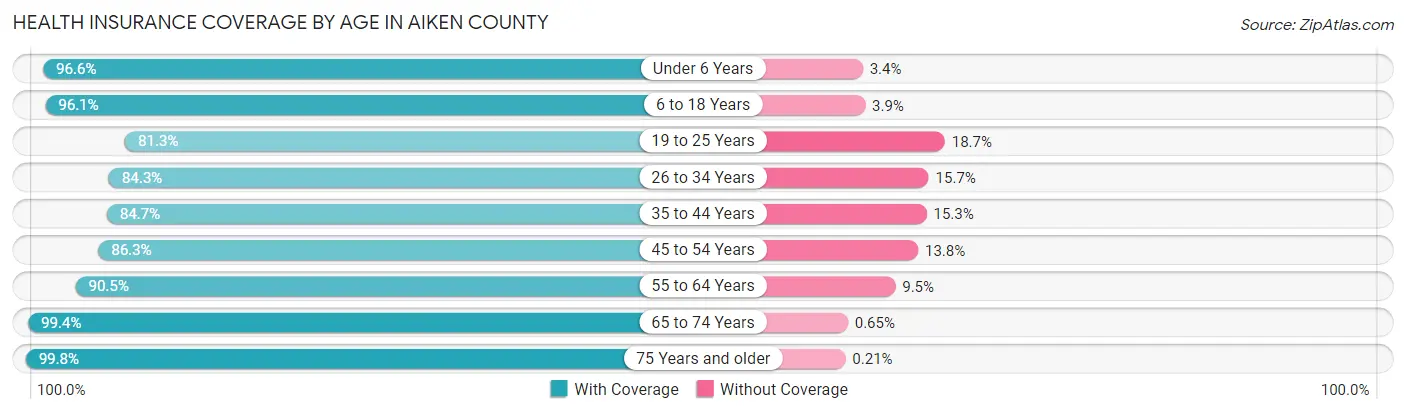
| Age Bracket | With Coverage | Without Coverage |
| Under 6 Years | 10,875 (96.6%) | 387 (3.4%) |
| 6 to 18 Years | 25,929 (96.1%) | 1,047 (3.9%) |
| 19 to 25 Years | 10,972 (81.3%) | 2,530 (18.7%) |
| 26 to 34 Years | 15,745 (84.3%) | 2,940 (15.7%) |
| 35 to 44 Years | 16,708 (84.7%) | 3,026 (15.3%) |
| 45 to 54 Years | 17,565 (86.3%) | 2,800 (13.8%) |
| 55 to 64 Years | 21,575 (90.5%) | 2,268 (9.5%) |
| 65 to 74 Years | 20,030 (99.4%) | 131 (0.6%) |
| 75 Years and older | 13,161 (99.8%) | 28 (0.2%) |
| Total | 152,560 (91.0%) | 15,157 (9.0%) |
Health Insurance Coverage by Citizenship Status in Aiken County
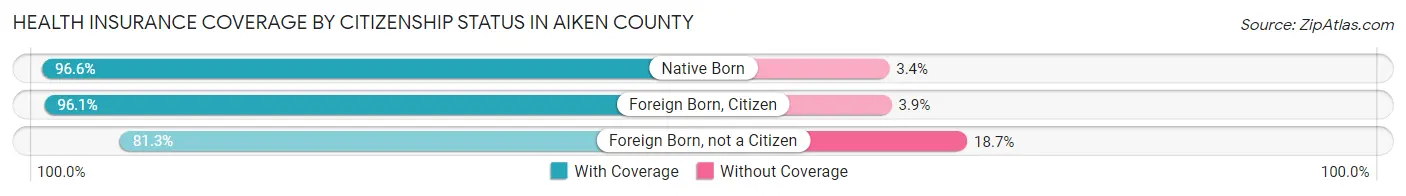
| Citizenship Status | With Coverage | Without Coverage |
| Native Born | 10,875 (96.6%) | 387 (3.4%) |
| Foreign Born, Citizen | 25,929 (96.1%) | 1,047 (3.9%) |
| Foreign Born, not a Citizen | 10,972 (81.3%) | 2,530 (18.7%) |
Health Insurance Coverage by Household Income in Aiken County
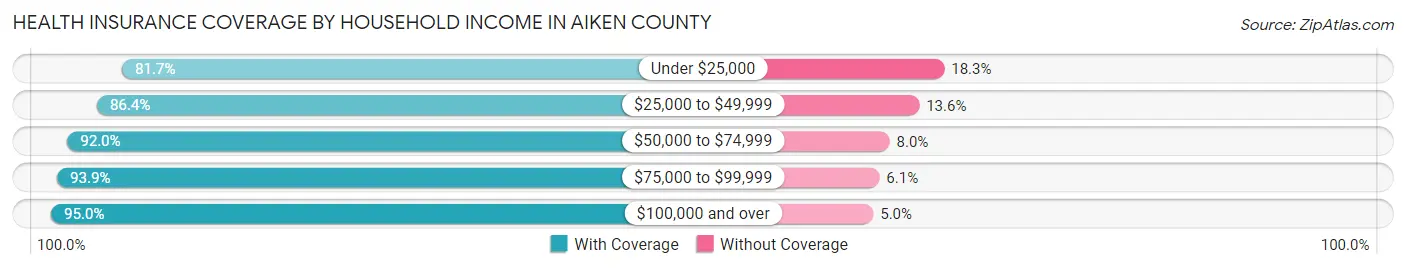
| Household Income | With Coverage | Without Coverage |
| Under $25,000 | 18,624 (81.7%) | 4,160 (18.3%) |
| $25,000 to $49,999 | 25,688 (86.4%) | 4,034 (13.6%) |
| $50,000 to $74,999 | 25,883 (92.0%) | 2,258 (8.0%) |
| $75,000 to $99,999 | 24,404 (93.9%) | 1,587 (6.1%) |
| $100,000 and over | 56,777 (95.0%) | 2,966 (5.0%) |
Public vs Private Health Insurance Coverage by Age in Aiken County
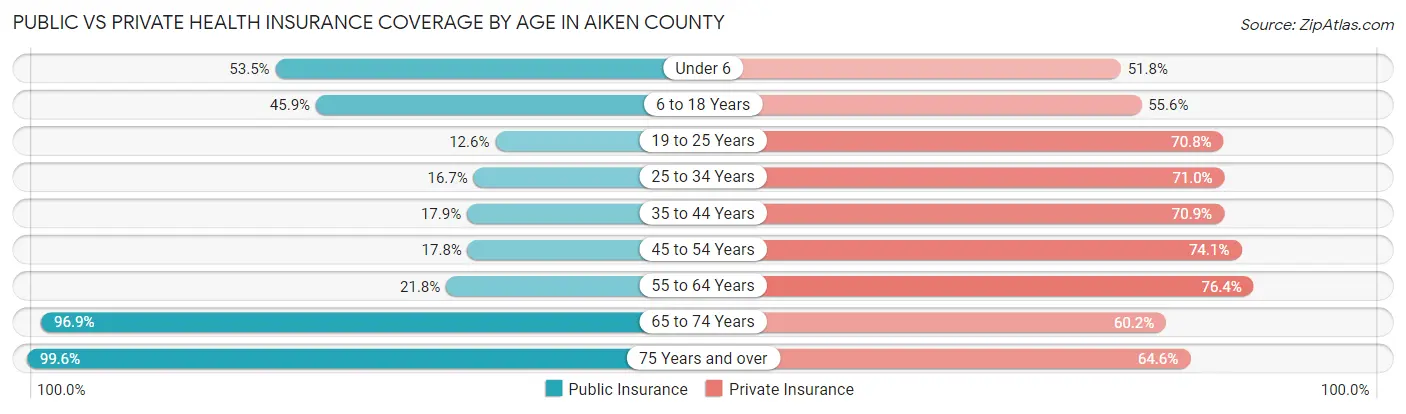
| Age Bracket | Public Insurance | Private Insurance |
| Under 6 | 6,019 (53.4%) | 5,832 (51.8%) |
| 6 to 18 Years | 12,390 (45.9%) | 14,992 (55.6%) |
| 19 to 25 Years | 1,706 (12.6%) | 9,564 (70.8%) |
| 25 to 34 Years | 3,115 (16.7%) | 13,271 (71.0%) |
| 35 to 44 Years | 3,531 (17.9%) | 13,996 (70.9%) |
| 45 to 54 Years | 3,616 (17.8%) | 15,099 (74.1%) |
| 55 to 64 Years | 5,188 (21.8%) | 18,225 (76.4%) |
| 65 to 74 Years | 19,541 (96.9%) | 12,132 (60.2%) |
| 75 Years and over | 13,134 (99.6%) | 8,526 (64.6%) |
| Total | 68,240 (40.7%) | 111,637 (66.6%) |
Disability Status by Sex by Age in Aiken County
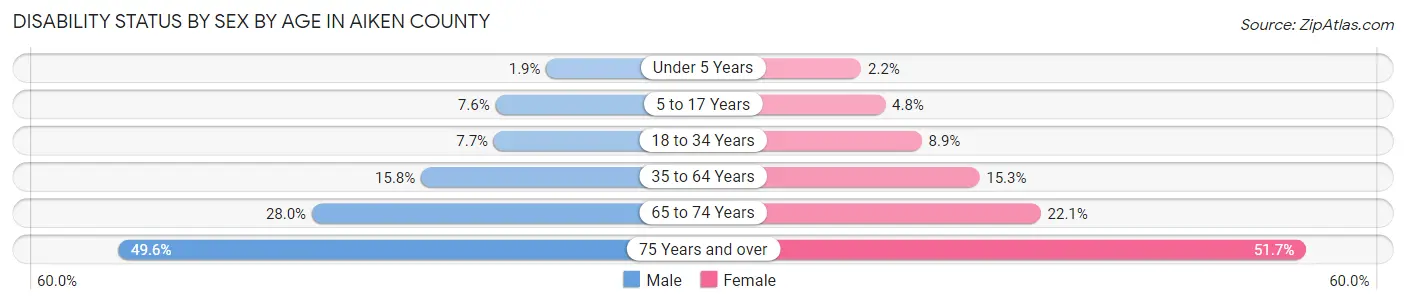
| Age Bracket | Male | Female |
| Under 5 Years | 91 (1.9%) | 101 (2.1%) |
| 5 to 17 Years | 1,021 (7.6%) | 636 (4.8%) |
| 18 to 34 Years | 1,289 (7.7%) | 1,560 (8.9%) |
| 35 to 64 Years | 4,930 (15.8%) | 5,026 (15.3%) |
| 65 to 74 Years | 2,589 (28.0%) | 2,417 (22.1%) |
| 75 Years and over | 2,814 (49.6%) | 3,885 (51.7%) |
Disability Class by Sex by Age in Aiken County
Disability Class: Hearing Difficulty
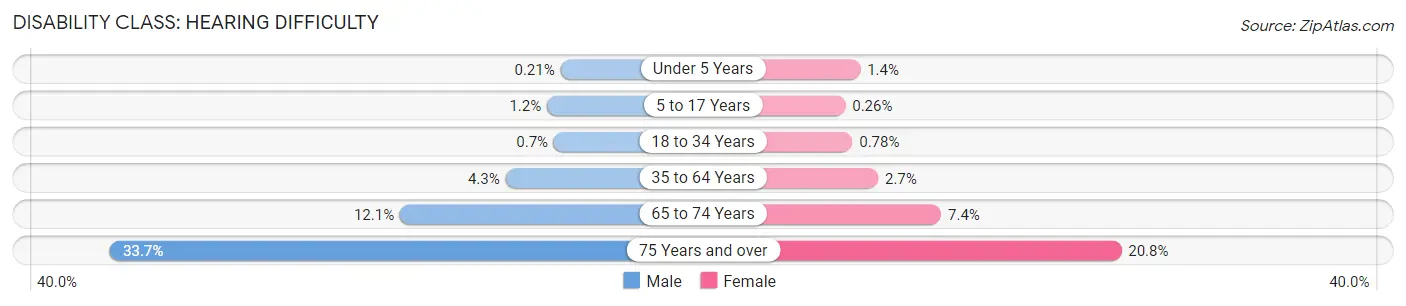
| Age Bracket | Male | Female |
| Under 5 Years | 10 (0.2%) | 64 (1.4%) |
| 5 to 17 Years | 163 (1.2%) | 34 (0.3%) |
| 18 to 34 Years | 117 (0.7%) | 137 (0.8%) |
| 35 to 64 Years | 1,334 (4.3%) | 883 (2.7%) |
| 65 to 74 Years | 1,122 (12.1%) | 804 (7.4%) |
| 75 Years and over | 1,910 (33.7%) | 1,559 (20.7%) |
Disability Class: Vision Difficulty
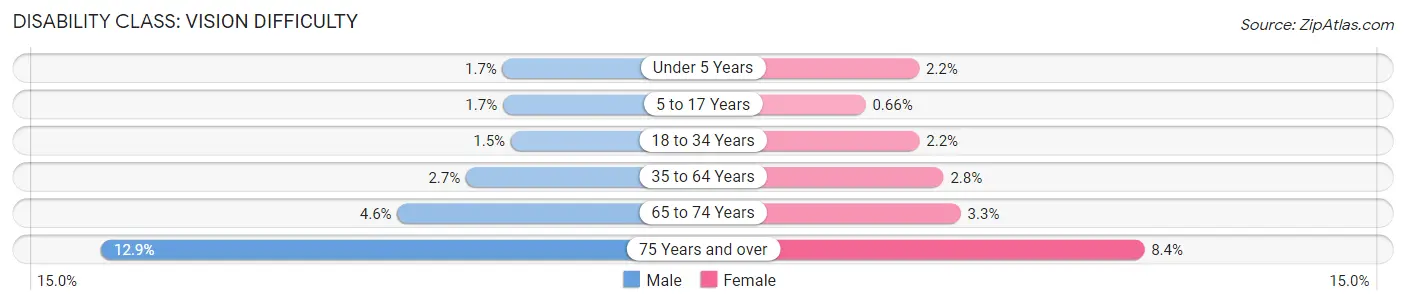
| Age Bracket | Male | Female |
| Under 5 Years | 81 (1.7%) | 101 (2.1%) |
| 5 to 17 Years | 227 (1.7%) | 87 (0.7%) |
| 18 to 34 Years | 243 (1.5%) | 379 (2.2%) |
| 35 to 64 Years | 842 (2.7%) | 929 (2.8%) |
| 65 to 74 Years | 427 (4.6%) | 361 (3.3%) |
| 75 Years and over | 730 (12.9%) | 633 (8.4%) |
Disability Class: Cognitive Difficulty
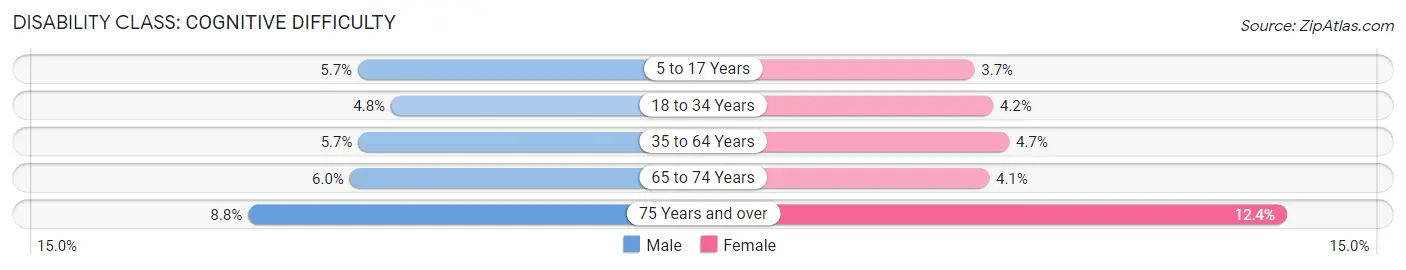
| Age Bracket | Male | Female |
| 5 to 17 Years | 772 (5.7%) | 487 (3.7%) |
| 18 to 34 Years | 800 (4.8%) | 738 (4.2%) |
| 35 to 64 Years | 1,778 (5.7%) | 1,530 (4.7%) |
| 65 to 74 Years | 550 (5.9%) | 447 (4.1%) |
| 75 Years and over | 498 (8.8%) | 931 (12.4%) |
Disability Class: Ambulatory Difficulty
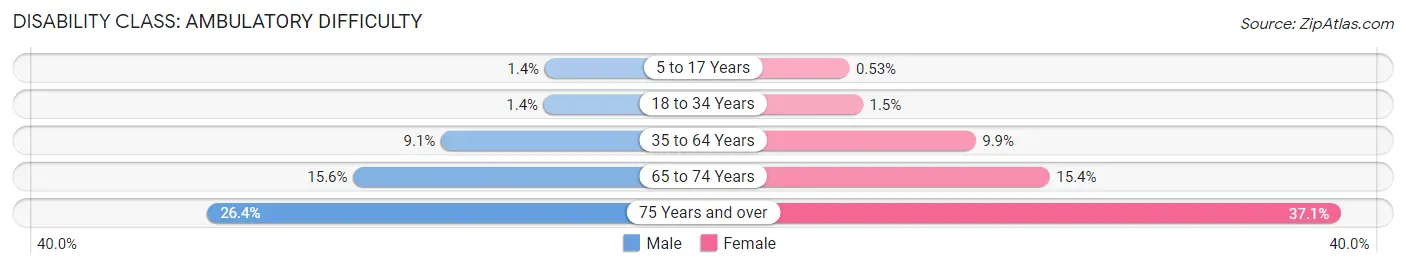
| Age Bracket | Male | Female |
| 5 to 17 Years | 185 (1.4%) | 70 (0.5%) |
| 18 to 34 Years | 240 (1.4%) | 270 (1.5%) |
| 35 to 64 Years | 2,821 (9.1%) | 3,252 (9.9%) |
| 65 to 74 Years | 1,441 (15.6%) | 1,682 (15.4%) |
| 75 Years and over | 1,500 (26.4%) | 2,786 (37.1%) |
Disability Class: Self-Care Difficulty
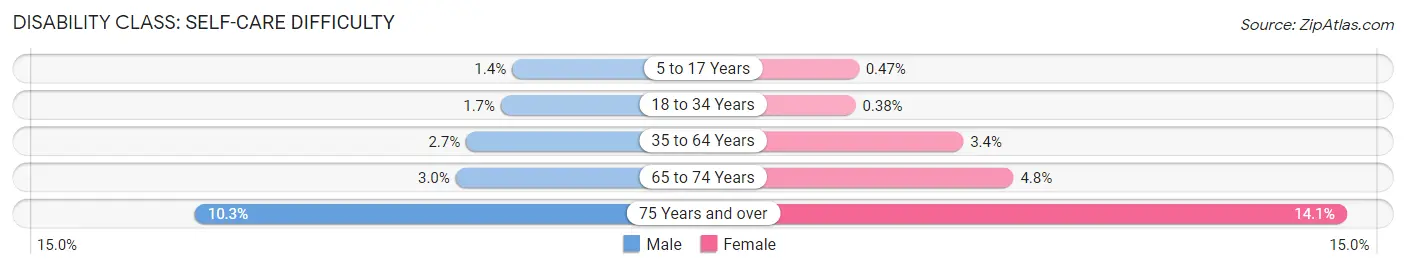
| Age Bracket | Male | Female |
| 5 to 17 Years | 193 (1.4%) | 62 (0.5%) |
| 18 to 34 Years | 290 (1.7%) | 66 (0.4%) |
| 35 to 64 Years | 844 (2.7%) | 1,110 (3.4%) |
| 65 to 74 Years | 277 (3.0%) | 522 (4.8%) |
| 75 Years and over | 582 (10.3%) | 1,056 (14.1%) |
Technology Access in Aiken County
Computing Device Access in Aiken County
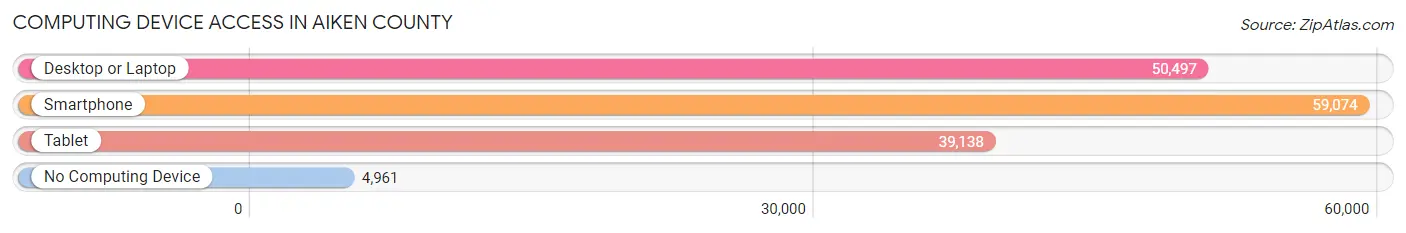
| Device Type | # Households | % Households |
| Desktop or Laptop | 50,497 | 74.4% |
| Smartphone | 59,074 | 87.0% |
| Tablet | 39,138 | 57.6% |
| No Computing Device | 4,961 | 7.3% |
| Total | 67,904 | 100.0% |
Internet Access in Aiken County
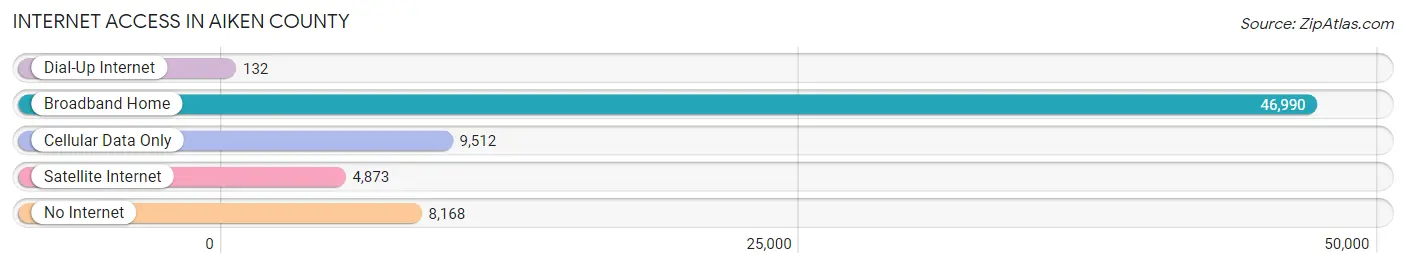
| Internet Type | # Households | % Households |
| Dial-Up Internet | 132 | 0.2% |
| Broadband Home | 46,990 | 69.2% |
| Cellular Data Only | 9,512 | 14.0% |
| Satellite Internet | 4,873 | 7.2% |
| No Internet | 8,168 | 12.0% |
| Total | 67,904 | 100.0% |
Aiken County Summary
Aiken County, South Carolina is located in the central part of the state and is part of the Augusta-Aiken Metropolitan Statistical Area. It is bordered by Edgefield, Saluda, and Lexington Counties to the north, Barnwell County to the east, and Richmond and Columbia Counties to the south. The county seat is Aiken, and the largest city is North Augusta.
History
Aiken County was formed in 1871 from parts of Edgefield, Lexington, and Barnwell Counties. It was named for William Aiken, Jr., the president of the South Carolina Canal and Rail Road Company. The county was originally part of the Old 96 District, and was home to many Native American tribes, including the Catawba, Cherokee, and Creek.
The county was home to many prominent figures in South Carolina history, including William Aiken, Jr., who was the first governor of the state, and William Gregg, who founded the first cotton mill in the South. The county was also home to the first golf course in the United States, the Aiken Golf Club, which was founded in 1884.
Geography
Aiken County covers an area of 837 square miles and is located in the Piedmont region of South Carolina. The Savannah River forms the northern border of the county, and the Saluda River forms the southern border. The county is mostly flat, with some rolling hills in the northern part. The soil is mostly sandy loam, and the climate is humid subtropical.
The county is home to several state parks, including Aiken State Park, which is located on the banks of the Savannah River. The park offers camping, fishing, and hiking, as well as a variety of other outdoor activities.
Economy
Aiken County has a diverse economy, with a mix of manufacturing, agriculture, and services. The county is home to several large employers, including Bridgestone, Kimberly-Clark, and Savannah River Nuclear Solutions. The county is also home to several smaller businesses, including restaurants, retail stores, and professional services.
Agriculture is an important part of the county’s economy, with crops such as cotton, corn, soybeans, and peanuts being grown in the area. Livestock production is also important, with cattle, hogs, and poultry being raised in the county.
Demographics
As of the 2010 census, Aiken County had a population of 160,099. The population was 54.2% white, 40.2% African American, 2.2% Hispanic or Latino, 1.7% Asian, and 0.7% Native American. The median household income was $45,945, and the median home value was $133,400.
Aiken County is home to several colleges and universities, including the University of South Carolina Aiken, Aiken Technical College, and Paine College. The county is also home to several museums, including the Aiken County Historical Museum and the Aiken Thoroughbred Racing Hall of Fame and Museum.
Aiken County is a vibrant and diverse community, with a rich history and a strong economy. It is home to a variety of businesses, educational institutions, and cultural attractions, making it an ideal place to live and work.
Common Questions
What is Per Capita Income in Aiken County?
Per Capita income in Aiken County is $34,786.
What is the Median Family Income in Aiken County?
Median Family Income in Aiken County is $78,829.
What is the Median Household income in Aiken County?
Median Household Income in Aiken County is $63,212.
What is Income or Wage Gap in Aiken County?
Income or Wage Gap in Aiken County is 37.4%.
Women in Aiken County earn 62.6 cents for every dollar earned by a man.
What is Family Income Deficit in Aiken County?
Family Income Deficit in Aiken County is $11,525.
Families that are below poverty line in Aiken County earn $11,525 less on average than the poverty threshold level.
What is Inequality or Gini Index in Aiken County?
Inequality or Gini Index in Aiken County is 0.45.
What is the Total Population of Aiken County?
Total Population of Aiken County is 169,865.
What is the Total Male Population of Aiken County?
Total Male Population of Aiken County is 82,326.
What is the Total Female Population of Aiken County?
Total Female Population of Aiken County is 87,539.
What is the Ratio of Males per 100 Females in Aiken County?
There are 94.04 Males per 100 Females in Aiken County.
What is the Ratio of Females per 100 Males in Aiken County?
There are 106.33 Females per 100 Males in Aiken County.
What is the Median Population Age in Aiken County?
Median Population Age in Aiken County is 41.8 Years.
What is the Average Family Size in Aiken County
Average Family Size in Aiken County is 3.0 People.
What is the Average Household Size in Aiken County
Average Household Size in Aiken County is 2.5 People.
How Large is the Labor Force in Aiken County?
There are 79,717 People in the Labor Forcein in Aiken County.
What is the Percentage of People in the Labor Force in Aiken County?
58.0% of People are in the Labor Force in Aiken County.
What is the Unemployment Rate in Aiken County?
Unemployment Rate in Aiken County is 6.2%.