Cities with the Highest Percentage of Population Employed in Education, Arts & Media in the United States
RELATED REPORTS & OPTIONS
Education, Arts & Media
United States
Compare Cities
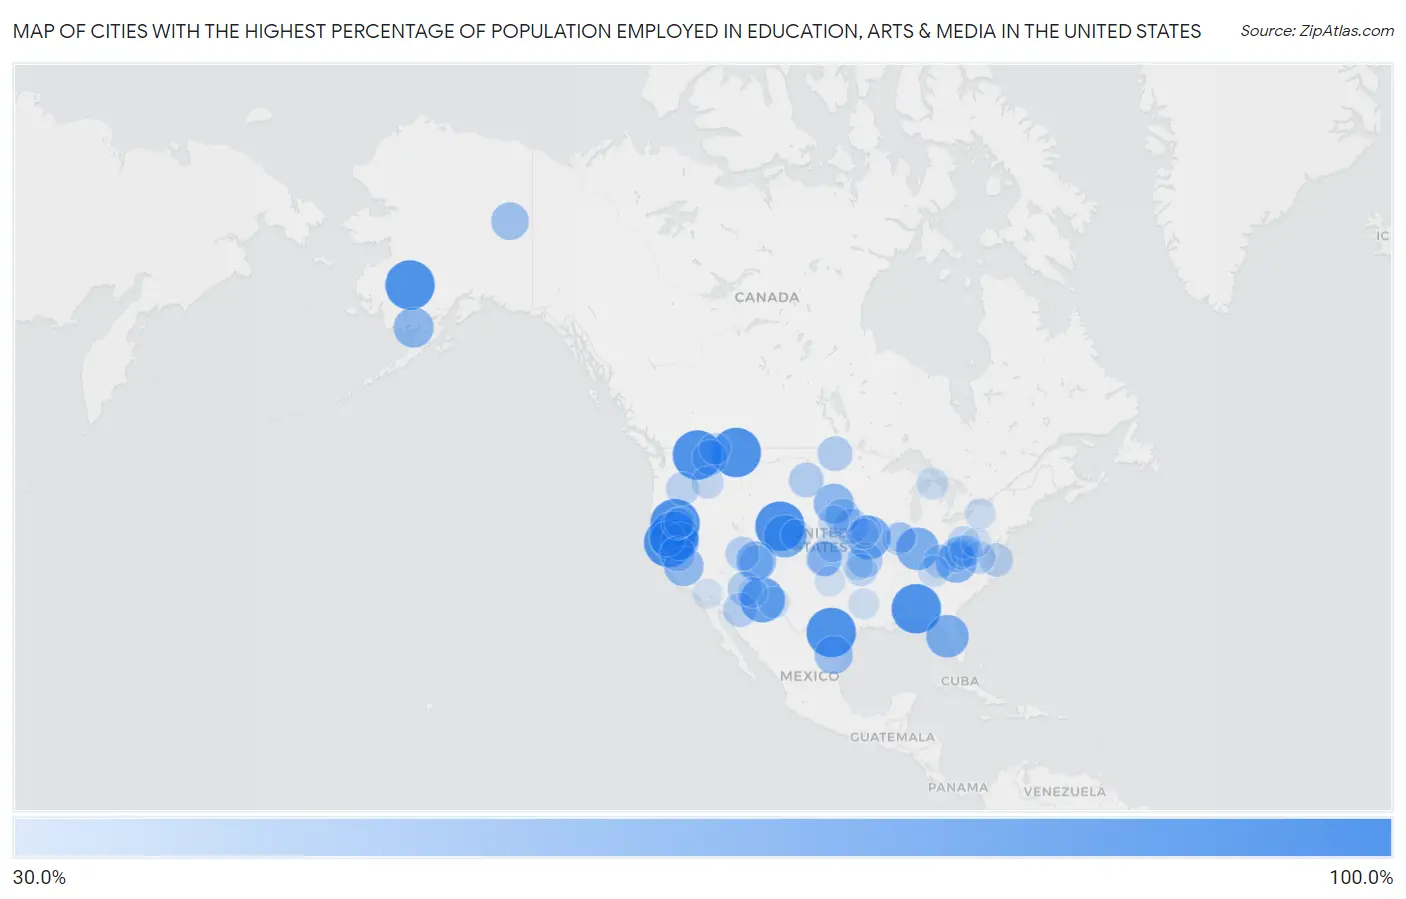
Map of Cities with the Highest Percentage of Population Employed in Education, Arts & Media in the United States
0.0%
100.0%
Cities with the Highest Percentage of Population Employed in Education, Arts & Media in the United States
| City | % Employed | vs State | vs National | |
| 1. | Canby | 100.0% | 1.7%(+98.3)#1 | 1.8%(+98.2)#1 |
| 2. | Richvale | 100.0% | 1.7%(+98.3)#2 | 1.8%(+98.2)#2 |
| 3. | Moore | 100.0% | 1.5%(+98.5)#1 | 1.8%(+98.2)#3 |
| 4. | Buchanan | 100.0% | 1.7%(+98.3)#1 | 1.8%(+98.2)#4 |
| 5. | Little Browning | 100.0% | 2.0%(+98.0)#1 | 1.8%(+98.2)#5 |
| 6. | Vanderwagen | 100.0% | 2.0%(+98.0)#1 | 1.8%(+98.2)#6 |
| 7. | Cameron Colony | 100.0% | 1.8%(+98.2)#1 | 1.8%(+98.2)#7 |
| 8. | Spring Lake Colony | 100.0% | 1.8%(+98.2)#2 | 1.8%(+98.2)#8 |
| 9. | Addy | 100.0% | 1.8%(+98.2)#1 | 1.8%(+98.2)#9 |
| 10. | Crooked Creek | 100.0% | 2.1%(+97.9)#1 | 1.8%(+98.2)#10 |
| 11. | Rockport Colony | 100.0% | 1.8%(+98.2)#3 | 1.8%(+98.2)#11 |
| 12. | Oak Hill | 100.0% | 1.7%(+98.3)#1 | 1.8%(+98.2)#12 |
| 13. | Albany | 100.0% | 1.8%(+98.2)#1 | 1.8%(+98.2)#13 |
| 14. | Canyondam | 100.0% | 1.7%(+98.3)#3 | 1.8%(+98.2)#14 |
| 15. | Stoneridge | 100.0% | 2.0%(+98.0)#2 | 1.8%(+98.2)#15 |
| 16. | Gila | 84.0% | 2.0%(+82.0)#3 | 1.8%(+82.2)#16 |
| 17. | Chowan Beach | 81.2% | 1.9%(+79.3)#1 | 1.8%(+79.5)#17 |
| 18. | Edinburg | 80.0% | 1.8%(+78.2)#1 | 1.8%(+78.2)#18 |
| 19. | Groverton | 77.8% | 1.8%(+76.0)#1 | 1.8%(+76.0)#19 |
| 20. | Barksdale | 75.9% | 1.5%(+74.4)#2 | 1.8%(+74.1)#20 |
| 21. | Burns City | 75.6% | 1.8%(+73.8)#2 | 1.8%(+73.8)#21 |
| 22. | Pine Island | 75.4% | 1.4%(+74.0)#1 | 1.8%(+73.7)#22 |
| 23. | Bark Ranch | 75.0% | 1.8%(+73.2)#1 | 1.8%(+73.2)#23 |
| 24. | Hansford | 69.8% | 2.1%(+67.6)#1 | 1.8%(+68.0)#24 |
| 25. | Maybeury | 68.3% | 2.1%(+66.2)#2 | 1.8%(+66.5)#25 |
| 26. | Kalapana | 66.7% | 1.7%(+64.9)#1 | 1.8%(+64.9)#26 |
| 27. | Aurora Center | 66.7% | 1.8%(+64.9)#4 | 1.8%(+64.9)#27 |
| 28. | Portage Creek | 66.7% | 2.1%(+64.6)#2 | 1.8%(+64.9)#28 |
| 29. | White Mesa | 65.4% | 1.5%(+63.9)#1 | 1.8%(+63.6)#29 |
| 30. | Fort Washington | 65.0% | 1.7%(+63.3)#4 | 1.8%(+63.2)#30 |
| 31. | Stone Bluff | 63.8% | 1.8%(+62.0)#3 | 1.8%(+62.0)#31 |
| 32. | Shelbyville | 60.2% | 1.5%(+58.7)#3 | 1.8%(+58.4)#32 |
| 33. | La Paloma Ranchettes | 60.0% | 1.5%(+58.5)#4 | 1.8%(+58.2)#33 |
| 34. | Sierra Brooks | 59.1% | 1.7%(+57.4)#5 | 1.8%(+57.3)#34 |
| 35. | Circle | 58.3% | 2.1%(+56.2)#3 | 1.8%(+56.5)#35 |
| 36. | Caesars Head | 53.8% | 1.8%(+52.1)#1 | 1.8%(+52.1)#36 |
| 37. | Vina | 50.4% | 1.7%(+48.7)#6 | 1.8%(+48.6)#37 |
| 38. | Boys Town | 50.0% | 1.8%(+48.2)#1 | 1.8%(+48.2)#38 |
| 39. | Heron | 50.0% | 2.0%(+48.0)#2 | 1.8%(+48.2)#39 |
| 40. | Mountain Ranch | 50.0% | 1.7%(+48.3)#7 | 1.8%(+48.2)#40 |
| 41. | Fort Dodge | 50.0% | 1.8%(+48.2)#1 | 1.8%(+48.2)#41 |
| 42. | Sholes | 50.0% | 1.8%(+48.2)#2 | 1.8%(+48.2)#42 |
| 43. | Milford | 50.0% | 1.8%(+48.2)#2 | 1.8%(+48.2)#43 |
| 44. | Mershon | 50.0% | 1.5%(+48.5)#1 | 1.8%(+48.2)#44 |
| 45. | Morrow | 49.1% | 1.8%(+47.3)#1 | 1.8%(+47.3)#45 |
| 46. | Big Lake | 48.7% | 1.8%(+46.9)#4 | 1.8%(+46.9)#46 |
| 47. | Edmore | 48.7% | 1.8%(+46.9)#1 | 1.8%(+46.9)#47 |
| 48. | Bluff | 48.1% | 1.5%(+46.7)#2 | 1.8%(+46.4)#48 |
| 49. | Christopher Creek | 48.1% | 1.7%(+46.5)#1 | 1.8%(+46.4)#49 |
| 50. | Haynes | 48.0% | 1.8%(+46.2)#2 | 1.8%(+46.2)#50 |
| 51. | Wright | 47.1% | 1.8%(+45.2)#2 | 1.8%(+45.3)#51 |
| 52. | Powellton | 46.9% | 2.1%(+44.8)#3 | 1.8%(+45.1)#52 |
| 53. | Topawa | 46.3% | 1.7%(+44.6)#2 | 1.8%(+44.5)#53 |
| 54. | St. Joseph | 46.2% | 2.0%(+44.1)#1 | 1.8%(+44.4)#54 |
| 55. | Teasdale | 45.9% | 1.5%(+44.4)#3 | 1.8%(+44.1)#55 |
| 56. | Tioga | 45.2% | 2.1%(+43.0)#4 | 1.8%(+43.4)#56 |
| 57. | Elizaville | 44.4% | 1.8%(+42.7)#5 | 1.8%(+42.7)#57 |
| 58. | Golden View Colony | 44.2% | 1.8%(+42.4)#5 | 1.8%(+42.4)#58 |
| 59. | Timberlake | 43.8% | 2.0%(+41.7)#4 | 1.8%(+42.0)#59 |
| 60. | Pungoteague | 43.8% | 1.9%(+41.9)#1 | 1.8%(+42.0)#60 |
| 61. | Booneville | 43.4% | 2.0%(+41.3)#2 | 1.8%(+41.6)#61 |
| 62. | Lybrook | 42.9% | 2.0%(+40.9)#5 | 1.8%(+41.1)#62 |
| 63. | Lonerock | 42.9% | 2.1%(+40.7)#1 | 1.8%(+41.1)#63 |
| 64. | Cornland | 42.5% | 1.7%(+40.8)#1 | 1.8%(+40.7)#64 |
| 65. | Pocahontas | 42.3% | 1.7%(+40.6)#2 | 1.8%(+40.5)#65 |
| 66. | Palmyra | 41.6% | 1.9%(+39.7)#2 | 1.8%(+39.8)#66 |
| 67. | Cape May Point Borough | 41.3% | 1.8%(+39.5)#1 | 1.8%(+39.5)#67 |
| 68. | Idamay | 40.8% | 2.1%(+38.7)#5 | 1.8%(+39.0)#68 |
| 69. | Brush Creek | 40.2% | 1.9%(+38.3)#1 | 1.8%(+38.4)#69 |
| 70. | Waldo | 40.0% | 1.8%(+38.2)#3 | 1.8%(+38.2)#70 |
| 71. | White Bird | 40.0% | 1.8%(+38.2)#1 | 1.8%(+38.2)#71 |
| 72. | Valley Head | 40.0% | 2.1%(+37.9)#6 | 1.8%(+38.2)#72 |
| 73. | Caney Ridge | 38.5% | 1.9%(+36.5)#2 | 1.8%(+36.7)#73 |
| 74. | Roadstown | 38.0% | 1.8%(+36.3)#2 | 1.8%(+36.2)#74 |
| 75. | Daphnedale Park | 37.7% | 1.7%(+36.0)#8 | 1.8%(+35.9)#75 |
| 76. | West Kootenai | 37.7% | 2.0%(+35.7)#3 | 1.8%(+35.9)#76 |
| 77. | Robbins | 37.5% | 1.7%(+35.8)#3 | 1.8%(+35.7)#77 |
| 78. | Levering | 37.5% | 1.7%(+35.8)#1 | 1.8%(+35.7)#78 |
| 79. | Skene | 37.1% | 1.8%(+35.3)#1 | 1.8%(+35.4)#79 |
| 80. | Ericson | 37.0% | 1.8%(+35.2)#3 | 1.8%(+35.2)#80 |
| 81. | Rodey | 36.9% | 2.0%(+34.9)#6 | 1.8%(+35.1)#81 |
| 82. | Leopold | 36.4% | 1.8%(+34.6)#6 | 1.8%(+34.6)#82 |
| 83. | Metz | 36.0% | 1.8%(+34.2)#7 | 1.8%(+34.2)#83 |
| 84. | Bartlett | 35.5% | 1.8%(+33.7)#4 | 1.8%(+33.7)#84 |
| 85. | Scipio | 35.5% | 1.9%(+33.6)#3 | 1.8%(+33.7)#85 |
| 86. | Trail Side | 35.4% | 1.8%(+33.6)#2 | 1.8%(+33.6)#86 |
| 87. | Hunt | 35.0% | 2.2%(+32.8)#1 | 1.8%(+33.2)#87 |
| 88. | Lake City | 35.0% | 1.7%(+33.3)#9 | 1.8%(+33.2)#88 |
| 89. | Nesbitt | 34.6% | 1.5%(+33.1)#5 | 1.8%(+32.8)#89 |
| 90. | Enterprise | 33.9% | 1.9%(+32.0)#4 | 1.8%(+32.1)#90 |
| 91. | Rainbow City | 33.9% | 1.7%(+32.2)#3 | 1.8%(+32.1)#91 |
| 92. | Cementon | 33.8% | 2.2%(+31.6)#2 | 1.8%(+32.0)#92 |
| 93. | Chestnut | 33.8% | 1.7%(+32.0)#2 | 1.8%(+32.0)#93 |
| 94. | Ellston | 33.3% | 1.6%(+31.7)#1 | 1.8%(+31.5)#94 |
| 95. | Denver | 33.3% | 1.8%(+31.5)#3 | 1.8%(+31.5)#95 |
| 96. | Sentinel | 33.0% | 1.9%(+31.1)#5 | 1.8%(+31.2)#96 |
| 97. | Wheeler | 33.0% | 1.8%(+31.2)#2 | 1.8%(+31.2)#97 |
| 98. | Spring Creek Colony | 32.9% | 1.8%(+31.1)#6 | 1.8%(+31.1)#98 |
| 99. | Desert Palms | 32.6% | 1.7%(+30.8)#10 | 1.8%(+30.8)#99 |
| 100. | Oldtown | 32.4% | 1.9%(+30.5)#1 | 1.8%(+30.6)#100 |
Common Questions
What are the Top 10 Cities with the Highest Percentage of Population Employed in Education, Arts & Media in the United States?
Top 10 Cities with the Highest Percentage of Population Employed in Education, Arts & Media in the United States are:
What city has the Highest Percentage of Population Employed in Education, Arts & Media in the United States?
Canby has the Highest Percentage of Population Employed in Education, Arts & Media in the United States with 100.0%.
What is the Percentage of Population Employed in Education, Arts & Media in the United States?
Percentage of Population Employed in Education, Arts & Media in the United States is 1.8%.