Greenville County, SC Map & Demographics
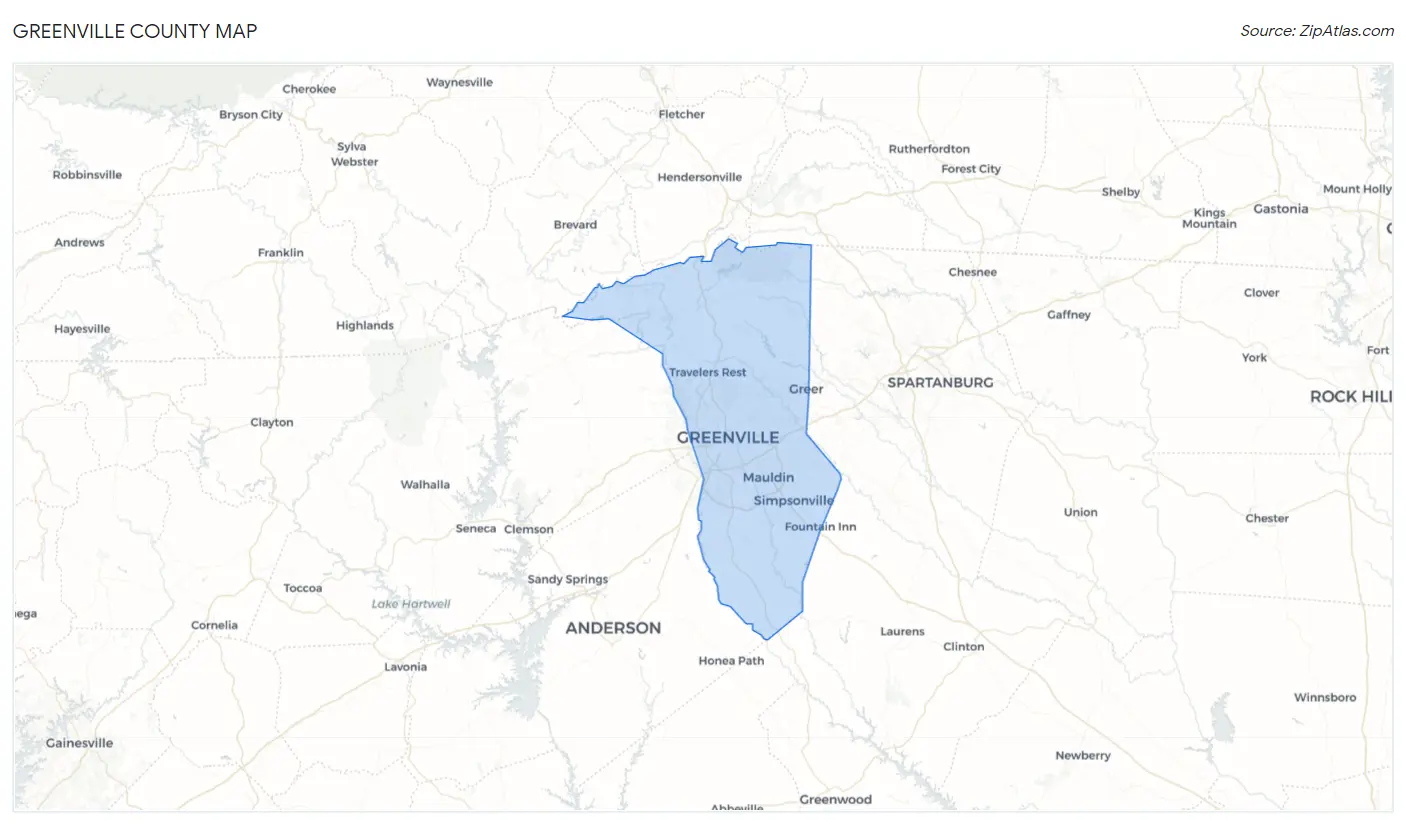
Greenville County Map
Greenville County Overview
$40,427
PER CAPITA INCOME
$88,767
AVG FAMILY INCOME
$71,328
AVG HOUSEHOLD INCOME
30.9%
WAGE / INCOME GAP [ % ]
69.1¢/ $1
WAGE / INCOME GAP [ $ ]
$11,206
FAMILY INCOME DEFICIT
0.47
INEQUALITY / GINI INDEX
528,251
TOTAL POPULATION
257,714
MALE POPULATION
270,537
FEMALE POPULATION
95.26
MALES / 100 FEMALES
104.98
FEMALES / 100 MALES
38.5
MEDIAN AGE
3.0
AVG FAMILY SIZE
2.5
AVG HOUSEHOLD SIZE
273,820
LABOR FORCE [ PEOPLE ]
64.9%
PERCENT IN LABOR FORCE
4.1%
UNEMPLOYMENT RATE
Greenville County Area Codes
Income in Greenville County
Income Overview in Greenville County
Per Capita Income in Greenville County is $40,427, while median incomes of families and households are $88,767 and $71,328 respectively.
| Characteristic | Number | Measure |
| Per Capita Income | 528,251 | $40,427 |
| Median Family Income | 137,947 | $88,767 |
| Mean Family Income | 137,947 | $118,524 |
| Median Household Income | 210,349 | $71,328 |
| Mean Household Income | 210,349 | $99,692 |
| Income Deficit | 137,947 | $11,206 |
| Wage / Income Gap (%) | 528,251 | 30.95% |
| Wage / Income Gap ($) | 528,251 | 69.05¢ per $1 |
| Gini / Inequality Index | 528,251 | 0.47 |
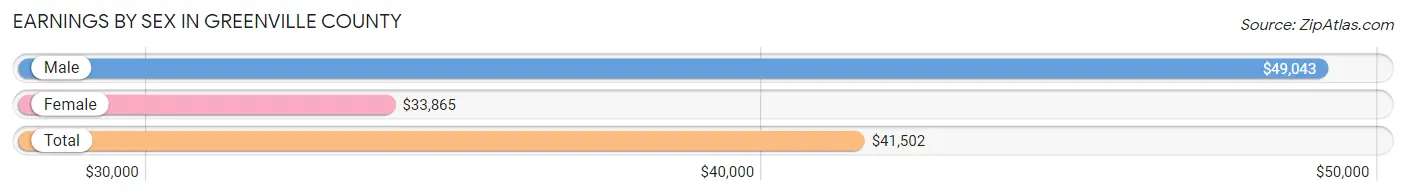
Earnings by Sex in Greenville County
Average Earnings in Greenville County are $41,502, $49,043 for men and $33,865 for women, a difference of 30.9%.
| Sex | Number | Average Earnings |
| Male | 150,414 (52.5%) | $49,043 |
| Female | 136,038 (47.5%) | $33,865 |
| Total | 286,452 (100.0%) | $41,502 |
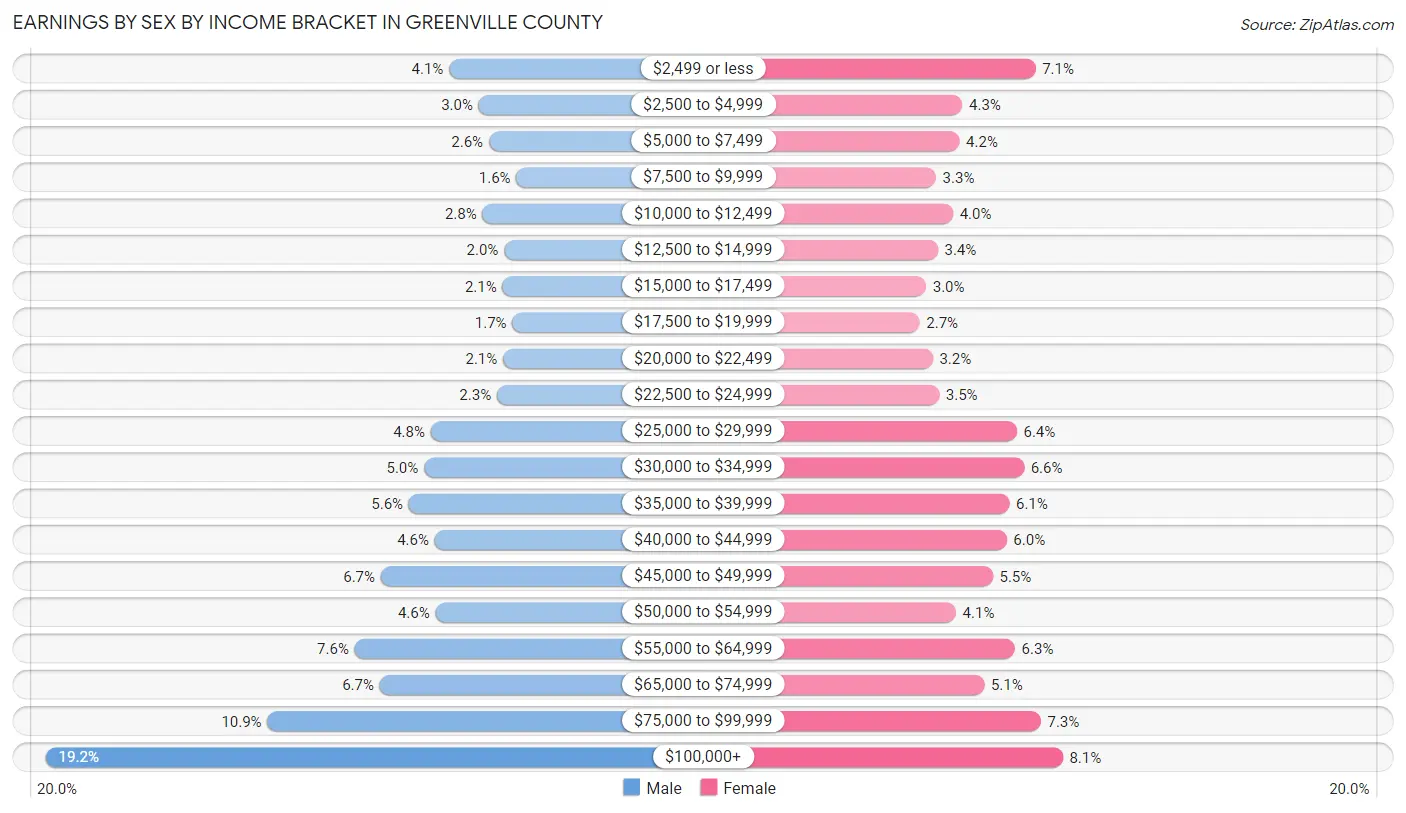
Earnings by Sex by Income Bracket in Greenville County
The most common earnings brackets in Greenville County are $100,000+ for men (28,888 | 19.2%) and $100,000+ for women (10,995 | 8.1%).
| Income | Male | Female |
| $2,499 or less | 6,153 (4.1%) | 9,604 (7.1%) |
| $2,500 to $4,999 | 4,487 (3.0%) | 5,876 (4.3%) |
| $5,000 to $7,499 | 3,908 (2.6%) | 5,730 (4.2%) |
| $7,500 to $9,999 | 2,360 (1.6%) | 4,535 (3.3%) |
| $10,000 to $12,499 | 4,265 (2.8%) | 5,400 (4.0%) |
| $12,500 to $14,999 | 3,055 (2.0%) | 4,619 (3.4%) |
| $15,000 to $17,499 | 3,145 (2.1%) | 4,028 (3.0%) |
| $17,500 to $19,999 | 2,587 (1.7%) | 3,699 (2.7%) |
| $20,000 to $22,499 | 3,112 (2.1%) | 4,372 (3.2%) |
| $22,500 to $24,999 | 3,465 (2.3%) | 4,698 (3.5%) |
| $25,000 to $29,999 | 7,183 (4.8%) | 8,647 (6.4%) |
| $30,000 to $34,999 | 7,561 (5.0%) | 9,013 (6.6%) |
| $35,000 to $39,999 | 8,429 (5.6%) | 8,276 (6.1%) |
| $40,000 to $44,999 | 6,965 (4.6%) | 8,130 (6.0%) |
| $45,000 to $49,999 | 10,004 (6.7%) | 7,434 (5.5%) |
| $50,000 to $54,999 | 6,919 (4.6%) | 5,555 (4.1%) |
| $55,000 to $64,999 | 11,477 (7.6%) | 8,561 (6.3%) |
| $65,000 to $74,999 | 10,057 (6.7%) | 6,990 (5.1%) |
| $75,000 to $99,999 | 16,394 (10.9%) | 9,876 (7.3%) |
| $100,000+ | 28,888 (19.2%) | 10,995 (8.1%) |
| Total | 150,414 (100.0%) | 136,038 (100.0%) |
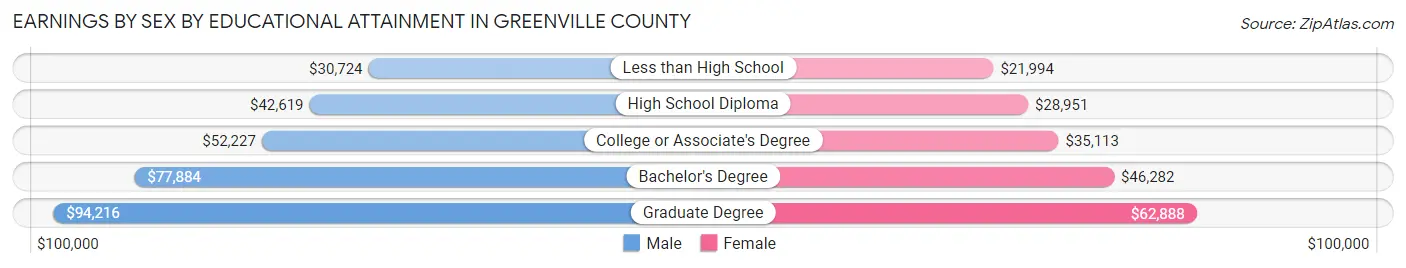
Earnings by Sex by Educational Attainment in Greenville County
Average earnings in Greenville County are $55,915 for men and $39,110 for women, a difference of 30.0%. Men with an educational attainment of graduate degree enjoy the highest average annual earnings of $94,216, while those with less than high school education earn the least with $30,724. Women with an educational attainment of graduate degree earn the most with the average annual earnings of $62,888, while those with less than high school education have the smallest earnings of $21,994.
| Educational Attainment | Male Income | Female Income |
| Less than High School | $30,724 | $21,994 |
| High School Diploma | $42,619 | $28,951 |
| College or Associate's Degree | $52,227 | $35,113 |
| Bachelor's Degree | $77,884 | $46,282 |
| Graduate Degree | $94,216 | $62,888 |
| Total | $55,915 | $39,110 |
Family Income in Greenville County
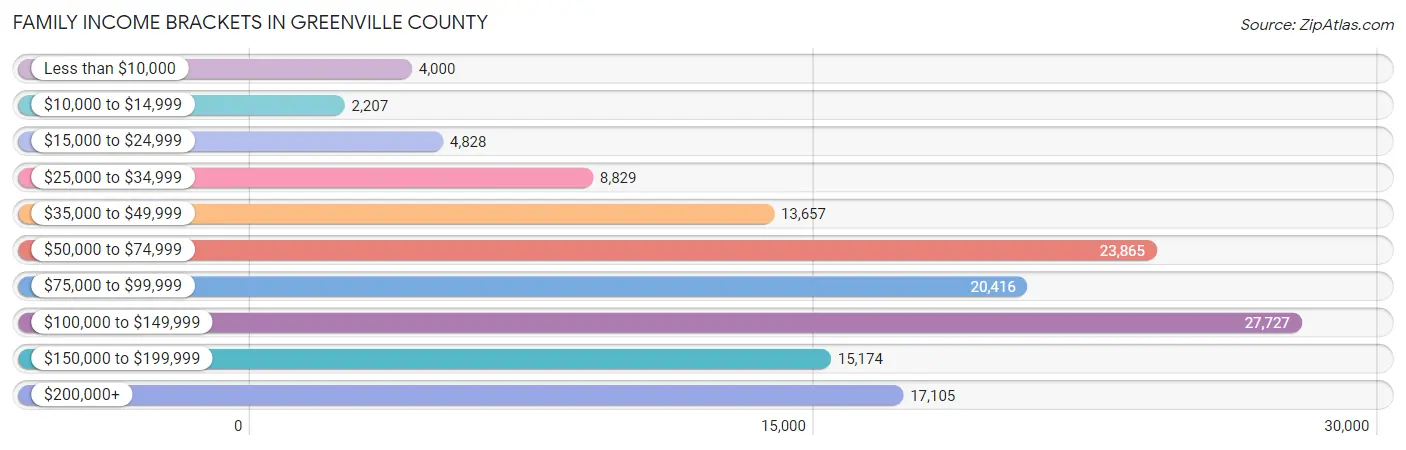
Family Income Brackets in Greenville County
According to the Greenville County family income data, there are 27,727 families falling into the $100,000 to $149,999 income range, which is the most common income bracket and makes up 20.1% of all families. Conversely, the $10,000 to $14,999 income bracket is the least frequent group with only 2,207 families (1.6%) belonging to this category.
| Income Bracket | # Families | % Families |
| Less than $10,000 | 4,000 | 2.9% |
| $10,000 to $14,999 | 2,207 | 1.6% |
| $15,000 to $24,999 | 4,828 | 3.5% |
| $25,000 to $34,999 | 8,829 | 6.4% |
| $35,000 to $49,999 | 13,657 | 9.9% |
| $50,000 to $74,999 | 23,865 | 17.3% |
| $75,000 to $99,999 | 20,416 | 14.8% |
| $100,000 to $149,999 | 27,727 | 20.1% |
| $150,000 to $199,999 | 15,174 | 11.0% |
| $200,000+ | 17,105 | 12.4% |
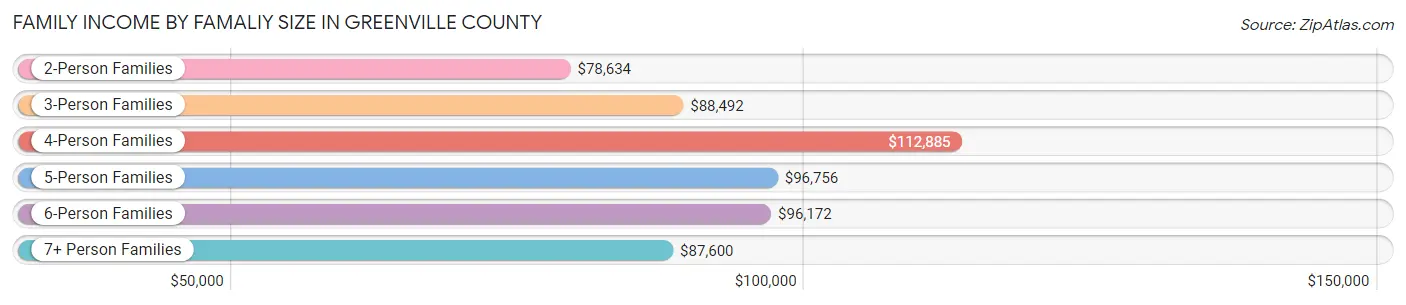
Family Income by Famaliy Size in Greenville County
4-person families (25,290 | 18.3%) account for the highest median family income in Greenville County with $112,885 per family, while 2-person families (67,075 | 48.6%) have the highest median income of $39,317 per family member.
| Income Bracket | # Families | Median Income |
| 2-Person Families | 67,075 (48.6%) | $78,634 |
| 3-Person Families | 29,659 (21.5%) | $88,492 |
| 4-Person Families | 25,290 (18.3%) | $112,885 |
| 5-Person Families | 11,010 (8.0%) | $96,756 |
| 6-Person Families | 3,371 (2.4%) | $96,172 |
| 7+ Person Families | 1,542 (1.1%) | $87,600 |
| Total | 137,947 (100.0%) | $88,767 |
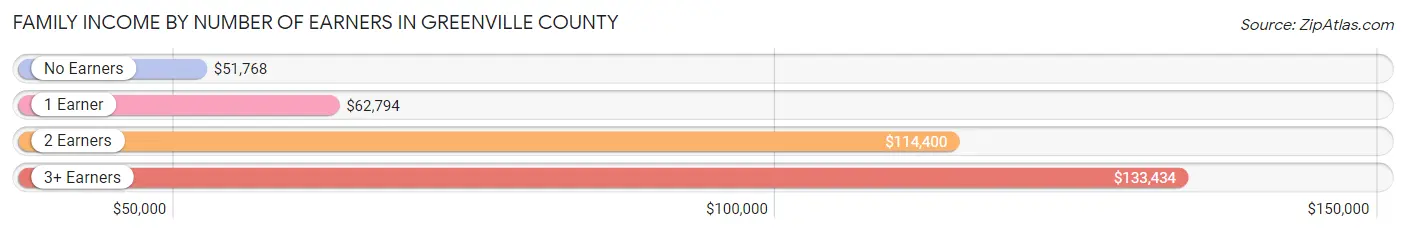
Family Income by Number of Earners in Greenville County
The median family income in Greenville County is $88,767, with families comprising 3+ earners (13,808) having the highest median family income of $133,434, while families with no earners (19,483) have the lowest median family income of $51,768, accounting for 10.0% and 14.1% of families, respectively.
| Number of Earners | # Families | Median Income |
| No Earners | 19,483 (14.1%) | $51,768 |
| 1 Earner | 46,305 (33.6%) | $62,794 |
| 2 Earners | 58,351 (42.3%) | $114,400 |
| 3+ Earners | 13,808 (10.0%) | $133,434 |
| Total | 137,947 (100.0%) | $88,767 |
Household Income in Greenville County
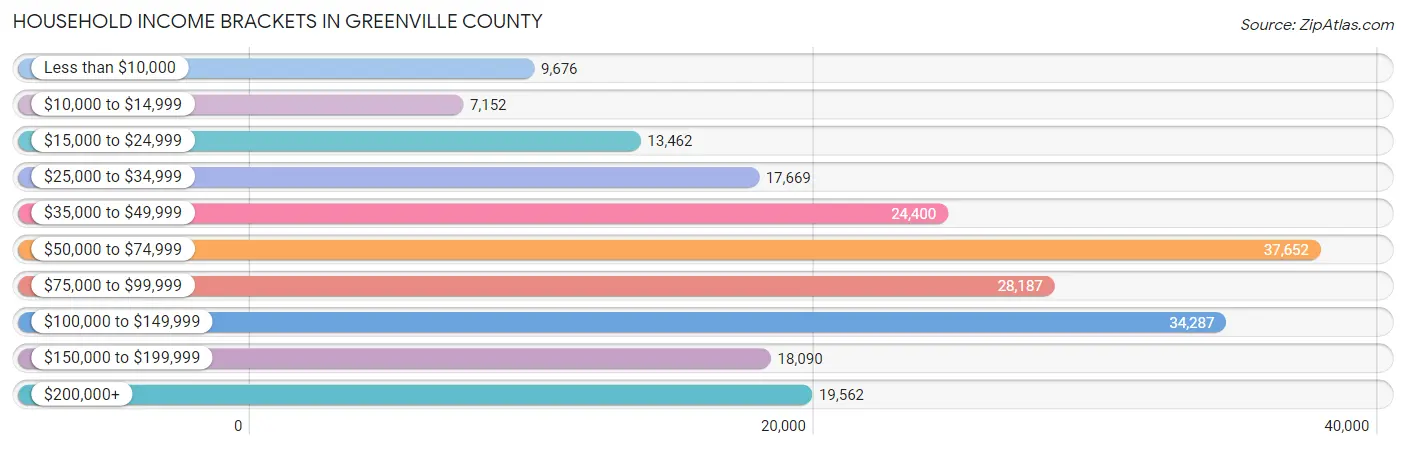
Household Income Brackets in Greenville County
With 37,652 households falling in the category, the $50,000 to $74,999 income range is the most frequent in Greenville County, accounting for 17.9% of all households. In contrast, only 7,152 households (3.4%) fall into the $10,000 to $14,999 income bracket, making it the least populous group.
| Income Bracket | # Households | % Households |
| Less than $10,000 | 9,676 | 4.6% |
| $10,000 to $14,999 | 7,152 | 3.4% |
| $15,000 to $24,999 | 13,462 | 6.4% |
| $25,000 to $34,999 | 17,669 | 8.4% |
| $35,000 to $49,999 | 24,400 | 11.6% |
| $50,000 to $74,999 | 37,652 | 17.9% |
| $75,000 to $99,999 | 28,187 | 13.4% |
| $100,000 to $149,999 | 34,287 | 16.3% |
| $150,000 to $199,999 | 18,090 | 8.6% |
| $200,000+ | 19,562 | 9.3% |
Household Income by Householder Age in Greenville County
The median household income in Greenville County is $71,328, with the highest median household income of $83,270 found in the 45 to 64 years age bracket for the primary householder. A total of 77,103 households (36.6%) fall into this category. Meanwhile, the 15 to 24 years age bracket for the primary householder has the lowest median household income of $44,235, with 8,228 households (3.9%) in this group.
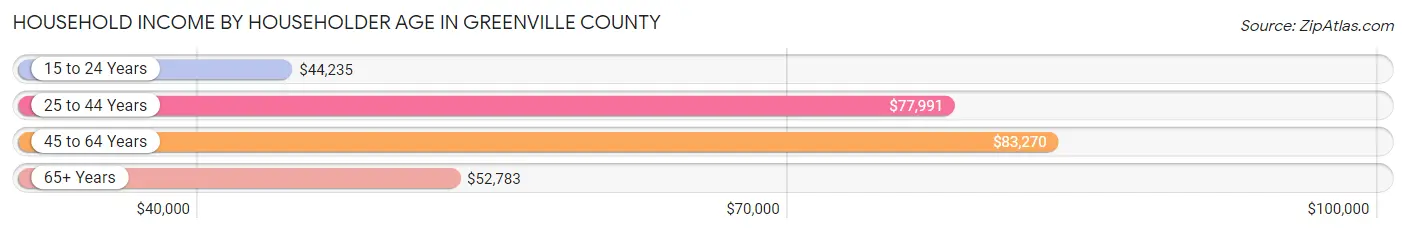
| Income Bracket | # Households | Median Income |
| 15 to 24 Years | 8,228 (3.9%) | $44,235 |
| 25 to 44 Years | 72,234 (34.3%) | $77,991 |
| 45 to 64 Years | 77,103 (36.6%) | $83,270 |
| 65+ Years | 52,784 (25.1%) | $52,783 |
| Total | 210,349 (100.0%) | $71,328 |
Poverty in Greenville County
Income Below Poverty by Sex and Age in Greenville County
With 9.5% poverty level for males and 12.3% for females among the residents of Greenville County, 5 year old males and 18 to 24 year old females are the most vulnerable to poverty, with 741 males (21.8%) and 3,535 females (17.9%) in their respective age groups living below the poverty level.
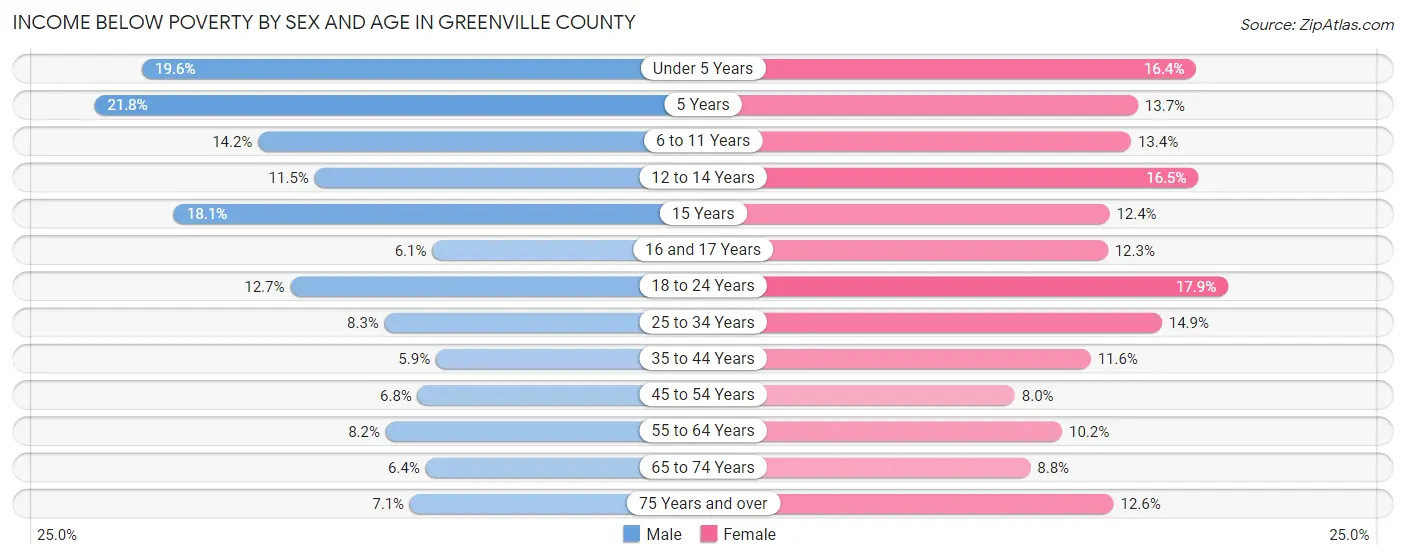
| Age Bracket | Male | Female |
| Under 5 Years | 3,155 (19.6%) | 2,476 (16.4%) |
| 5 Years | 741 (21.8%) | 414 (13.7%) |
| 6 to 11 Years | 2,793 (14.2%) | 2,744 (13.4%) |
| 12 to 14 Years | 1,290 (11.5%) | 1,586 (16.5%) |
| 15 Years | 599 (18.1%) | 369 (12.4%) |
| 16 and 17 Years | 422 (6.1%) | 880 (12.3%) |
| 18 to 24 Years | 2,510 (12.7%) | 3,535 (17.9%) |
| 25 to 34 Years | 2,953 (8.3%) | 5,480 (14.8%) |
| 35 to 44 Years | 1,979 (5.9%) | 3,991 (11.6%) |
| 45 to 54 Years | 2,205 (6.8%) | 2,715 (8.0%) |
| 55 to 64 Years | 2,608 (8.2%) | 3,501 (10.2%) |
| 65 to 74 Years | 1,491 (6.4%) | 2,412 (8.7%) |
| 75 Years and over | 989 (7.1%) | 2,466 (12.6%) |
| Total | 23,735 (9.5%) | 32,569 (12.3%) |
Income Above Poverty by Sex and Age in Greenville County
According to the poverty statistics in Greenville County, males aged 35 to 44 years and females aged 45 to 54 years are the age groups that are most secure financially, with 94.1% of males and 92.0% of females in these age groups living above the poverty line.
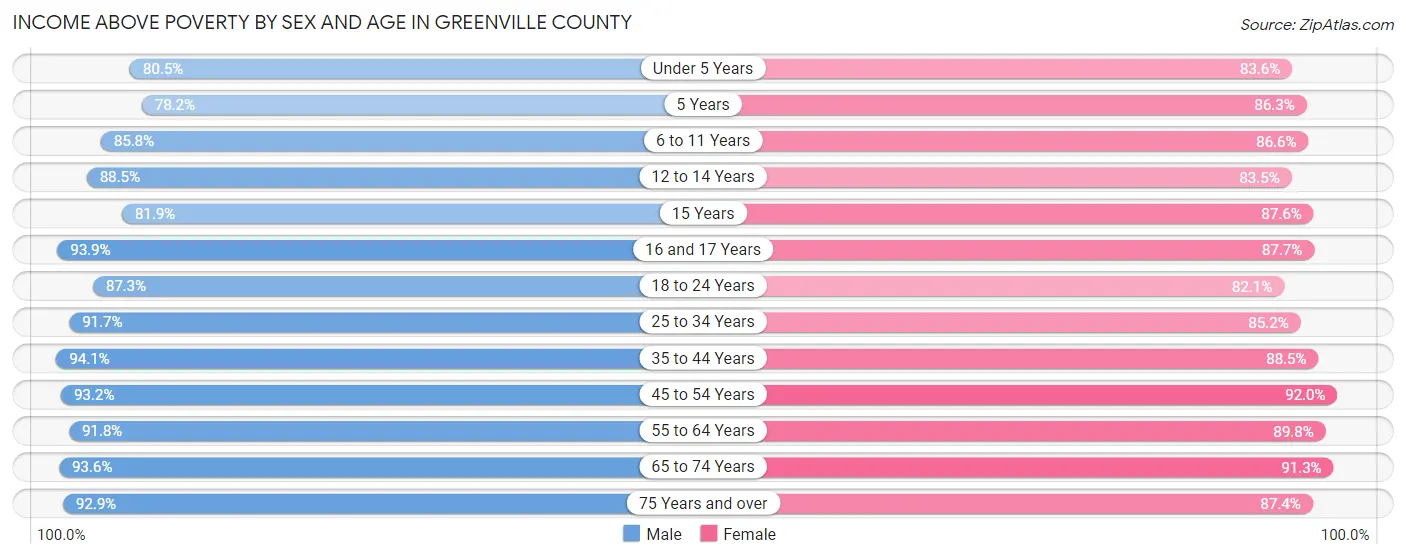
| Age Bracket | Male | Female |
| Under 5 Years | 12,983 (80.4%) | 12,583 (83.6%) |
| 5 Years | 2,664 (78.2%) | 2,600 (86.3%) |
| 6 to 11 Years | 16,935 (85.8%) | 17,696 (86.6%) |
| 12 to 14 Years | 9,884 (88.5%) | 8,005 (83.5%) |
| 15 Years | 2,716 (81.9%) | 2,602 (87.6%) |
| 16 and 17 Years | 6,520 (93.9%) | 6,252 (87.7%) |
| 18 to 24 Years | 17,308 (87.3%) | 16,187 (82.1%) |
| 25 to 34 Years | 32,669 (91.7%) | 31,431 (85.2%) |
| 35 to 44 Years | 31,499 (94.1%) | 30,558 (88.4%) |
| 45 to 54 Years | 30,412 (93.2%) | 31,090 (92.0%) |
| 55 to 64 Years | 29,030 (91.8%) | 30,759 (89.8%) |
| 65 to 74 Years | 21,850 (93.6%) | 25,168 (91.2%) |
| 75 Years and over | 12,909 (92.9%) | 17,085 (87.4%) |
| Total | 227,379 (90.5%) | 232,016 (87.7%) |
Income Below Poverty Among Married-Couple Families in Greenville County
The poverty statistics for married-couple families in Greenville County show that 3.2% or 3,295 of the total 101,796 families live below the poverty line. Families with 5 or more children have the highest poverty rate of 30.6%, comprising of 193 families. On the other hand, families with no children have the lowest poverty rate of 2.4%, which includes 1,424 families.
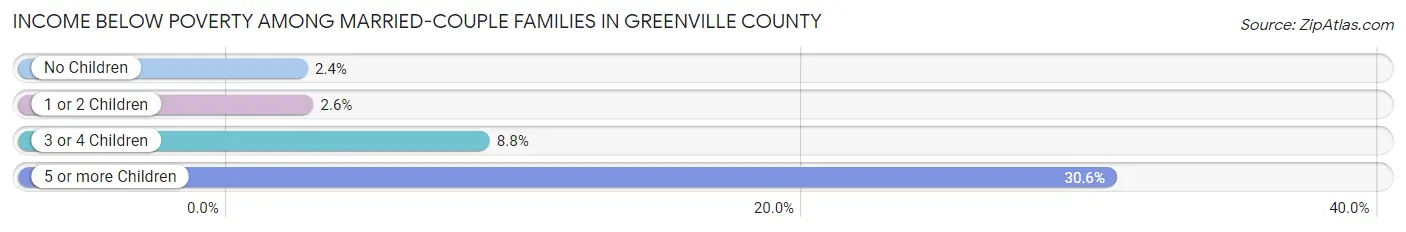
| Children | Above Poverty | Below Poverty |
| No Children | 56,953 (97.6%) | 1,424 (2.4%) |
| 1 or 2 Children | 32,905 (97.4%) | 889 (2.6%) |
| 3 or 4 Children | 8,205 (91.2%) | 789 (8.8%) |
| 5 or more Children | 438 (69.4%) | 193 (30.6%) |
| Total | 98,501 (96.8%) | 3,295 (3.2%) |
Income Below Poverty Among Single-Parent Households in Greenville County
According to the poverty data in Greenville County, 9.0% or 916 single-father households and 25.5% or 6,619 single-mother households are living below the poverty line. Among single-father households, those with 5 or more children have the highest poverty rate, with 24 households (66.7%) experiencing poverty. Likewise, among single-mother households, those with 5 or more children have the highest poverty rate, with 180 households (93.8%) falling below the poverty line.
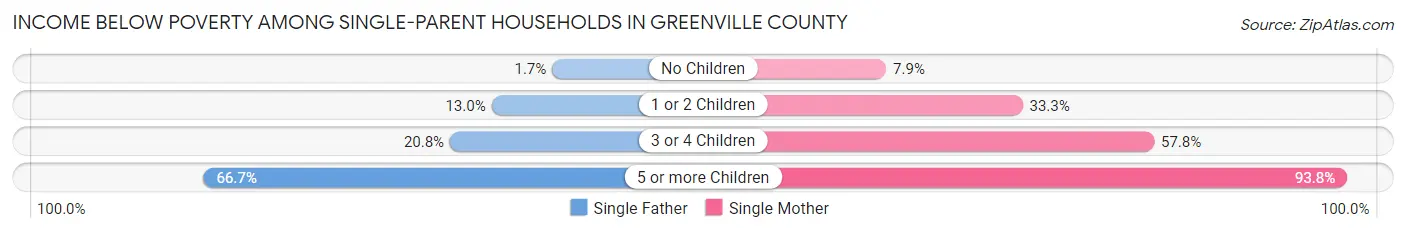
| Children | Single Father | Single Mother |
| No Children | 76 (1.7%) | 849 (7.9%) |
| 1 or 2 Children | 654 (13.0%) | 4,217 (33.3%) |
| 3 or 4 Children | 162 (20.8%) | 1,373 (57.8%) |
| 5 or more Children | 24 (66.7%) | 180 (93.8%) |
| Total | 916 (9.0%) | 6,619 (25.5%) |
Income Below Poverty Among Married-Couple vs Single-Parent Households in Greenville County
The poverty data for Greenville County shows that 3,295 of the married-couple family households (3.2%) and 7,535 of the single-parent households (20.8%) are living below the poverty level. Within the married-couple family households, those with 5 or more children have the highest poverty rate, with 193 households (30.6%) falling below the poverty line. Among the single-parent households, those with 5 or more children have the highest poverty rate, with 204 household (89.5%) living below poverty.

| Children | Married-Couple Families | Single-Parent Households |
| No Children | 1,424 (2.4%) | 925 (6.1%) |
| 1 or 2 Children | 889 (2.6%) | 4,871 (27.6%) |
| 3 or 4 Children | 789 (8.8%) | 1,535 (48.6%) |
| 5 or more Children | 193 (30.6%) | 204 (89.5%) |
| Total | 3,295 (3.2%) | 7,535 (20.8%) |
Race in Greenville County
The most populous races in Greenville County are White / Caucasian (368,154 | 69.7%), Black / African American (90,975 | 17.2%), and Hispanic or Latino (52,135 | 9.9%).
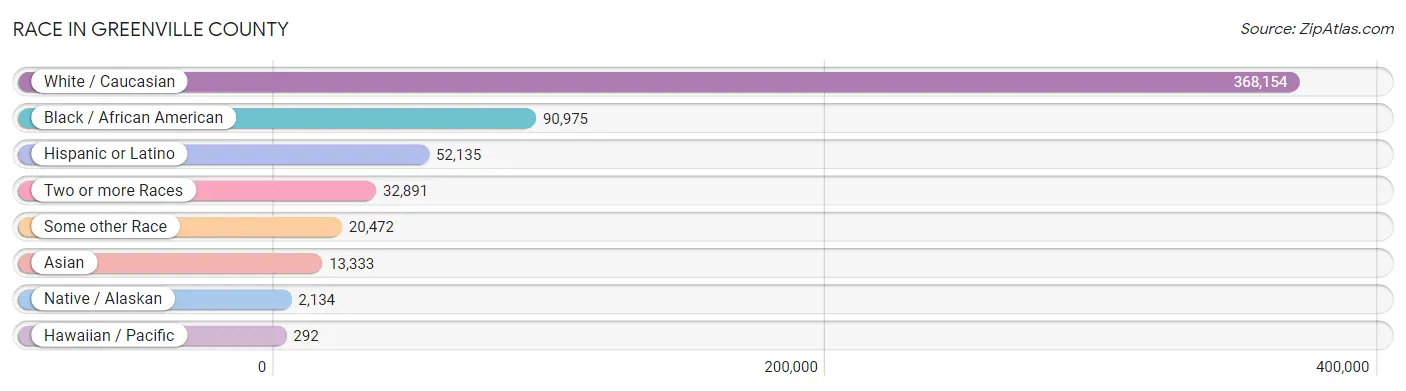
| Race | # Population | % Population |
| Asian | 13,333 | 2.5% |
| Black / African American | 90,975 | 17.2% |
| Hawaiian / Pacific | 292 | 0.1% |
| Hispanic or Latino | 52,135 | 9.9% |
| Native / Alaskan | 2,134 | 0.4% |
| White / Caucasian | 368,154 | 69.7% |
| Two or more Races | 32,891 | 6.2% |
| Some other Race | 20,472 | 3.9% |
| Total | 528,251 | 100.0% |
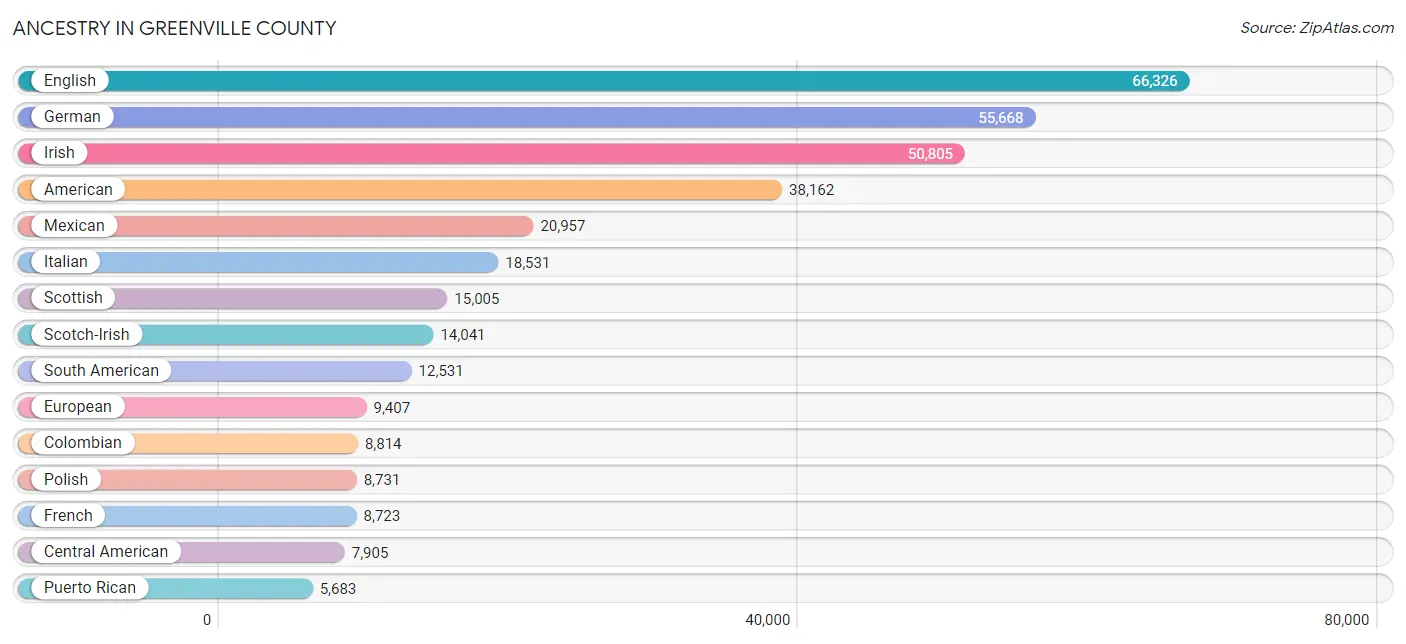
Ancestry in Greenville County
The most populous ancestries reported in Greenville County are English (66,326 | 12.6%), German (55,668 | 10.5%), Irish (50,805 | 9.6%), American (38,162 | 7.2%), and Mexican (20,957 | 4.0%), together accounting for 43.9% of all Greenville County residents.
| Ancestry | # Population | % Population |
| African | 2,389 | 0.4% |
| Albanian | 32 | 0.0% |
| Aleut | 9 | 0.0% |
| Alsatian | 15 | 0.0% |
| American | 38,162 | 7.2% |
| Apache | 15 | 0.0% |
| Arab | 2,046 | 0.4% |
| Argentinean | 267 | 0.1% |
| Armenian | 565 | 0.1% |
| Assyrian / Chaldean / Syriac | 49 | 0.0% |
| Australian | 45 | 0.0% |
| Austrian | 898 | 0.2% |
| Bahamian | 25 | 0.0% |
| Bangladeshi | 26 | 0.0% |
| Barbadian | 9 | 0.0% |
| Basque | 10 | 0.0% |
| Belgian | 321 | 0.1% |
| Belizean | 2 | 0.0% |
| Bermudan | 29 | 0.0% |
| Bhutanese | 1,327 | 0.3% |
| Blackfeet | 133 | 0.0% |
| Bolivian | 22 | 0.0% |
| Brazilian | 485 | 0.1% |
| British | 4,841 | 0.9% |
| British West Indian | 78 | 0.0% |
| Bulgarian | 241 | 0.1% |
| Burmese | 1,413 | 0.3% |
| Cajun | 34 | 0.0% |
| Cambodian | 30 | 0.0% |
| Canadian | 964 | 0.2% |
| Celtic | 11 | 0.0% |
| Central American | 7,905 | 1.5% |
| Central American Indian | 836 | 0.2% |
| Cherokee | 1,151 | 0.2% |
| Chilean | 113 | 0.0% |
| Chippewa | 9 | 0.0% |
| Choctaw | 72 | 0.0% |
| Colombian | 8,814 | 1.7% |
| Comanche | 8 | 0.0% |
| Costa Rican | 372 | 0.1% |
| Cree | 2 | 0.0% |
| Creek | 49 | 0.0% |
| Croatian | 522 | 0.1% |
| Cuban | 1,668 | 0.3% |
| Cypriot | 9 | 0.0% |
| Czech | 1,104 | 0.2% |
| Czechoslovakian | 156 | 0.0% |
| Danish | 884 | 0.2% |
| Delaware | 20 | 0.0% |
| Dominican | 978 | 0.2% |
| Dutch | 4,367 | 0.8% |
| Eastern European | 1,112 | 0.2% |
| Ecuadorian | 607 | 0.1% |
| Egyptian | 218 | 0.0% |
| English | 66,326 | 12.6% |
| Ethiopian | 48 | 0.0% |
| European | 9,407 | 1.8% |
| Filipino | 203 | 0.0% |
| Finnish | 1,307 | 0.3% |
| French | 8,723 | 1.7% |
| French American Indian | 7 | 0.0% |
| French Canadian | 2,406 | 0.5% |
| German | 55,668 | 10.5% |
| Ghanaian | 161 | 0.0% |
| Greek | 2,326 | 0.4% |
| Guamanian / Chamorro | 47 | 0.0% |
| Guatemalan | 2,629 | 0.5% |
| Guyanese | 12 | 0.0% |
| Haitian | 826 | 0.2% |
| Honduran | 3,911 | 0.7% |
| Hungarian | 1,587 | 0.3% |
| Icelander | 4 | 0.0% |
| Indian (Asian) | 2,908 | 0.5% |
| Indonesian | 177 | 0.0% |
| Inupiat | 15 | 0.0% |
| Iranian | 414 | 0.1% |
| Iraqi | 28 | 0.0% |
| Irish | 50,805 | 9.6% |
| Iroquois | 46 | 0.0% |
| Israeli | 156 | 0.0% |
| Italian | 18,531 | 3.5% |
| Jamaican | 914 | 0.2% |
| Japanese | 43 | 0.0% |
| Jordanian | 31 | 0.0% |
| Kenyan | 72 | 0.0% |
| Korean | 2,241 | 0.4% |
| Laotian | 100 | 0.0% |
| Latvian | 314 | 0.1% |
| Lebanese | 962 | 0.2% |
| Liberian | 53 | 0.0% |
| Lithuanian | 590 | 0.1% |
| Lumbee | 69 | 0.0% |
| Luxembourger | 44 | 0.0% |
| Macedonian | 21 | 0.0% |
| Malaysian | 40 | 0.0% |
| Maltese | 19 | 0.0% |
| Mexican | 20,957 | 4.0% |
| Mexican American Indian | 870 | 0.2% |
| Moroccan | 51 | 0.0% |
| Native Hawaiian | 156 | 0.0% |
| Navajo | 71 | 0.0% |
| New Zealander | 23 | 0.0% |
| Nicaraguan | 101 | 0.0% |
| Nigerian | 928 | 0.2% |
| Northern European | 1,531 | 0.3% |
| Norwegian | 3,660 | 0.7% |
| Osage | 40 | 0.0% |
| Pakistani | 410 | 0.1% |
| Palestinian | 84 | 0.0% |
| Panamanian | 120 | 0.0% |
| Paraguayan | 38 | 0.0% |
| Pennsylvania German | 261 | 0.1% |
| Peruvian | 640 | 0.1% |
| Polish | 8,731 | 1.7% |
| Portuguese | 1,332 | 0.3% |
| Potawatomi | 65 | 0.0% |
| Pueblo | 6 | 0.0% |
| Puerto Rican | 5,683 | 1.1% |
| Romanian | 705 | 0.1% |
| Russian | 2,296 | 0.4% |
| Salvadoran | 772 | 0.2% |
| Samoan | 12 | 0.0% |
| Scandinavian | 1,311 | 0.3% |
| Scotch-Irish | 14,041 | 2.7% |
| Scottish | 15,005 | 2.8% |
| Seminole | 12 | 0.0% |
| Senegalese | 42 | 0.0% |
| Serbian | 228 | 0.0% |
| Shoshone | 8 | 0.0% |
| Sioux | 50 | 0.0% |
| Slavic | 200 | 0.0% |
| Slovak | 817 | 0.2% |
| Slovene | 115 | 0.0% |
| Somali | 18 | 0.0% |
| South African | 208 | 0.0% |
| South American | 12,531 | 2.4% |
| South American Indian | 41 | 0.0% |
| Spaniard | 559 | 0.1% |
| Spanish | 258 | 0.1% |
| Spanish American Indian | 3 | 0.0% |
| Sri Lankan | 2,135 | 0.4% |
| Subsaharan African | 3,959 | 0.7% |
| Swedish | 3,971 | 0.7% |
| Swiss | 1,190 | 0.2% |
| Syrian | 207 | 0.0% |
| Thai | 5,361 | 1.0% |
| Tlingit-Haida | 7 | 0.0% |
| Trinidadian and Tobagonian | 201 | 0.0% |
| Turkish | 216 | 0.0% |
| U.S. Virgin Islander | 9 | 0.0% |
| Ugandan | 12 | 0.0% |
| Ukrainian | 946 | 0.2% |
| Uruguayan | 509 | 0.1% |
| Ute | 5 | 0.0% |
| Venezuelan | 1,521 | 0.3% |
| Welsh | 3,829 | 0.7% |
| West Indian | 138 | 0.0% |
| Yugoslavian | 118 | 0.0% |
| Yup'ik | 2 | 0.0% |
| Zimbabwean | 23 | 0.0% | View All 160 Rows |
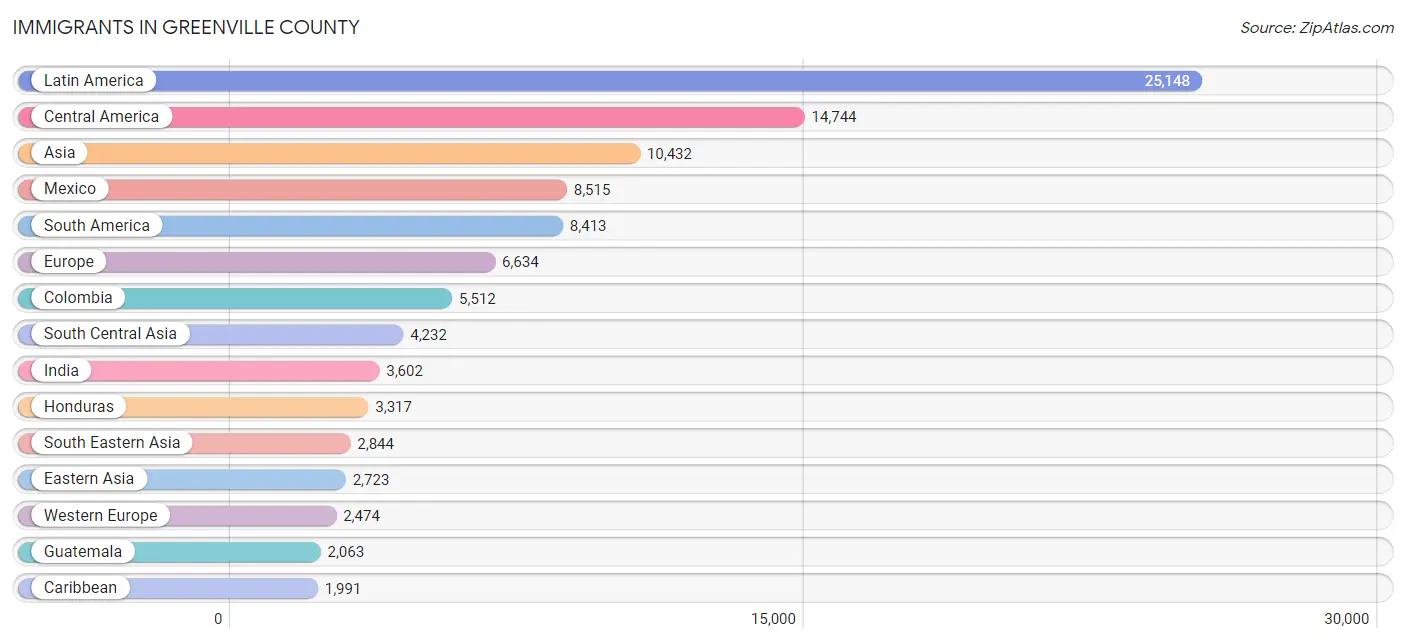
Immigrants in Greenville County
The most numerous immigrant groups reported in Greenville County came from Latin America (25,148 | 4.8%), Central America (14,744 | 2.8%), Asia (10,432 | 2.0%), Mexico (8,515 | 1.6%), and South America (8,413 | 1.6%), together accounting for 12.7% of all Greenville County residents.
| Immigration Origin | # Population | % Population |
| Africa | 1,375 | 0.3% |
| Argentina | 183 | 0.0% |
| Armenia | 3 | 0.0% |
| Asia | 10,432 | 2.0% |
| Australia | 83 | 0.0% |
| Austria | 105 | 0.0% |
| Bahamas | 8 | 0.0% |
| Belgium | 70 | 0.0% |
| Belize | 2 | 0.0% |
| Bolivia | 16 | 0.0% |
| Brazil | 544 | 0.1% |
| Bulgaria | 66 | 0.0% |
| Cambodia | 29 | 0.0% |
| Cameroon | 20 | 0.0% |
| Canada | 1,329 | 0.3% |
| Caribbean | 1,991 | 0.4% |
| Central America | 14,744 | 2.8% |
| Chile | 56 | 0.0% |
| China | 1,424 | 0.3% |
| Colombia | 5,512 | 1.0% |
| Congo | 55 | 0.0% |
| Costa Rica | 194 | 0.0% |
| Croatia | 20 | 0.0% |
| Cuba | 575 | 0.1% |
| Czechoslovakia | 55 | 0.0% |
| Denmark | 51 | 0.0% |
| Dominican Republic | 410 | 0.1% |
| Eastern Africa | 265 | 0.1% |
| Eastern Asia | 2,723 | 0.5% |
| Eastern Europe | 1,714 | 0.3% |
| Ecuador | 332 | 0.1% |
| Egypt | 138 | 0.0% |
| El Salvador | 498 | 0.1% |
| England | 878 | 0.2% |
| Ethiopia | 29 | 0.0% |
| Europe | 6,634 | 1.3% |
| Fiji | 23 | 0.0% |
| France | 379 | 0.1% |
| Germany | 1,761 | 0.3% |
| Ghana | 164 | 0.0% |
| Greece | 212 | 0.0% |
| Grenada | 44 | 0.0% |
| Guatemala | 2,063 | 0.4% |
| Guyana | 18 | 0.0% |
| Haiti | 308 | 0.1% |
| Honduras | 3,317 | 0.6% |
| Hong Kong | 37 | 0.0% |
| Hungary | 27 | 0.0% |
| India | 3,602 | 0.7% |
| Indonesia | 49 | 0.0% |
| Iran | 252 | 0.1% |
| Iraq | 77 | 0.0% |
| Ireland | 68 | 0.0% |
| Israel | 37 | 0.0% |
| Italy | 81 | 0.0% |
| Jamaica | 570 | 0.1% |
| Japan | 398 | 0.1% |
| Jordan | 84 | 0.0% |
| Kazakhstan | 93 | 0.0% |
| Kenya | 42 | 0.0% |
| Korea | 886 | 0.2% |
| Kuwait | 70 | 0.0% |
| Latin America | 25,148 | 4.8% |
| Latvia | 110 | 0.0% |
| Lebanon | 65 | 0.0% |
| Liberia | 9 | 0.0% |
| Malaysia | 9 | 0.0% |
| Mexico | 8,515 | 1.6% |
| Micronesia | 73 | 0.0% |
| Middle Africa | 111 | 0.0% |
| Moldova | 26 | 0.0% |
| Morocco | 25 | 0.0% |
| Netherlands | 65 | 0.0% |
| Nicaragua | 70 | 0.0% |
| Nigeria | 342 | 0.1% |
| North Macedonia | 18 | 0.0% |
| Northern Africa | 191 | 0.0% |
| Northern Europe | 1,884 | 0.4% |
| Norway | 16 | 0.0% |
| Oceania | 213 | 0.0% |
| Pakistan | 273 | 0.1% |
| Panama | 85 | 0.0% |
| Peru | 255 | 0.1% |
| Philippines | 929 | 0.2% |
| Poland | 210 | 0.0% |
| Portugal | 62 | 0.0% |
| Romania | 316 | 0.1% |
| Russia | 536 | 0.1% |
| Saudi Arabia | 11 | 0.0% |
| Scotland | 176 | 0.0% |
| Senegal | 25 | 0.0% |
| Singapore | 13 | 0.0% |
| South Africa | 115 | 0.0% |
| South America | 8,413 | 1.6% |
| South Central Asia | 4,232 | 0.8% |
| South Eastern Asia | 2,844 | 0.5% |
| Southern Europe | 562 | 0.1% |
| Spain | 207 | 0.0% |
| Sri Lanka | 12 | 0.0% |
| Sweden | 64 | 0.0% |
| Switzerland | 82 | 0.0% |
| Syria | 124 | 0.0% |
| Taiwan | 154 | 0.0% |
| Thailand | 332 | 0.1% |
| Trinidad and Tobago | 56 | 0.0% |
| Turkey | 84 | 0.0% |
| Uganda | 16 | 0.0% |
| Ukraine | 264 | 0.1% |
| Uruguay | 267 | 0.1% |
| Venezuela | 1,212 | 0.2% |
| Vietnam | 1,297 | 0.3% |
| Western Africa | 649 | 0.1% |
| Western Asia | 626 | 0.1% |
| Western Europe | 2,474 | 0.5% |
| Zimbabwe | 43 | 0.0% | View All 115 Rows |
Sex and Age in Greenville County
Sex and Age in Greenville County
The most populous age groups in Greenville County are 10 to 14 Years (18,182 | 7.1%) for men and 30 to 34 Years (18,656 | 6.9%) for women.
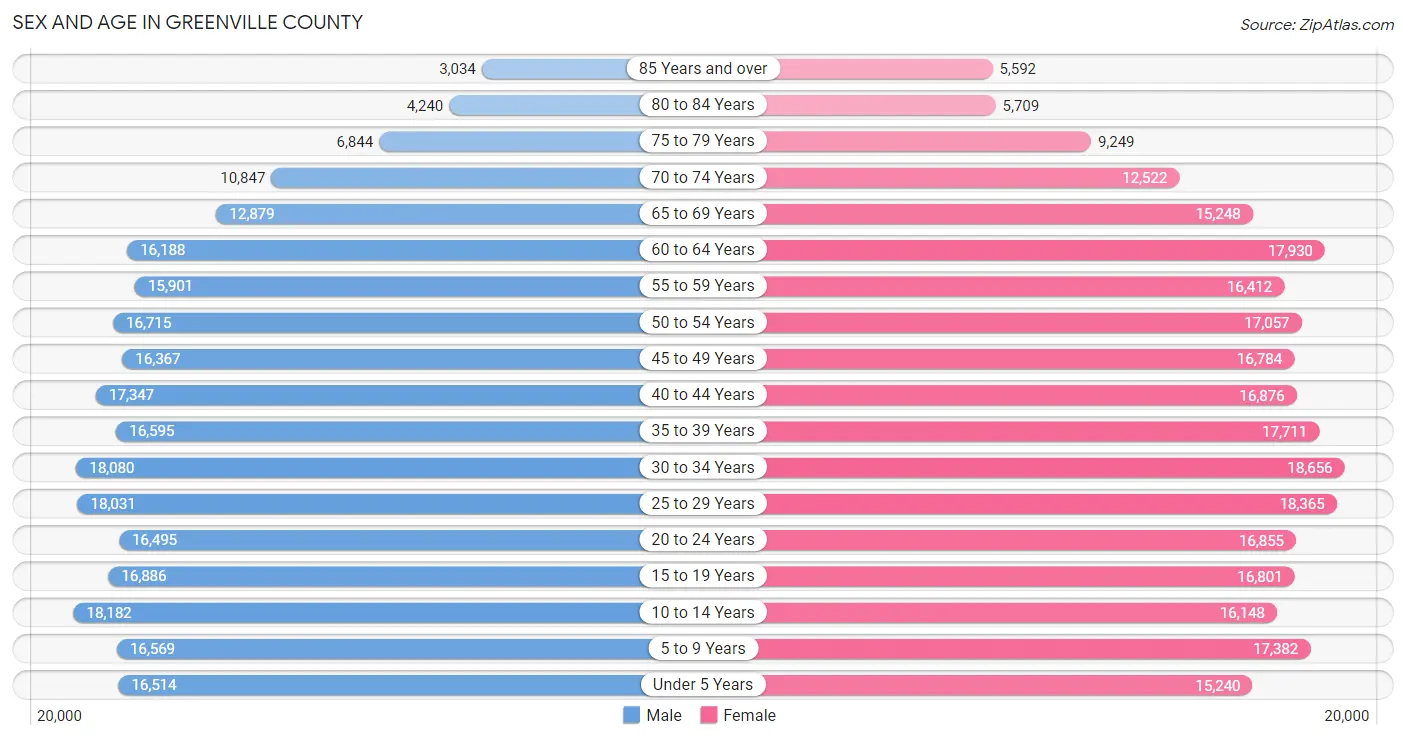
| Age Bracket | Male | Female |
| Under 5 Years | 16,514 (6.4%) | 15,240 (5.6%) |
| 5 to 9 Years | 16,569 (6.4%) | 17,382 (6.4%) |
| 10 to 14 Years | 18,182 (7.1%) | 16,148 (6.0%) |
| 15 to 19 Years | 16,886 (6.6%) | 16,801 (6.2%) |
| 20 to 24 Years | 16,495 (6.4%) | 16,855 (6.2%) |
| 25 to 29 Years | 18,031 (7.0%) | 18,365 (6.8%) |
| 30 to 34 Years | 18,080 (7.0%) | 18,656 (6.9%) |
| 35 to 39 Years | 16,595 (6.4%) | 17,711 (6.6%) |
| 40 to 44 Years | 17,347 (6.7%) | 16,876 (6.2%) |
| 45 to 49 Years | 16,367 (6.4%) | 16,784 (6.2%) |
| 50 to 54 Years | 16,715 (6.5%) | 17,057 (6.3%) |
| 55 to 59 Years | 15,901 (6.2%) | 16,412 (6.1%) |
| 60 to 64 Years | 16,188 (6.3%) | 17,930 (6.6%) |
| 65 to 69 Years | 12,879 (5.0%) | 15,248 (5.6%) |
| 70 to 74 Years | 10,847 (4.2%) | 12,522 (4.6%) |
| 75 to 79 Years | 6,844 (2.7%) | 9,249 (3.4%) |
| 80 to 84 Years | 4,240 (1.7%) | 5,709 (2.1%) |
| 85 Years and over | 3,034 (1.2%) | 5,592 (2.1%) |
| Total | 257,714 (100.0%) | 270,537 (100.0%) |
Families and Households in Greenville County
Median Family Size in Greenville County
The median family size in Greenville County is 3.03 persons per family, with married-couple families (101,796 | 73.8%) accounting for the largest median family size of 3.11 persons per family. On the other hand, single male/father families (10,198 | 7.4%) represent the smallest median family size with 2.71 persons per family.
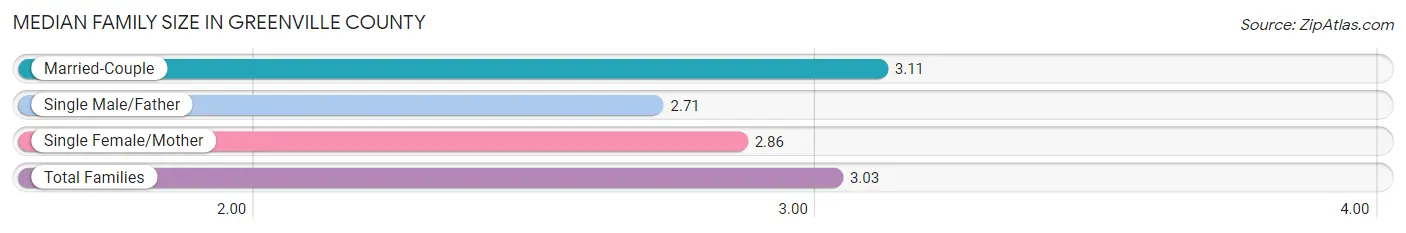
| Family Type | # Families | Family Size |
| Married-Couple | 101,796 (73.8%) | 3.11 |
| Single Male/Father | 10,198 (7.4%) | 2.71 |
| Single Female/Mother | 25,953 (18.8%) | 2.86 |
| Total Families | 137,947 (100.0%) | 3.03 |
Median Household Size in Greenville County
The median household size in Greenville County is 2.45 persons per household, with married-couple households (101,796 | 48.4%) accounting for the largest median household size of 3.12 persons per household. non-family households (72,402 | 34.4%) represent the smallest median household size with 1.22 persons per household.
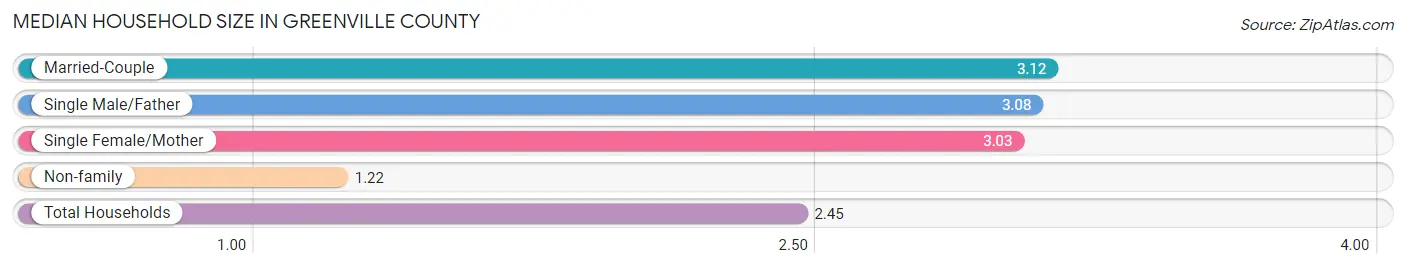
| Household Type | # Households | Household Size |
| Married-Couple | 101,796 (48.4%) | 3.12 |
| Single Male/Father | 10,198 (4.9%) | 3.08 |
| Single Female/Mother | 25,953 (12.3%) | 3.03 |
| Non-family | 72,402 (34.4%) | 1.22 |
| Total Households | 210,349 (100.0%) | 2.45 |
Household Size by Marriage Status in Greenville County
Out of a total of 210,349 households in Greenville County, 137,947 (65.6%) are family households, while 72,402 (34.4%) are nonfamily households. The most numerous type of family households are 2-person households, comprising 63,491, and the most common type of nonfamily households are 1-person households, comprising 60,090.
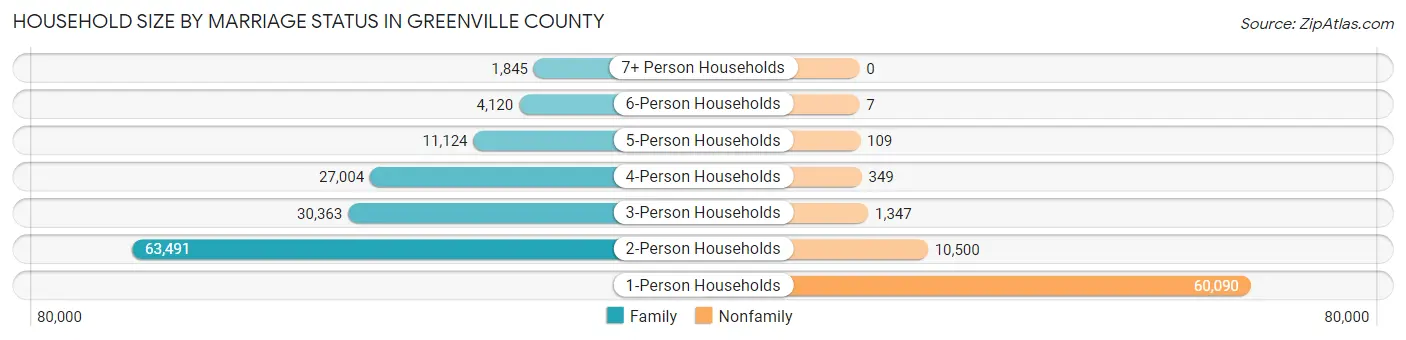
| Household Size | Family Households | Nonfamily Households |
| 1-Person Households | - | 60,090 (28.6%) |
| 2-Person Households | 63,491 (30.2%) | 10,500 (5.0%) |
| 3-Person Households | 30,363 (14.4%) | 1,347 (0.6%) |
| 4-Person Households | 27,004 (12.8%) | 349 (0.2%) |
| 5-Person Households | 11,124 (5.3%) | 109 (0.1%) |
| 6-Person Households | 4,120 (2.0%) | 7 (0.0%) |
| 7+ Person Households | 1,845 (0.9%) | 0 (0.0%) |
| Total | 137,947 (65.6%) | 72,402 (34.4%) |
Female Fertility in Greenville County
Fertility by Age in Greenville County
Average fertility rate in Greenville County is 57.0 births per 1,000 women. Women in the age bracket of 20 to 34 years have the highest fertility rate with 93.0 births per 1,000 women. Women in the age bracket of 20 to 34 years acount for 70.3% of all women with births.
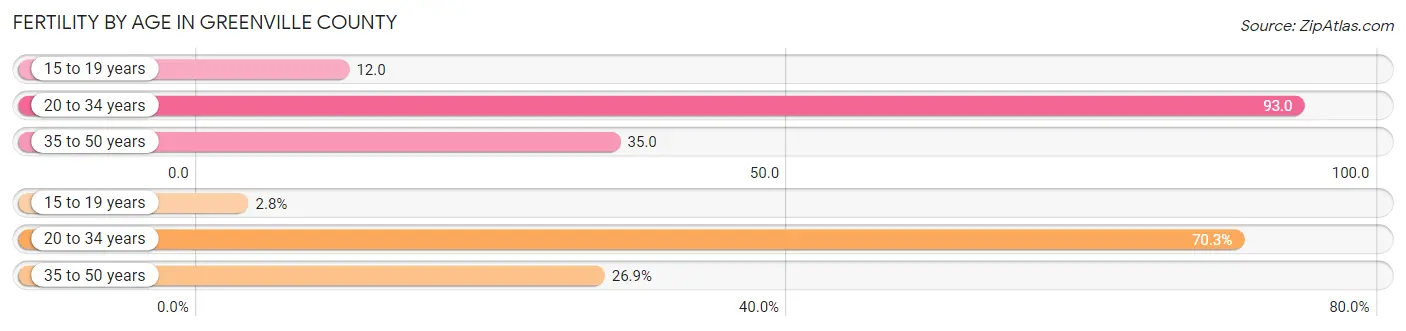
| Age Bracket | Women with Births | Births / 1,000 Women |
| 15 to 19 years | 195 (2.8%) | 12.0 |
| 20 to 34 years | 4,992 (70.3%) | 93.0 |
| 35 to 50 years | 1,912 (26.9%) | 35.0 |
| Total | 7,099 (100.0%) | 57.0 |
Fertility by Age by Marriage Status in Greenville County
70.6% of women with births (7,099) in Greenville County are married. The highest percentage of unmarried women with births falls into 15 to 19 years age bracket with 100.0% of them unmarried at the time of birth, while the lowest percentage of unmarried women with births belong to 35 to 50 years age bracket with 22.8% of them unmarried.
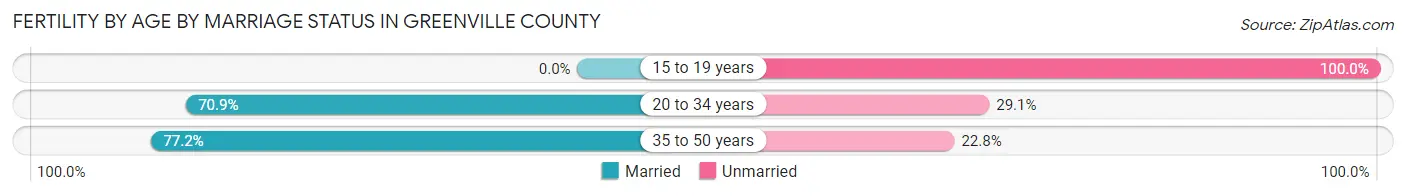
| Age Bracket | Married | Unmarried |
| 15 to 19 years | 0 (0.0%) | 195 (100.0%) |
| 20 to 34 years | 3,539 (70.9%) | 1,453 (29.1%) |
| 35 to 50 years | 1,476 (77.2%) | 436 (22.8%) |
| Total | 5,012 (70.6%) | 2,087 (29.4%) |
Fertility by Education in Greenville County
Average fertility rate in Greenville County is 57.0 births per 1,000 women. Women with the education attainment of bachelor's degree have the highest fertility rate of 77.0 births per 1,000 women, while women with the education attainment of less than high school have the lowest fertility at 37.0 births per 1,000 women. Women with the education attainment of bachelor's degree represent 33.0% of all women with births.
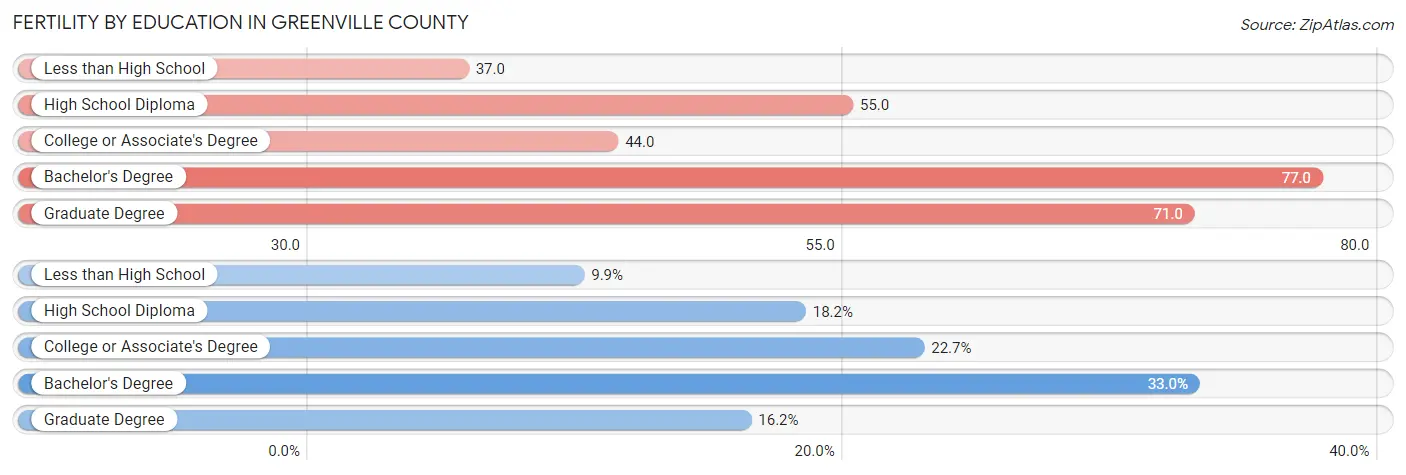
| Educational Attainment | Women with Births | Births / 1,000 Women |
| Less than High School | 705 (9.9%) | 37.0 |
| High School Diploma | 1,294 (18.2%) | 55.0 |
| College or Associate's Degree | 1,609 (22.7%) | 44.0 |
| Bachelor's Degree | 2,342 (33.0%) | 77.0 |
| Graduate Degree | 1,149 (16.2%) | 71.0 |
| Total | 7,099 (100.0%) | 57.0 |
Fertility by Education by Marriage Status in Greenville County
29.4% of women with births in Greenville County are unmarried. Women with the educational attainment of graduate degree are most likely to be married with 91.2% of them married at childbirth, while women with the educational attainment of less than high school are least likely to be married with 65.8% of them unmarried at childbirth.
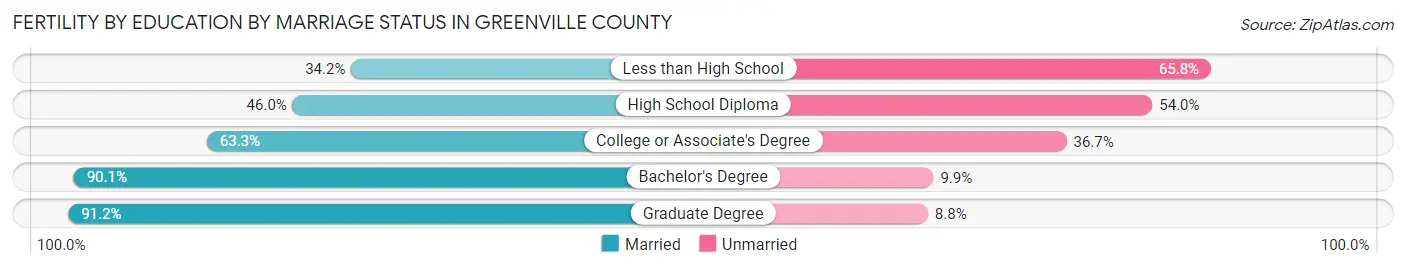
| Educational Attainment | Married | Unmarried |
| Less than High School | 241 (34.2%) | 464 (65.8%) |
| High School Diploma | 595 (46.0%) | 699 (54.0%) |
| College or Associate's Degree | 1,018 (63.3%) | 591 (36.7%) |
| Bachelor's Degree | 2,110 (90.1%) | 232 (9.9%) |
| Graduate Degree | 1,048 (91.2%) | 101 (8.8%) |
| Total | 5,012 (70.6%) | 2,087 (29.4%) |
Employment Characteristics in Greenville County
Employment by Class of Employer in Greenville County
Among the 257,265 employed individuals in Greenville County, private company employees (185,592 | 72.1%), not-for-profit organizations (20,781 | 8.1%), and self-employed (not incorporated) (14,138 | 5.5%) make up the most common classes of employment.
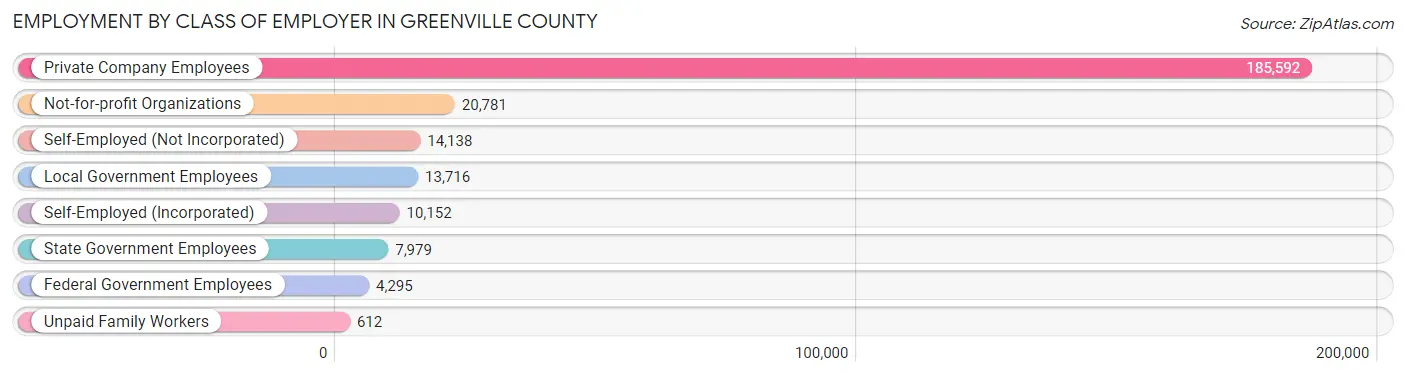
| Employer Class | # Employees | % Employees |
| Private Company Employees | 185,592 | 72.1% |
| Self-Employed (Incorporated) | 10,152 | 4.0% |
| Self-Employed (Not Incorporated) | 14,138 | 5.5% |
| Not-for-profit Organizations | 20,781 | 8.1% |
| Local Government Employees | 13,716 | 5.3% |
| State Government Employees | 7,979 | 3.1% |
| Federal Government Employees | 4,295 | 1.7% |
| Unpaid Family Workers | 612 | 0.2% |
| Total | 257,265 | 100.0% |
Employment Status by Age in Greenville County
According to the labor force statistics for Greenville County, out of the total population over 16 years of age (421,910), 64.9% or 273,820 individuals are in the labor force, with 4.1% or 11,227 of them unemployed. The age group with the highest labor force participation rate is 25 to 29 years, with 85.8% or 31,228 individuals in the labor force. Within the labor force, the 16 to 19 years age range has the highest percentage of unemployed individuals, with 11.5% or 1,376 of them being unemployed.
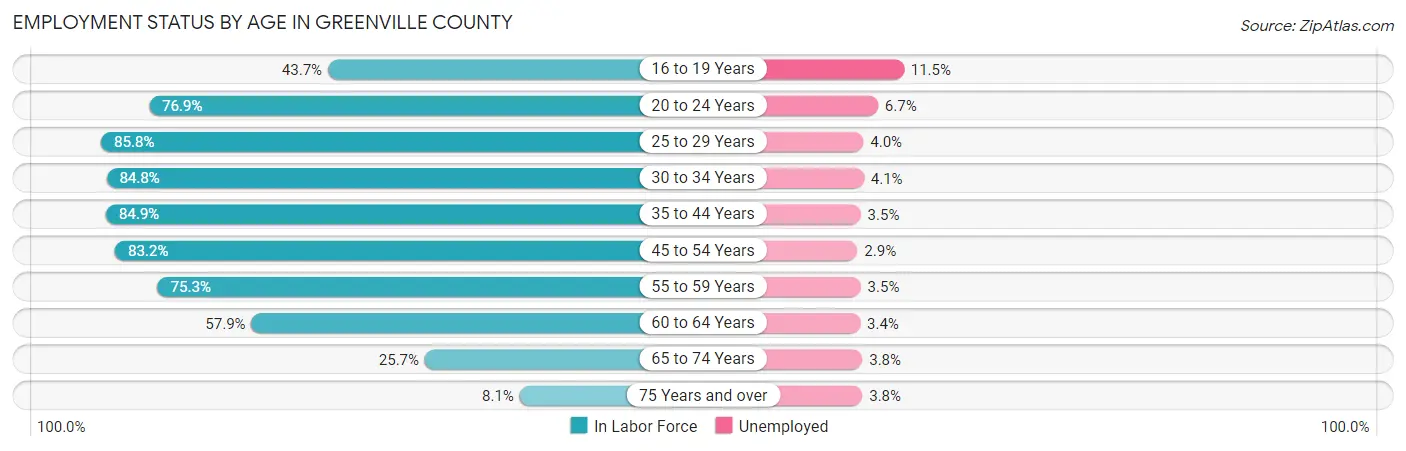
| Age Bracket | In Labor Force | Unemployed |
| 16 to 19 Years | 11,965 (43.7%) | 1,376 (11.5%) |
| 20 to 24 Years | 25,646 (76.9%) | 1,718 (6.7%) |
| 25 to 29 Years | 31,228 (85.8%) | 1,249 (4.0%) |
| 30 to 34 Years | 31,152 (84.8%) | 1,277 (4.1%) |
| 35 to 44 Years | 58,181 (84.9%) | 2,036 (3.5%) |
| 45 to 54 Years | 55,680 (83.2%) | 1,615 (2.9%) |
| 55 to 59 Years | 24,332 (75.3%) | 852 (3.5%) |
| 60 to 64 Years | 19,754 (57.9%) | 672 (3.4%) |
| 65 to 74 Years | 13,234 (25.7%) | 503 (3.8%) |
| 75 Years and over | 2,808 (8.1%) | 107 (3.8%) |
| Total | 273,820 (64.9%) | 11,227 (4.1%) |
Employment Status by Educational Attainment in Greenville County
According to labor force statistics for Greenville County, 80.1% of individuals (220,287) out of the total population between 25 and 64 years of age (275,015) are in the labor force, with 3.5% or 7,710 of them being unemployed. The group with the highest labor force participation rate are those with the educational attainment of bachelor's degree or higher, with 86.9% or 98,293 individuals in the labor force. Within the labor force, individuals with less than high school education have the highest percentage of unemployment, with 8.4% or 1,300 of them being unemployed.
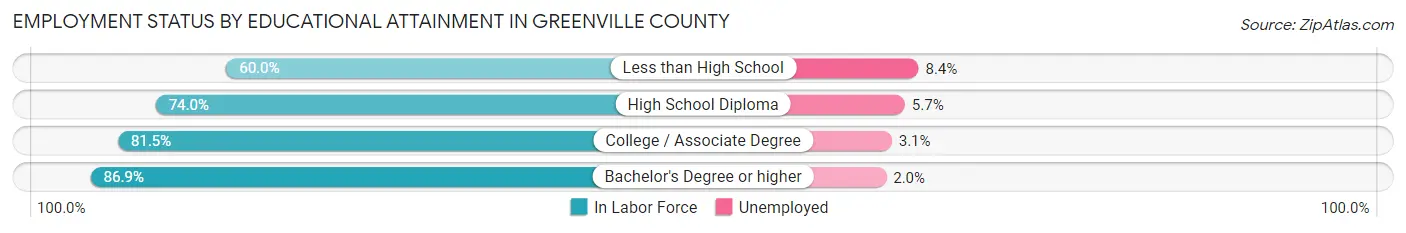
| Educational Attainment | In Labor Force | Unemployed |
| Less than High School | 15,473 (60.0%) | 2,166 (8.4%) |
| High School Diploma | 43,713 (74.0%) | 3,367 (5.7%) |
| College / Associate Degree | 62,791 (81.5%) | 2,388 (3.1%) |
| Bachelor's Degree or higher | 98,293 (86.9%) | 2,262 (2.0%) |
| Total | 220,287 (80.1%) | 9,626 (3.5%) |
Employment Occupations by Sex in Greenville County
Management, Business, Science and Arts Occupations
The most common Management, Business, Science and Arts occupations in Greenville County are Management (30,440 | 11.6%), Community & Social Service (28,372 | 10.8%), Health Diagnosing & Treating (18,369 | 7.0%), Computers, Engineering & Science (18,322 | 7.0%), and Business & Financial (15,453 | 5.9%).
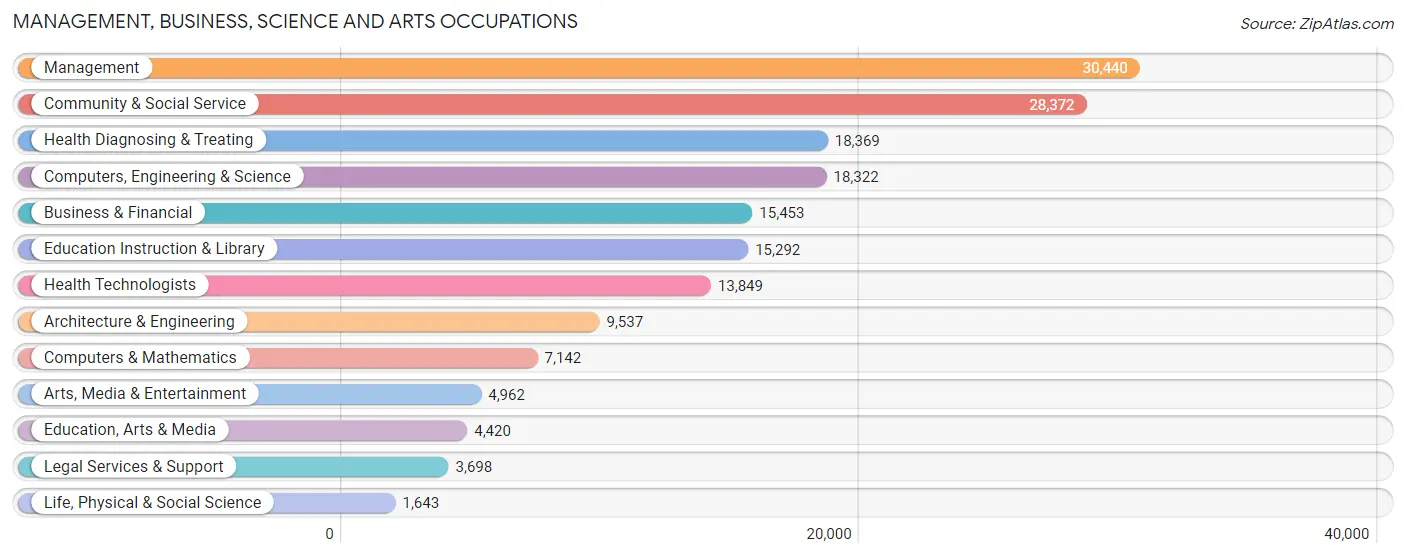
Management, Business, Science and Arts Occupations by Sex
Within the Management, Business, Science and Arts occupations in Greenville County, the most male-oriented occupations are Architecture & Engineering (84.6%), Computers, Engineering & Science (79.2%), and Computers & Mathematics (76.6%), while the most female-oriented occupations are Health Diagnosing & Treating (76.7%), Health Technologists (75.3%), and Education Instruction & Library (75.3%).
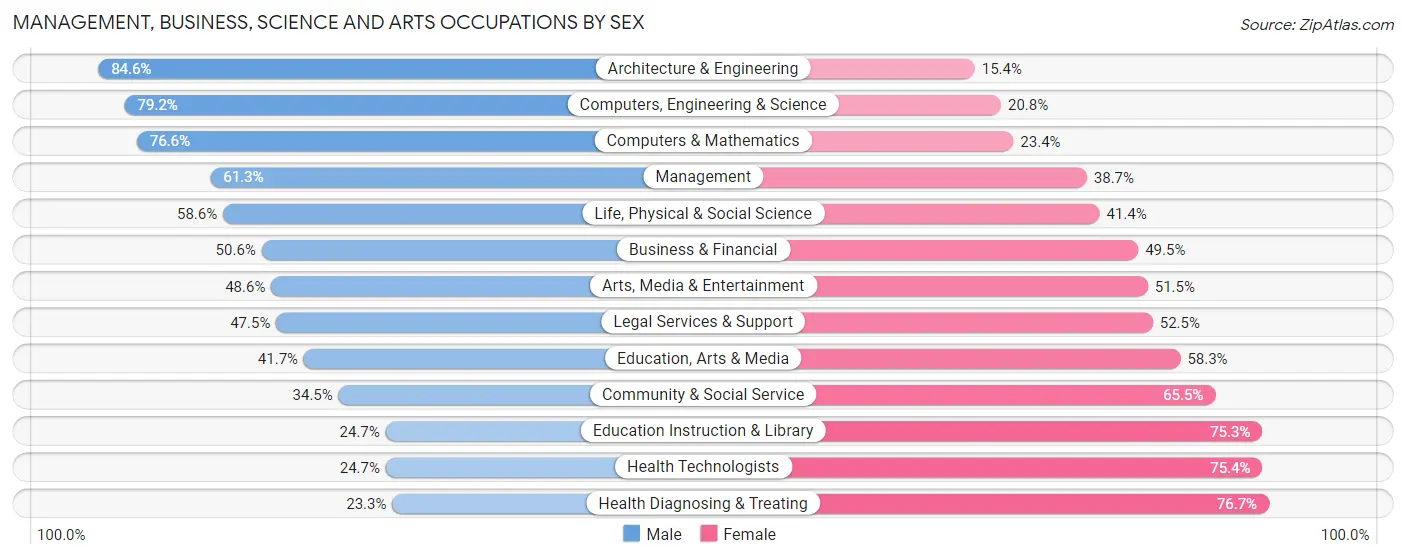
| Occupation | Male | Female |
| Management | 18,647 (61.3%) | 11,793 (38.7%) |
| Business & Financial | 7,812 (50.5%) | 7,641 (49.4%) |
| Computers, Engineering & Science | 14,505 (79.2%) | 3,817 (20.8%) |
| Computers & Mathematics | 5,470 (76.6%) | 1,672 (23.4%) |
| Architecture & Engineering | 8,072 (84.6%) | 1,465 (15.4%) |
| Life, Physical & Social Science | 963 (58.6%) | 680 (41.4%) |
| Community & Social Service | 9,787 (34.5%) | 18,585 (65.5%) |
| Education, Arts & Media | 1,845 (41.7%) | 2,575 (58.3%) |
| Legal Services & Support | 1,757 (47.5%) | 1,941 (52.5%) |
| Education Instruction & Library | 3,776 (24.7%) | 11,516 (75.3%) |
| Arts, Media & Entertainment | 2,409 (48.5%) | 2,553 (51.4%) |
| Health Diagnosing & Treating | 4,278 (23.3%) | 14,091 (76.7%) |
| Health Technologists | 3,414 (24.6%) | 10,435 (75.3%) |
| Total (Category) | 55,029 (49.6%) | 55,927 (50.4%) |
| Total (Overall) | 139,379 (53.2%) | 122,832 (46.8%) |
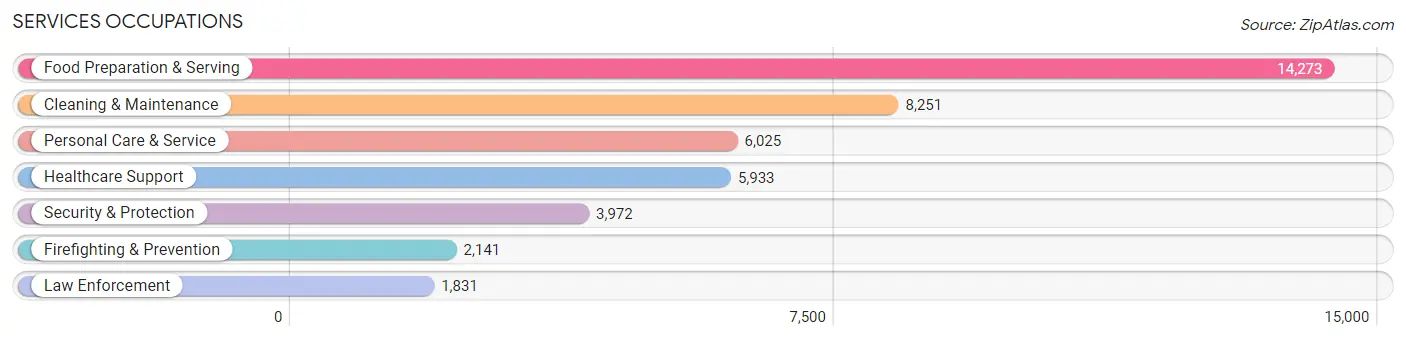
Services Occupations
The most common Services occupations in Greenville County are Food Preparation & Serving (14,273 | 5.4%), Cleaning & Maintenance (8,251 | 3.2%), Personal Care & Service (6,025 | 2.3%), Healthcare Support (5,933 | 2.3%), and Security & Protection (3,972 | 1.5%).
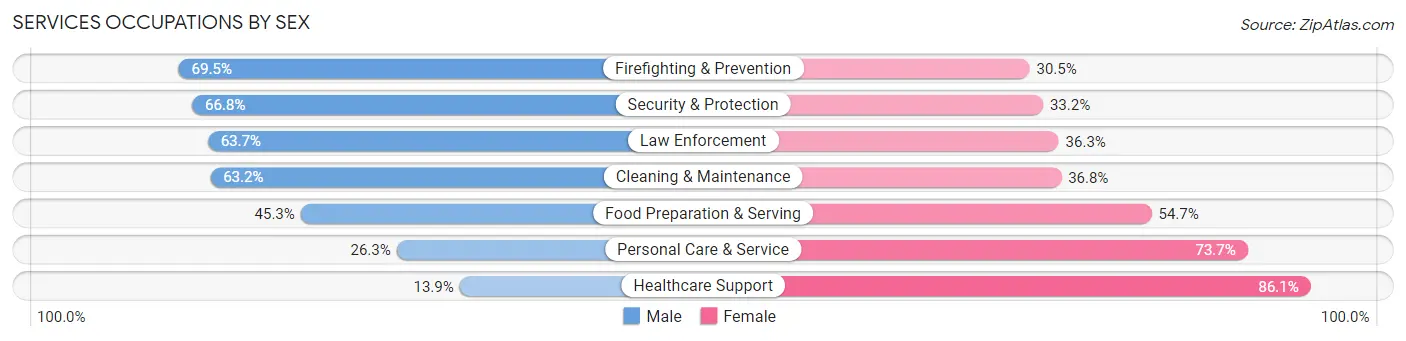
Services Occupations by Sex
Within the Services occupations in Greenville County, the most male-oriented occupations are Firefighting & Prevention (69.5%), Security & Protection (66.8%), and Law Enforcement (63.7%), while the most female-oriented occupations are Healthcare Support (86.1%), Personal Care & Service (73.7%), and Food Preparation & Serving (54.7%).
| Occupation | Male | Female |
| Healthcare Support | 823 (13.9%) | 5,110 (86.1%) |
| Security & Protection | 2,655 (66.8%) | 1,317 (33.2%) |
| Firefighting & Prevention | 1,488 (69.5%) | 653 (30.5%) |
| Law Enforcement | 1,167 (63.7%) | 664 (36.3%) |
| Food Preparation & Serving | 6,472 (45.3%) | 7,801 (54.7%) |
| Cleaning & Maintenance | 5,218 (63.2%) | 3,033 (36.8%) |
| Personal Care & Service | 1,587 (26.3%) | 4,438 (73.7%) |
| Total (Category) | 16,755 (43.6%) | 21,699 (56.4%) |
| Total (Overall) | 139,379 (53.2%) | 122,832 (46.8%) |
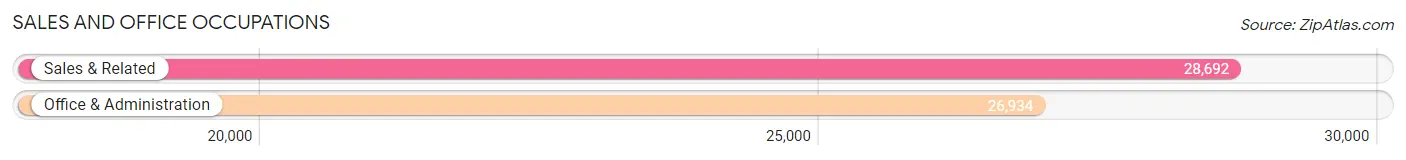
Sales and Office Occupations
The most common Sales and Office occupations in Greenville County are Sales & Related (28,692 | 10.9%), and Office & Administration (26,934 | 10.3%).
Sales and Office Occupations by Sex
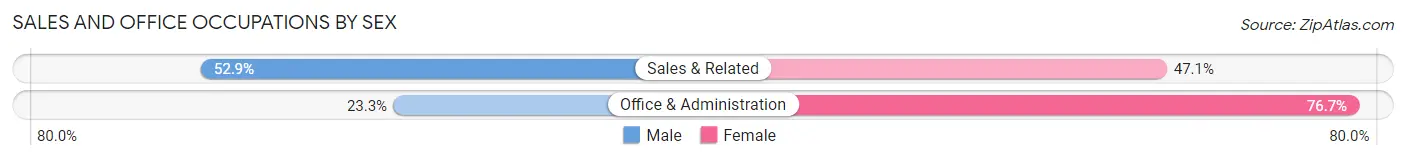
| Occupation | Male | Female |
| Sales & Related | 15,171 (52.9%) | 13,521 (47.1%) |
| Office & Administration | 6,284 (23.3%) | 20,650 (76.7%) |
| Total (Category) | 21,455 (38.6%) | 34,171 (61.4%) |
| Total (Overall) | 139,379 (53.2%) | 122,832 (46.8%) |
Natural Resources, Construction and Maintenance Occupations
The most common Natural Resources, Construction and Maintenance occupations in Greenville County are Construction & Extraction (12,168 | 4.6%), Installation, Maintenance & Repair (7,188 | 2.7%), and Farming, Fishing & Forestry (594 | 0.2%).

Natural Resources, Construction and Maintenance Occupations by Sex
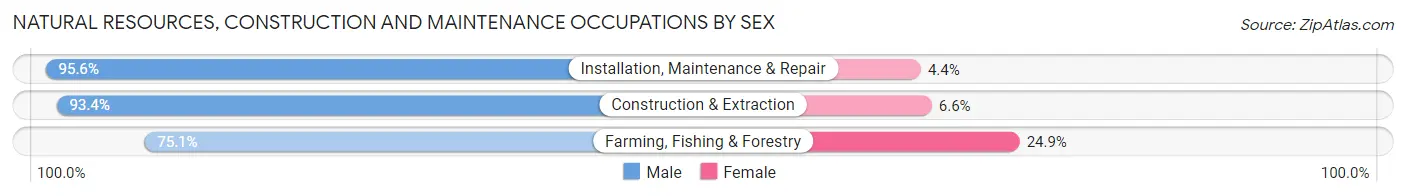
| Occupation | Male | Female |
| Farming, Fishing & Forestry | 446 (75.1%) | 148 (24.9%) |
| Construction & Extraction | 11,360 (93.4%) | 808 (6.6%) |
| Installation, Maintenance & Repair | 6,873 (95.6%) | 315 (4.4%) |
| Total (Category) | 18,679 (93.6%) | 1,271 (6.4%) |
| Total (Overall) | 139,379 (53.2%) | 122,832 (46.8%) |
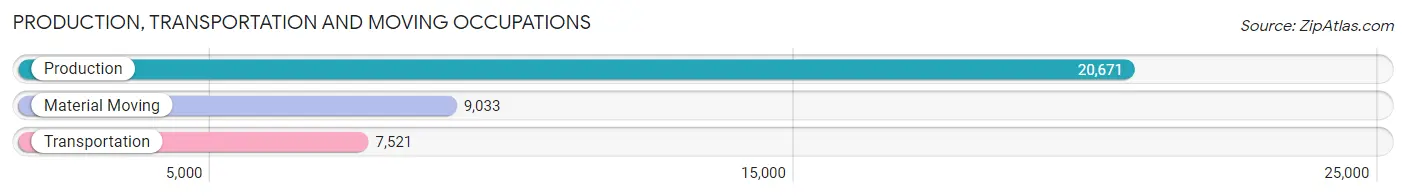
Production, Transportation and Moving Occupations
The most common Production, Transportation and Moving occupations in Greenville County are Production (20,671 | 7.9%), Material Moving (9,033 | 3.4%), and Transportation (7,521 | 2.9%).
Production, Transportation and Moving Occupations by Sex
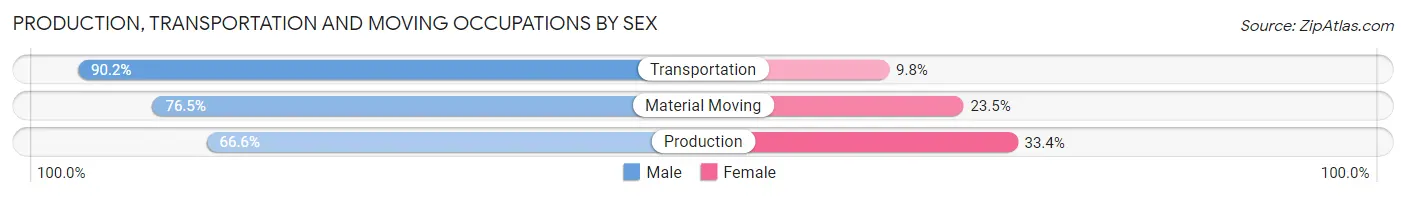
| Occupation | Male | Female |
| Production | 13,767 (66.6%) | 6,904 (33.4%) |
| Transportation | 6,782 (90.2%) | 739 (9.8%) |
| Material Moving | 6,912 (76.5%) | 2,121 (23.5%) |
| Total (Category) | 27,461 (73.8%) | 9,764 (26.2%) |
| Total (Overall) | 139,379 (53.2%) | 122,832 (46.8%) |
Employment Industries by Sex in Greenville County
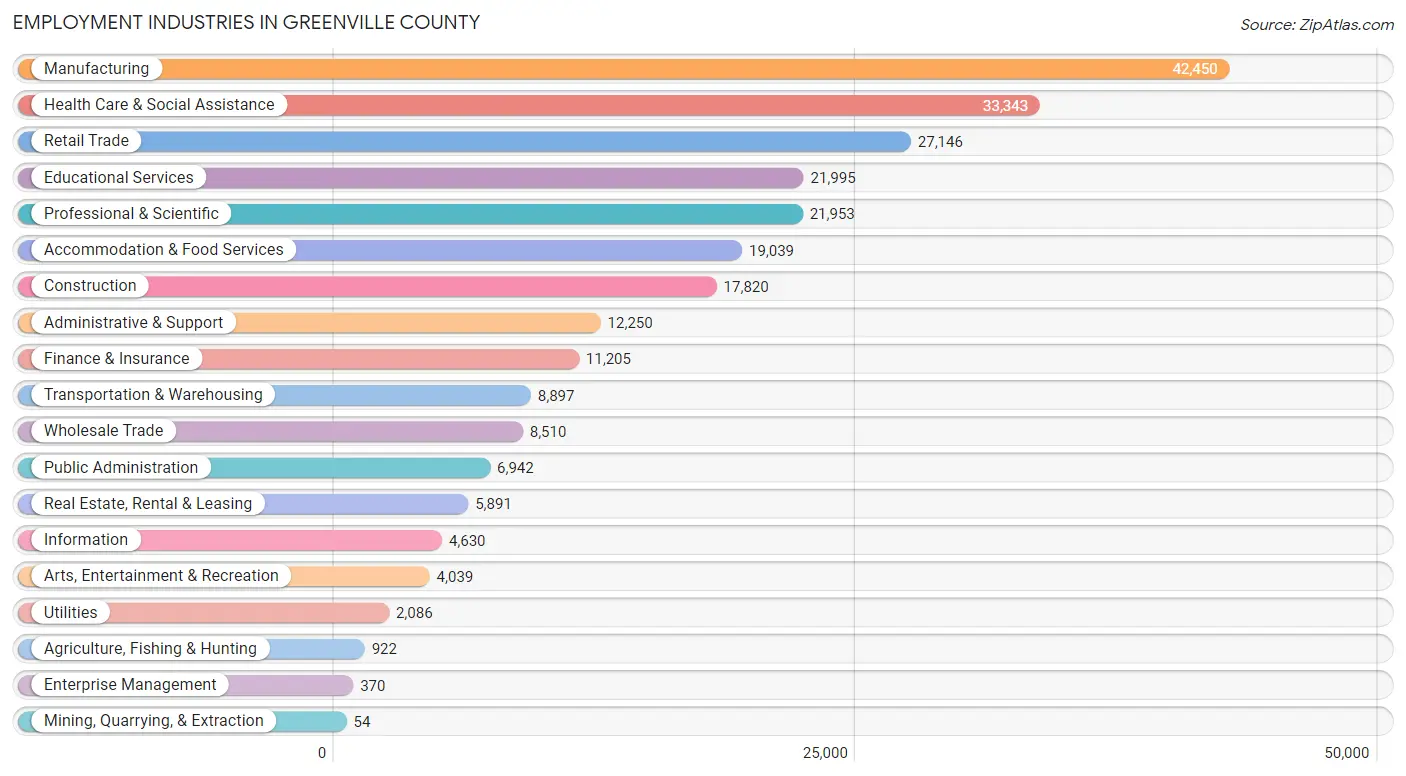
Employment Industries in Greenville County
The major employment industries in Greenville County include Manufacturing (42,450 | 16.2%), Health Care & Social Assistance (33,343 | 12.7%), Retail Trade (27,146 | 10.3%), Educational Services (21,995 | 8.4%), and Professional & Scientific (21,953 | 8.4%).
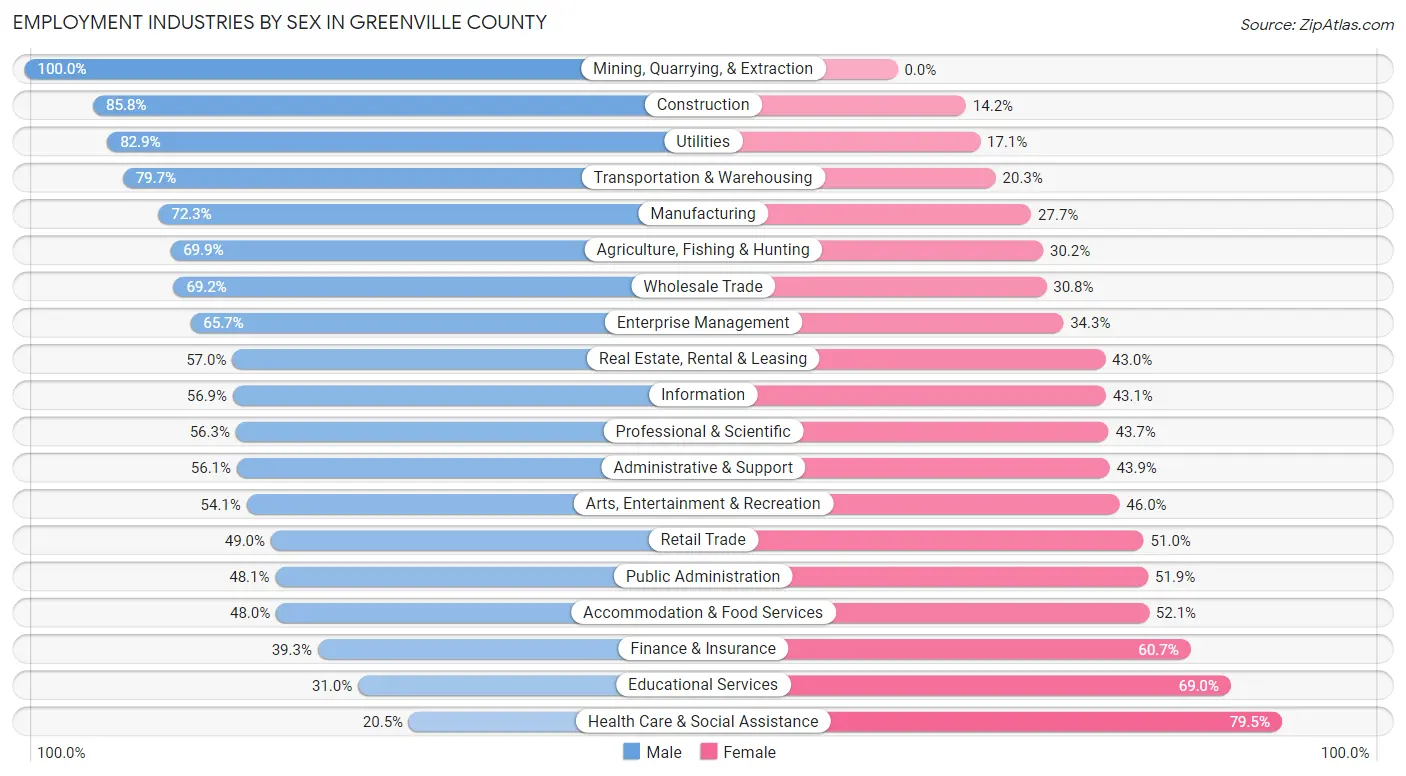
Employment Industries by Sex in Greenville County
The Greenville County industries that see more men than women are Mining, Quarrying, & Extraction (100.0%), Construction (85.8%), and Utilities (82.9%), whereas the industries that tend to have a higher number of women are Health Care & Social Assistance (79.5%), Educational Services (69.0%), and Finance & Insurance (60.7%).
| Industry | Male | Female |
| Agriculture, Fishing & Hunting | 644 (69.9%) | 278 (30.1%) |
| Mining, Quarrying, & Extraction | 54 (100.0%) | 0 (0.0%) |
| Construction | 15,293 (85.8%) | 2,527 (14.2%) |
| Manufacturing | 30,700 (72.3%) | 11,750 (27.7%) |
| Wholesale Trade | 5,887 (69.2%) | 2,623 (30.8%) |
| Retail Trade | 13,309 (49.0%) | 13,837 (51.0%) |
| Transportation & Warehousing | 7,089 (79.7%) | 1,808 (20.3%) |
| Utilities | 1,729 (82.9%) | 357 (17.1%) |
| Information | 2,634 (56.9%) | 1,996 (43.1%) |
| Finance & Insurance | 4,407 (39.3%) | 6,798 (60.7%) |
| Real Estate, Rental & Leasing | 3,359 (57.0%) | 2,532 (43.0%) |
| Professional & Scientific | 12,360 (56.3%) | 9,593 (43.7%) |
| Enterprise Management | 243 (65.7%) | 127 (34.3%) |
| Administrative & Support | 6,869 (56.1%) | 5,381 (43.9%) |
| Educational Services | 6,816 (31.0%) | 15,179 (69.0%) |
| Health Care & Social Assistance | 6,821 (20.5%) | 26,522 (79.5%) |
| Arts, Entertainment & Recreation | 2,183 (54.0%) | 1,856 (46.0%) |
| Accommodation & Food Services | 9,129 (47.9%) | 9,910 (52.0%) |
| Public Administration | 3,340 (48.1%) | 3,602 (51.9%) |
| Total | 139,379 (53.2%) | 122,832 (46.8%) |
Education in Greenville County
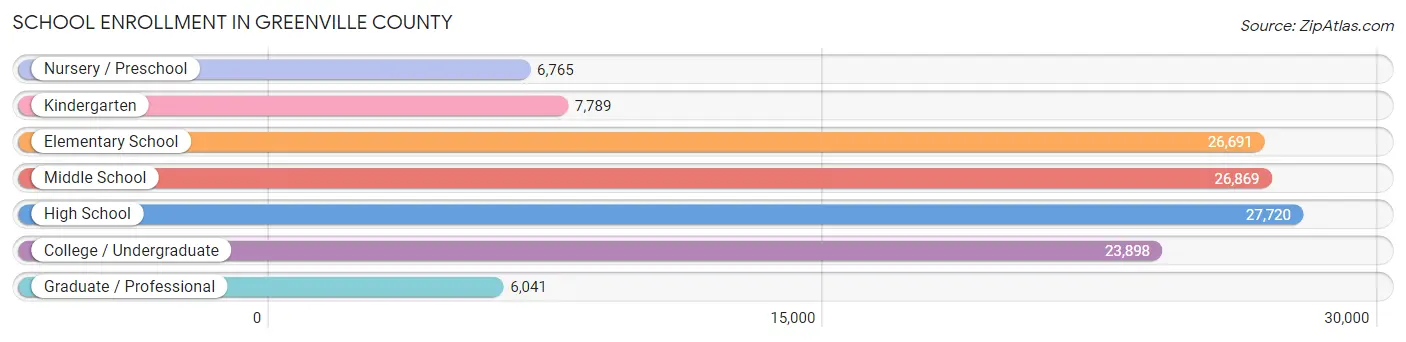
School Enrollment in Greenville County
The most common levels of schooling among the 125,773 students in Greenville County are high school (27,720 | 22.0%), middle school (26,869 | 21.4%), and elementary school (26,691 | 21.2%).
| School Level | # Students | % Students |
| Nursery / Preschool | 6,765 | 5.4% |
| Kindergarten | 7,789 | 6.2% |
| Elementary School | 26,691 | 21.2% |
| Middle School | 26,869 | 21.4% |
| High School | 27,720 | 22.0% |
| College / Undergraduate | 23,898 | 19.0% |
| Graduate / Professional | 6,041 | 4.8% |
| Total | 125,773 | 100.0% |
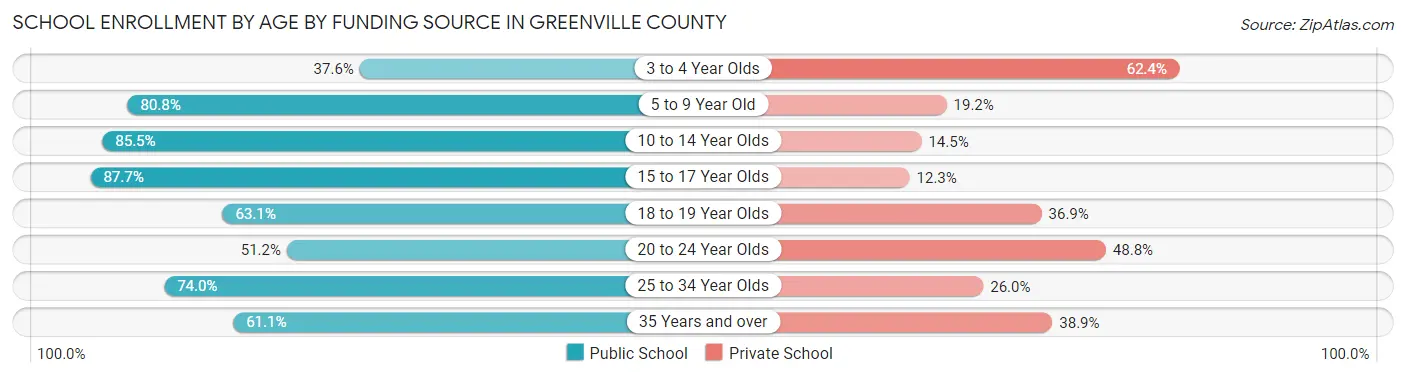
School Enrollment by Age by Funding Source in Greenville County
Out of a total of 125,773 students who are enrolled in schools in Greenville County, 30,311 (24.1%) attend a private institution, while the remaining 95,462 (75.9%) are enrolled in public schools. The age group of 3 to 4 year olds has the highest likelihood of being enrolled in private schools, with 3,125 (62.4% in the age bracket) enrolled. Conversely, the age group of 15 to 17 year olds has the lowest likelihood of being enrolled in a private school, with 17,363 (87.7% in the age bracket) attending a public institution.
| Age Bracket | Public School | Private School |
| 3 to 4 Year Olds | 1,882 (37.6%) | 3,125 (62.4%) |
| 5 to 9 Year Old | 26,334 (80.8%) | 6,245 (19.2%) |
| 10 to 14 Year Olds | 28,890 (85.5%) | 4,896 (14.5%) |
| 15 to 17 Year Olds | 17,363 (87.7%) | 2,431 (12.3%) |
| 18 to 19 Year Olds | 6,434 (63.1%) | 3,758 (36.9%) |
| 20 to 24 Year Olds | 6,187 (51.2%) | 5,907 (48.8%) |
| 25 to 34 Year Olds | 4,761 (74.0%) | 1,674 (26.0%) |
| 35 Years and over | 3,598 (61.1%) | 2,288 (38.9%) |
| Total | 95,462 (75.9%) | 30,311 (24.1%) |
Educational Attainment by Field of Study in Greenville County
Business (33,063 | 21.8%), education (18,055 | 11.9%), science & technology (15,495 | 10.2%), engineering (15,157 | 10.0%), and social sciences (9,527 | 6.3%) are the most common fields of study among 151,763 individuals in Greenville County who have obtained a bachelor's degree or higher.
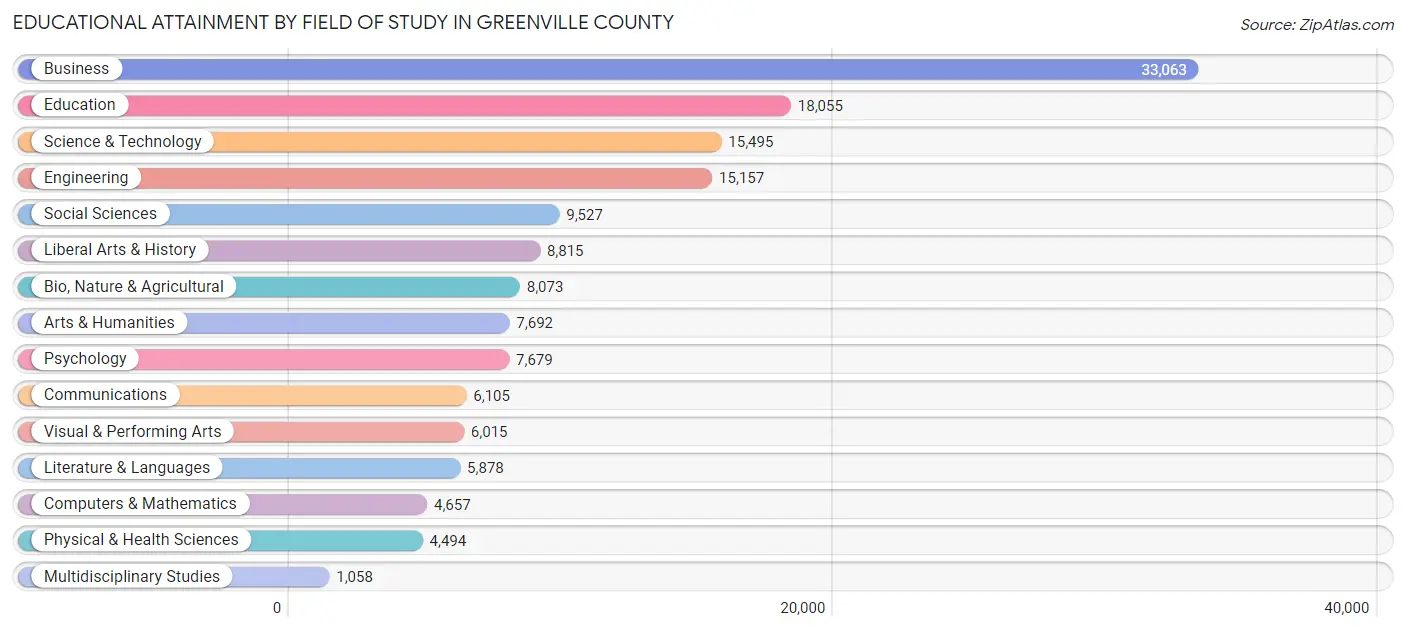
| Field of Study | # Graduates | % Graduates |
| Computers & Mathematics | 4,657 | 3.1% |
| Bio, Nature & Agricultural | 8,073 | 5.3% |
| Physical & Health Sciences | 4,494 | 3.0% |
| Psychology | 7,679 | 5.1% |
| Social Sciences | 9,527 | 6.3% |
| Engineering | 15,157 | 10.0% |
| Multidisciplinary Studies | 1,058 | 0.7% |
| Science & Technology | 15,495 | 10.2% |
| Business | 33,063 | 21.8% |
| Education | 18,055 | 11.9% |
| Literature & Languages | 5,878 | 3.9% |
| Liberal Arts & History | 8,815 | 5.8% |
| Visual & Performing Arts | 6,015 | 4.0% |
| Communications | 6,105 | 4.0% |
| Arts & Humanities | 7,692 | 5.1% |
| Total | 151,763 | 100.0% |
Transportation & Commute in Greenville County
Vehicle Availability by Sex in Greenville County
The most prevalent vehicle ownership categories in Greenville County are males with 2 vehicles (61,922, accounting for 45.5%) and females with 2 vehicles (50,728, making up 52.7%).
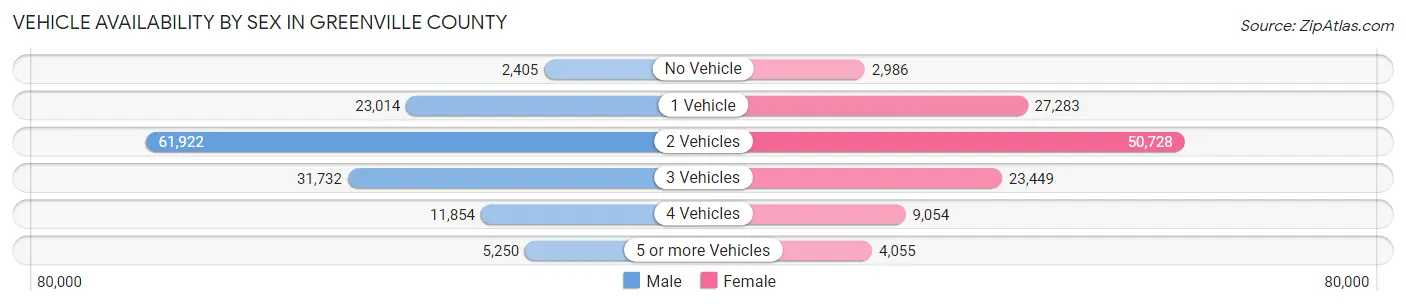
| Vehicles Available | Male | Female |
| No Vehicle | 2,405 (1.8%) | 2,986 (2.5%) |
| 1 Vehicle | 23,014 (16.9%) | 27,283 (23.2%) |
| 2 Vehicles | 61,922 (45.5%) | 50,728 (43.1%) |
| 3 Vehicles | 31,732 (23.3%) | 23,449 (20.0%) |
| 4 Vehicles | 11,854 (8.7%) | 9,054 (7.7%) |
| 5 or more Vehicles | 5,250 (3.9%) | 4,055 (3.5%) |
| Total | 136,177 (100.0%) | 117,555 (100.0%) |
Commute Time in Greenville County
The most frequently occuring commute durations in Greenville County are 20 to 24 minutes (43,442 commuters, 18.9%), 15 to 19 minutes (41,692 commuters, 18.1%), and 30 to 34 minutes (33,748 commuters, 14.7%).
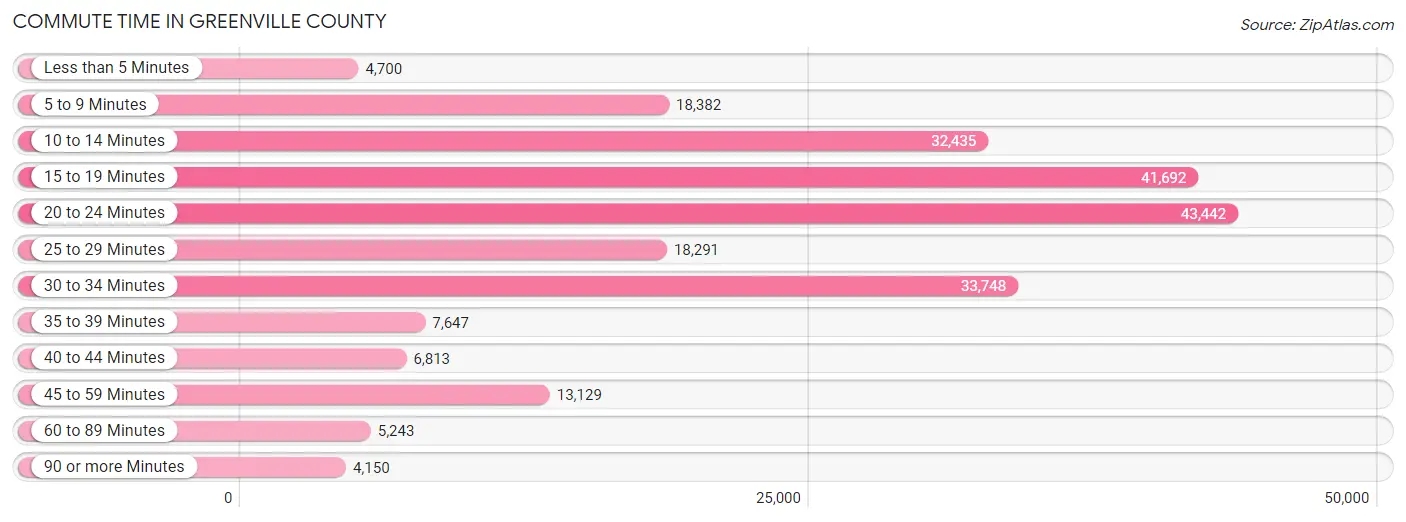
| Commute Time | # Commuters | % Commuters |
| Less than 5 Minutes | 4,700 | 2.1% |
| 5 to 9 Minutes | 18,382 | 8.0% |
| 10 to 14 Minutes | 32,435 | 14.1% |
| 15 to 19 Minutes | 41,692 | 18.1% |
| 20 to 24 Minutes | 43,442 | 18.9% |
| 25 to 29 Minutes | 18,291 | 8.0% |
| 30 to 34 Minutes | 33,748 | 14.7% |
| 35 to 39 Minutes | 7,647 | 3.3% |
| 40 to 44 Minutes | 6,813 | 3.0% |
| 45 to 59 Minutes | 13,129 | 5.7% |
| 60 to 89 Minutes | 5,243 | 2.3% |
| 90 or more Minutes | 4,150 | 1.8% |
Commute Time by Sex in Greenville County
The most common commute times in Greenville County are 20 to 24 minutes (22,429 commuters, 18.0%) for males and 20 to 24 minutes (21,013 commuters, 19.9%) for females.
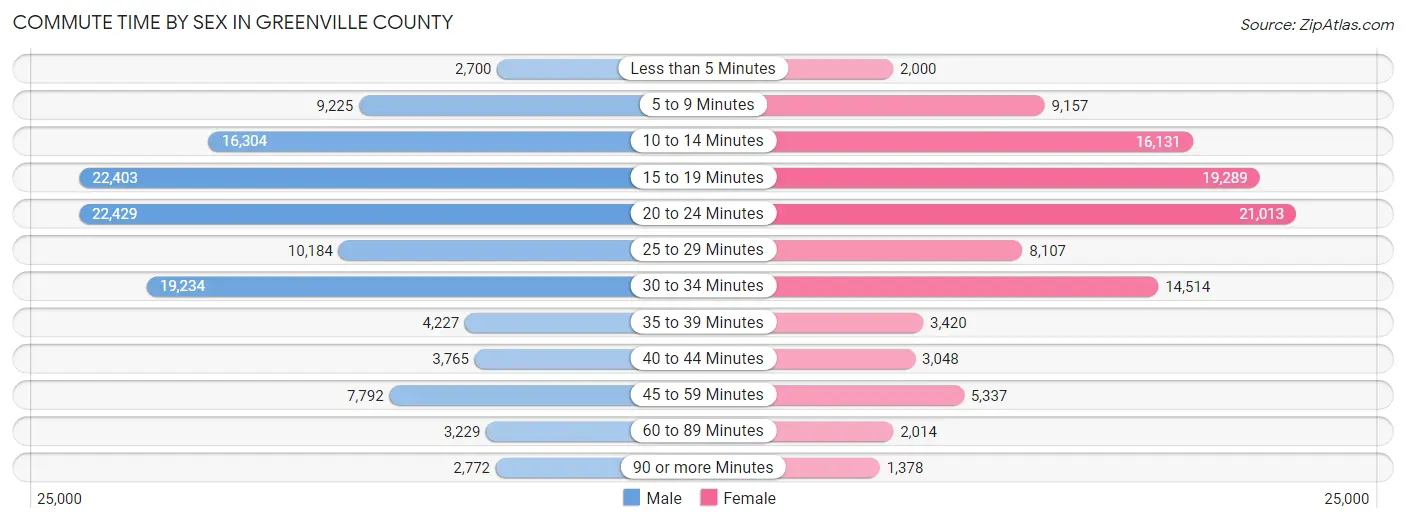
| Commute Time | Male | Female |
| Less than 5 Minutes | 2,700 (2.2%) | 2,000 (1.9%) |
| 5 to 9 Minutes | 9,225 (7.4%) | 9,157 (8.7%) |
| 10 to 14 Minutes | 16,304 (13.1%) | 16,131 (15.3%) |
| 15 to 19 Minutes | 22,403 (18.0%) | 19,289 (18.3%) |
| 20 to 24 Minutes | 22,429 (18.0%) | 21,013 (19.9%) |
| 25 to 29 Minutes | 10,184 (8.2%) | 8,107 (7.7%) |
| 30 to 34 Minutes | 19,234 (15.5%) | 14,514 (13.8%) |
| 35 to 39 Minutes | 4,227 (3.4%) | 3,420 (3.2%) |
| 40 to 44 Minutes | 3,765 (3.0%) | 3,048 (2.9%) |
| 45 to 59 Minutes | 7,792 (6.3%) | 5,337 (5.1%) |
| 60 to 89 Minutes | 3,229 (2.6%) | 2,014 (1.9%) |
| 90 or more Minutes | 2,772 (2.2%) | 1,378 (1.3%) |
Time of Departure to Work by Sex in Greenville County
The most frequent times of departure to work in Greenville County are 7:00 AM to 7:29 AM (18,714, 15.1%) for males and 7:00 AM to 7:29 AM (17,304, 16.4%) for females.
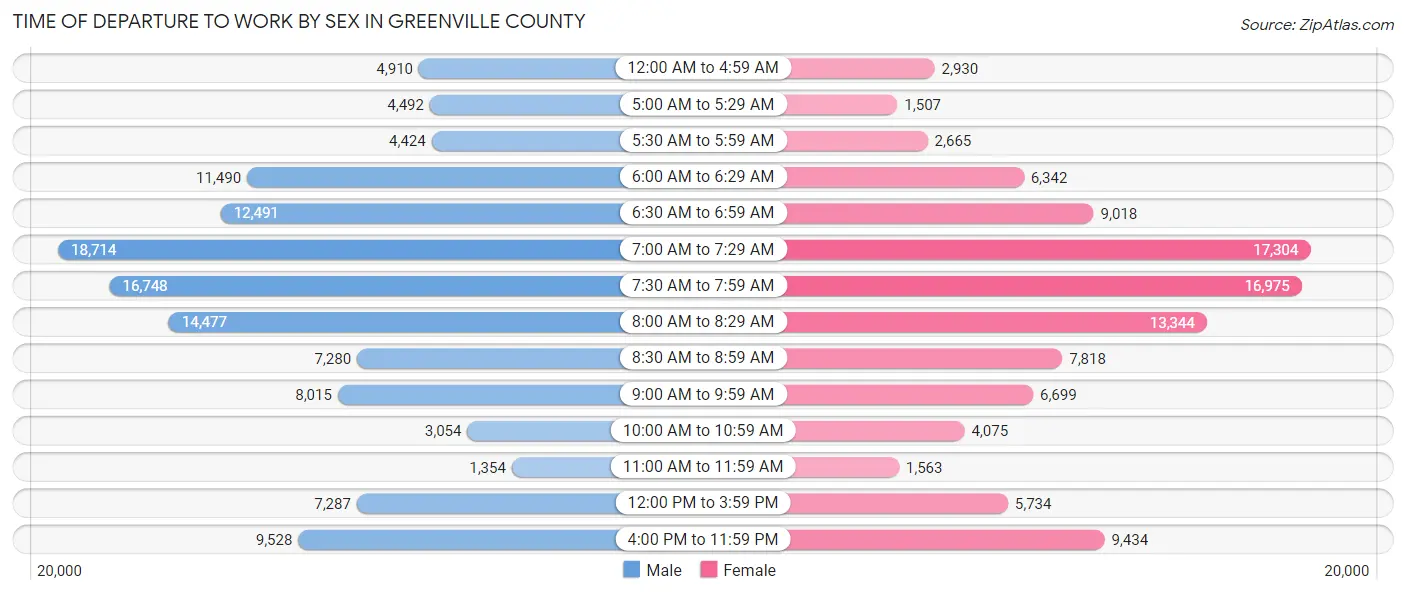
| Time of Departure | Male | Female |
| 12:00 AM to 4:59 AM | 4,910 (4.0%) | 2,930 (2.8%) |
| 5:00 AM to 5:29 AM | 4,492 (3.6%) | 1,507 (1.4%) |
| 5:30 AM to 5:59 AM | 4,424 (3.6%) | 2,665 (2.5%) |
| 6:00 AM to 6:29 AM | 11,490 (9.2%) | 6,342 (6.0%) |
| 6:30 AM to 6:59 AM | 12,491 (10.1%) | 9,018 (8.6%) |
| 7:00 AM to 7:29 AM | 18,714 (15.1%) | 17,304 (16.4%) |
| 7:30 AM to 7:59 AM | 16,748 (13.5%) | 16,975 (16.1%) |
| 8:00 AM to 8:29 AM | 14,477 (11.7%) | 13,344 (12.7%) |
| 8:30 AM to 8:59 AM | 7,280 (5.9%) | 7,818 (7.4%) |
| 9:00 AM to 9:59 AM | 8,015 (6.5%) | 6,699 (6.4%) |
| 10:00 AM to 10:59 AM | 3,054 (2.5%) | 4,075 (3.9%) |
| 11:00 AM to 11:59 AM | 1,354 (1.1%) | 1,563 (1.5%) |
| 12:00 PM to 3:59 PM | 7,287 (5.9%) | 5,734 (5.4%) |
| 4:00 PM to 11:59 PM | 9,528 (7.7%) | 9,434 (8.9%) |
| Total | 124,264 (100.0%) | 105,408 (100.0%) |
Housing Occupancy in Greenville County
Occupancy by Ownership in Greenville County
Of the total 210,349 dwellings in Greenville County, owner-occupied units account for 145,000 (68.9%), while renter-occupied units make up 65,349 (31.1%).
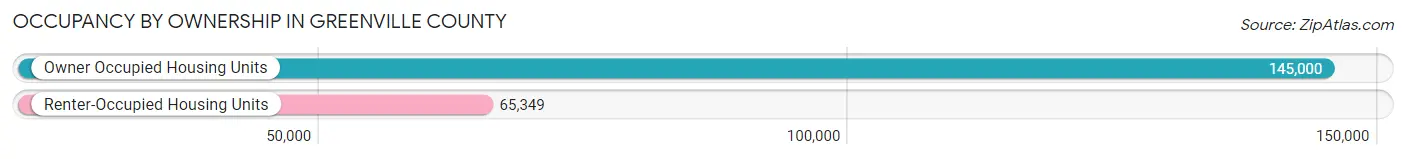
| Occupancy | # Housing Units | % Housing Units |
| Owner Occupied Housing Units | 145,000 | 68.9% |
| Renter-Occupied Housing Units | 65,349 | 31.1% |
| Total Occupied Housing Units | 210,349 | 100.0% |
Occupancy by Household Size in Greenville County
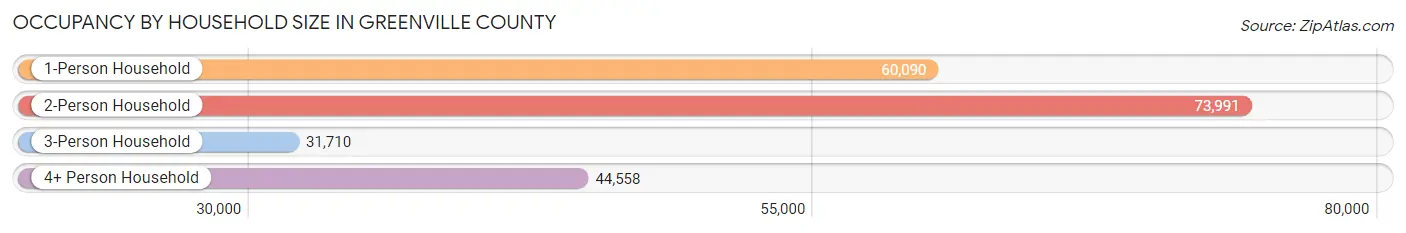
| Household Size | # Housing Units | % Housing Units |
| 1-Person Household | 60,090 | 28.6% |
| 2-Person Household | 73,991 | 35.2% |
| 3-Person Household | 31,710 | 15.1% |
| 4+ Person Household | 44,558 | 21.2% |
| Total Housing Units | 210,349 | 100.0% |
Occupancy by Ownership by Household Size in Greenville County
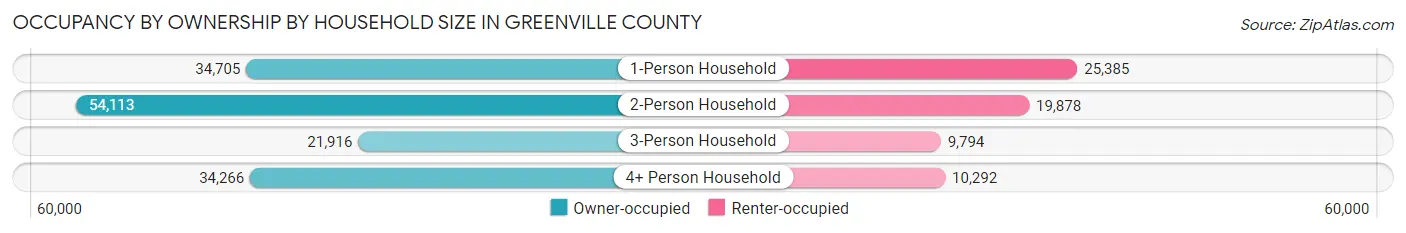
| Household Size | Owner-occupied | Renter-occupied |
| 1-Person Household | 34,705 (57.8%) | 25,385 (42.2%) |
| 2-Person Household | 54,113 (73.1%) | 19,878 (26.9%) |
| 3-Person Household | 21,916 (69.1%) | 9,794 (30.9%) |
| 4+ Person Household | 34,266 (76.9%) | 10,292 (23.1%) |
| Total Housing Units | 145,000 (68.9%) | 65,349 (31.1%) |
Occupancy by Educational Attainment in Greenville County
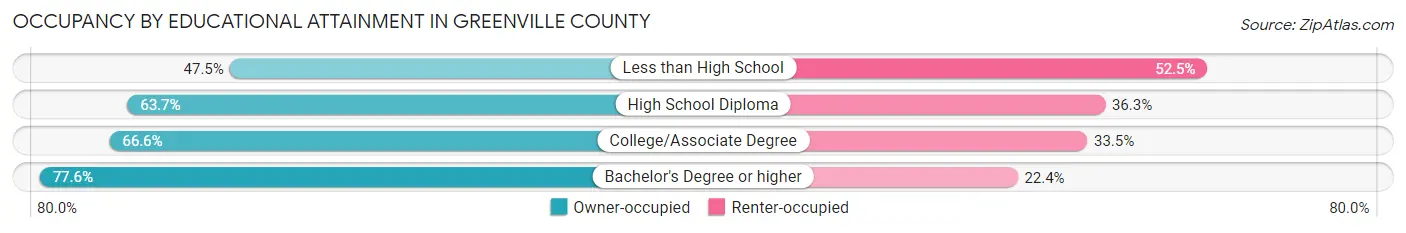
| Household Size | Owner-occupied | Renter-occupied |
| Less than High School | 8,350 (47.5%) | 9,236 (52.5%) |
| High School Diploma | 28,068 (63.7%) | 15,988 (36.3%) |
| College/Associate Degree | 41,029 (66.5%) | 20,618 (33.5%) |
| Bachelor's Degree or higher | 67,553 (77.6%) | 19,507 (22.4%) |
Occupancy by Age of Householder in Greenville County
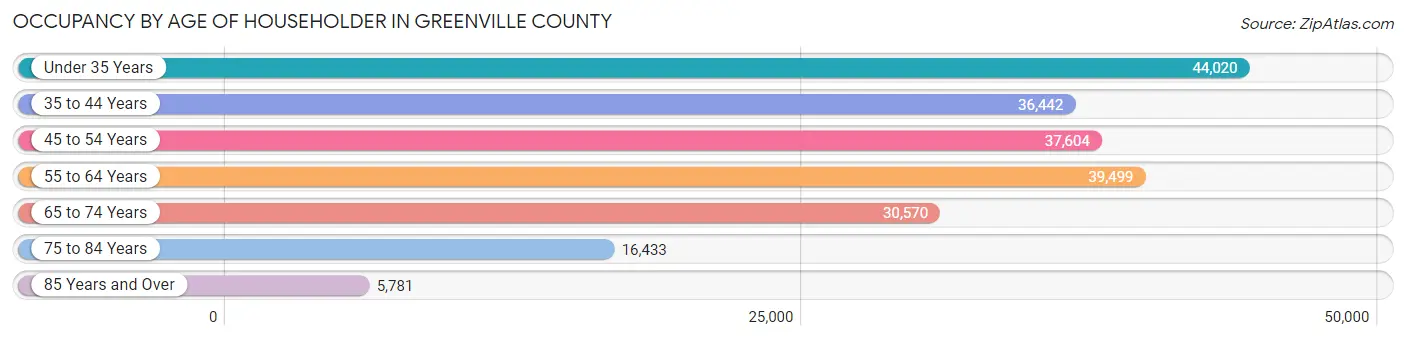
| Age Bracket | # Households | % Households |
| Under 35 Years | 44,020 | 20.9% |
| 35 to 44 Years | 36,442 | 17.3% |
| 45 to 54 Years | 37,604 | 17.9% |
| 55 to 64 Years | 39,499 | 18.8% |
| 65 to 74 Years | 30,570 | 14.5% |
| 75 to 84 Years | 16,433 | 7.8% |
| 85 Years and Over | 5,781 | 2.8% |
| Total | 210,349 | 100.0% |
Housing Finances in Greenville County
Median Income by Occupancy in Greenville County
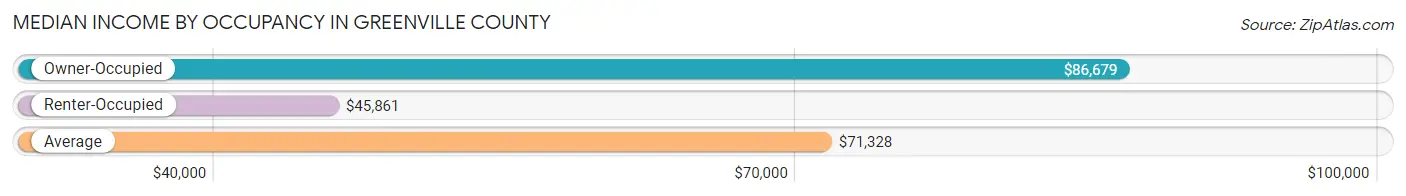
| Occupancy Type | # Households | Median Income |
| Owner-Occupied | 145,000 (68.9%) | $86,679 |
| Renter-Occupied | 65,349 (31.1%) | $45,861 |
| Average | 210,349 (100.0%) | $71,328 |
Occupancy by Householder Income Bracket in Greenville County
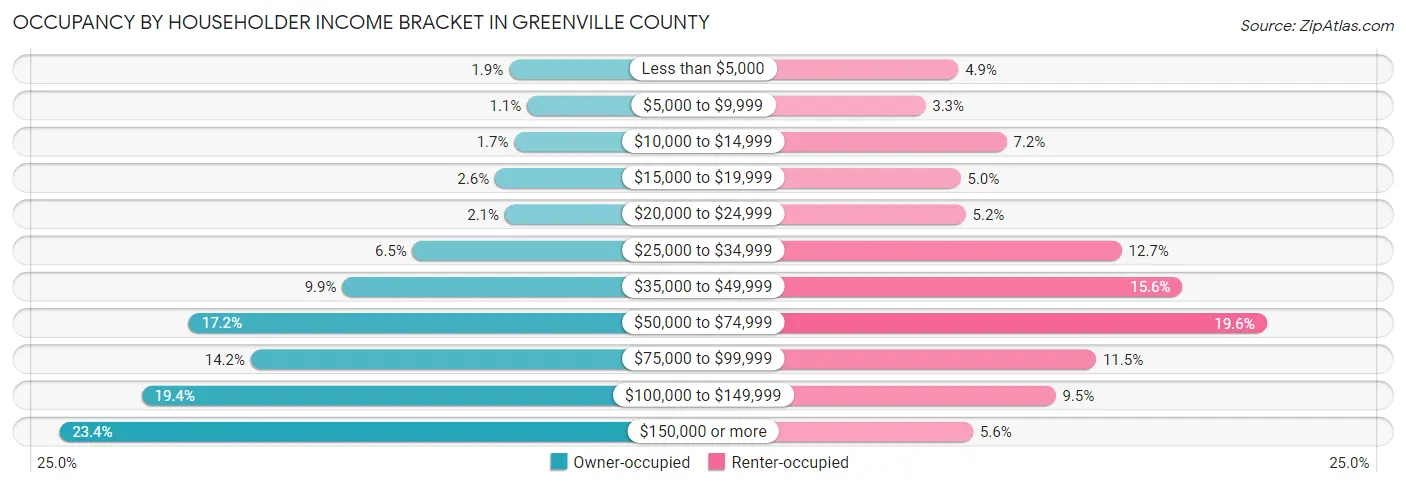
| Income Bracket | Owner-occupied | Renter-occupied |
| Less than $5,000 | 2,803 (1.9%) | 3,196 (4.9%) |
| $5,000 to $9,999 | 1,556 (1.1%) | 2,171 (3.3%) |
| $10,000 to $14,999 | 2,442 (1.7%) | 4,699 (7.2%) |
| $15,000 to $19,999 | 3,767 (2.6%) | 3,268 (5.0%) |
| $20,000 to $24,999 | 3,090 (2.1%) | 3,424 (5.2%) |
| $25,000 to $34,999 | 9,458 (6.5%) | 8,278 (12.7%) |
| $35,000 to $49,999 | 14,308 (9.9%) | 10,171 (15.6%) |
| $50,000 to $74,999 | 24,915 (17.2%) | 12,787 (19.6%) |
| $75,000 to $99,999 | 20,638 (14.2%) | 7,481 (11.5%) |
| $100,000 to $149,999 | 28,172 (19.4%) | 6,220 (9.5%) |
| $150,000 or more | 33,851 (23.4%) | 3,654 (5.6%) |
| Total | 145,000 (100.0%) | 65,349 (100.0%) |
Monthly Housing Cost Tiers in Greenville County
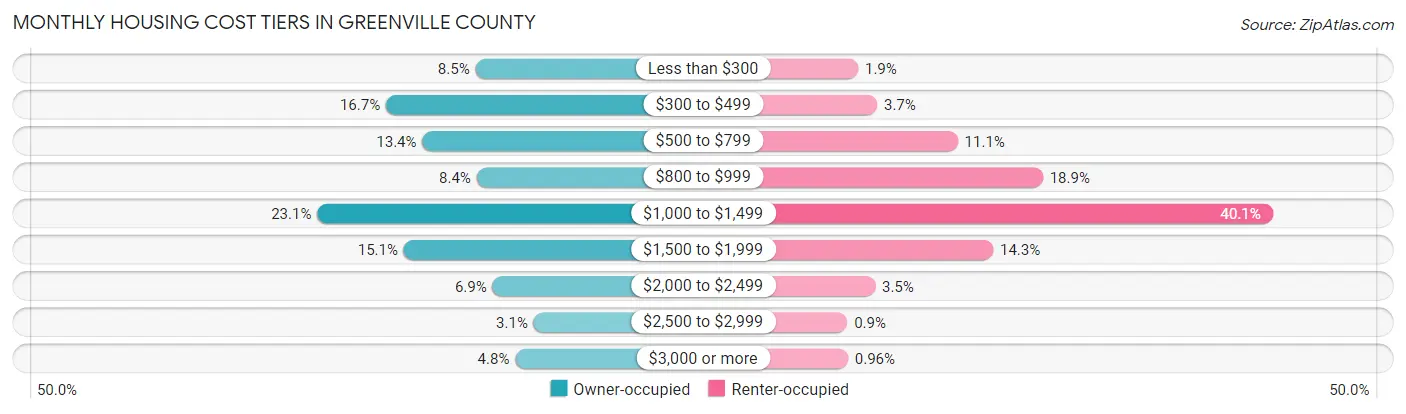
| Monthly Cost | Owner-occupied | Renter-occupied |
| Less than $300 | 12,305 (8.5%) | 1,241 (1.9%) |
| $300 to $499 | 24,258 (16.7%) | 2,387 (3.6%) |
| $500 to $799 | 19,402 (13.4%) | 7,233 (11.1%) |
| $800 to $999 | 12,145 (8.4%) | 12,350 (18.9%) |
| $1,000 to $1,499 | 33,442 (23.1%) | 26,177 (40.1%) |
| $1,500 to $1,999 | 21,877 (15.1%) | 9,366 (14.3%) |
| $2,000 to $2,499 | 10,036 (6.9%) | 2,259 (3.5%) |
| $2,500 to $2,999 | 4,534 (3.1%) | 589 (0.9%) |
| $3,000 or more | 7,001 (4.8%) | 630 (1.0%) |
| Total | 145,000 (100.0%) | 65,349 (100.0%) |
Physical Housing Characteristics in Greenville County
Housing Structures in Greenville County
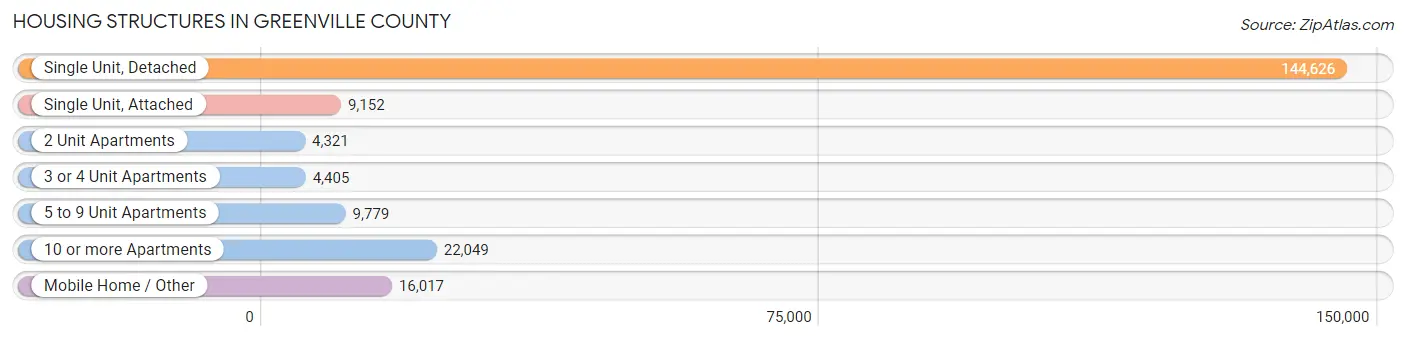
| Structure Type | # Housing Units | % Housing Units |
| Single Unit, Detached | 144,626 | 68.8% |
| Single Unit, Attached | 9,152 | 4.3% |
| 2 Unit Apartments | 4,321 | 2.1% |
| 3 or 4 Unit Apartments | 4,405 | 2.1% |
| 5 to 9 Unit Apartments | 9,779 | 4.6% |
| 10 or more Apartments | 22,049 | 10.5% |
| Mobile Home / Other | 16,017 | 7.6% |
| Total | 210,349 | 100.0% |
Housing Structures by Occupancy in Greenville County
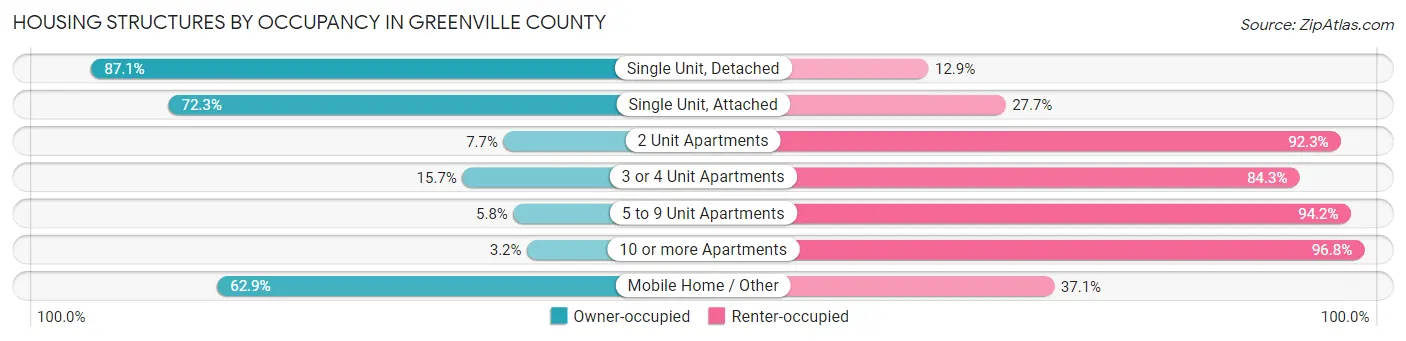
| Structure Type | Owner-occupied | Renter-occupied |
| Single Unit, Detached | 126,013 (87.1%) | 18,613 (12.9%) |
| Single Unit, Attached | 6,614 (72.3%) | 2,538 (27.7%) |
| 2 Unit Apartments | 334 (7.7%) | 3,987 (92.3%) |
| 3 or 4 Unit Apartments | 690 (15.7%) | 3,715 (84.3%) |
| 5 to 9 Unit Apartments | 571 (5.8%) | 9,208 (94.2%) |
| 10 or more Apartments | 705 (3.2%) | 21,344 (96.8%) |
| Mobile Home / Other | 10,073 (62.9%) | 5,944 (37.1%) |
| Total | 145,000 (68.9%) | 65,349 (31.1%) |
Housing Structures by Number of Rooms in Greenville County
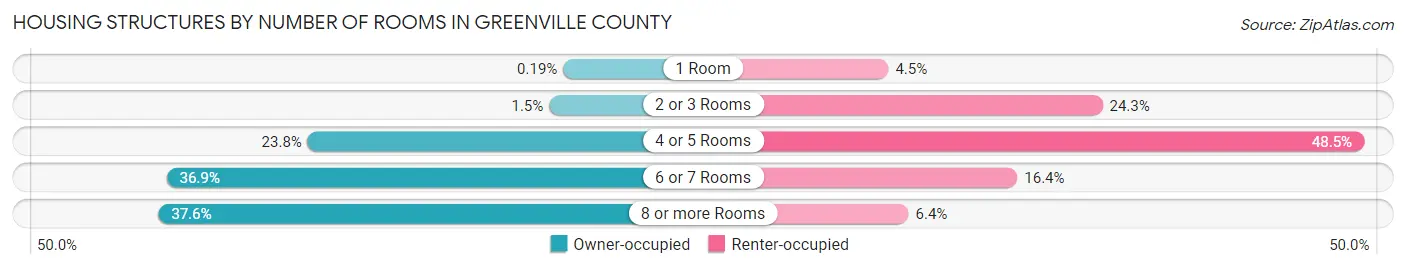
| Number of Rooms | Owner-occupied | Renter-occupied |
| 1 Room | 272 (0.2%) | 2,937 (4.5%) |
| 2 or 3 Rooms | 2,163 (1.5%) | 15,872 (24.3%) |
| 4 or 5 Rooms | 34,538 (23.8%) | 31,665 (48.5%) |
| 6 or 7 Rooms | 53,467 (36.9%) | 10,724 (16.4%) |
| 8 or more Rooms | 54,560 (37.6%) | 4,151 (6.4%) |
| Total | 145,000 (100.0%) | 65,349 (100.0%) |
Housing Structure by Heating Type in Greenville County
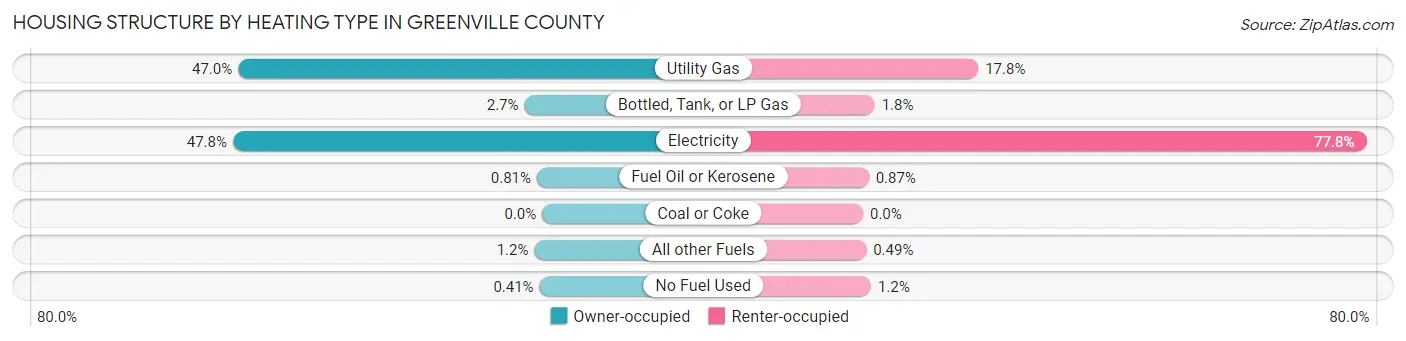
| Heating Type | Owner-occupied | Renter-occupied |
| Utility Gas | 68,162 (47.0%) | 11,639 (17.8%) |
| Bottled, Tank, or LP Gas | 3,979 (2.7%) | 1,185 (1.8%) |
| Electricity | 69,339 (47.8%) | 50,836 (77.8%) |
| Fuel Oil or Kerosene | 1,170 (0.8%) | 568 (0.9%) |
| Coal or Coke | 0 (0.0%) | 0 (0.0%) |
| All other Fuels | 1,749 (1.2%) | 318 (0.5%) |
| No Fuel Used | 601 (0.4%) | 803 (1.2%) |
| Total | 145,000 (100.0%) | 65,349 (100.0%) |
Household Vehicle Usage in Greenville County
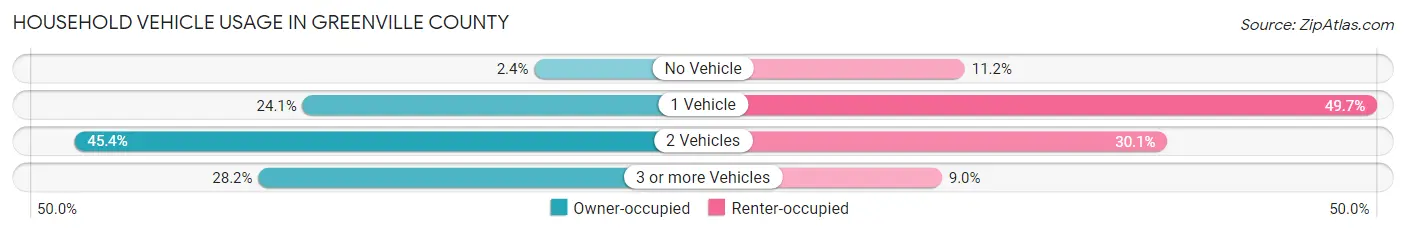
| Vehicles per Household | Owner-occupied | Renter-occupied |
| No Vehicle | 3,511 (2.4%) | 7,311 (11.2%) |
| 1 Vehicle | 34,870 (24.0%) | 32,460 (49.7%) |
| 2 Vehicles | 65,764 (45.4%) | 19,669 (30.1%) |
| 3 or more Vehicles | 40,855 (28.2%) | 5,909 (9.0%) |
| Total | 145,000 (100.0%) | 65,349 (100.0%) |
Real Estate & Mortgages in Greenville County
Real Estate and Mortgage Overview in Greenville County
| Characteristic | Without Mortgage | With Mortgage |
| Housing Units | 54,128 | 90,872 |
| Median Property Value | $218,700 | $265,600 |
| Median Household Income | $63,909 | $25,302 |
| Monthly Housing Costs | $420 | $6,819 |
| Real Estate Taxes | $1,175 | $1,612 |
Property Value by Mortgage Status in Greenville County
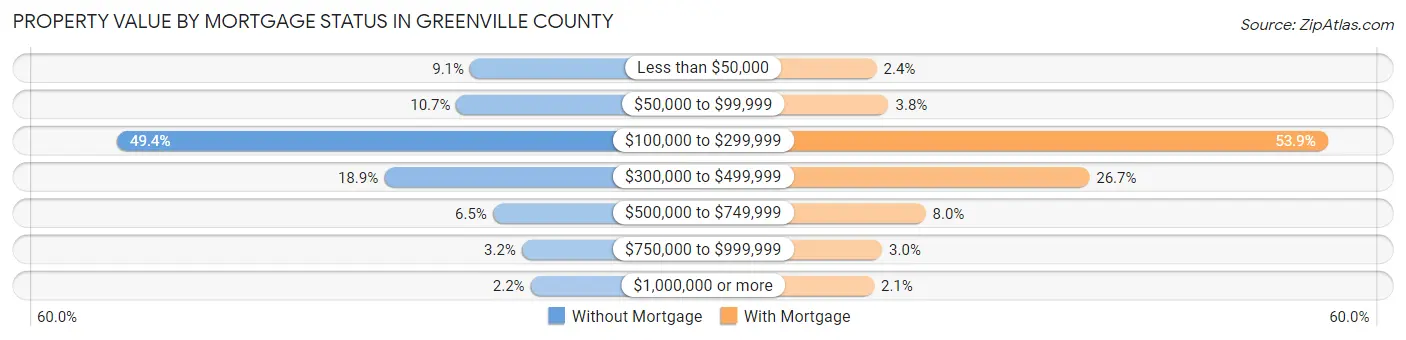
| Property Value | Without Mortgage | With Mortgage |
| Less than $50,000 | 4,929 (9.1%) | 2,189 (2.4%) |
| $50,000 to $99,999 | 5,772 (10.7%) | 3,437 (3.8%) |
| $100,000 to $299,999 | 26,752 (49.4%) | 49,019 (53.9%) |
| $300,000 to $499,999 | 10,244 (18.9%) | 24,268 (26.7%) |
| $500,000 to $749,999 | 3,517 (6.5%) | 7,279 (8.0%) |
| $750,000 to $999,999 | 1,728 (3.2%) | 2,767 (3.0%) |
| $1,000,000 or more | 1,186 (2.2%) | 1,913 (2.1%) |
| Total | 54,128 (100.0%) | 90,872 (100.0%) |
Household Income by Mortgage Status in Greenville County
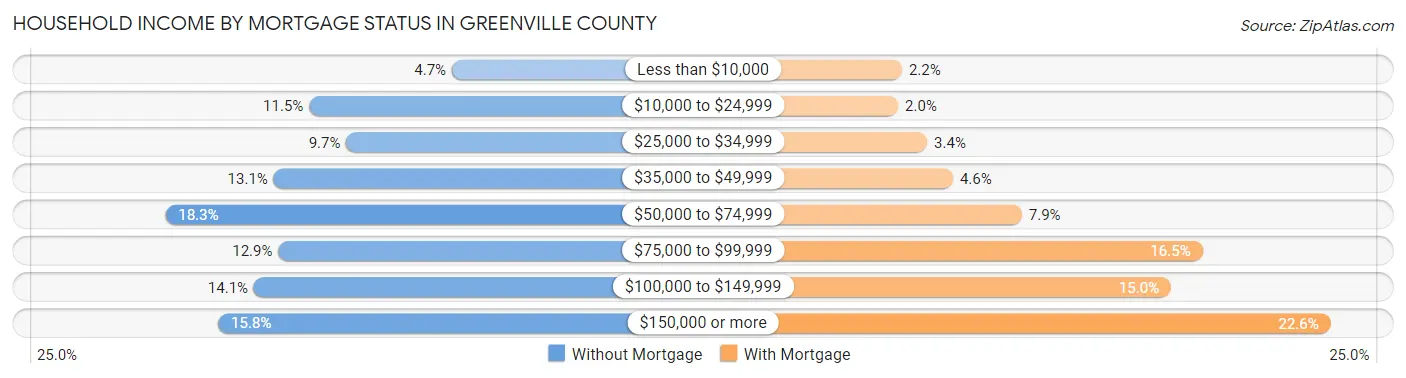
| Household Income | Without Mortgage | With Mortgage |
| Less than $10,000 | 2,517 (4.6%) | 2,008 (2.2%) |
| $10,000 to $24,999 | 6,200 (11.5%) | 1,842 (2.0%) |
| $25,000 to $34,999 | 5,237 (9.7%) | 3,099 (3.4%) |
| $35,000 to $49,999 | 7,110 (13.1%) | 4,221 (4.6%) |
| $50,000 to $74,999 | 9,905 (18.3%) | 7,198 (7.9%) |
| $75,000 to $99,999 | 6,991 (12.9%) | 15,010 (16.5%) |
| $100,000 to $149,999 | 7,619 (14.1%) | 13,647 (15.0%) |
| $150,000 or more | 8,549 (15.8%) | 20,553 (22.6%) |
| Total | 54,128 (100.0%) | 90,872 (100.0%) |
Property Value to Household Income Ratio in Greenville County
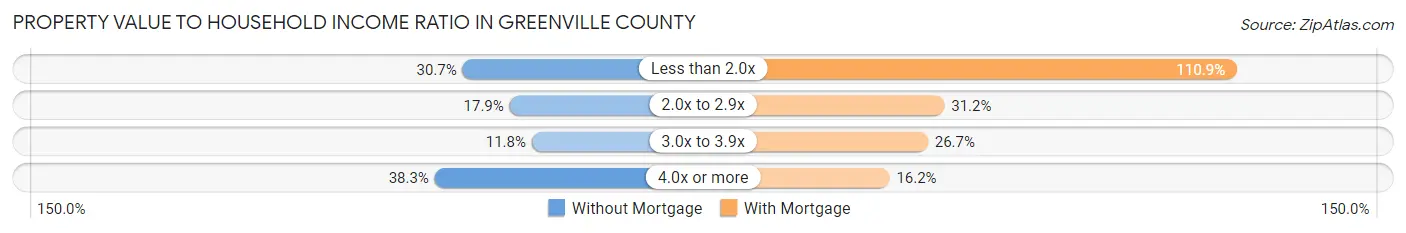
| Value-to-Income Ratio | Without Mortgage | With Mortgage |
| Less than 2.0x | 16,610 (30.7%) | 100,776 (110.9%) |
| 2.0x to 2.9x | 9,677 (17.9%) | 28,313 (31.2%) |
| 3.0x to 3.9x | 6,407 (11.8%) | 24,236 (26.7%) |
| 4.0x or more | 20,720 (38.3%) | 14,741 (16.2%) |
| Total | 54,128 (100.0%) | 90,872 (100.0%) |
Real Estate Taxes by Mortgage Status in Greenville County
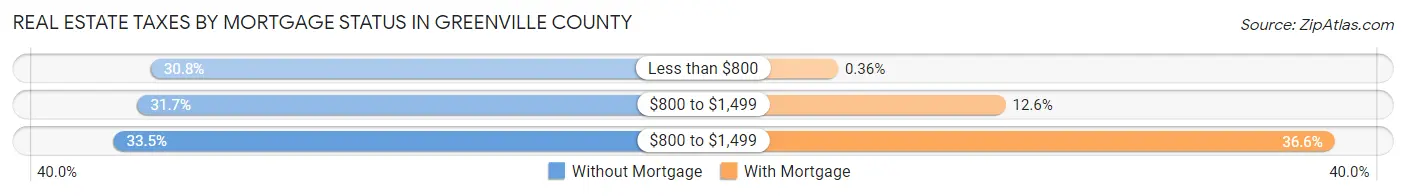
| Property Taxes | Without Mortgage | With Mortgage |
| Less than $800 | 16,657 (30.8%) | 329 (0.4%) |
| $800 to $1,499 | 17,179 (31.7%) | 11,450 (12.6%) |
| $800 to $1,499 | 18,129 (33.5%) | 33,293 (36.6%) |
| Total | 54,128 (100.0%) | 90,872 (100.0%) |
Health & Disability in Greenville County
Health Insurance Coverage by Age in Greenville County
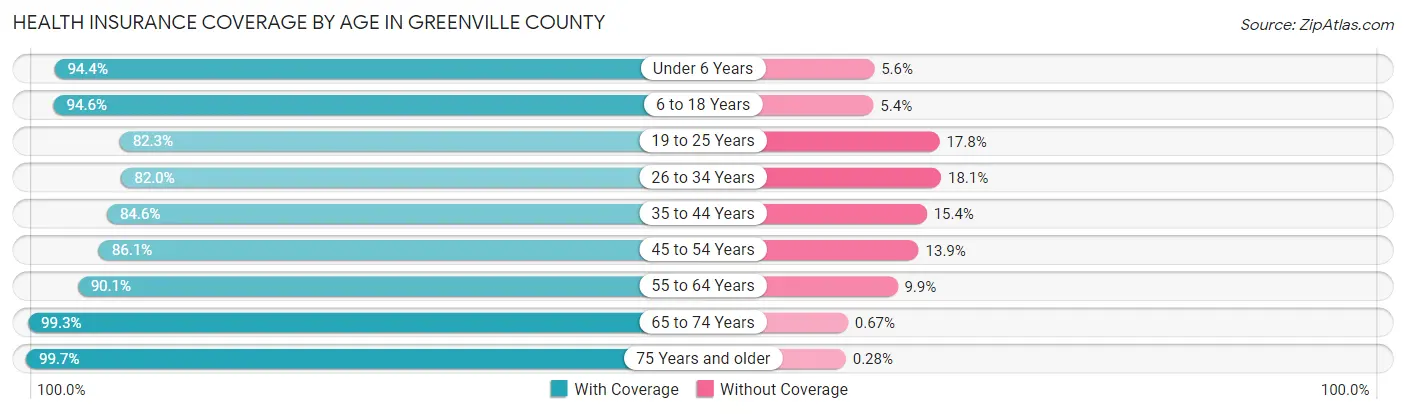
| Age Bracket | With Coverage | Without Coverage |
| Under 6 Years | 36,235 (94.4%) | 2,140 (5.6%) |
| 6 to 18 Years | 84,064 (94.6%) | 4,824 (5.4%) |
| 19 to 25 Years | 38,481 (82.3%) | 8,302 (17.7%) |
| 26 to 34 Years | 53,400 (82.0%) | 11,758 (18.0%) |
| 35 to 44 Years | 57,503 (84.6%) | 10,444 (15.4%) |
| 45 to 54 Years | 57,168 (86.1%) | 9,201 (13.9%) |
| 55 to 64 Years | 59,339 (90.1%) | 6,526 (9.9%) |
| 65 to 74 Years | 50,581 (99.3%) | 340 (0.7%) |
| 75 Years and older | 33,356 (99.7%) | 93 (0.3%) |
| Total | 470,127 (89.8%) | 53,628 (10.2%) |
Health Insurance Coverage by Citizenship Status in Greenville County
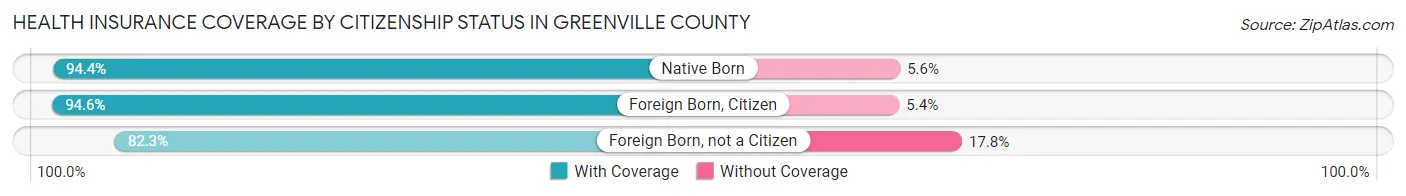
| Citizenship Status | With Coverage | Without Coverage |
| Native Born | 36,235 (94.4%) | 2,140 (5.6%) |
| Foreign Born, Citizen | 84,064 (94.6%) | 4,824 (5.4%) |
| Foreign Born, not a Citizen | 38,481 (82.3%) | 8,302 (17.7%) |
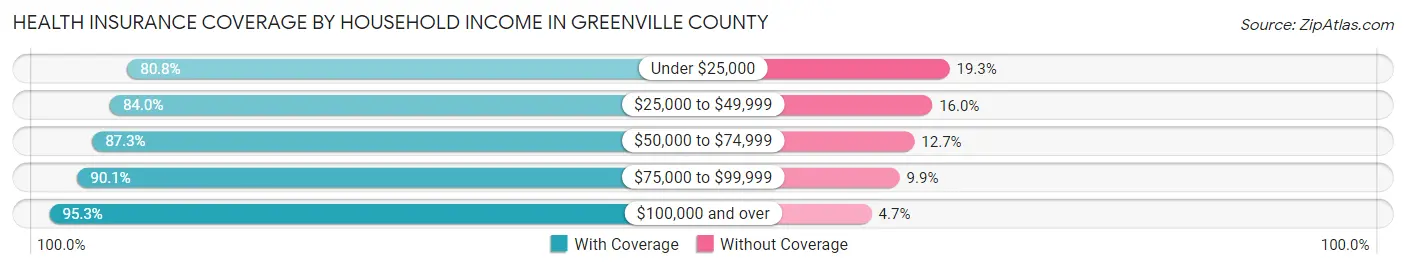
Health Insurance Coverage by Household Income in Greenville County
| Household Income | With Coverage | Without Coverage |
| Under $25,000 | 40,257 (80.7%) | 9,597 (19.3%) |
| $25,000 to $49,999 | 72,846 (84.0%) | 13,879 (16.0%) |
| $50,000 to $74,999 | 78,338 (87.3%) | 11,369 (12.7%) |
| $75,000 to $99,999 | 67,171 (90.1%) | 7,378 (9.9%) |
| $100,000 and over | 204,997 (95.3%) | 10,019 (4.7%) |
Public vs Private Health Insurance Coverage by Age in Greenville County
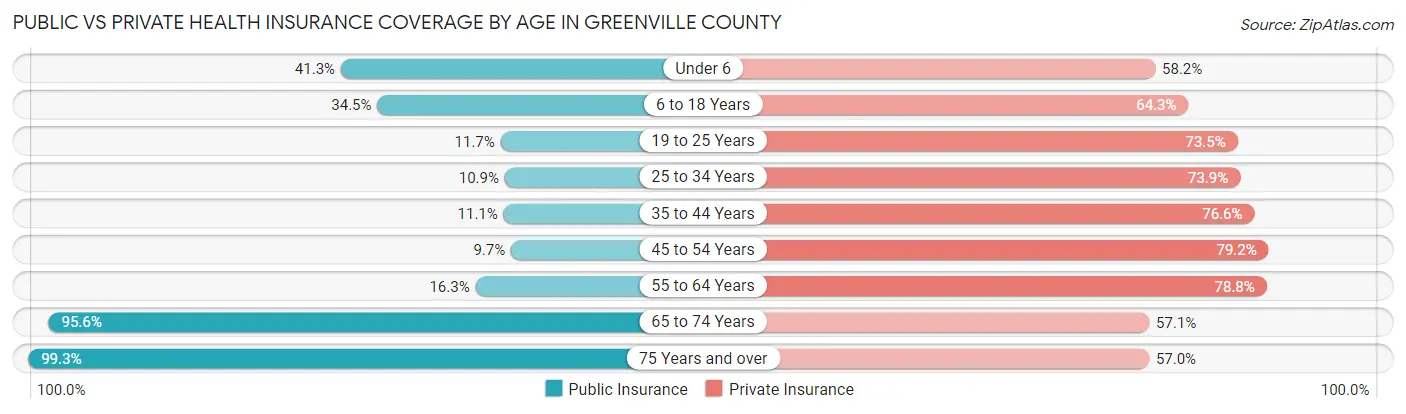
| Age Bracket | Public Insurance | Private Insurance |
| Under 6 | 15,844 (41.3%) | 22,320 (58.2%) |
| 6 to 18 Years | 30,684 (34.5%) | 57,172 (64.3%) |
| 19 to 25 Years | 5,451 (11.7%) | 34,360 (73.5%) |
| 25 to 34 Years | 7,083 (10.9%) | 48,156 (73.9%) |
| 35 to 44 Years | 7,532 (11.1%) | 52,027 (76.6%) |
| 45 to 54 Years | 6,445 (9.7%) | 52,564 (79.2%) |
| 55 to 64 Years | 10,744 (16.3%) | 51,929 (78.8%) |
| 65 to 74 Years | 48,655 (95.6%) | 29,049 (57.1%) |
| 75 Years and over | 33,223 (99.3%) | 19,069 (57.0%) |
| Total | 165,661 (31.6%) | 366,646 (70.0%) |
Disability Status by Sex by Age in Greenville County
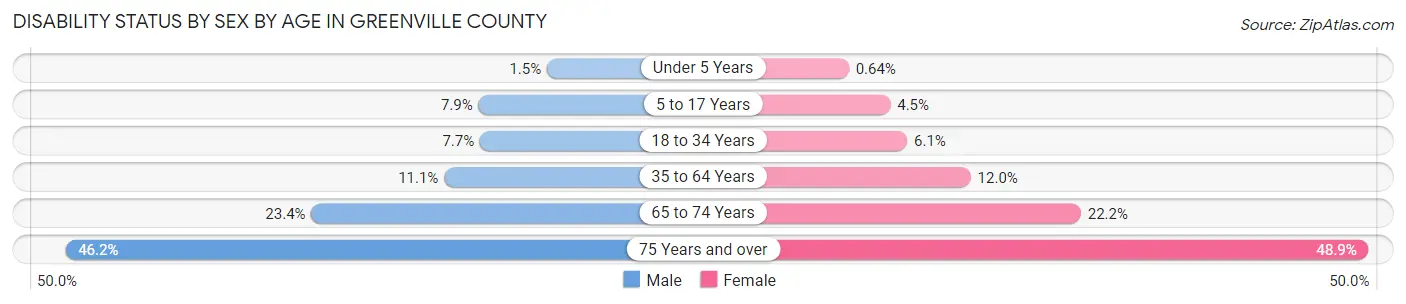
| Age Bracket | Male | Female |
| Under 5 Years | 249 (1.5%) | 97 (0.6%) |
| 5 to 17 Years | 3,542 (7.9%) | 1,963 (4.5%) |
| 18 to 34 Years | 4,513 (7.7%) | 3,658 (6.1%) |
| 35 to 64 Years | 10,792 (11.1%) | 12,264 (12.0%) |
| 65 to 74 Years | 5,456 (23.4%) | 6,118 (22.2%) |
| 75 Years and over | 6,425 (46.2%) | 9,558 (48.9%) |
Disability Class by Sex by Age in Greenville County
Disability Class: Hearing Difficulty
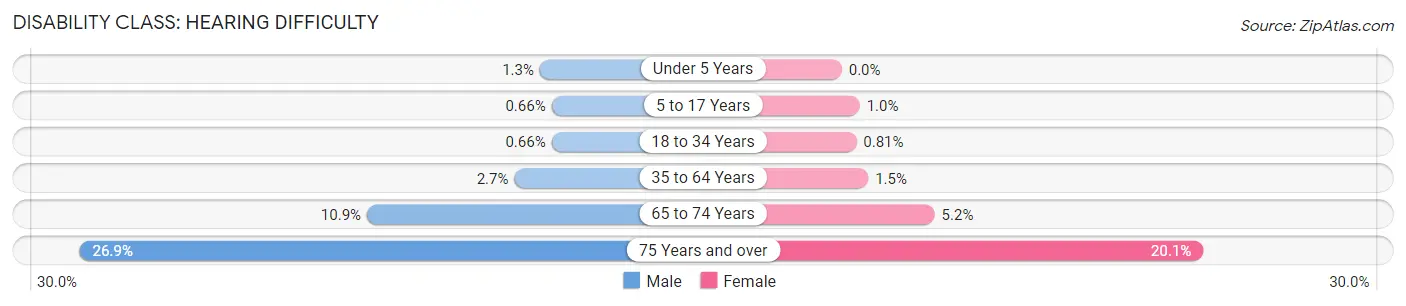
| Age Bracket | Male | Female |
| Under 5 Years | 217 (1.3%) | 0 (0.0%) |
| 5 to 17 Years | 295 (0.7%) | 436 (1.0%) |
| 18 to 34 Years | 387 (0.7%) | 486 (0.8%) |
| 35 to 64 Years | 2,666 (2.7%) | 1,506 (1.5%) |
| 65 to 74 Years | 2,554 (10.9%) | 1,425 (5.2%) |
| 75 Years and over | 3,744 (26.9%) | 3,933 (20.1%) |
Disability Class: Vision Difficulty
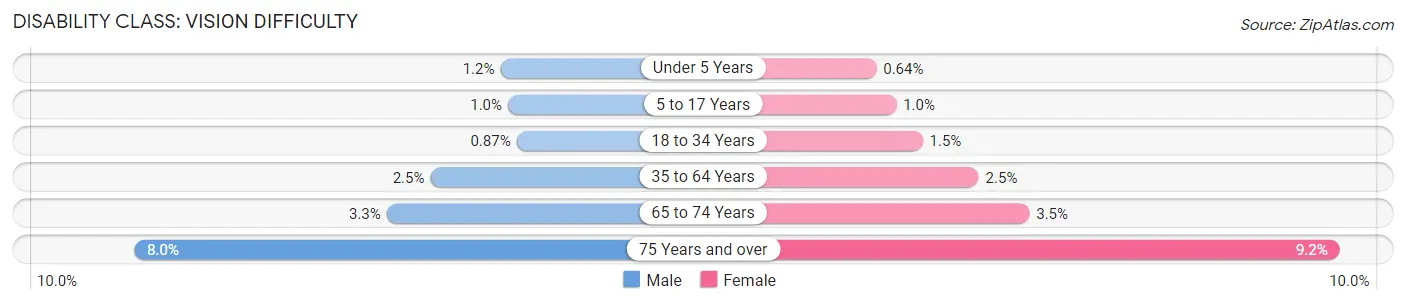
| Age Bracket | Male | Female |
| Under 5 Years | 193 (1.2%) | 97 (0.6%) |
| 5 to 17 Years | 463 (1.0%) | 440 (1.0%) |
| 18 to 34 Years | 508 (0.9%) | 906 (1.5%) |
| 35 to 64 Years | 2,415 (2.5%) | 2,603 (2.5%) |
| 65 to 74 Years | 765 (3.3%) | 961 (3.5%) |
| 75 Years and over | 1,107 (8.0%) | 1,807 (9.2%) |
Disability Class: Cognitive Difficulty
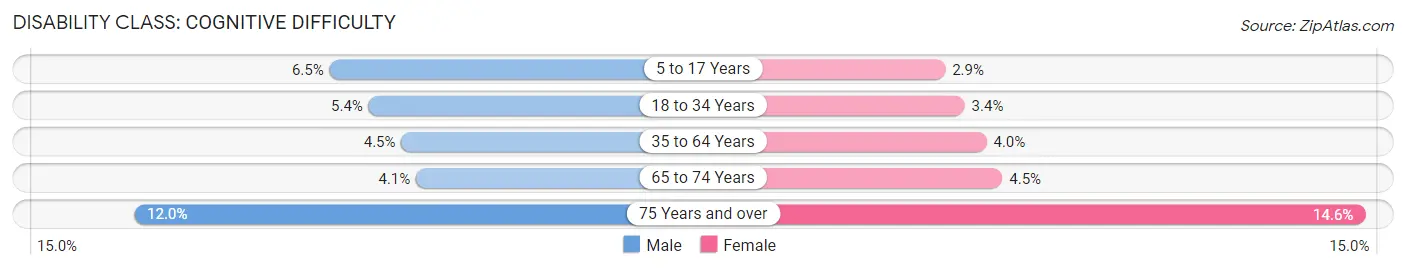
| Age Bracket | Male | Female |
| 5 to 17 Years | 2,930 (6.5%) | 1,258 (2.9%) |
| 18 to 34 Years | 3,163 (5.4%) | 2,063 (3.4%) |
| 35 to 64 Years | 4,400 (4.5%) | 4,136 (4.0%) |
| 65 to 74 Years | 956 (4.1%) | 1,233 (4.5%) |
| 75 Years and over | 1,661 (11.9%) | 2,848 (14.6%) |
Disability Class: Ambulatory Difficulty
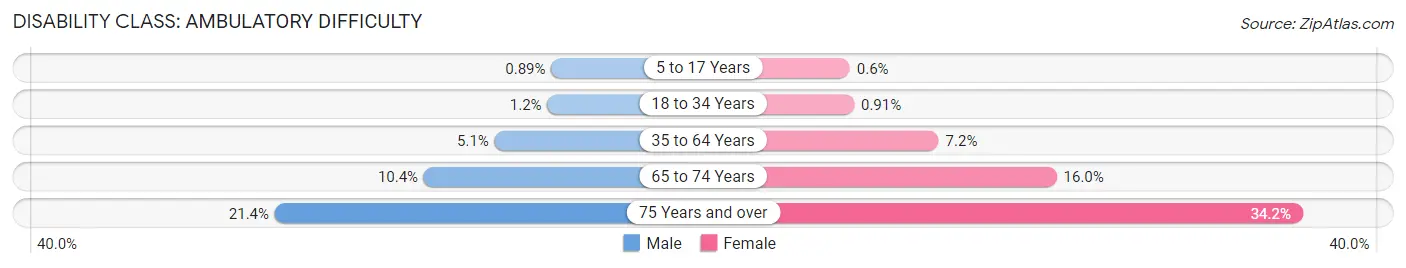
| Age Bracket | Male | Female |
| 5 to 17 Years | 400 (0.9%) | 263 (0.6%) |
| 18 to 34 Years | 691 (1.2%) | 551 (0.9%) |
| 35 to 64 Years | 4,981 (5.1%) | 7,376 (7.2%) |
| 65 to 74 Years | 2,416 (10.3%) | 4,400 (16.0%) |
| 75 Years and over | 2,977 (21.4%) | 6,691 (34.2%) |
Disability Class: Self-Care Difficulty
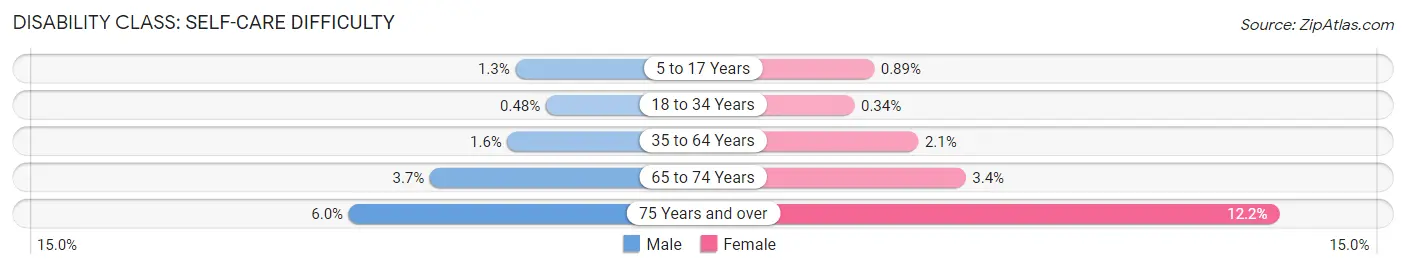
| Age Bracket | Male | Female |
| 5 to 17 Years | 599 (1.3%) | 388 (0.9%) |
| 18 to 34 Years | 280 (0.5%) | 206 (0.3%) |
| 35 to 64 Years | 1,512 (1.5%) | 2,173 (2.1%) |
| 65 to 74 Years | 867 (3.7%) | 948 (3.4%) |
| 75 Years and over | 830 (6.0%) | 2,381 (12.2%) |
Technology Access in Greenville County
Computing Device Access in Greenville County
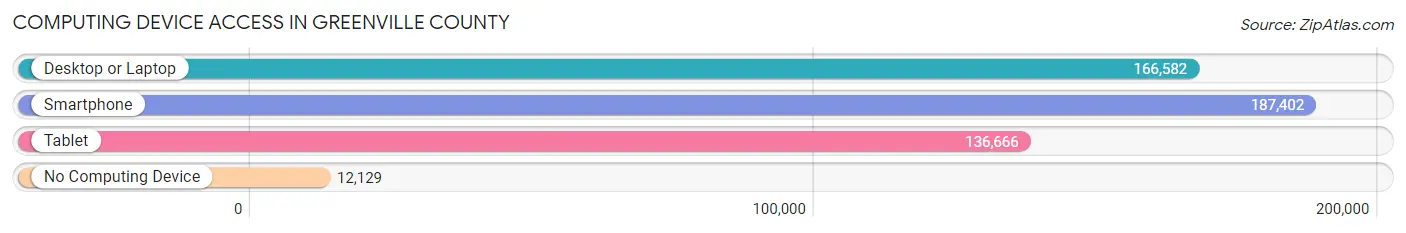
| Device Type | # Households | % Households |
| Desktop or Laptop | 166,582 | 79.2% |
| Smartphone | 187,402 | 89.1% |
| Tablet | 136,666 | 65.0% |
| No Computing Device | 12,129 | 5.8% |
| Total | 210,349 | 100.0% |
Internet Access in Greenville County
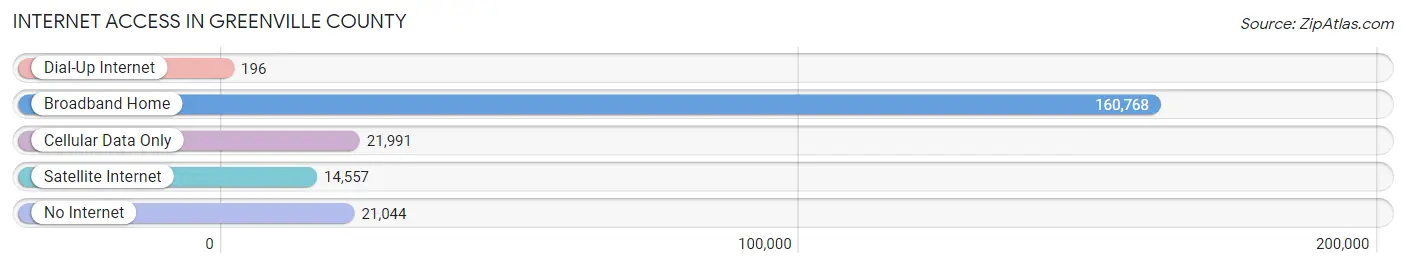
| Internet Type | # Households | % Households |
| Dial-Up Internet | 196 | 0.1% |
| Broadband Home | 160,768 | 76.4% |
| Cellular Data Only | 21,991 | 10.4% |
| Satellite Internet | 14,557 | 6.9% |
| No Internet | 21,044 | 10.0% |
| Total | 210,349 | 100.0% |
Greenville County Summary
Geography
Greenville County is located in the Upstate region of South Carolina, in the foothills of the Blue Ridge Mountains. It is bordered by Spartanburg County to the north, Laurens County to the east, Anderson County to the south, and Pickens County to the west. The county covers an area of 795 square miles, making it the largest county in South Carolina. The county is divided into two distinct regions: the Piedmont region in the east and the Blue Ridge region in the west. The Piedmont region is characterized by rolling hills and valleys, while the Blue Ridge region is characterized by steep mountains and deep gorges.
The county is home to several rivers, including the Saluda, Reedy, and Enoree Rivers. The Saluda River is the longest river in the county, flowing through the city of Greenville and into Lake Greenwood. The Reedy River is the second longest river in the county, flowing through the city of Greer and into Lake Hartwell. The Enoree River is the third longest river in the county, flowing through the city of Simpsonville and into Lake Jocassee.
The county is also home to several lakes, including Lake Jocassee, Lake Hartwell, and Lake Greenwood. Lake Jocassee is the largest lake in the county, covering an area of over 7,500 acres. Lake Hartwell is the second largest lake in the county, covering an area of over 6,500 acres. Lake Greenwood is the third largest lake in the county, covering an area of over 5,000 acres.
History
Greenville County was established in 1786, making it one of the oldest counties in South Carolina. The county was named after General Nathanael Greene, a Revolutionary War hero. The county was originally part of the Ninety-Six District, which was created in 1769. The county seat is located in the city of Greenville, which was founded in 1786.
The county was originally home to the Cherokee and Catawba Native American tribes. The first European settlers arrived in the area in the late 1700s. The county was largely agricultural in the early 1800s, with cotton and tobacco being the main crops. The county experienced a period of growth and prosperity in the late 1800s and early 1900s, with the development of the textile industry. The county was also home to several military bases during World War II, including the Greenville Army Air Base and the Greenville Naval Air Station.
Economy
Greenville County has a diverse economy, with a mix of manufacturing, technology, and service industries. The county is home to several major employers, including Michelin North America, Fluor Corporation, and BMW Manufacturing. The county is also home to several universities and colleges, including Furman University, Clemson University, and the University of South Carolina Upstate.
The county is also home to several tourist attractions, including the Greenville Zoo, Falls Park on the Reedy, and the Greenville County Museum of Art. The county is also home to several wineries and breweries, including the Swamp Rabbit Brewery and the Thomas Creek Brewery.
Demographics
As of the 2010 census, Greenville County had a population of 451,225. The population is made up of a diverse mix of races and ethnicities, including White (68.2%), African American (21.2%), Hispanic or Latino (7.2%), Asian (2.2%), and Native American (0.5%). The median household income in the county is $50,867, and the median home value is $179,400. The county has a poverty rate of 14.2%.
Conclusion
Greenville County is a large county located in the Upstate region of South Carolina. It is home to several rivers, lakes, and mountains, and is home to a diverse mix of races and ethnicities. The county has a diverse economy, with a mix of manufacturing, technology, and service industries. The county is also home to several tourist attractions, universities, and wineries. The population of the county is 451,225, with a median household income of $50,867 and a median home value of $179,400.
Common Questions
What is Per Capita Income in Greenville County?
Per Capita income in Greenville County is $40,427.
What is the Median Family Income in Greenville County?
Median Family Income in Greenville County is $88,767.
What is the Median Household income in Greenville County?
Median Household Income in Greenville County is $71,328.
What is Income or Wage Gap in Greenville County?
Income or Wage Gap in Greenville County is 30.9%.
Women in Greenville County earn 69.1 cents for every dollar earned by a man.
What is Family Income Deficit in Greenville County?
Family Income Deficit in Greenville County is $11,206.
Families that are below poverty line in Greenville County earn $11,206 less on average than the poverty threshold level.
What is Inequality or Gini Index in Greenville County?
Inequality or Gini Index in Greenville County is 0.47.
What is the Total Population of Greenville County?
Total Population of Greenville County is 528,251.
What is the Total Male Population of Greenville County?
Total Male Population of Greenville County is 257,714.
What is the Total Female Population of Greenville County?
Total Female Population of Greenville County is 270,537.
What is the Ratio of Males per 100 Females in Greenville County?
There are 95.26 Males per 100 Females in Greenville County.
What is the Ratio of Females per 100 Males in Greenville County?
There are 104.98 Females per 100 Males in Greenville County.
What is the Median Population Age in Greenville County?
Median Population Age in Greenville County is 38.5 Years.
What is the Average Family Size in Greenville County
Average Family Size in Greenville County is 3.0 People.
What is the Average Household Size in Greenville County
Average Household Size in Greenville County is 2.5 People.
How Large is the Labor Force in Greenville County?
There are 273,820 People in the Labor Forcein in Greenville County.
What is the Percentage of People in the Labor Force in Greenville County?
64.9% of People are in the Labor Force in Greenville County.
What is the Unemployment Rate in Greenville County?
Unemployment Rate in Greenville County is 4.1%.