Cities with the Highest Percentage of Tohono O'Odham Population in the United States
RELATED REPORTS & OPTIONS
Tohono O'Odham
United States
Compare Cities
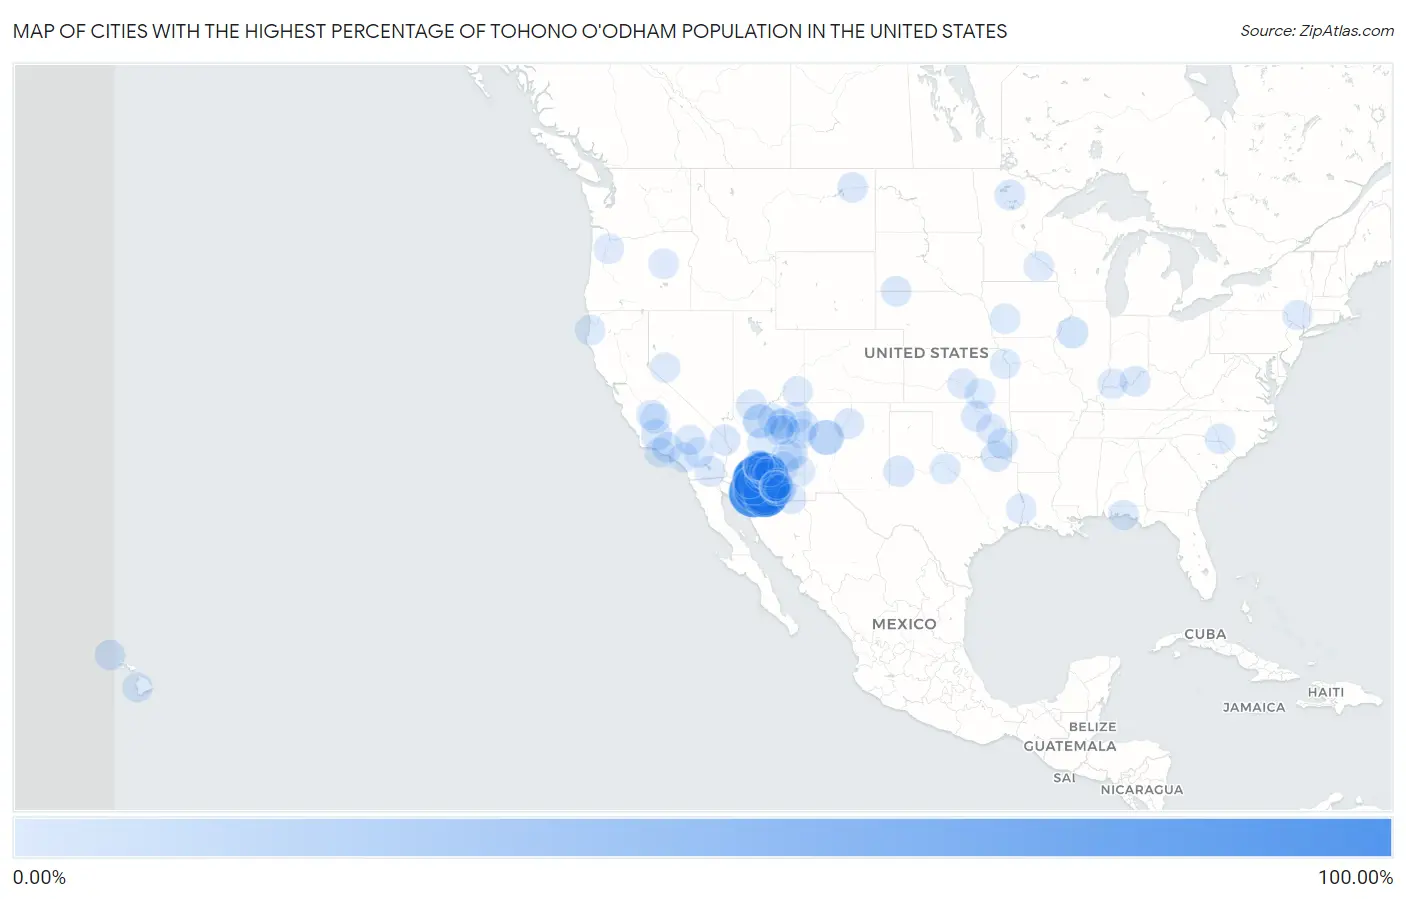
Map of Cities with the Highest Percentage of Tohono O'Odham Population in the United States
0.00%
100.00%
Cities with the Highest Percentage of Tohono O'Odham Population in the United States
| City | Tohono O'Odham | vs State | vs National | |
| 1. | Haivana Nakya | 100.00% | 0.28%(+99.7)#1 | 0.0081%(+100.0)#1 |
| 2. | Vaiva Vo | 100.00% | 0.28%(+99.7)#2 | 0.0081%(+100.0)#2 |
| 3. | Ventana | 100.00% | 0.28%(+99.7)#3 | 0.0081%(+100.0)#3 |
| 4. | Ali Chuk | 100.00% | 0.28%(+99.7)#4 | 0.0081%(+100.0)#4 |
| 5. | Anegam | 100.00% | 0.28%(+99.7)#5 | 0.0081%(+100.0)#5 |
| 6. | Chiawuli Tak | 100.00% | 0.28%(+99.7)#6 | 0.0081%(+100.0)#6 |
| 7. | Ali Chukson | 100.00% | 0.28%(+99.7)#7 | 0.0081%(+100.0)#7 |
| 8. | Maish Vaya | 100.00% | 0.28%(+99.7)#8 | 0.0081%(+100.0)#8 |
| 9. | Wahak Hotrontk | 100.00% | 0.28%(+99.7)#9 | 0.0081%(+100.0)#9 |
| 10. | Ko Vaya | 100.00% | 0.28%(+99.7)#10 | 0.0081%(+100.0)#10 |
| 11. | Kaka | 100.00% | 0.28%(+99.7)#11 | 0.0081%(+100.0)#11 |
| 12. | Gu Oidak | 90.37% | 0.28%(+90.1)#12 | 0.0081%(+90.4)#12 |
| 13. | Topawa | 89.12% | 0.28%(+88.8)#13 | 0.0081%(+89.1)#13 |
| 14. | Pisinemo | 88.67% | 0.28%(+88.4)#14 | 0.0081%(+88.7)#14 |
| 15. | Chuichu | 83.33% | 0.28%(+83.0)#15 | 0.0081%(+83.3)#15 |
| 16. | Sells | 78.94% | 0.28%(+78.7)#16 | 0.0081%(+78.9)#16 |
| 17. | San Miguel | 74.20% | 0.28%(+73.9)#17 | 0.0081%(+74.2)#17 |
| 18. | Ali Molina | 69.32% | 0.28%(+69.0)#18 | 0.0081%(+69.3)#18 |
| 19. | Santa Rosa | 66.49% | 0.28%(+66.2)#19 | 0.0081%(+66.5)#19 |
| 20. | South Komelik | 66.27% | 0.28%(+66.0)#20 | 0.0081%(+66.3)#20 |
| 21. | Charco | 47.62% | 0.28%(+47.3)#21 | 0.0081%(+47.6)#21 |
| 22. | Stanfield | 27.13% | 0.28%(+26.8)#22 | 0.0081%(+27.1)#22 |
| 23. | Seama | 22.96% | 0.012%(+22.9)#1 | 0.0081%(+23.0)#23 |
| 24. | Tusayan | 18.02% | 0.28%(+17.7)#23 | 0.0081%(+18.0)#24 |
| 25. | Ajo | 6.78% | 0.28%(+6.49)#24 | 0.0081%(+6.77)#25 |
| 26. | South Tucson | 6.61% | 0.28%(+6.33)#25 | 0.0081%(+6.61)#26 |
| 27. | Gilson | 6.61% | 0.00045%(+6.61)#1 | 0.0081%(+6.60)#27 |
| 28. | Upper Santan Village | 6.28% | 0.28%(+5.99)#26 | 0.0081%(+6.27)#28 |
| 29. | Cedar Creek | 5.81% | 0.28%(+5.52)#27 | 0.0081%(+5.80)#29 |
| 30. | Gila Crossing | 5.18% | 0.28%(+4.90)#28 | 0.0081%(+5.17)#30 |
| 31. | Ak Chin Village | 4.50% | 0.28%(+4.21)#29 | 0.0081%(+4.49)#31 |
| 32. | Ford City | 3.44% | 0.0091%(+3.43)#1 | 0.0081%(+3.43)#32 |
| 33. | Wellman | 3.42% | 0.0013%(+3.42)#1 | 0.0081%(+3.41)#33 |
| 34. | Grant | 3.24% | 0.0014%(+3.24)#1 | 0.0081%(+3.23)#34 |
| 35. | Albion | 3.03% | 0.0014%(+3.03)#2 | 0.0081%(+3.02)#35 |
| 36. | Window Rock | 2.48% | 0.28%(+2.20)#30 | 0.0081%(+2.47)#36 |
| 37. | Summit | 2.29% | 0.28%(+2.01)#31 | 0.0081%(+2.28)#37 |
| 38. | Punaluu | 2.18% | 0.0049%(+2.18)#1 | 0.0081%(+2.17)#38 |
| 39. | Val Verde | 2.10% | 0.0091%(+2.09)#2 | 0.0081%(+2.09)#39 |
| 40. | Blackduck | 2.07% | 0.0011%(+2.07)#1 | 0.0081%(+2.07)#40 |
| 41. | Westmorland | 1.94% | 0.0091%(+1.93)#3 | 0.0081%(+1.93)#41 |
| 42. | Mcnary | 1.94% | 0.28%(+1.65)#32 | 0.0081%(+1.93)#42 |
| 43. | St Johns | 1.88% | 0.28%(+1.60)#33 | 0.0081%(+1.87)#43 |
| 44. | Glencoe | 1.66% | 0.0014%(+1.66)#3 | 0.0081%(+1.66)#44 |
| 45. | Arizona Village | 1.59% | 0.28%(+1.30)#34 | 0.0081%(+1.58)#45 |
| 46. | Kaibab | 1.48% | 0.28%(+1.20)#35 | 0.0081%(+1.47)#46 |
| 47. | Peak Place | 1.48% | 0.012%(+1.47)#2 | 0.0081%(+1.47)#47 |
| 48. | Maricopa Colony | 1.46% | 0.28%(+1.18)#36 | 0.0081%(+1.46)#48 |
| 49. | Pine Ridge | 1.44% | 0.0047%(+1.43)#1 | 0.0081%(+1.43)#49 |
| 50. | Chinle | 1.31% | 0.28%(+1.03)#37 | 0.0081%(+1.30)#50 |
| 51. | Wolf Point | 1.25% | 0.0039%(+1.25)#1 | 0.0081%(+1.24)#51 |
| 52. | Casa Grande | 1.15% | 0.28%(+0.864)#38 | 0.0081%(+1.14)#52 |
| 53. | Shively | 1.10% | 0.0057%(+1.10)#1 | 0.0081%(+1.09)#53 |
| 54. | Eloy | 1.03% | 0.28%(+0.748)#39 | 0.0081%(+1.02)#54 |
| 55. | Kykotsmovi Village | 1.01% | 0.28%(+0.730)#40 | 0.0081%(+1.01)#55 |
| 56. | Chandler | 0.99% | 0.00075%(+0.992)#1 | 0.0081%(+0.985)#56 |
| 57. | Latham | 0.98% | 0.0070%(+0.973)#1 | 0.0081%(+0.972)#57 |
| 58. | Shongopovi | 0.96% | 0.28%(+0.671)#41 | 0.0081%(+0.948)#58 |
| 59. | Coolidge | 0.94% | 0.28%(+0.654)#42 | 0.0081%(+0.930)#59 |
| 60. | Cottonwood | 0.90% | 0.28%(+0.617)#43 | 0.0081%(+0.893)#60 |
| 61. | Houck | 0.90% | 0.28%(+0.616)#44 | 0.0081%(+0.893)#61 |
| 62. | Tuba City | 0.82% | 0.28%(+0.540)#45 | 0.0081%(+0.816)#62 |
| 63. | Yucca Valley | 0.82% | 0.0091%(+0.811)#4 | 0.0081%(+0.812)#63 |
| 64. | Hubbard | 0.79% | 0.0020%(+0.786)#1 | 0.0081%(+0.780)#64 |
| 65. | Grayson | 0.76% | 0.0014%(+0.756)#4 | 0.0081%(+0.749)#65 |
| 66. | Tucson | 0.72% | 0.28%(+0.437)#46 | 0.0081%(+0.714)#66 |
| 67. | Port Hueneme | 0.72% | 0.0091%(+0.709)#5 | 0.0081%(+0.711)#67 |
| 68. | Drexel Heights | 0.72% | 0.28%(+0.433)#47 | 0.0081%(+0.709)#68 |
| 69. | Schurz | 0.67% | 0.0029%(+0.667)#1 | 0.0081%(+0.662)#69 |
| 70. | Tees Toh | 0.66% | 0.28%(+0.379)#48 | 0.0081%(+0.656)#70 |
| 71. | Guadalupe | 0.66% | 0.28%(+0.371)#49 | 0.0081%(+0.648)#71 |
| 72. | Tolani Lake | 0.61% | 0.28%(+0.323)#50 | 0.0081%(+0.599)#72 |
| 73. | Valencia West | 0.58% | 0.28%(+0.300)#51 | 0.0081%(+0.576)#73 |
| 74. | Sahuarita | 0.56% | 0.28%(+0.276)#52 | 0.0081%(+0.553)#74 |
| 75. | Throckmorton | 0.56% | 0.0013%(+0.554)#2 | 0.0081%(+0.547)#75 |
| 76. | Morenci | 0.55% | 0.28%(+0.261)#53 | 0.0081%(+0.537)#76 |
| 77. | Exira | 0.47% | 0.00013%(+0.472)#1 | 0.0081%(+0.464)#77 |
| 78. | Vail | 0.42% | 0.28%(+0.135)#54 | 0.0081%(+0.412)#78 |
| 79. | Captain Cook | 0.41% | 0.0049%(+0.406)#2 | 0.0081%(+0.403)#79 |
| 80. | San Carlos | 0.41% | 0.28%(+0.124)#55 | 0.0081%(+0.401)#80 |
| 81. | Newton | 0.40% | 0.0013%(+0.399)#3 | 0.0081%(+0.393)#81 |
| 82. | Home Gardens | 0.40% | 0.0091%(+0.390)#6 | 0.0081%(+0.391)#82 |
| 83. | Corcoran | 0.39% | 0.0091%(+0.377)#7 | 0.0081%(+0.378)#83 |
| 84. | John Day | 0.38% | 0.0020%(+0.382)#2 | 0.0081%(+0.376)#84 |
| 85. | Mckinleyville | 0.38% | 0.0091%(+0.369)#8 | 0.0081%(+0.370)#85 |
| 86. | Corona De Tucson | 0.38% | 0.28%(+0.093)#56 | 0.0081%(+0.369)#86 |
| 87. | Barstow | 0.35% | 0.0091%(+0.344)#9 | 0.0081%(+0.345)#87 |
| 88. | Ocean City | 0.34% | 0.00030%(+0.344)#1 | 0.0081%(+0.336)#88 |
| 89. | Mazeppa | 0.33% | 0.0011%(+0.332)#2 | 0.0081%(+0.325)#89 |
| 90. | Florence | 0.31% | 0.28%(+0.030)#57 | 0.0081%(+0.306)#90 |
| 91. | Hutchinson | 0.31% | 0.0070%(+0.298)#2 | 0.0081%(+0.297)#91 |
| 92. | Bisbee | 0.30% | 0.28%(+0.017)#58 | 0.0081%(+0.294)#92 |
| 93. | Catalina Foothills | 0.29% | 0.28%(+0.008)#59 | 0.0081%(+0.285)#93 |
| 94. | Tolleson | 0.29% | 0.28%(+0.006)#60 | 0.0081%(+0.283)#94 |
| 95. | Lemoore | 0.27% | 0.0091%(+0.258)#10 | 0.0081%(+0.259)#95 |
| 96. | Napanoch | 0.24% | 0.00044%(+0.237)#1 | 0.0081%(+0.229)#96 |
| 97. | Rockingham | 0.23% | 0.00053%(+0.228)#1 | 0.0081%(+0.221)#97 |
| 98. | Tucson Estates | 0.22% | 0.28%(-0.066)#61 | 0.0081%(+0.211)#98 |
| 99. | Basehor | 0.21% | 0.0070%(+0.207)#3 | 0.0081%(+0.206)#99 |
| 100. | Blanding | 0.21% | 0.00064%(+0.209)#1 | 0.0081%(+0.201)#100 |
Common Questions
What are the Top 10 Cities with the Highest Percentage of Tohono O'Odham Population in the United States?
Top 10 Cities with the Highest Percentage of Tohono O'Odham Population in the United States are:
#1
100.00%
#2
100.00%
#3
100.00%
#4
100.00%
#5
100.00%
#6
100.00%
#7
100.00%
#8
100.00%
#9
100.00%
#10
100.00%
What city has the Highest Percentage of Tohono O'Odham Population in the United States?
Haivana Nakya has the Highest Percentage of Tohono O'Odham Population in the United States with 100.00%.
What is the Percentage of Tohono O'Odham Population in the United States?
Percentage of Tohono O'Odham Population in the United States is 0.0081%.