Laurens County, SC Map & Demographics
Laurens County Map
Laurens County Overview
$27,221
PER CAPITA INCOME
$65,689
AVG FAMILY INCOME
$52,077
AVG HOUSEHOLD INCOME
22.3%
WAGE / INCOME GAP [ % ]
77.7¢/ $1
WAGE / INCOME GAP [ $ ]
$11,293
FAMILY INCOME DEFICIT
0.45
INEQUALITY / GINI INDEX
67,456
TOTAL POPULATION
33,111
MALE POPULATION
34,345
FEMALE POPULATION
96.41
MALES / 100 FEMALES
103.73
FEMALES / 100 MALES
41.2
MEDIAN AGE
3.1
AVG FAMILY SIZE
2.5
AVG HOUSEHOLD SIZE
30,934
LABOR FORCE [ PEOPLE ]
57.0%
PERCENT IN LABOR FORCE
5.2%
UNEMPLOYMENT RATE
Laurens County Area Codes
Income in Laurens County
Income Overview in Laurens County
Per Capita Income in Laurens County is $27,221, while median incomes of families and households are $65,689 and $52,077 respectively.
| Characteristic | Number | Measure |
| Per Capita Income | 67,456 | $27,221 |
| Median Family Income | 17,357 | $65,689 |
| Mean Family Income | 17,357 | $81,673 |
| Median Household Income | 25,757 | $52,077 |
| Mean Household Income | 25,757 | $69,159 |
| Income Deficit | 17,357 | $11,293 |
| Wage / Income Gap (%) | 67,456 | 22.33% |
| Wage / Income Gap ($) | 67,456 | 77.67¢ per $1 |
| Gini / Inequality Index | 67,456 | 0.45 |
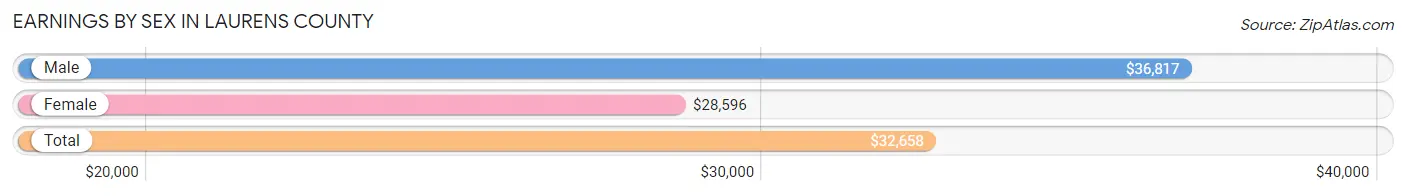
Earnings by Sex in Laurens County
Average Earnings in Laurens County are $32,658, $36,817 for men and $28,596 for women, a difference of 22.3%.
| Sex | Number | Average Earnings |
| Male | 16,556 (51.0%) | $36,817 |
| Female | 15,892 (49.0%) | $28,596 |
| Total | 32,448 (100.0%) | $32,658 |
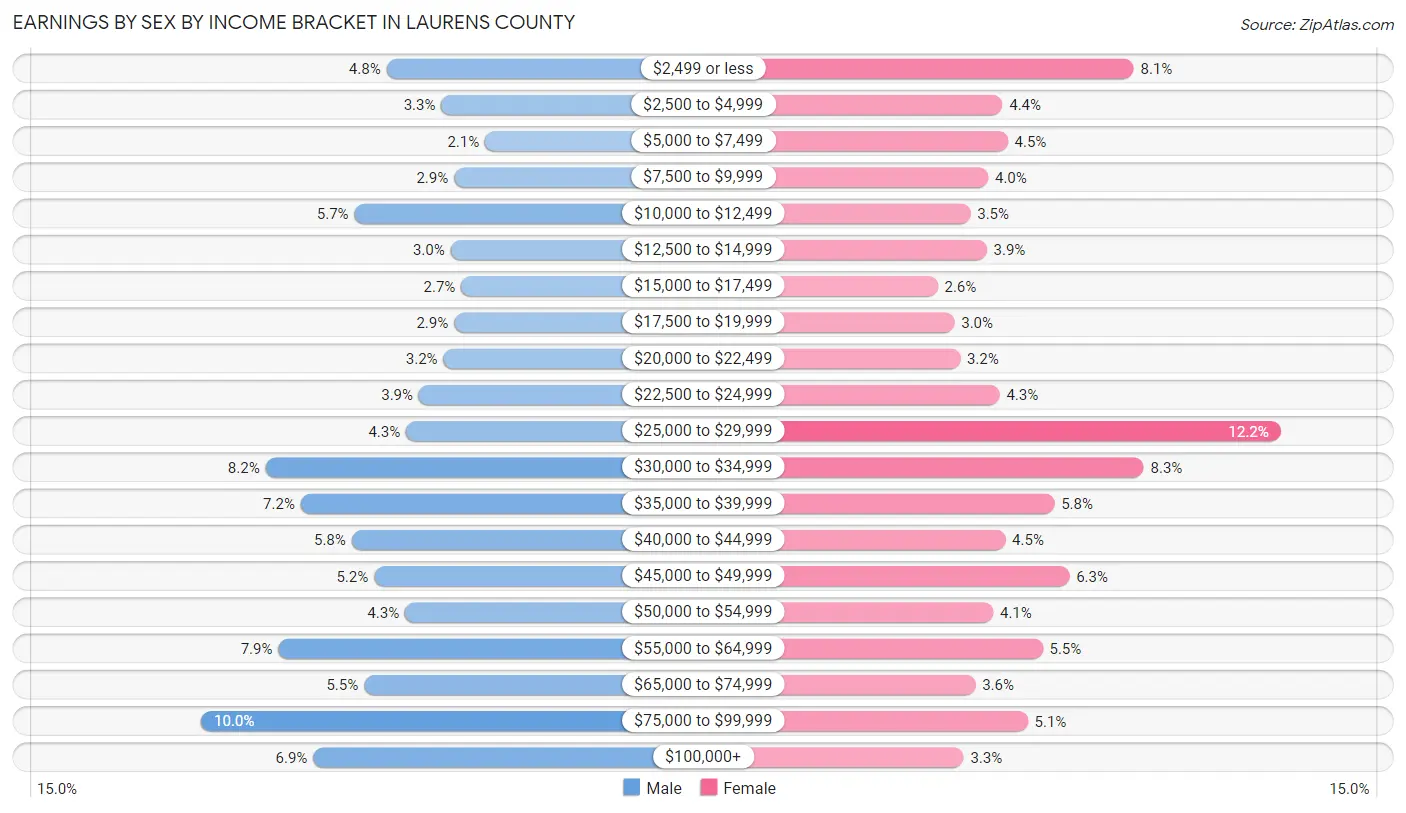
Earnings by Sex by Income Bracket in Laurens County
The most common earnings brackets in Laurens County are $75,000 to $99,999 for men (1,663 | 10.0%) and $25,000 to $29,999 for women (1,937 | 12.2%).
| Income | Male | Female |
| $2,499 or less | 799 (4.8%) | 1,281 (8.1%) |
| $2,500 to $4,999 | 545 (3.3%) | 695 (4.4%) |
| $5,000 to $7,499 | 341 (2.1%) | 718 (4.5%) |
| $7,500 to $9,999 | 485 (2.9%) | 631 (4.0%) |
| $10,000 to $12,499 | 949 (5.7%) | 551 (3.5%) |
| $12,500 to $14,999 | 501 (3.0%) | 625 (3.9%) |
| $15,000 to $17,499 | 452 (2.7%) | 406 (2.5%) |
| $17,500 to $19,999 | 485 (2.9%) | 480 (3.0%) |
| $20,000 to $22,499 | 534 (3.2%) | 506 (3.2%) |
| $22,500 to $24,999 | 649 (3.9%) | 682 (4.3%) |
| $25,000 to $29,999 | 709 (4.3%) | 1,937 (12.2%) |
| $30,000 to $34,999 | 1,363 (8.2%) | 1,325 (8.3%) |
| $35,000 to $39,999 | 1,199 (7.2%) | 927 (5.8%) |
| $40,000 to $44,999 | 962 (5.8%) | 707 (4.4%) |
| $45,000 to $49,999 | 858 (5.2%) | 993 (6.2%) |
| $50,000 to $54,999 | 714 (4.3%) | 653 (4.1%) |
| $55,000 to $64,999 | 1,303 (7.9%) | 874 (5.5%) |
| $65,000 to $74,999 | 904 (5.5%) | 573 (3.6%) |
| $75,000 to $99,999 | 1,663 (10.0%) | 807 (5.1%) |
| $100,000+ | 1,141 (6.9%) | 521 (3.3%) |
| Total | 16,556 (100.0%) | 15,892 (100.0%) |
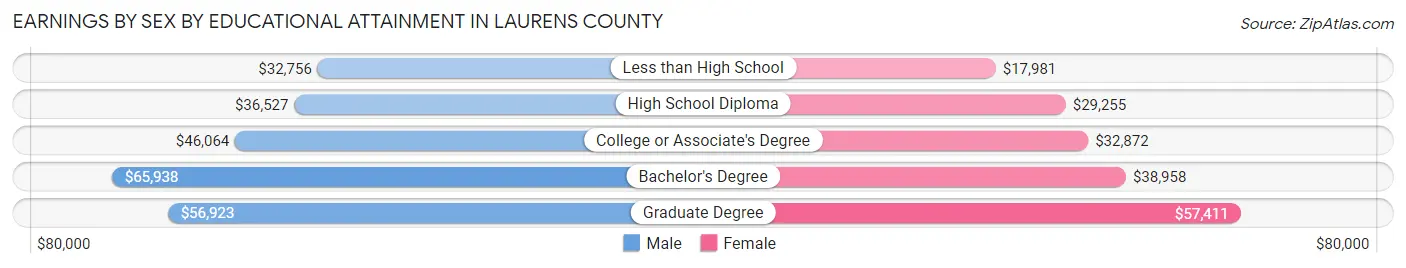
Earnings by Sex by Educational Attainment in Laurens County
Average earnings in Laurens County are $41,245 for men and $31,839 for women, a difference of 22.8%. Men with an educational attainment of bachelor's degree enjoy the highest average annual earnings of $65,938, while those with less than high school education earn the least with $32,756. Women with an educational attainment of graduate degree earn the most with the average annual earnings of $57,411, while those with less than high school education have the smallest earnings of $17,981.
| Educational Attainment | Male Income | Female Income |
| Less than High School | $32,756 | $17,981 |
| High School Diploma | $36,527 | $29,255 |
| College or Associate's Degree | $46,064 | $32,872 |
| Bachelor's Degree | $65,938 | $38,958 |
| Graduate Degree | $56,923 | $57,411 |
| Total | $41,245 | $31,839 |
Family Income in Laurens County
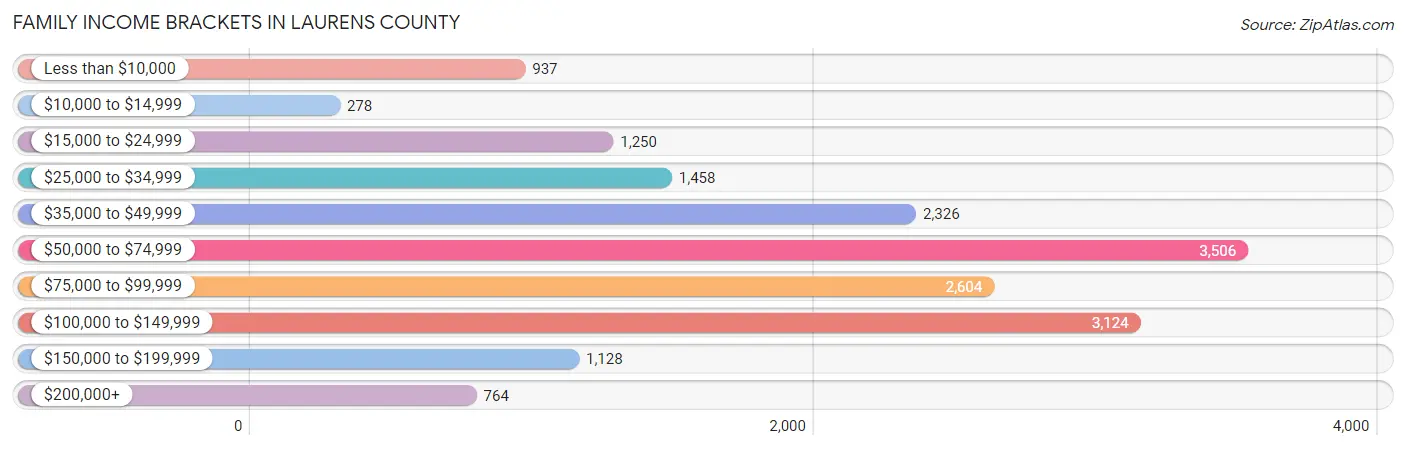
Family Income Brackets in Laurens County
According to the Laurens County family income data, there are 3,506 families falling into the $50,000 to $74,999 income range, which is the most common income bracket and makes up 20.2% of all families. Conversely, the $10,000 to $14,999 income bracket is the least frequent group with only 278 families (1.6%) belonging to this category.
| Income Bracket | # Families | % Families |
| Less than $10,000 | 937 | 5.4% |
| $10,000 to $14,999 | 278 | 1.6% |
| $15,000 to $24,999 | 1,250 | 7.2% |
| $25,000 to $34,999 | 1,458 | 8.4% |
| $35,000 to $49,999 | 2,326 | 13.4% |
| $50,000 to $74,999 | 3,506 | 20.2% |
| $75,000 to $99,999 | 2,604 | 15.0% |
| $100,000 to $149,999 | 3,124 | 18.0% |
| $150,000 to $199,999 | 1,128 | 6.5% |
| $200,000+ | 764 | 4.4% |
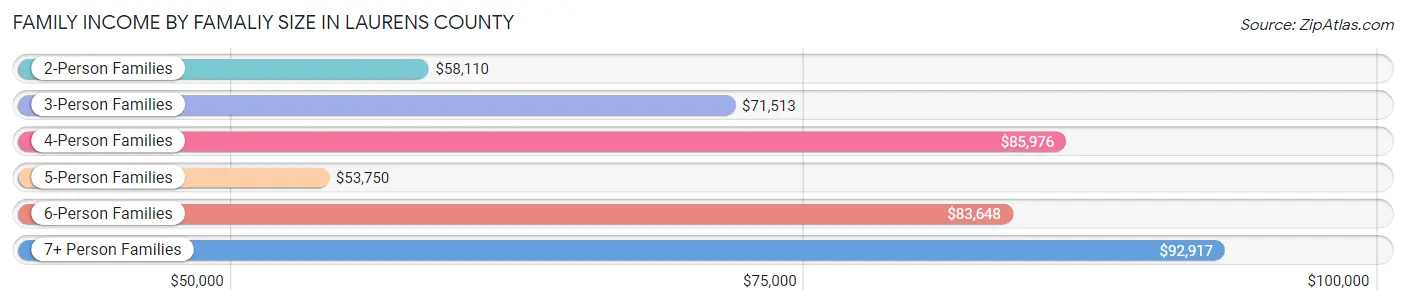
Family Income by Famaliy Size in Laurens County
7+ person families (174 | 1.0%) account for the highest median family income in Laurens County with $92,917 per family, while 2-person families (8,824 | 50.8%) have the highest median income of $29,055 per family member.
| Income Bracket | # Families | Median Income |
| 2-Person Families | 8,824 (50.8%) | $58,110 |
| 3-Person Families | 3,684 (21.2%) | $71,513 |
| 4-Person Families | 2,864 (16.5%) | $85,976 |
| 5-Person Families | 1,312 (7.6%) | $53,750 |
| 6-Person Families | 499 (2.9%) | $83,648 |
| 7+ Person Families | 174 (1.0%) | $92,917 |
| Total | 17,357 (100.0%) | $65,689 |
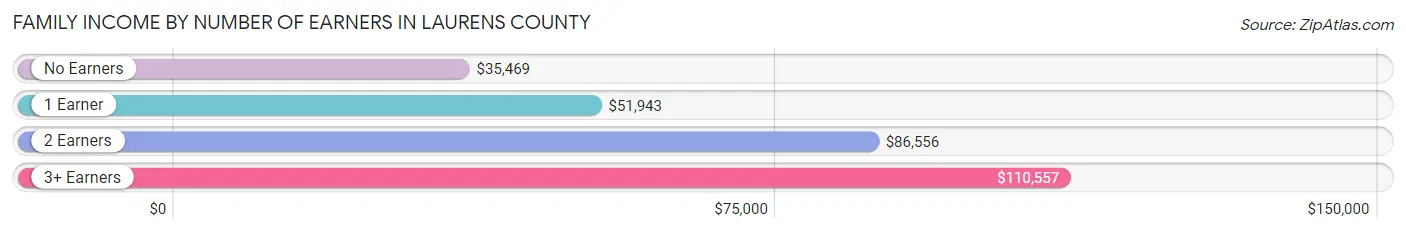
Family Income by Number of Earners in Laurens County
The median family income in Laurens County is $65,689, with families comprising 3+ earners (1,615) having the highest median family income of $110,557, while families with no earners (3,011) have the lowest median family income of $35,469, accounting for 9.3% and 17.3% of families, respectively.
| Number of Earners | # Families | Median Income |
| No Earners | 3,011 (17.3%) | $35,469 |
| 1 Earner | 6,495 (37.4%) | $51,943 |
| 2 Earners | 6,236 (35.9%) | $86,556 |
| 3+ Earners | 1,615 (9.3%) | $110,557 |
| Total | 17,357 (100.0%) | $65,689 |
Household Income in Laurens County
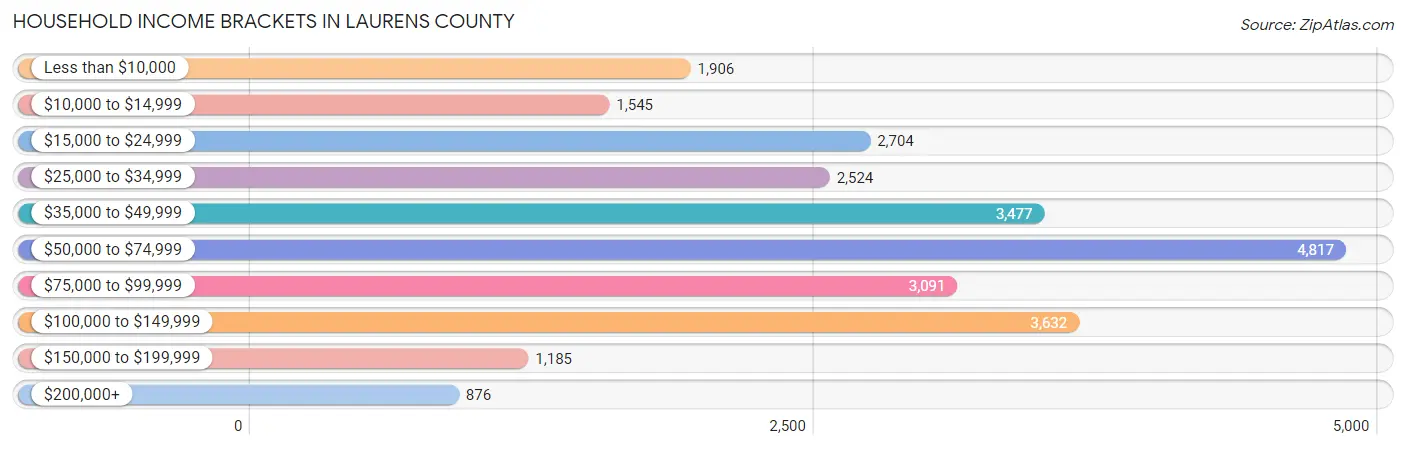
Household Income Brackets in Laurens County
With 4,817 households falling in the category, the $50,000 to $74,999 income range is the most frequent in Laurens County, accounting for 18.7% of all households. In contrast, only 876 households (3.4%) fall into the $200,000+ income bracket, making it the least populous group.
| Income Bracket | # Households | % Households |
| Less than $10,000 | 1,906 | 7.4% |
| $10,000 to $14,999 | 1,545 | 6.0% |
| $15,000 to $24,999 | 2,704 | 10.5% |
| $25,000 to $34,999 | 2,524 | 9.8% |
| $35,000 to $49,999 | 3,477 | 13.5% |
| $50,000 to $74,999 | 4,817 | 18.7% |
| $75,000 to $99,999 | 3,091 | 12.0% |
| $100,000 to $149,999 | 3,632 | 14.1% |
| $150,000 to $199,999 | 1,185 | 4.6% |
| $200,000+ | 876 | 3.4% |
Household Income by Householder Age in Laurens County
The median household income in Laurens County is $52,077, with the highest median household income of $58,980 found in the 25 to 44 years age bracket for the primary householder. A total of 7,280 households (28.3%) fall into this category. Meanwhile, the 65+ years age bracket for the primary householder has the lowest median household income of $43,346, with 7,645 households (29.7%) in this group.
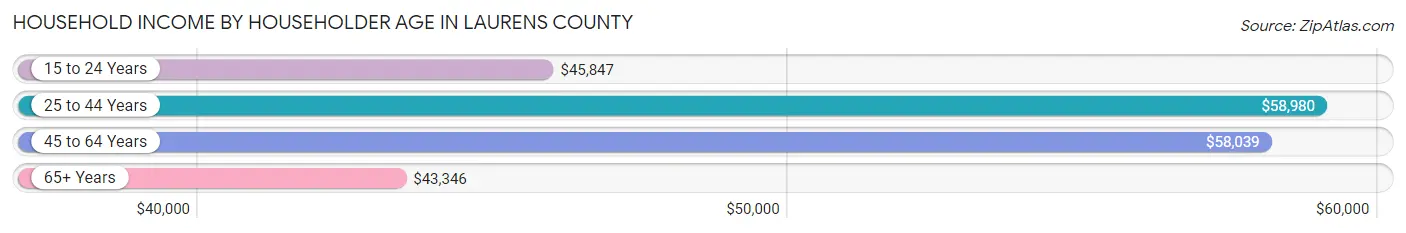
| Income Bracket | # Households | Median Income |
| 15 to 24 Years | 797 (3.1%) | $45,847 |
| 25 to 44 Years | 7,280 (28.3%) | $58,980 |
| 45 to 64 Years | 10,035 (39.0%) | $58,039 |
| 65+ Years | 7,645 (29.7%) | $43,346 |
| Total | 25,757 (100.0%) | $52,077 |
Poverty in Laurens County
Income Below Poverty by Sex and Age in Laurens County
With 17.0% poverty level for males and 20.6% for females among the residents of Laurens County, 5 year old males and 5 year old females are the most vulnerable to poverty, with 202 males (39.6%) and 111 females (37.2%) in their respective age groups living below the poverty level.
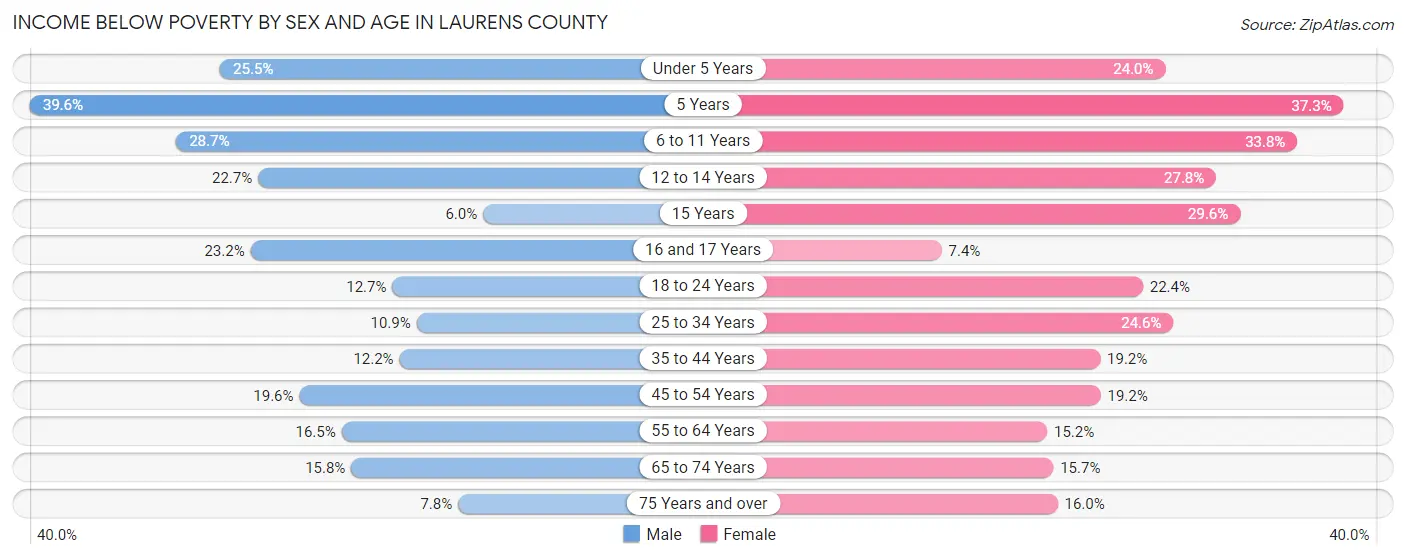
| Age Bracket | Male | Female |
| Under 5 Years | 543 (25.5%) | 387 (24.0%) |
| 5 Years | 202 (39.6%) | 111 (37.2%) |
| 6 to 11 Years | 746 (28.7%) | 873 (33.8%) |
| 12 to 14 Years | 238 (22.7%) | 311 (27.8%) |
| 15 Years | 28 (6.0%) | 157 (29.6%) |
| 16 and 17 Years | 194 (23.2%) | 50 (7.4%) |
| 18 to 24 Years | 311 (12.7%) | 555 (22.4%) |
| 25 to 34 Years | 452 (10.9%) | 994 (24.6%) |
| 35 to 44 Years | 455 (12.2%) | 785 (19.2%) |
| 45 to 54 Years | 819 (19.6%) | 839 (19.2%) |
| 55 to 64 Years | 752 (16.5%) | 753 (15.2%) |
| 65 to 74 Years | 564 (15.8%) | 616 (15.7%) |
| 75 Years and over | 132 (7.8%) | 414 (16.0%) |
| Total | 5,436 (17.0%) | 6,845 (20.6%) |
Income Above Poverty by Sex and Age in Laurens County
According to the poverty statistics in Laurens County, males aged 15 years and females aged 16 and 17 years are the age groups that are most secure financially, with 94.0% of males and 92.6% of females in these age groups living above the poverty line.
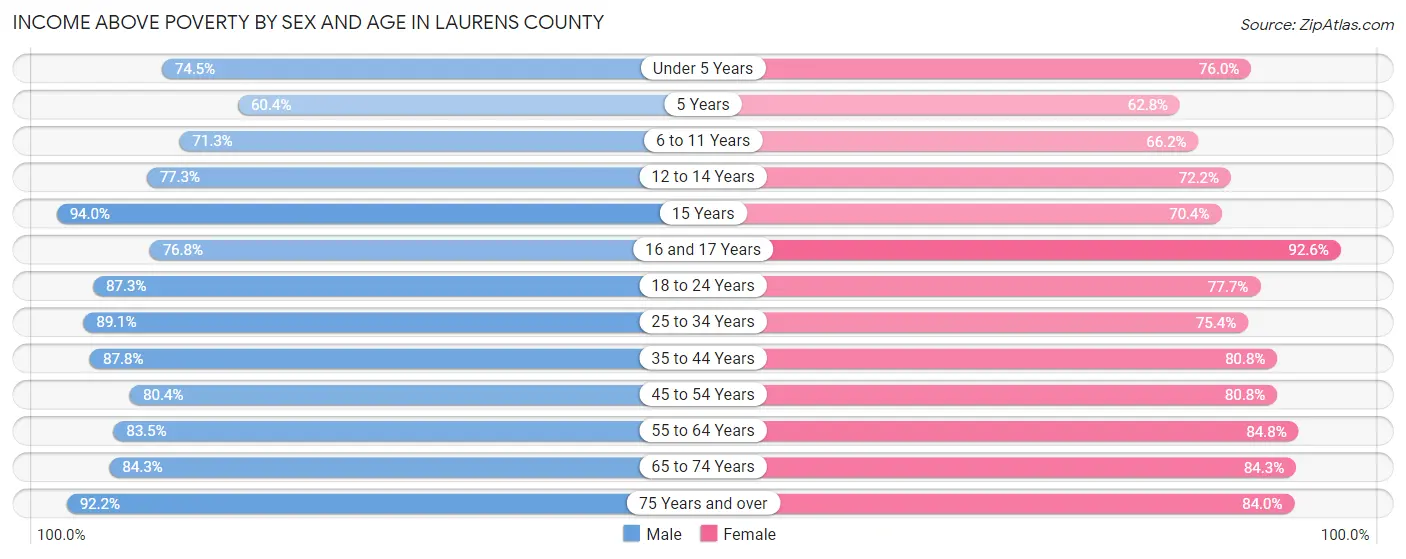
| Age Bracket | Male | Female |
| Under 5 Years | 1,588 (74.5%) | 1,224 (76.0%) |
| 5 Years | 308 (60.4%) | 187 (62.7%) |
| 6 to 11 Years | 1,850 (71.3%) | 1,709 (66.2%) |
| 12 to 14 Years | 812 (77.3%) | 808 (72.2%) |
| 15 Years | 442 (94.0%) | 374 (70.4%) |
| 16 and 17 Years | 641 (76.8%) | 625 (92.6%) |
| 18 to 24 Years | 2,138 (87.3%) | 1,928 (77.6%) |
| 25 to 34 Years | 3,696 (89.1%) | 3,045 (75.4%) |
| 35 to 44 Years | 3,284 (87.8%) | 3,307 (80.8%) |
| 45 to 54 Years | 3,359 (80.4%) | 3,528 (80.8%) |
| 55 to 64 Years | 3,813 (83.5%) | 4,188 (84.8%) |
| 65 to 74 Years | 3,018 (84.3%) | 3,308 (84.3%) |
| 75 Years and over | 1,557 (92.2%) | 2,171 (84.0%) |
| Total | 26,506 (83.0%) | 26,402 (79.4%) |
Income Below Poverty Among Married-Couple Families in Laurens County
The poverty statistics for married-couple families in Laurens County show that 6.5% or 774 of the total 11,881 families live below the poverty line. Families with 3 or 4 children have the highest poverty rate of 29.1%, comprising of 223 families. On the other hand, families with 5 or more children have the lowest poverty rate of 0.0%, which includes 0 families.
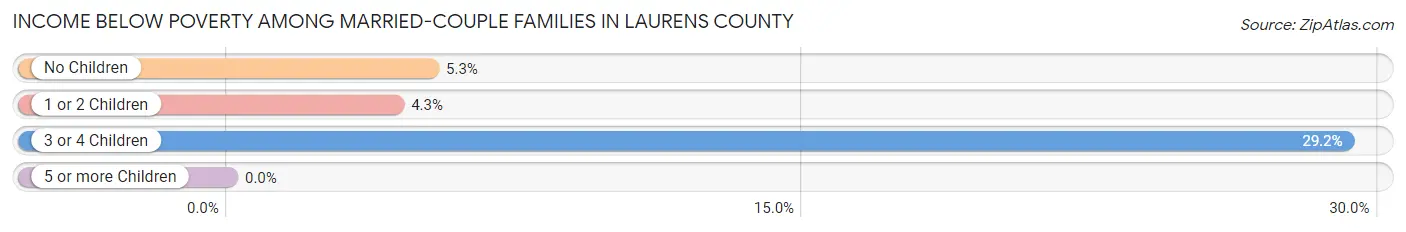
| Children | Above Poverty | Below Poverty |
| No Children | 7,240 (94.8%) | 401 (5.2%) |
| 1 or 2 Children | 3,304 (95.7%) | 150 (4.3%) |
| 3 or 4 Children | 542 (70.9%) | 223 (29.1%) |
| 5 or more Children | 21 (100.0%) | 0 (0.0%) |
| Total | 11,107 (93.5%) | 774 (6.5%) |
Income Below Poverty Among Single-Parent Households in Laurens County
According to the poverty data in Laurens County, 18.3% or 281 single-father households and 32.8% or 1,293 single-mother households are living below the poverty line. Among single-father households, those with 3 or 4 children have the highest poverty rate, with 34 households (27.6%) experiencing poverty. Likewise, among single-mother households, those with 3 or 4 children have the highest poverty rate, with 468 households (83.7%) falling below the poverty line.
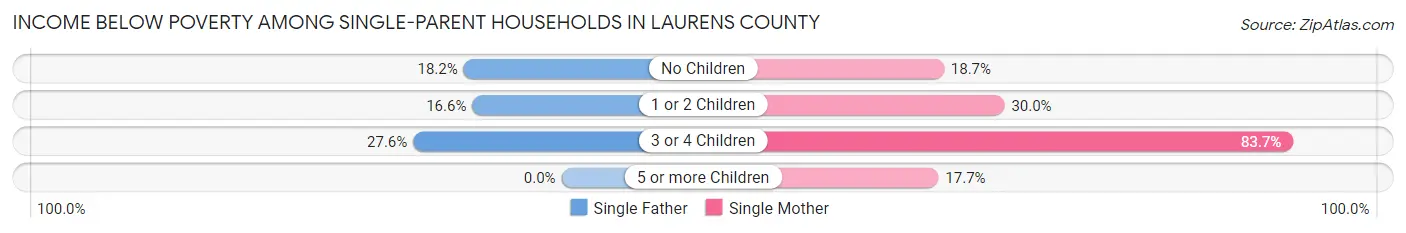
| Children | Single Father | Single Mother |
| No Children | 137 (18.2%) | 303 (18.7%) |
| 1 or 2 Children | 110 (16.6%) | 516 (29.9%) |
| 3 or 4 Children | 34 (27.6%) | 468 (83.7%) |
| 5 or more Children | 0 (0.0%) | 6 (17.6%) |
| Total | 281 (18.3%) | 1,293 (32.8%) |
Income Below Poverty Among Married-Couple vs Single-Parent Households in Laurens County
The poverty data for Laurens County shows that 774 of the married-couple family households (6.5%) and 1,574 of the single-parent households (28.7%) are living below the poverty level. Within the married-couple family households, those with 3 or 4 children have the highest poverty rate, with 223 households (29.1%) falling below the poverty line. Among the single-parent households, those with 3 or 4 children have the highest poverty rate, with 502 household (73.6%) living below poverty.
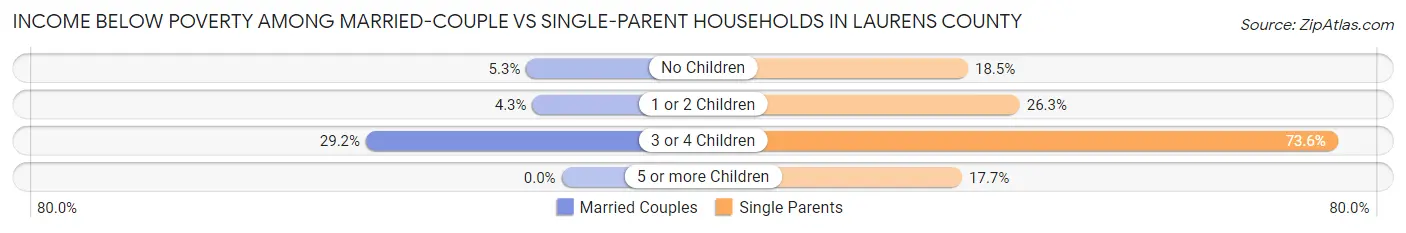
| Children | Married-Couple Families | Single-Parent Households |
| No Children | 401 (5.2%) | 440 (18.5%) |
| 1 or 2 Children | 150 (4.3%) | 626 (26.3%) |
| 3 or 4 Children | 223 (29.1%) | 502 (73.6%) |
| 5 or more Children | 0 (0.0%) | 6 (17.6%) |
| Total | 774 (6.5%) | 1,574 (28.7%) |
Race in Laurens County
The most populous races in Laurens County are White / Caucasian (46,271 | 68.6%), Black / African American (15,564 | 23.1%), and Hispanic or Latino (3,776 | 5.6%).
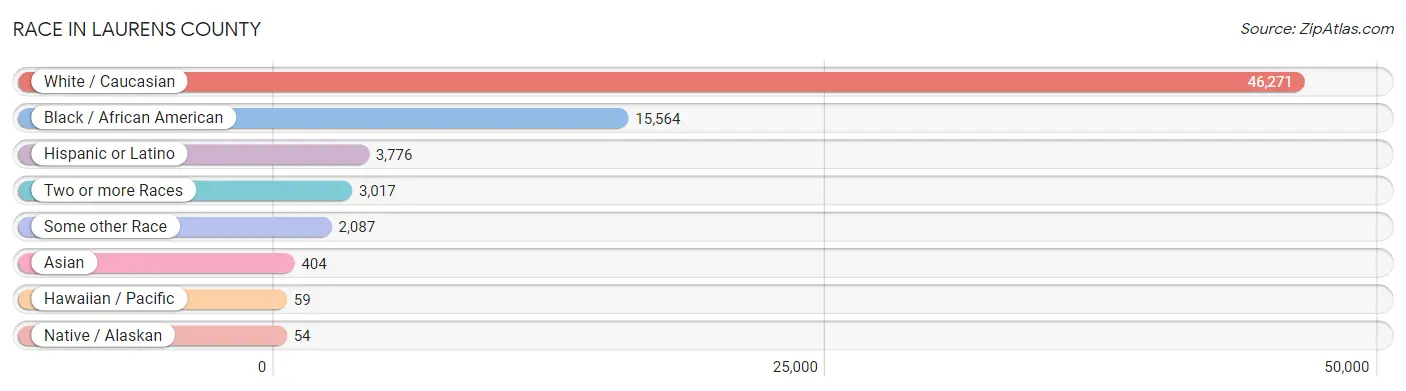
| Race | # Population | % Population |
| Asian | 404 | 0.6% |
| Black / African American | 15,564 | 23.1% |
| Hawaiian / Pacific | 59 | 0.1% |
| Hispanic or Latino | 3,776 | 5.6% |
| Native / Alaskan | 54 | 0.1% |
| White / Caucasian | 46,271 | 68.6% |
| Two or more Races | 3,017 | 4.5% |
| Some other Race | 2,087 | 3.1% |
| Total | 67,456 | 100.0% |
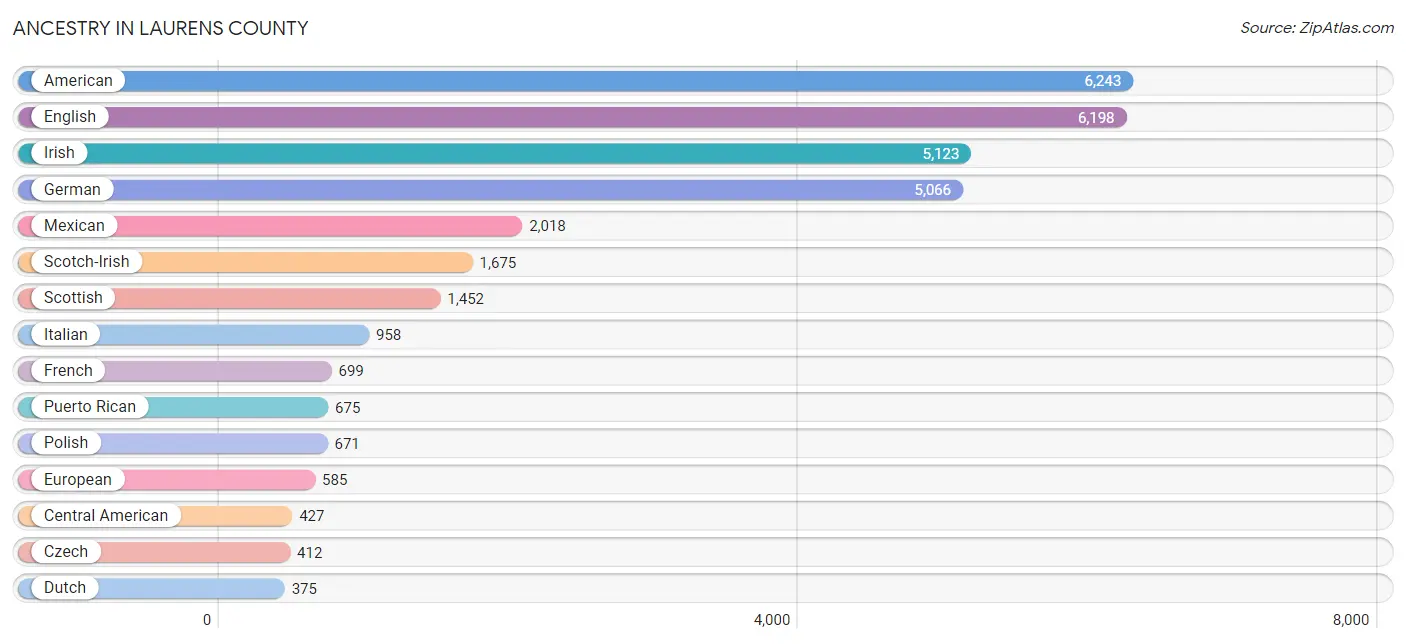
Ancestry in Laurens County
The most populous ancestries reported in Laurens County are American (6,243 | 9.2%), English (6,198 | 9.2%), Irish (5,123 | 7.6%), German (5,066 | 7.5%), and Mexican (2,018 | 3.0%), together accounting for 36.5% of all Laurens County residents.
| Ancestry | # Population | % Population |
| African | 180 | 0.3% |
| Aleut | 1 | 0.0% |
| Alsatian | 6 | 0.0% |
| American | 6,243 | 9.2% |
| Apache | 23 | 0.0% |
| Arab | 29 | 0.0% |
| Australian | 9 | 0.0% |
| Austrian | 310 | 0.5% |
| Bahamian | 7 | 0.0% |
| Bangladeshi | 49 | 0.1% |
| Basque | 5 | 0.0% |
| Blackfeet | 3 | 0.0% |
| Brazilian | 2 | 0.0% |
| British | 169 | 0.3% |
| Bulgarian | 4 | 0.0% |
| Burmese | 117 | 0.2% |
| Canadian | 155 | 0.2% |
| Celtic | 2 | 0.0% |
| Central American | 427 | 0.6% |
| Cherokee | 231 | 0.3% |
| Chippewa | 10 | 0.0% |
| Choctaw | 3 | 0.0% |
| Colombian | 167 | 0.3% |
| Costa Rican | 7 | 0.0% |
| Croatian | 9 | 0.0% |
| Cuban | 142 | 0.2% |
| Czech | 412 | 0.6% |
| Danish | 36 | 0.1% |
| Dominican | 89 | 0.1% |
| Dutch | 375 | 0.6% |
| Eastern European | 28 | 0.0% |
| Ecuadorian | 9 | 0.0% |
| English | 6,198 | 9.2% |
| European | 585 | 0.9% |
| Finnish | 35 | 0.1% |
| French | 699 | 1.0% |
| French American Indian | 25 | 0.0% |
| French Canadian | 85 | 0.1% |
| German | 5,066 | 7.5% |
| Greek | 126 | 0.2% |
| Guamanian / Chamorro | 24 | 0.0% |
| Guatemalan | 189 | 0.3% |
| Haitian | 101 | 0.2% |
| Honduran | 53 | 0.1% |
| Hungarian | 214 | 0.3% |
| Indian (Asian) | 103 | 0.2% |
| Irish | 5,123 | 7.6% |
| Israeli | 8 | 0.0% |
| Italian | 958 | 1.4% |
| Jamaican | 68 | 0.1% |
| Korean | 89 | 0.1% |
| Lebanese | 29 | 0.0% |
| Lumbee | 1 | 0.0% |
| Malaysian | 14 | 0.0% |
| Mexican | 2,018 | 3.0% |
| Native Hawaiian | 33 | 0.1% |
| Navajo | 7 | 0.0% |
| Nigerian | 8 | 0.0% |
| Northern European | 17 | 0.0% |
| Norwegian | 104 | 0.2% |
| Ottawa | 4 | 0.0% |
| Pakistani | 38 | 0.1% |
| Panamanian | 178 | 0.3% |
| Polish | 671 | 1.0% |
| Portuguese | 38 | 0.1% |
| Puerto Rican | 675 | 1.0% |
| Russian | 206 | 0.3% |
| Samoan | 2 | 0.0% |
| Scandinavian | 61 | 0.1% |
| Scotch-Irish | 1,675 | 2.5% |
| Scottish | 1,452 | 2.1% |
| Shoshone | 3 | 0.0% |
| Slavic | 14 | 0.0% |
| Slovak | 58 | 0.1% |
| Slovene | 10 | 0.0% |
| South American | 208 | 0.3% |
| Spaniard | 13 | 0.0% |
| Spanish | 9 | 0.0% |
| Sri Lankan | 41 | 0.1% |
| Subsaharan African | 193 | 0.3% |
| Swedish | 323 | 0.5% |
| Swiss | 12 | 0.0% |
| Thai | 72 | 0.1% |
| Ukrainian | 67 | 0.1% |
| Venezuelan | 32 | 0.1% |
| Welsh | 288 | 0.4% |
| West Indian | 47 | 0.1% | View All 87 Rows |
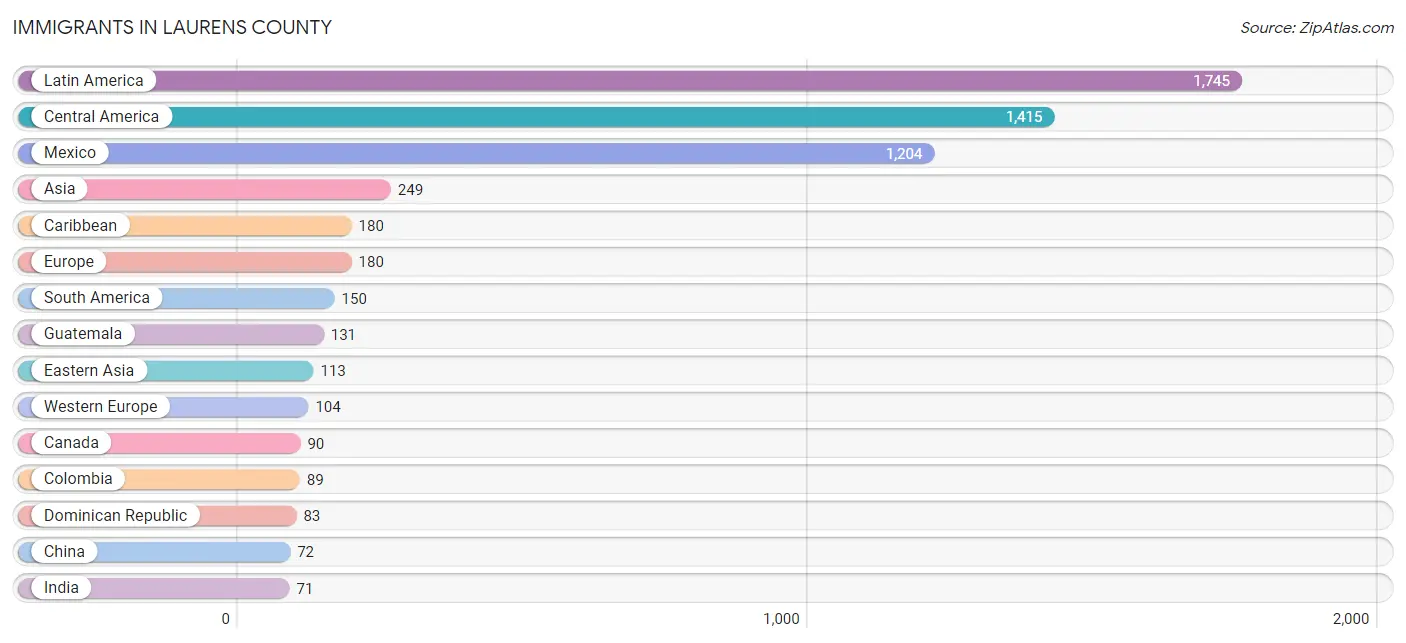
Immigrants in Laurens County
The most numerous immigrant groups reported in Laurens County came from Latin America (1,745 | 2.6%), Central America (1,415 | 2.1%), Mexico (1,204 | 1.8%), Asia (249 | 0.4%), and Caribbean (180 | 0.3%), together accounting for 7.1% of all Laurens County residents.
| Immigration Origin | # Population | % Population |
| Africa | 8 | 0.0% |
| Asia | 249 | 0.4% |
| Australia | 9 | 0.0% |
| Bahamas | 7 | 0.0% |
| Canada | 90 | 0.1% |
| Caribbean | 180 | 0.3% |
| Central America | 1,415 | 2.1% |
| China | 72 | 0.1% |
| Colombia | 89 | 0.1% |
| Dominican Republic | 83 | 0.1% |
| Eastern Asia | 113 | 0.2% |
| Eastern Europe | 50 | 0.1% |
| Ecuador | 9 | 0.0% |
| England | 19 | 0.0% |
| Europe | 180 | 0.3% |
| France | 21 | 0.0% |
| Germany | 64 | 0.1% |
| Guatemala | 131 | 0.2% |
| Honduras | 56 | 0.1% |
| Hungary | 8 | 0.0% |
| India | 71 | 0.1% |
| Jamaica | 46 | 0.1% |
| Korea | 41 | 0.1% |
| Laos | 14 | 0.0% |
| Latin America | 1,745 | 2.6% |
| Mexico | 1,204 | 1.8% |
| Netherlands | 19 | 0.0% |
| Nigeria | 3 | 0.0% |
| Northern Europe | 26 | 0.0% |
| Oceania | 9 | 0.0% |
| Panama | 24 | 0.0% |
| Peru | 9 | 0.0% |
| Philippines | 30 | 0.0% |
| Russia | 25 | 0.0% |
| South America | 150 | 0.2% |
| South Central Asia | 71 | 0.1% |
| South Eastern Asia | 65 | 0.1% |
| Taiwan | 4 | 0.0% |
| Thailand | 21 | 0.0% |
| Trinidad and Tobago | 22 | 0.0% |
| Ukraine | 17 | 0.0% |
| Venezuela | 43 | 0.1% |
| West Indies | 22 | 0.0% |
| Western Africa | 8 | 0.0% |
| Western Europe | 104 | 0.2% | View All 45 Rows |
Sex and Age in Laurens County
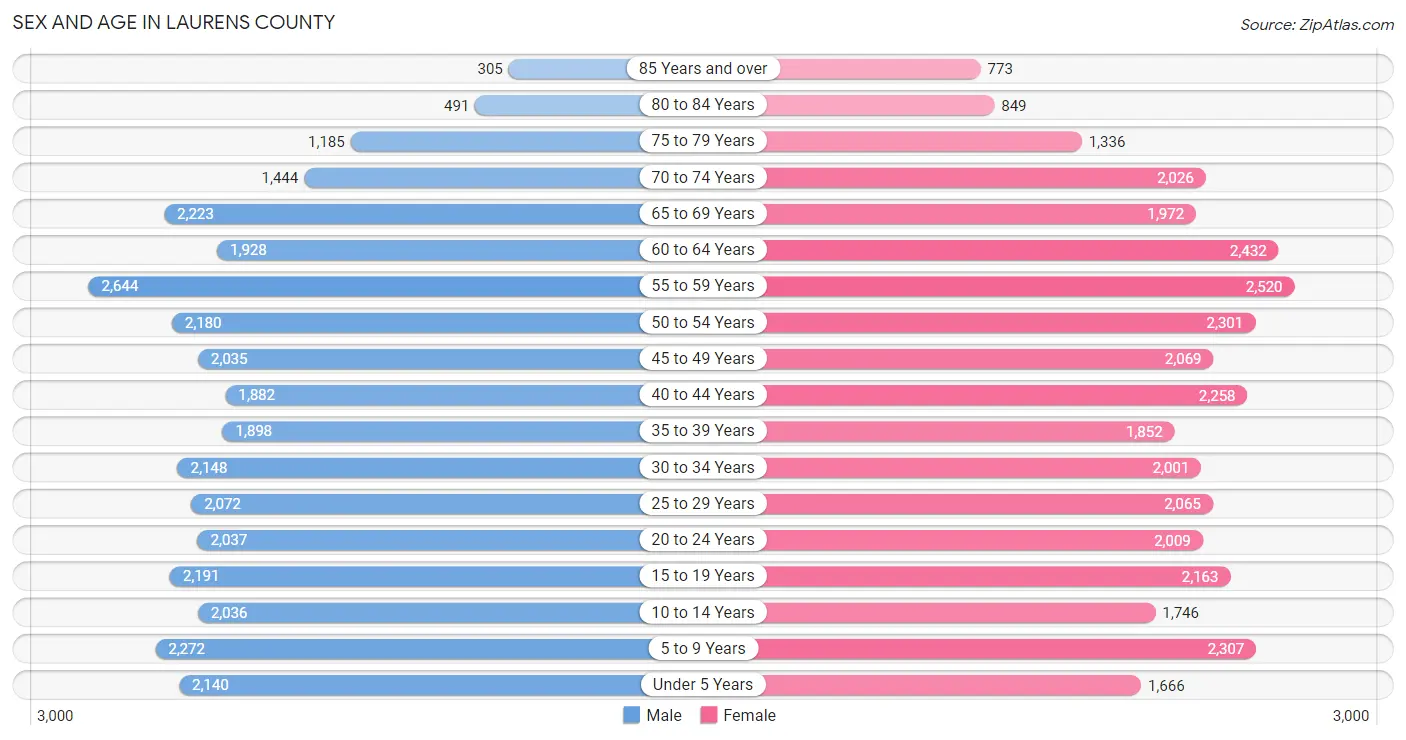
Sex and Age in Laurens County
The most populous age groups in Laurens County are 55 to 59 Years (2,644 | 8.0%) for men and 55 to 59 Years (2,520 | 7.3%) for women.
| Age Bracket | Male | Female |
| Under 5 Years | 2,140 (6.5%) | 1,666 (4.9%) |
| 5 to 9 Years | 2,272 (6.9%) | 2,307 (6.7%) |
| 10 to 14 Years | 2,036 (6.1%) | 1,746 (5.1%) |
| 15 to 19 Years | 2,191 (6.6%) | 2,163 (6.3%) |
| 20 to 24 Years | 2,037 (6.1%) | 2,009 (5.9%) |
| 25 to 29 Years | 2,072 (6.3%) | 2,065 (6.0%) |
| 30 to 34 Years | 2,148 (6.5%) | 2,001 (5.8%) |
| 35 to 39 Years | 1,898 (5.7%) | 1,852 (5.4%) |
| 40 to 44 Years | 1,882 (5.7%) | 2,258 (6.6%) |
| 45 to 49 Years | 2,035 (6.1%) | 2,069 (6.0%) |
| 50 to 54 Years | 2,180 (6.6%) | 2,301 (6.7%) |
| 55 to 59 Years | 2,644 (8.0%) | 2,520 (7.3%) |
| 60 to 64 Years | 1,928 (5.8%) | 2,432 (7.1%) |
| 65 to 69 Years | 2,223 (6.7%) | 1,972 (5.7%) |
| 70 to 74 Years | 1,444 (4.4%) | 2,026 (5.9%) |
| 75 to 79 Years | 1,185 (3.6%) | 1,336 (3.9%) |
| 80 to 84 Years | 491 (1.5%) | 849 (2.5%) |
| 85 Years and over | 305 (0.9%) | 773 (2.2%) |
| Total | 33,111 (100.0%) | 34,345 (100.0%) |
Families and Households in Laurens County
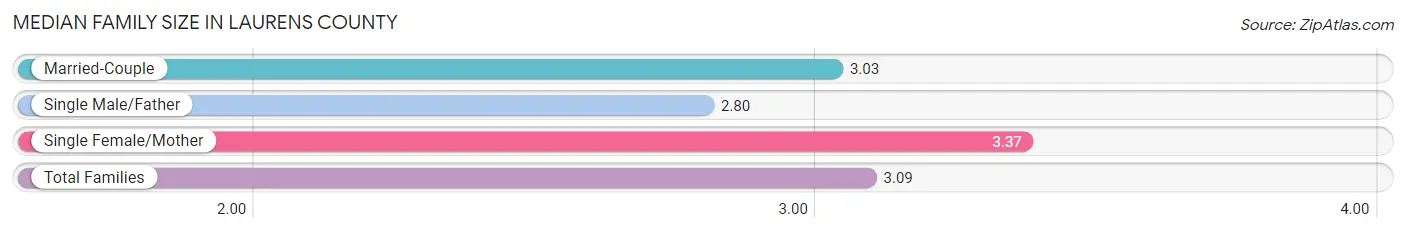
Median Family Size in Laurens County
The median family size in Laurens County is 3.09 persons per family, with single female/mother families (3,940 | 22.7%) accounting for the largest median family size of 3.37 persons per family. On the other hand, single male/father families (1,536 | 8.8%) represent the smallest median family size with 2.80 persons per family.
| Family Type | # Families | Family Size |
| Married-Couple | 11,881 (68.4%) | 3.03 |
| Single Male/Father | 1,536 (8.8%) | 2.80 |
| Single Female/Mother | 3,940 (22.7%) | 3.37 |
| Total Families | 17,357 (100.0%) | 3.09 |
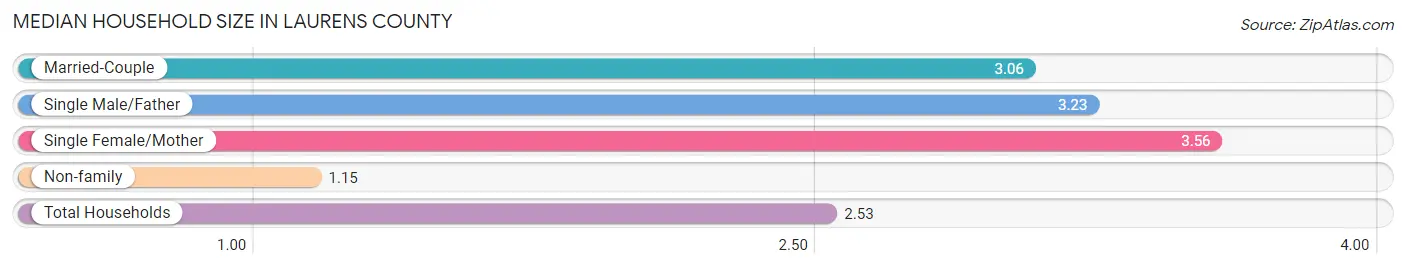
Median Household Size in Laurens County
The median household size in Laurens County is 2.53 persons per household, with single female/mother households (3,940 | 15.3%) accounting for the largest median household size of 3.56 persons per household. non-family households (8,400 | 32.6%) represent the smallest median household size with 1.15 persons per household.
| Household Type | # Households | Household Size |
| Married-Couple | 11,881 (46.1%) | 3.06 |
| Single Male/Father | 1,536 (6.0%) | 3.23 |
| Single Female/Mother | 3,940 (15.3%) | 3.56 |
| Non-family | 8,400 (32.6%) | 1.15 |
| Total Households | 25,757 (100.0%) | 2.53 |
Household Size by Marriage Status in Laurens County
Out of a total of 25,757 households in Laurens County, 17,357 (67.4%) are family households, while 8,400 (32.6%) are nonfamily households. The most numerous type of family households are 2-person households, comprising 8,179, and the most common type of nonfamily households are 1-person households, comprising 7,253.
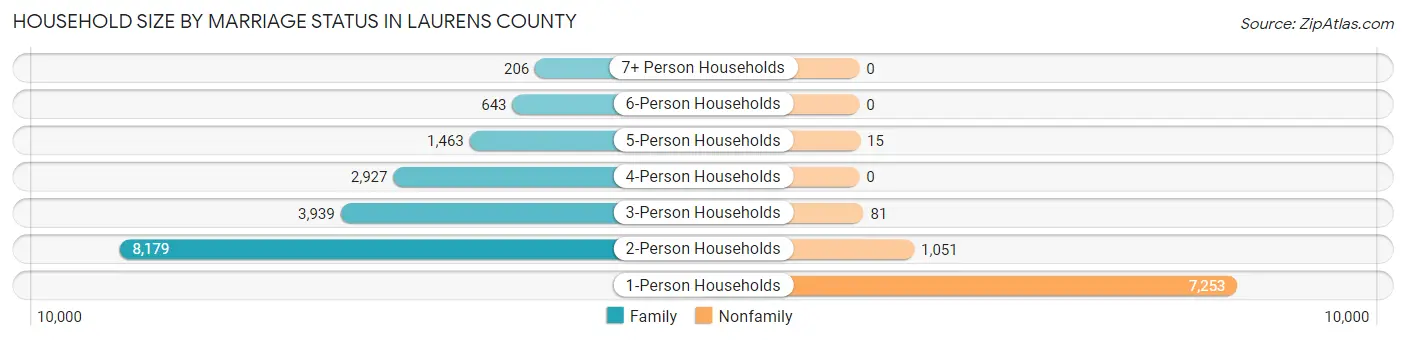
| Household Size | Family Households | Nonfamily Households |
| 1-Person Households | - | 7,253 (28.2%) |
| 2-Person Households | 8,179 (31.8%) | 1,051 (4.1%) |
| 3-Person Households | 3,939 (15.3%) | 81 (0.3%) |
| 4-Person Households | 2,927 (11.4%) | 0 (0.0%) |
| 5-Person Households | 1,463 (5.7%) | 15 (0.1%) |
| 6-Person Households | 643 (2.5%) | 0 (0.0%) |
| 7+ Person Households | 206 (0.8%) | 0 (0.0%) |
| Total | 17,357 (67.4%) | 8,400 (32.6%) |
Female Fertility in Laurens County
Fertility by Age in Laurens County
Average fertility rate in Laurens County is 63.0 births per 1,000 women. Women in the age bracket of 20 to 34 years have the highest fertility rate with 113.0 births per 1,000 women. Women in the age bracket of 20 to 34 years acount for 73.2% of all women with births.
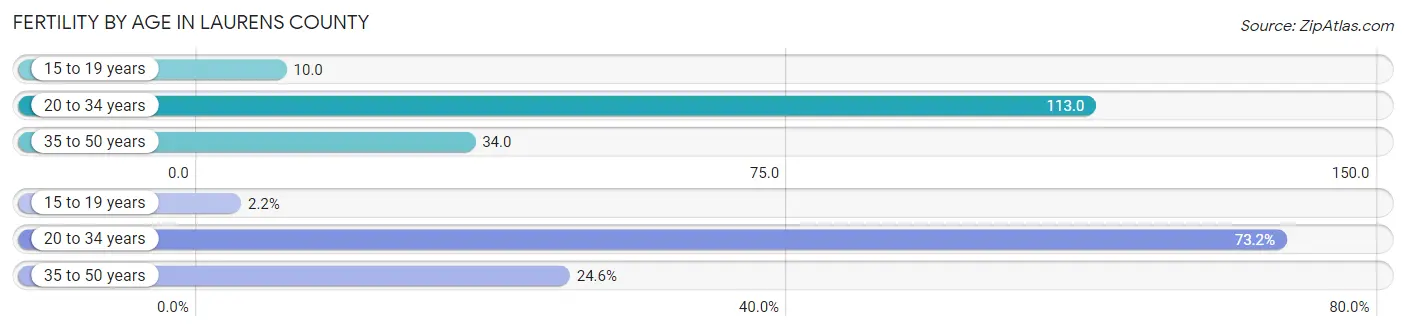
| Age Bracket | Women with Births | Births / 1,000 Women |
| 15 to 19 years | 21 (2.2%) | 10.0 |
| 20 to 34 years | 686 (73.2%) | 113.0 |
| 35 to 50 years | 230 (24.5%) | 34.0 |
| Total | 937 (100.0%) | 63.0 |
Fertility by Age by Marriage Status in Laurens County
54.4% of women with births (937) in Laurens County are married. The highest percentage of unmarried women with births falls into 15 to 19 years age bracket with 100.0% of them unmarried at the time of birth, while the lowest percentage of unmarried women with births belong to 20 to 34 years age bracket with 42.6% of them unmarried.
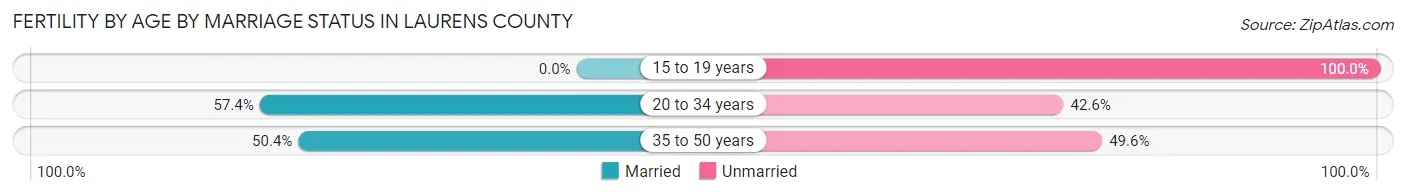
| Age Bracket | Married | Unmarried |
| 15 to 19 years | 0 (0.0%) | 21 (100.0%) |
| 20 to 34 years | 394 (57.4%) | 292 (42.6%) |
| 35 to 50 years | 116 (50.4%) | 114 (49.6%) |
| Total | 510 (54.4%) | 427 (45.6%) |
Fertility by Education in Laurens County
Average fertility rate in Laurens County is 63.0 births per 1,000 women. Women with the education attainment of bachelor's degree have the highest fertility rate of 99.0 births per 1,000 women, while women with the education attainment of graduate degree have the lowest fertility at 11.0 births per 1,000 women. Women with the education attainment of college or associate's degree represent 40.8% of all women with births.
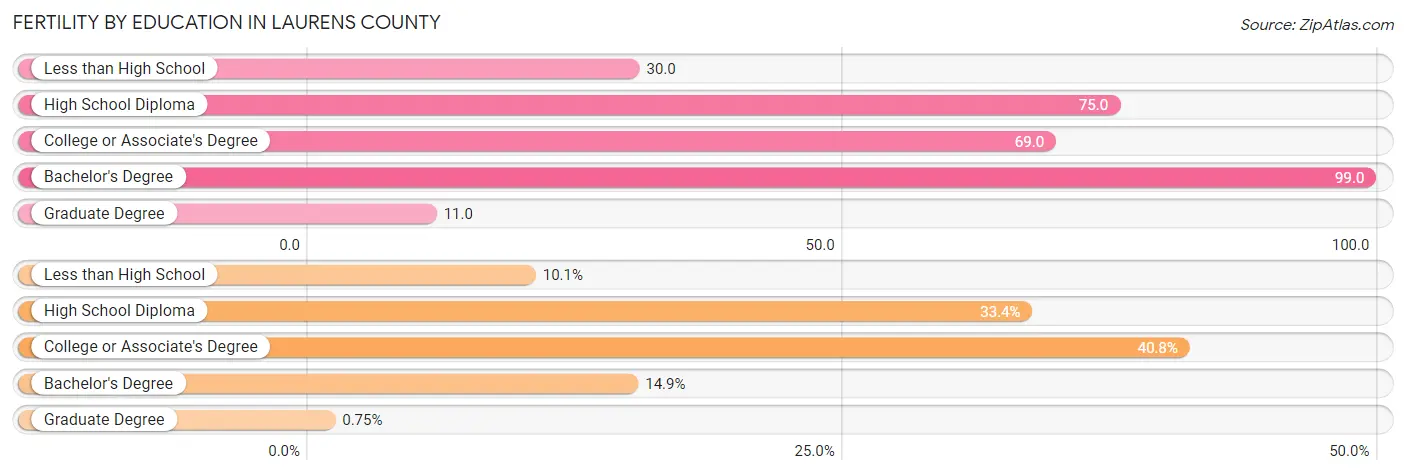
| Educational Attainment | Women with Births | Births / 1,000 Women |
| Less than High School | 95 (10.1%) | 30.0 |
| High School Diploma | 313 (33.4%) | 75.0 |
| College or Associate's Degree | 382 (40.8%) | 69.0 |
| Bachelor's Degree | 140 (14.9%) | 99.0 |
| Graduate Degree | 7 (0.7%) | 11.0 |
| Total | 937 (100.0%) | 63.0 |
Fertility by Education by Marriage Status in Laurens County
45.6% of women with births in Laurens County are unmarried. Women with the educational attainment of graduate degree are most likely to be married with 100.0% of them married at childbirth, while women with the educational attainment of high school diploma are least likely to be married with 58.8% of them unmarried at childbirth.
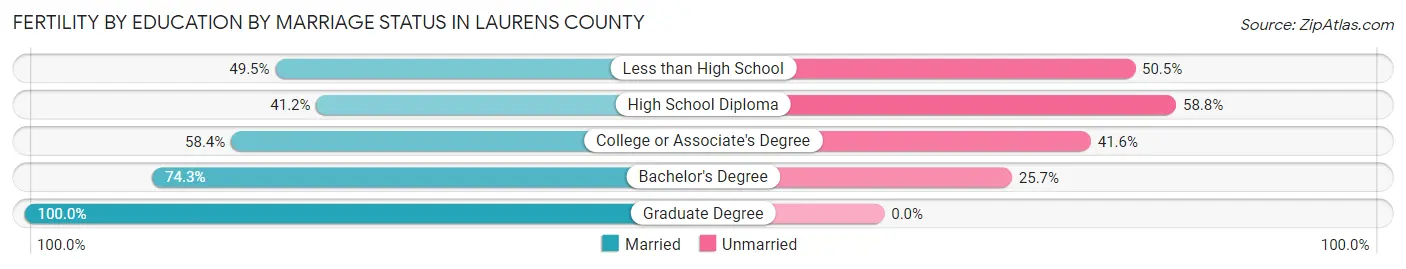
| Educational Attainment | Married | Unmarried |
| Less than High School | 47 (49.5%) | 48 (50.5%) |
| High School Diploma | 129 (41.2%) | 184 (58.8%) |
| College or Associate's Degree | 223 (58.4%) | 159 (41.6%) |
| Bachelor's Degree | 104 (74.3%) | 36 (25.7%) |
| Graduate Degree | 7 (100.0%) | 0 (0.0%) |
| Total | 510 (54.4%) | 427 (45.6%) |
Employment Characteristics in Laurens County
Employment by Class of Employer in Laurens County
Among the 28,596 employed individuals in Laurens County, private company employees (19,982 | 69.9%), not-for-profit organizations (2,028 | 7.1%), and local government employees (1,974 | 6.9%) make up the most common classes of employment.
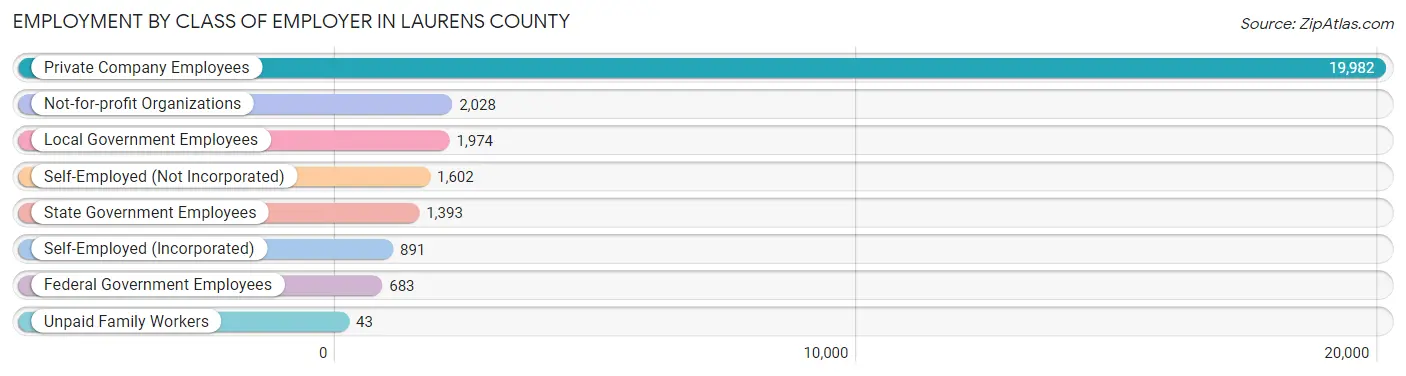
| Employer Class | # Employees | % Employees |
| Private Company Employees | 19,982 | 69.9% |
| Self-Employed (Incorporated) | 891 | 3.1% |
| Self-Employed (Not Incorporated) | 1,602 | 5.6% |
| Not-for-profit Organizations | 2,028 | 7.1% |
| Local Government Employees | 1,974 | 6.9% |
| State Government Employees | 1,393 | 4.9% |
| Federal Government Employees | 683 | 2.4% |
| Unpaid Family Workers | 43 | 0.2% |
| Total | 28,596 | 100.0% |
Employment Status by Age in Laurens County
According to the labor force statistics for Laurens County, out of the total population over 16 years of age (54,271), 57.0% or 30,934 individuals are in the labor force, with 5.2% or 1,609 of them unemployed. The age group with the highest labor force participation rate is 25 to 29 years, with 84.1% or 3,479 individuals in the labor force. Within the labor force, the 20 to 24 years age range has the highest percentage of unemployed individuals, with 11.4% or 355 of them being unemployed.
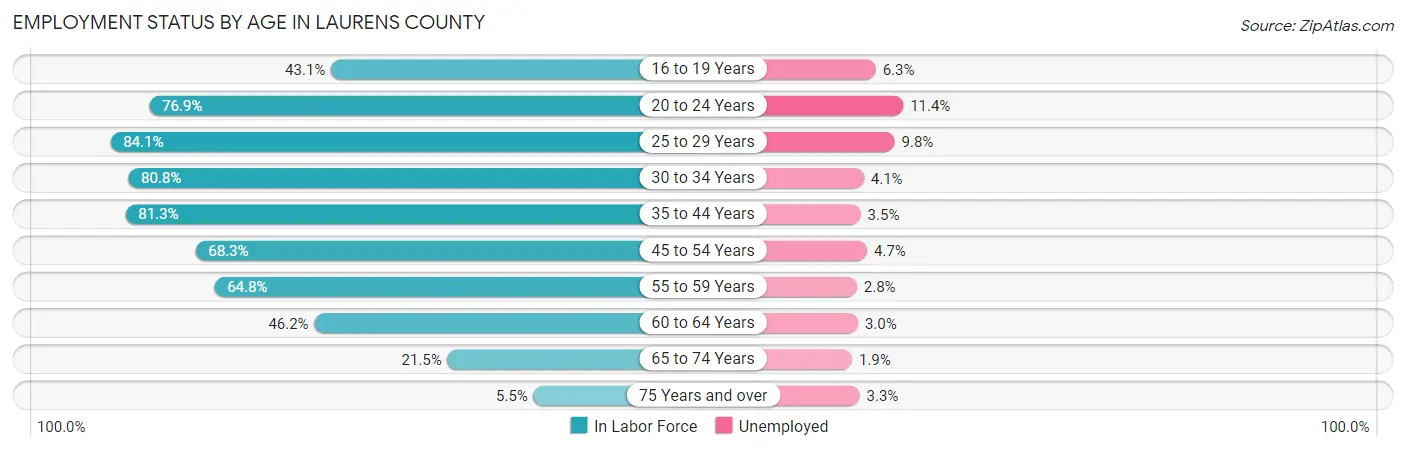
| Age Bracket | In Labor Force | Unemployed |
| 16 to 19 Years | 1,438 (43.1%) | 91 (6.3%) |
| 20 to 24 Years | 3,111 (76.9%) | 355 (11.4%) |
| 25 to 29 Years | 3,479 (84.1%) | 341 (9.8%) |
| 30 to 34 Years | 3,352 (80.8%) | 137 (4.1%) |
| 35 to 44 Years | 6,415 (81.3%) | 225 (3.5%) |
| 45 to 54 Years | 5,864 (68.3%) | 276 (4.7%) |
| 55 to 59 Years | 3,346 (64.8%) | 94 (2.8%) |
| 60 to 64 Years | 2,014 (46.2%) | 60 (3.0%) |
| 65 to 74 Years | 1,648 (21.5%) | 31 (1.9%) |
| 75 Years and over | 272 (5.5%) | 9 (3.3%) |
| Total | 30,934 (57.0%) | 1,609 (5.2%) |
Employment Status by Educational Attainment in Laurens County
According to labor force statistics for Laurens County, 71.4% of individuals (24,479) out of the total population between 25 and 64 years of age (34,285) are in the labor force, with 4.6% or 1,126 of them being unemployed. The group with the highest labor force participation rate are those with the educational attainment of bachelor's degree or higher, with 85.4% or 4,997 individuals in the labor force. Within the labor force, individuals with less than high school education have the highest percentage of unemployment, with 9.6% or 303 of them being unemployed.
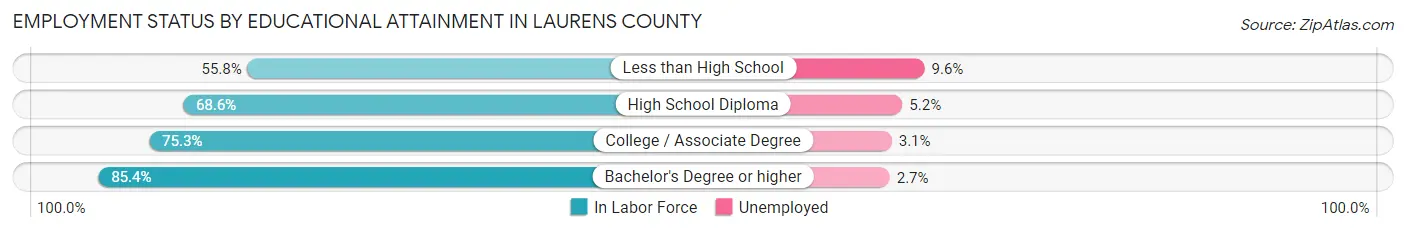
| Educational Attainment | In Labor Force | Unemployed |
| Less than High School | 3,152 (55.8%) | 542 (9.6%) |
| High School Diploma | 8,561 (68.6%) | 649 (5.2%) |
| College / Associate Degree | 7,761 (75.3%) | 320 (3.1%) |
| Bachelor's Degree or higher | 4,997 (85.4%) | 158 (2.7%) |
| Total | 24,479 (71.4%) | 1,577 (4.6%) |
Employment Occupations by Sex in Laurens County
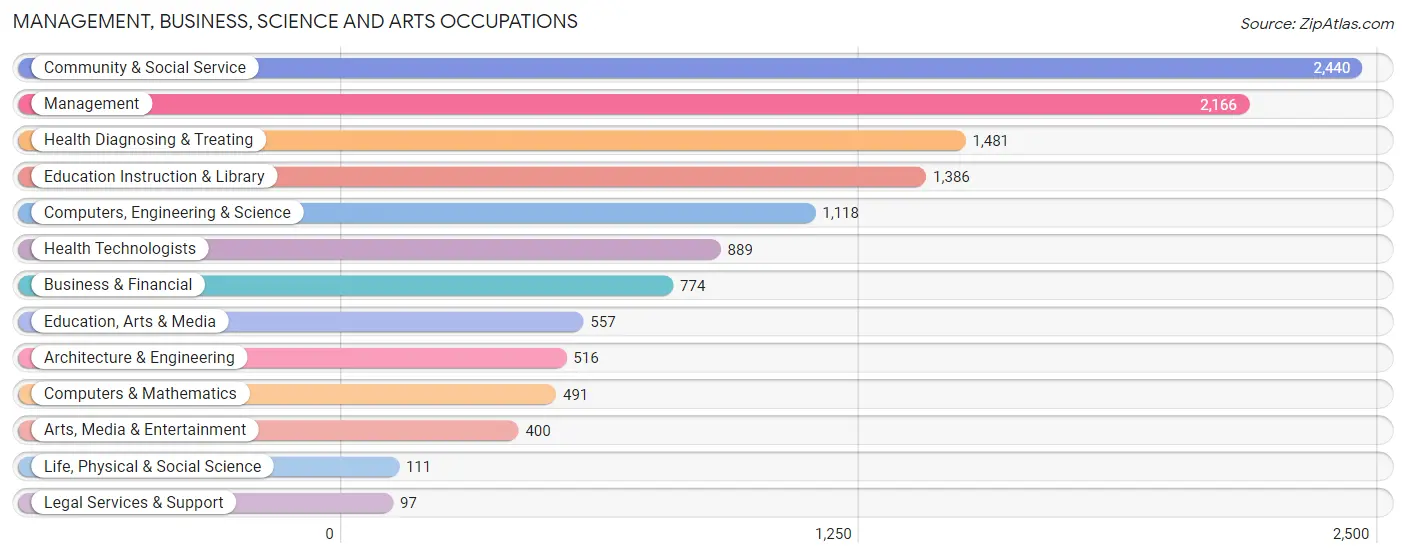
Management, Business, Science and Arts Occupations
The most common Management, Business, Science and Arts occupations in Laurens County are Community & Social Service (2,440 | 8.3%), Management (2,166 | 7.4%), Health Diagnosing & Treating (1,481 | 5.1%), Education Instruction & Library (1,386 | 4.7%), and Computers, Engineering & Science (1,118 | 3.8%).
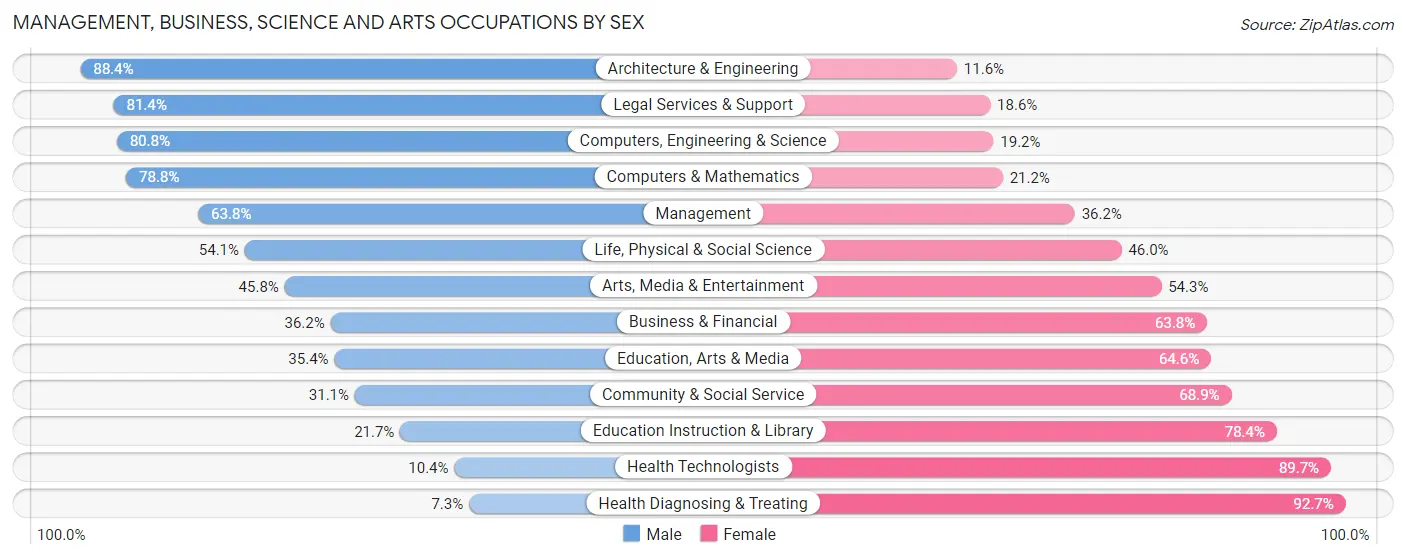
Management, Business, Science and Arts Occupations by Sex
Within the Management, Business, Science and Arts occupations in Laurens County, the most male-oriented occupations are Architecture & Engineering (88.4%), Legal Services & Support (81.4%), and Computers, Engineering & Science (80.8%), while the most female-oriented occupations are Health Diagnosing & Treating (92.7%), Health Technologists (89.6%), and Education Instruction & Library (78.3%).
| Occupation | Male | Female |
| Management | 1,382 (63.8%) | 784 (36.2%) |
| Business & Financial | 280 (36.2%) | 494 (63.8%) |
| Computers, Engineering & Science | 903 (80.8%) | 215 (19.2%) |
| Computers & Mathematics | 387 (78.8%) | 104 (21.2%) |
| Architecture & Engineering | 456 (88.4%) | 60 (11.6%) |
| Life, Physical & Social Science | 60 (54.0%) | 51 (46.0%) |
| Community & Social Service | 759 (31.1%) | 1,681 (68.9%) |
| Education, Arts & Media | 197 (35.4%) | 360 (64.6%) |
| Legal Services & Support | 79 (81.4%) | 18 (18.6%) |
| Education Instruction & Library | 300 (21.6%) | 1,086 (78.3%) |
| Arts, Media & Entertainment | 183 (45.8%) | 217 (54.2%) |
| Health Diagnosing & Treating | 108 (7.3%) | 1,373 (92.7%) |
| Health Technologists | 92 (10.3%) | 797 (89.6%) |
| Total (Category) | 3,432 (43.0%) | 4,547 (57.0%) |
| Total (Overall) | 15,011 (51.3%) | 14,253 (48.7%) |
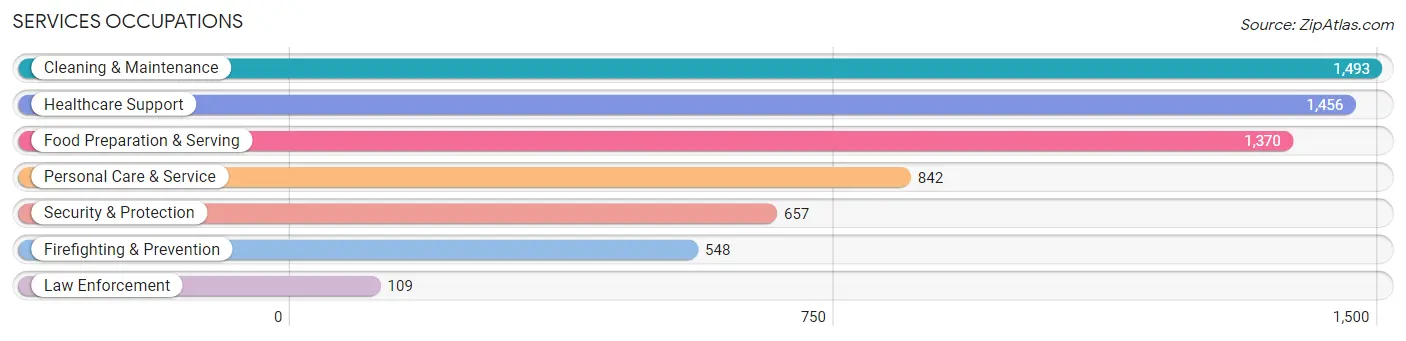
Services Occupations
The most common Services occupations in Laurens County are Cleaning & Maintenance (1,493 | 5.1%), Healthcare Support (1,456 | 5.0%), Food Preparation & Serving (1,370 | 4.7%), Personal Care & Service (842 | 2.9%), and Security & Protection (657 | 2.2%).
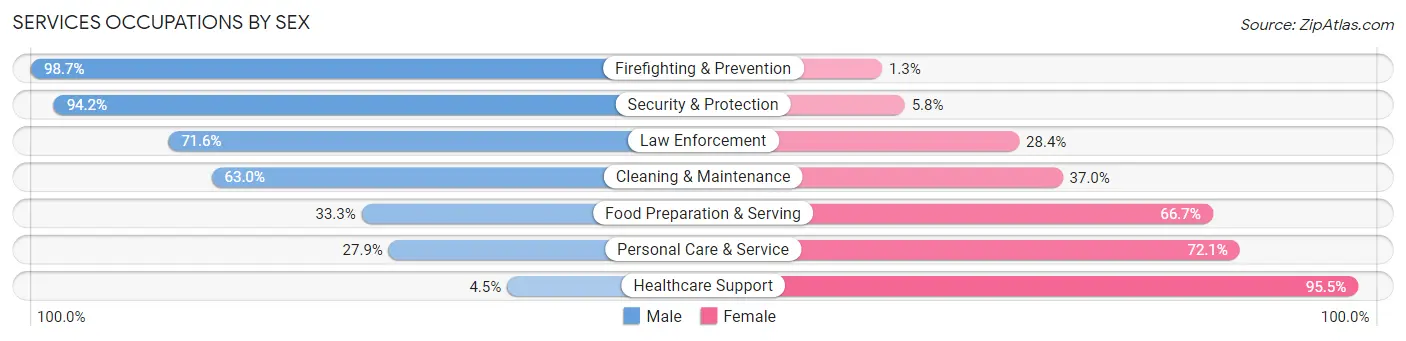
Services Occupations by Sex
Within the Services occupations in Laurens County, the most male-oriented occupations are Firefighting & Prevention (98.7%), Security & Protection (94.2%), and Law Enforcement (71.6%), while the most female-oriented occupations are Healthcare Support (95.5%), Personal Care & Service (72.1%), and Food Preparation & Serving (66.7%).
| Occupation | Male | Female |
| Healthcare Support | 65 (4.5%) | 1,391 (95.5%) |
| Security & Protection | 619 (94.2%) | 38 (5.8%) |
| Firefighting & Prevention | 541 (98.7%) | 7 (1.3%) |
| Law Enforcement | 78 (71.6%) | 31 (28.4%) |
| Food Preparation & Serving | 456 (33.3%) | 914 (66.7%) |
| Cleaning & Maintenance | 940 (63.0%) | 553 (37.0%) |
| Personal Care & Service | 235 (27.9%) | 607 (72.1%) |
| Total (Category) | 2,315 (39.8%) | 3,503 (60.2%) |
| Total (Overall) | 15,011 (51.3%) | 14,253 (48.7%) |
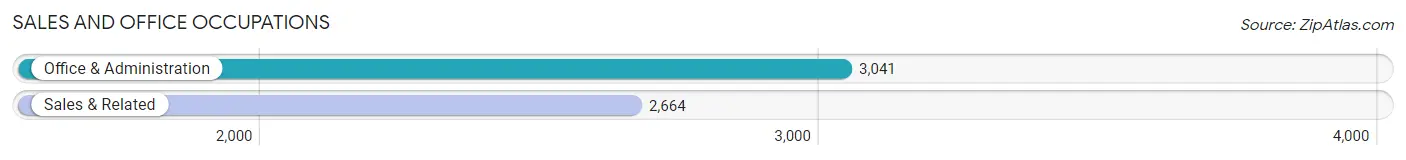
Sales and Office Occupations
The most common Sales and Office occupations in Laurens County are Office & Administration (3,041 | 10.4%), and Sales & Related (2,664 | 9.1%).
Sales and Office Occupations by Sex
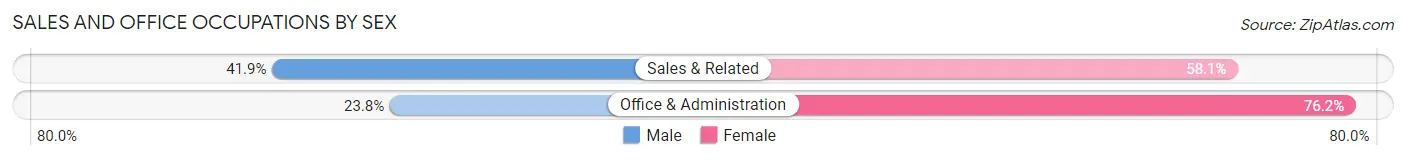
| Occupation | Male | Female |
| Sales & Related | 1,116 (41.9%) | 1,548 (58.1%) |
| Office & Administration | 723 (23.8%) | 2,318 (76.2%) |
| Total (Category) | 1,839 (32.2%) | 3,866 (67.8%) |
| Total (Overall) | 15,011 (51.3%) | 14,253 (48.7%) |
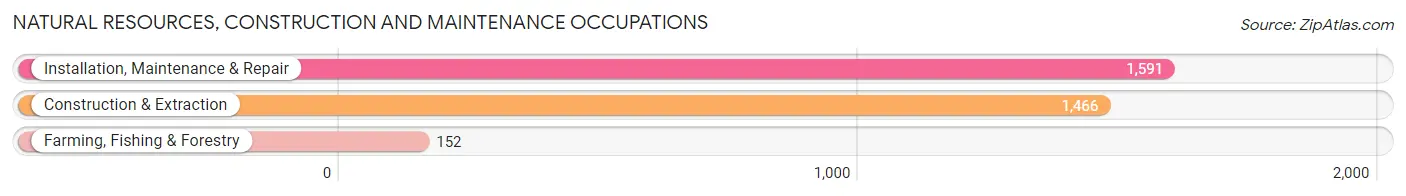
Natural Resources, Construction and Maintenance Occupations
The most common Natural Resources, Construction and Maintenance occupations in Laurens County are Installation, Maintenance & Repair (1,591 | 5.4%), Construction & Extraction (1,466 | 5.0%), and Farming, Fishing & Forestry (152 | 0.5%).
Natural Resources, Construction and Maintenance Occupations by Sex
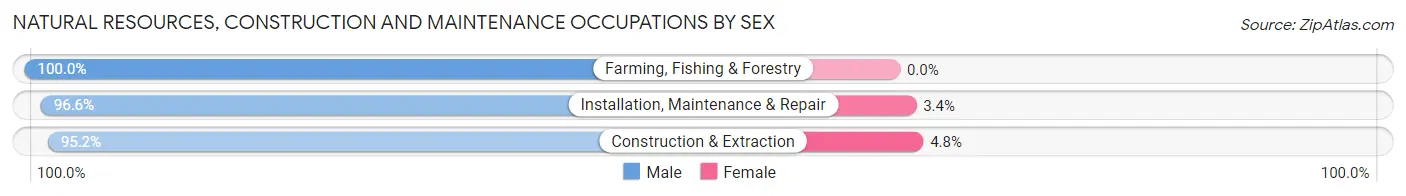
| Occupation | Male | Female |
| Farming, Fishing & Forestry | 152 (100.0%) | 0 (0.0%) |
| Construction & Extraction | 1,395 (95.2%) | 71 (4.8%) |
| Installation, Maintenance & Repair | 1,537 (96.6%) | 54 (3.4%) |
| Total (Category) | 3,084 (96.1%) | 125 (3.9%) |
| Total (Overall) | 15,011 (51.3%) | 14,253 (48.7%) |
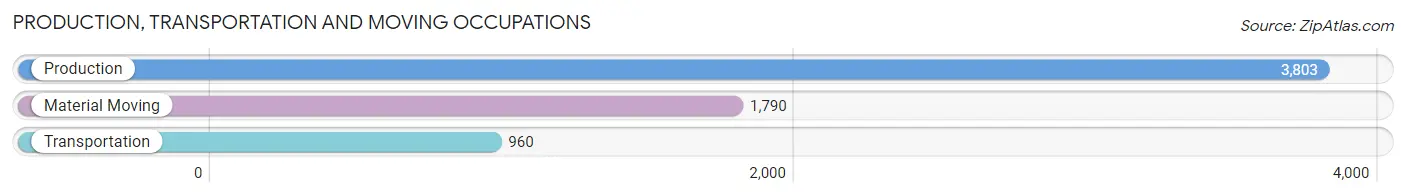
Production, Transportation and Moving Occupations
The most common Production, Transportation and Moving occupations in Laurens County are Production (3,803 | 13.0%), Material Moving (1,790 | 6.1%), and Transportation (960 | 3.3%).
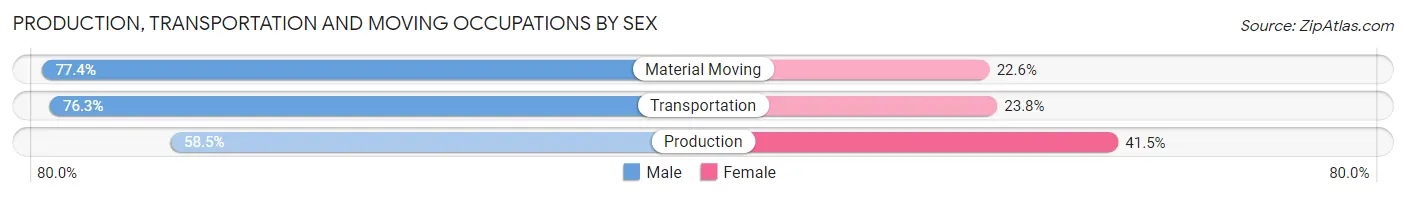
Production, Transportation and Moving Occupations by Sex
| Occupation | Male | Female |
| Production | 2,224 (58.5%) | 1,579 (41.5%) |
| Transportation | 732 (76.2%) | 228 (23.7%) |
| Material Moving | 1,385 (77.4%) | 405 (22.6%) |
| Total (Category) | 4,341 (66.2%) | 2,212 (33.8%) |
| Total (Overall) | 15,011 (51.3%) | 14,253 (48.7%) |
Employment Industries by Sex in Laurens County
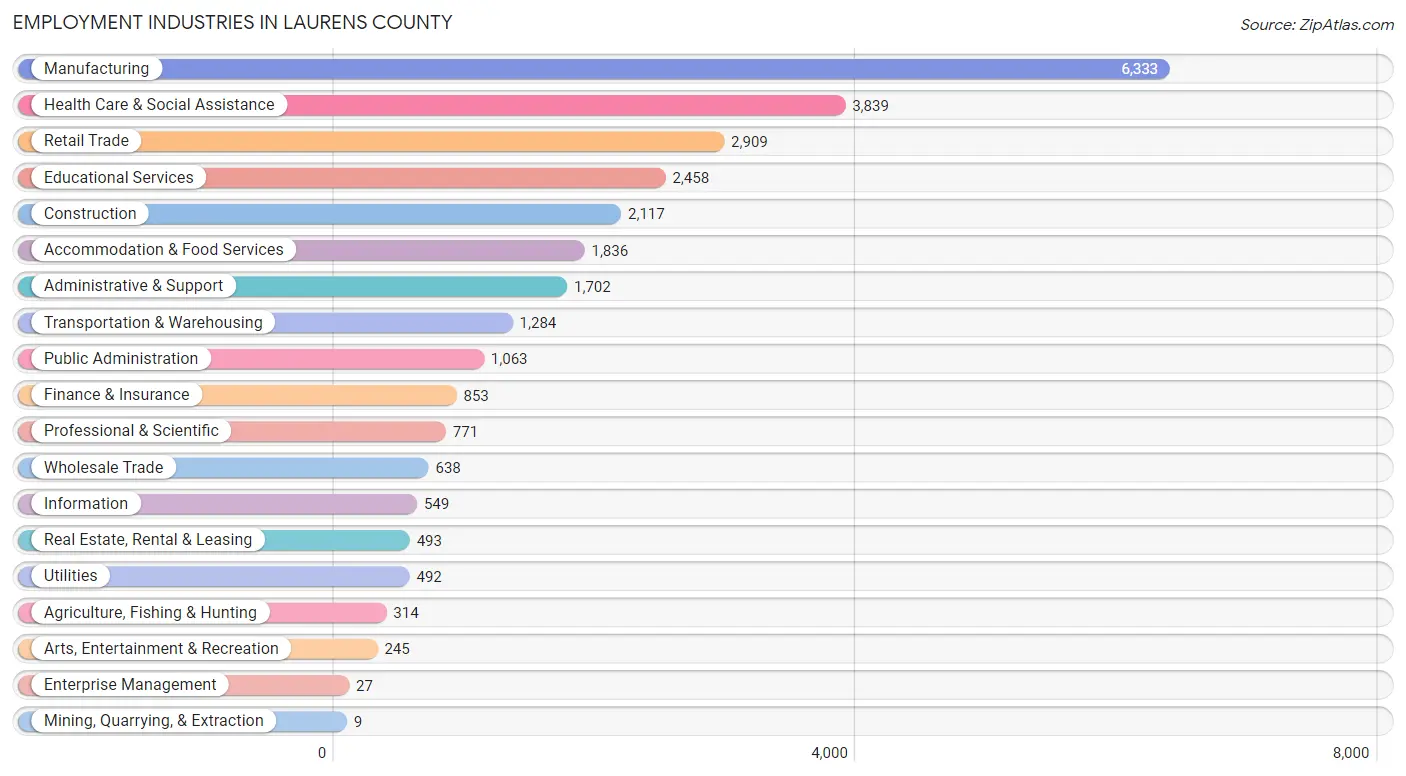
Employment Industries in Laurens County
The major employment industries in Laurens County include Manufacturing (6,333 | 21.6%), Health Care & Social Assistance (3,839 | 13.1%), Retail Trade (2,909 | 9.9%), Educational Services (2,458 | 8.4%), and Construction (2,117 | 7.2%).
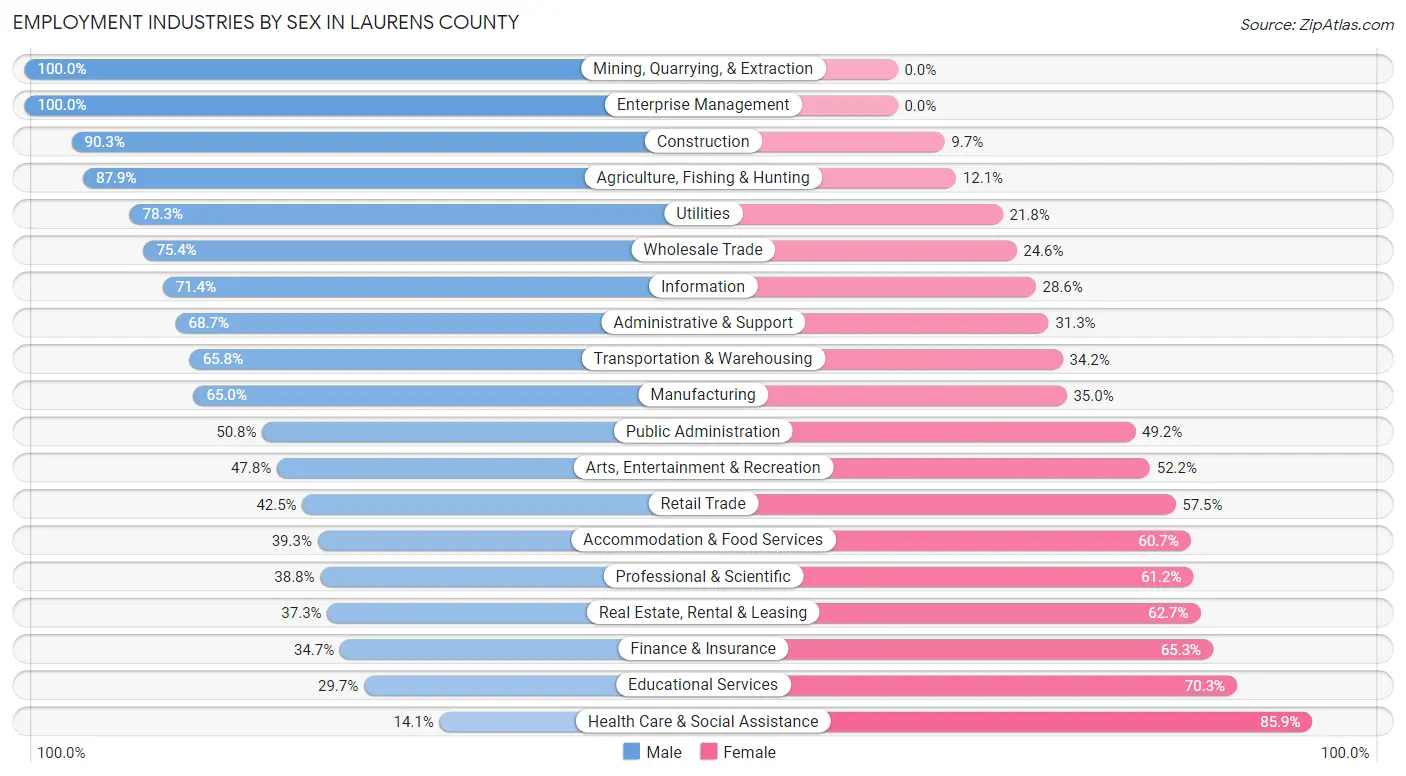
Employment Industries by Sex in Laurens County
The Laurens County industries that see more men than women are Mining, Quarrying, & Extraction (100.0%), Enterprise Management (100.0%), and Construction (90.3%), whereas the industries that tend to have a higher number of women are Health Care & Social Assistance (85.9%), Educational Services (70.3%), and Finance & Insurance (65.3%).
| Industry | Male | Female |
| Agriculture, Fishing & Hunting | 276 (87.9%) | 38 (12.1%) |
| Mining, Quarrying, & Extraction | 9 (100.0%) | 0 (0.0%) |
| Construction | 1,911 (90.3%) | 206 (9.7%) |
| Manufacturing | 4,117 (65.0%) | 2,216 (35.0%) |
| Wholesale Trade | 481 (75.4%) | 157 (24.6%) |
| Retail Trade | 1,236 (42.5%) | 1,673 (57.5%) |
| Transportation & Warehousing | 845 (65.8%) | 439 (34.2%) |
| Utilities | 385 (78.2%) | 107 (21.7%) |
| Information | 392 (71.4%) | 157 (28.6%) |
| Finance & Insurance | 296 (34.7%) | 557 (65.3%) |
| Real Estate, Rental & Leasing | 184 (37.3%) | 309 (62.7%) |
| Professional & Scientific | 299 (38.8%) | 472 (61.2%) |
| Enterprise Management | 27 (100.0%) | 0 (0.0%) |
| Administrative & Support | 1,170 (68.7%) | 532 (31.3%) |
| Educational Services | 731 (29.7%) | 1,727 (70.3%) |
| Health Care & Social Assistance | 542 (14.1%) | 3,297 (85.9%) |
| Arts, Entertainment & Recreation | 117 (47.8%) | 128 (52.2%) |
| Accommodation & Food Services | 722 (39.3%) | 1,114 (60.7%) |
| Public Administration | 540 (50.8%) | 523 (49.2%) |
| Total | 15,011 (51.3%) | 14,253 (48.7%) |
Education in Laurens County
School Enrollment in Laurens County
The most common levels of schooling among the 14,126 students in Laurens County are elementary school (3,486 | 24.7%), high school (3,248 | 23.0%), and middle school (2,952 | 20.9%).
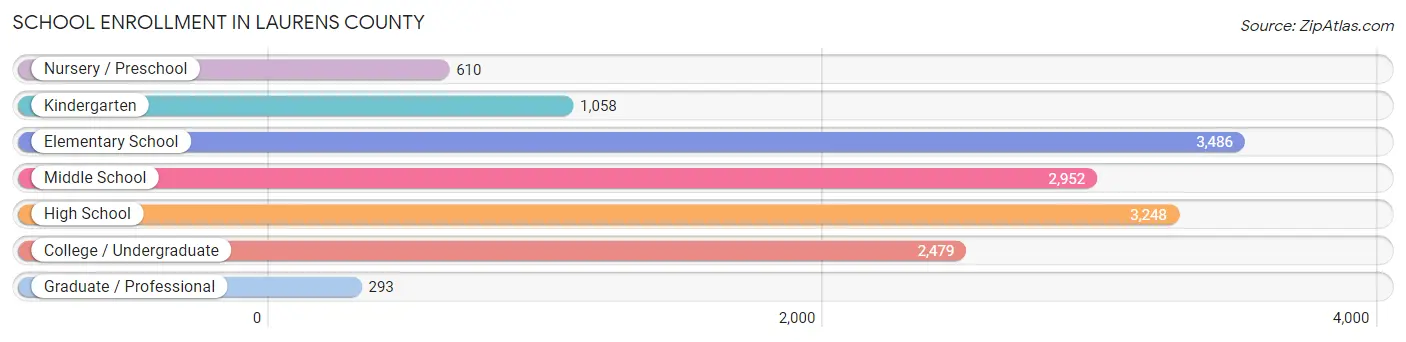
| School Level | # Students | % Students |
| Nursery / Preschool | 610 | 4.3% |
| Kindergarten | 1,058 | 7.5% |
| Elementary School | 3,486 | 24.7% |
| Middle School | 2,952 | 20.9% |
| High School | 3,248 | 23.0% |
| College / Undergraduate | 2,479 | 17.5% |
| Graduate / Professional | 293 | 2.1% |
| Total | 14,126 | 100.0% |
School Enrollment by Age by Funding Source in Laurens County
Out of a total of 14,126 students who are enrolled in schools in Laurens County, 2,430 (17.2%) attend a private institution, while the remaining 11,696 (82.8%) are enrolled in public schools. The age group of 20 to 24 year olds has the highest likelihood of being enrolled in private schools, with 680 (62.5% in the age bracket) enrolled. Conversely, the age group of 5 to 9 year old has the lowest likelihood of being enrolled in a private school, with 3,893 (95.2% in the age bracket) attending a public institution.
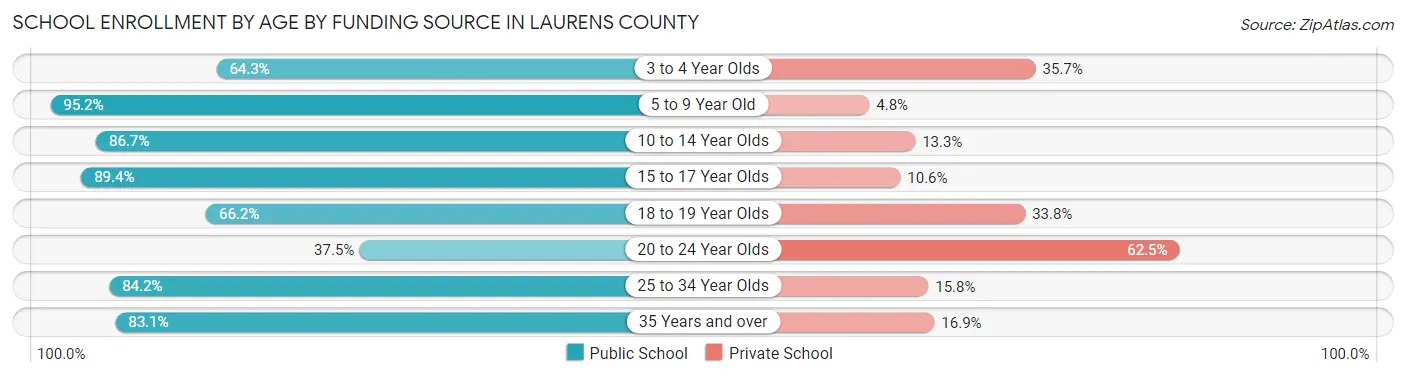
| Age Bracket | Public School | Private School |
| 3 to 4 Year Olds | 392 (64.3%) | 218 (35.7%) |
| 5 to 9 Year Old | 3,893 (95.2%) | 196 (4.8%) |
| 10 to 14 Year Olds | 3,164 (86.7%) | 486 (13.3%) |
| 15 to 17 Year Olds | 2,151 (89.4%) | 254 (10.6%) |
| 18 to 19 Year Olds | 828 (66.2%) | 423 (33.8%) |
| 20 to 24 Year Olds | 408 (37.5%) | 680 (62.5%) |
| 25 to 34 Year Olds | 262 (84.2%) | 49 (15.8%) |
| 35 Years and over | 600 (83.1%) | 122 (16.9%) |
| Total | 11,696 (82.8%) | 2,430 (17.2%) |
Educational Attainment by Field of Study in Laurens County
Education (2,207 | 25.4%), business (2,075 | 23.8%), science & technology (762 | 8.8%), liberal arts & history (508 | 5.8%), and arts & humanities (479 | 5.5%) are the most common fields of study among 8,699 individuals in Laurens County who have obtained a bachelor's degree or higher.
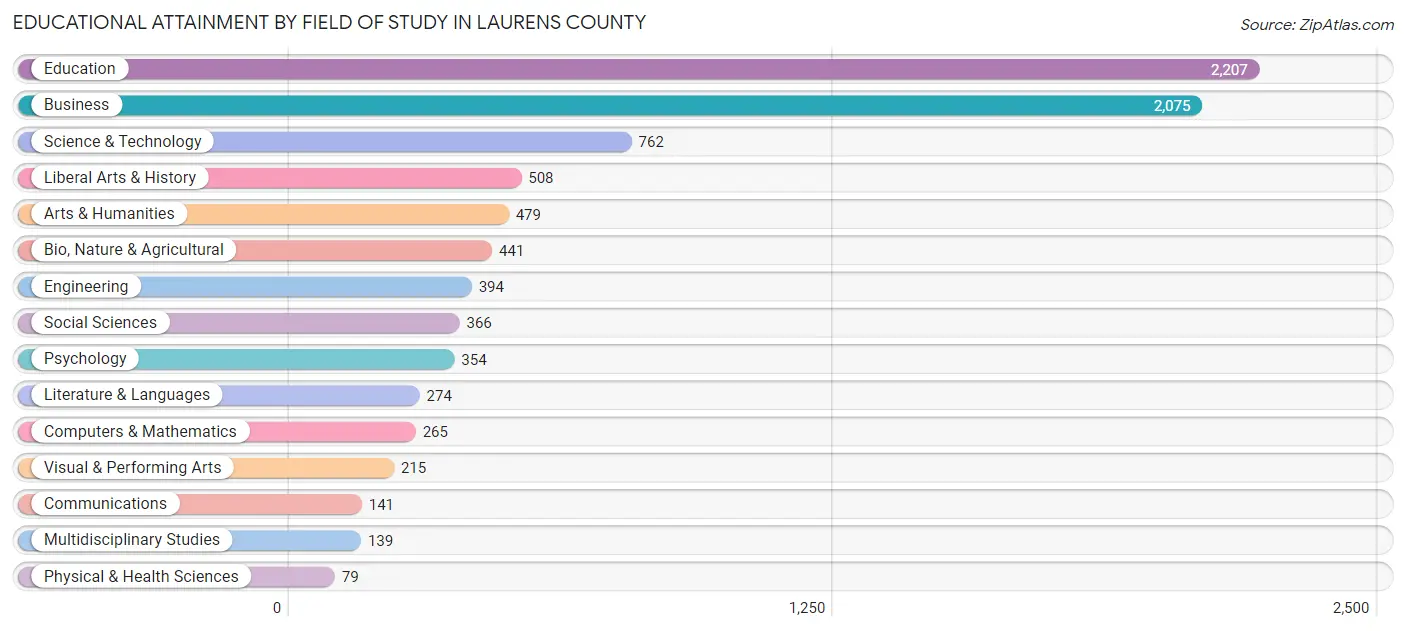
| Field of Study | # Graduates | % Graduates |
| Computers & Mathematics | 265 | 3.0% |
| Bio, Nature & Agricultural | 441 | 5.1% |
| Physical & Health Sciences | 79 | 0.9% |
| Psychology | 354 | 4.1% |
| Social Sciences | 366 | 4.2% |
| Engineering | 394 | 4.5% |
| Multidisciplinary Studies | 139 | 1.6% |
| Science & Technology | 762 | 8.8% |
| Business | 2,075 | 23.8% |
| Education | 2,207 | 25.4% |
| Literature & Languages | 274 | 3.2% |
| Liberal Arts & History | 508 | 5.8% |
| Visual & Performing Arts | 215 | 2.5% |
| Communications | 141 | 1.6% |
| Arts & Humanities | 479 | 5.5% |
| Total | 8,699 | 100.0% |
Transportation & Commute in Laurens County
Vehicle Availability by Sex in Laurens County
The most prevalent vehicle ownership categories in Laurens County are males with 2 vehicles (6,172, accounting for 42.8%) and females with 2 vehicles (4,942, making up 45.1%).
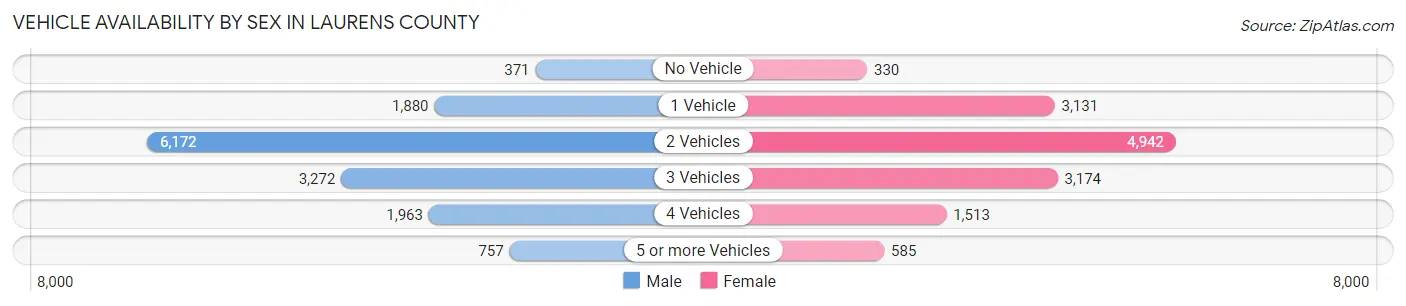
| Vehicles Available | Male | Female |
| No Vehicle | 371 (2.6%) | 330 (2.4%) |
| 1 Vehicle | 1,880 (13.0%) | 3,131 (22.9%) |
| 2 Vehicles | 6,172 (42.8%) | 4,942 (36.1%) |
| 3 Vehicles | 3,272 (22.7%) | 3,174 (23.2%) |
| 4 Vehicles | 1,963 (13.6%) | 1,513 (11.1%) |
| 5 or more Vehicles | 757 (5.2%) | 585 (4.3%) |
| Total | 14,415 (100.0%) | 13,675 (100.0%) |
Commute Time in Laurens County
The most frequently occuring commute durations in Laurens County are 15 to 19 minutes (4,104 commuters, 15.2%), 20 to 24 minutes (3,658 commuters, 13.6%), and 30 to 34 minutes (3,583 commuters, 13.3%).
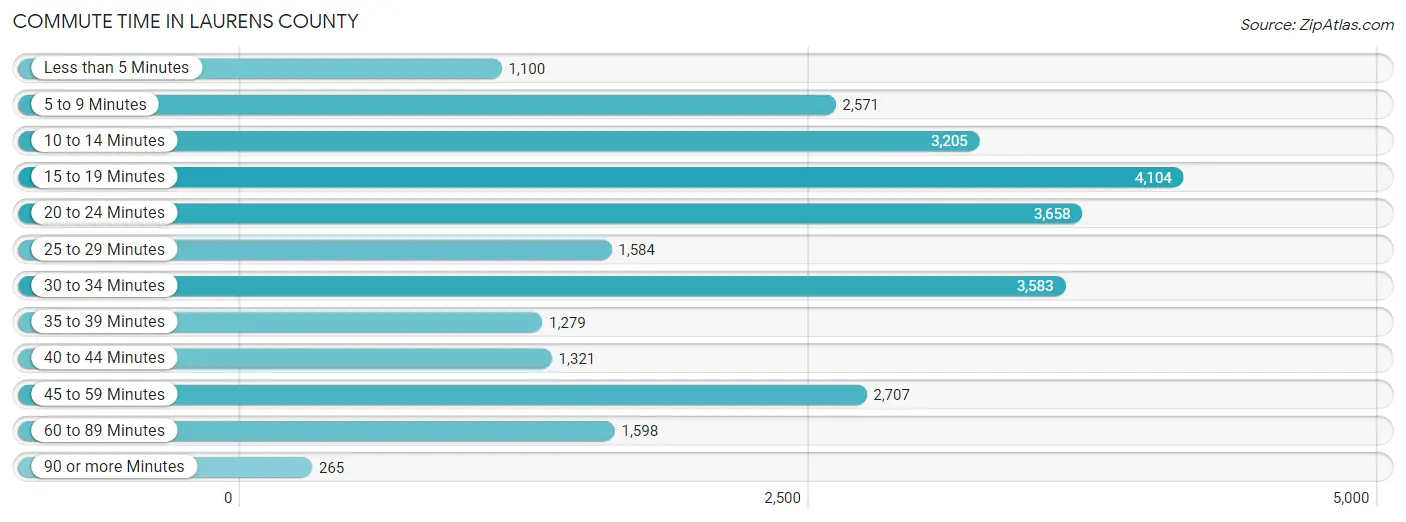
| Commute Time | # Commuters | % Commuters |
| Less than 5 Minutes | 1,100 | 4.1% |
| 5 to 9 Minutes | 2,571 | 9.5% |
| 10 to 14 Minutes | 3,205 | 11.9% |
| 15 to 19 Minutes | 4,104 | 15.2% |
| 20 to 24 Minutes | 3,658 | 13.6% |
| 25 to 29 Minutes | 1,584 | 5.9% |
| 30 to 34 Minutes | 3,583 | 13.3% |
| 35 to 39 Minutes | 1,279 | 4.7% |
| 40 to 44 Minutes | 1,321 | 4.9% |
| 45 to 59 Minutes | 2,707 | 10.0% |
| 60 to 89 Minutes | 1,598 | 5.9% |
| 90 or more Minutes | 265 | 1.0% |
Commute Time by Sex in Laurens County
The most common commute times in Laurens County are 15 to 19 minutes (2,104 commuters, 15.4%) for males and 20 to 24 minutes (2,017 commuters, 15.1%) for females.
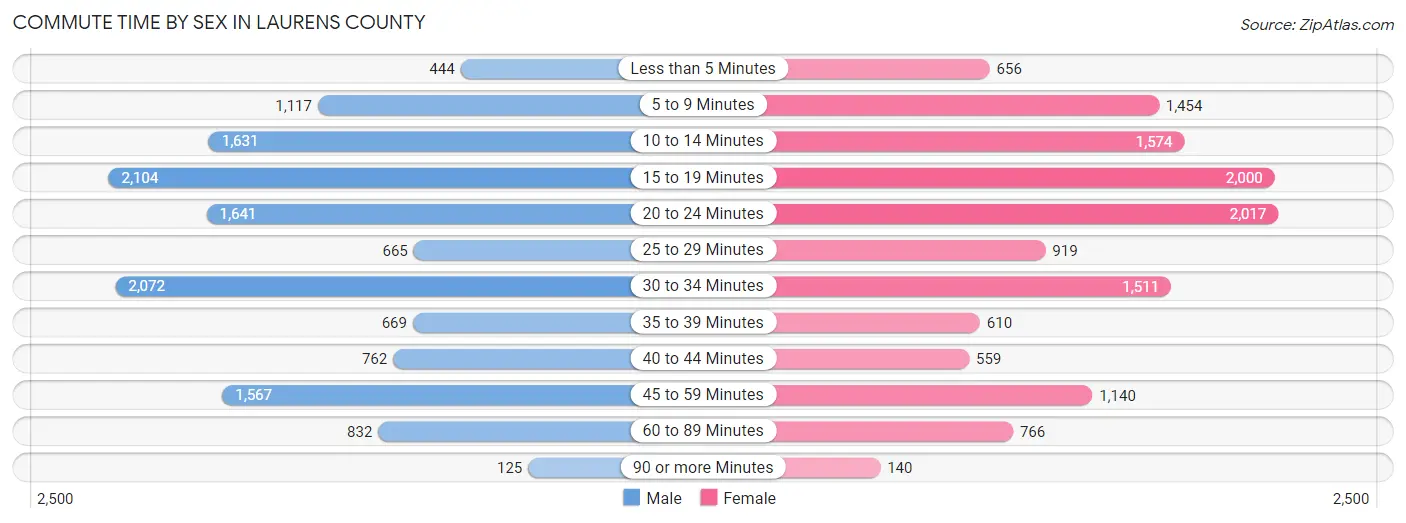
| Commute Time | Male | Female |
| Less than 5 Minutes | 444 (3.3%) | 656 (4.9%) |
| 5 to 9 Minutes | 1,117 (8.2%) | 1,454 (10.9%) |
| 10 to 14 Minutes | 1,631 (12.0%) | 1,574 (11.8%) |
| 15 to 19 Minutes | 2,104 (15.4%) | 2,000 (15.0%) |
| 20 to 24 Minutes | 1,641 (12.0%) | 2,017 (15.1%) |
| 25 to 29 Minutes | 665 (4.9%) | 919 (6.9%) |
| 30 to 34 Minutes | 2,072 (15.2%) | 1,511 (11.3%) |
| 35 to 39 Minutes | 669 (4.9%) | 610 (4.6%) |
| 40 to 44 Minutes | 762 (5.6%) | 559 (4.2%) |
| 45 to 59 Minutes | 1,567 (11.5%) | 1,140 (8.5%) |
| 60 to 89 Minutes | 832 (6.1%) | 766 (5.7%) |
| 90 or more Minutes | 125 (0.9%) | 140 (1.1%) |
Time of Departure to Work by Sex in Laurens County
The most frequent times of departure to work in Laurens County are 7:00 AM to 7:29 AM (2,135, 15.7%) for males and 7:00 AM to 7:29 AM (2,059, 15.4%) for females.
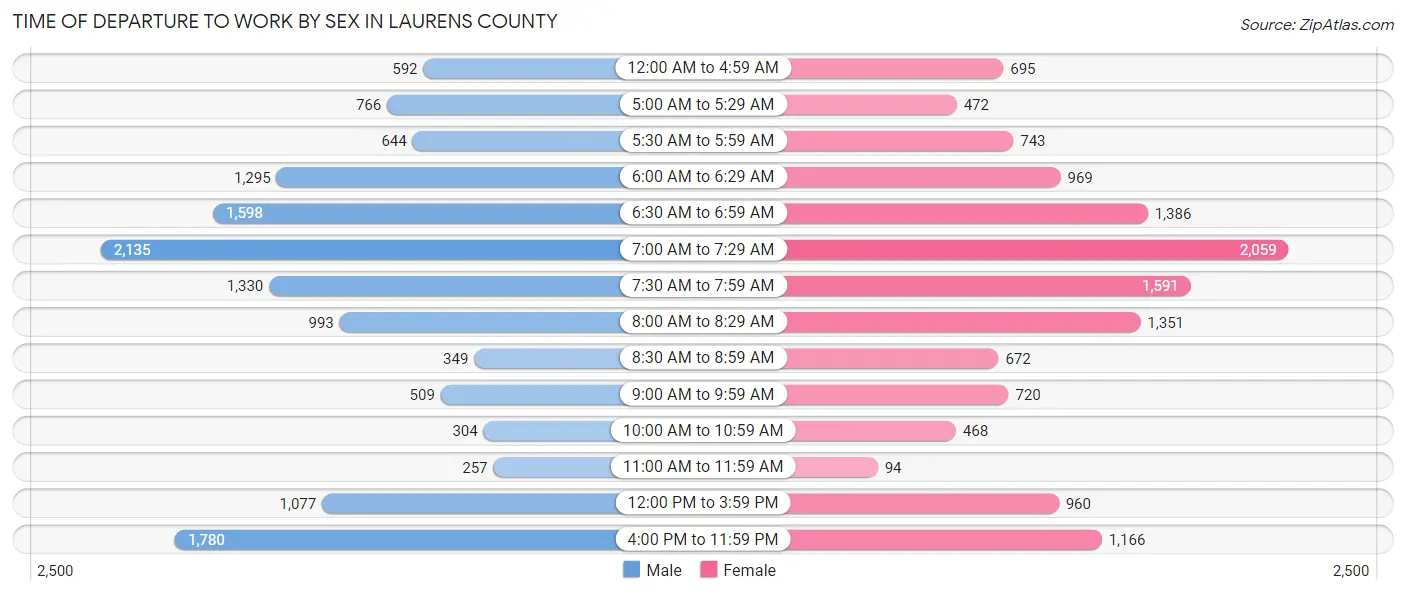
| Time of Departure | Male | Female |
| 12:00 AM to 4:59 AM | 592 (4.3%) | 695 (5.2%) |
| 5:00 AM to 5:29 AM | 766 (5.6%) | 472 (3.5%) |
| 5:30 AM to 5:59 AM | 644 (4.7%) | 743 (5.6%) |
| 6:00 AM to 6:29 AM | 1,295 (9.5%) | 969 (7.3%) |
| 6:30 AM to 6:59 AM | 1,598 (11.7%) | 1,386 (10.4%) |
| 7:00 AM to 7:29 AM | 2,135 (15.7%) | 2,059 (15.4%) |
| 7:30 AM to 7:59 AM | 1,330 (9.8%) | 1,591 (11.9%) |
| 8:00 AM to 8:29 AM | 993 (7.3%) | 1,351 (10.1%) |
| 8:30 AM to 8:59 AM | 349 (2.6%) | 672 (5.0%) |
| 9:00 AM to 9:59 AM | 509 (3.7%) | 720 (5.4%) |
| 10:00 AM to 10:59 AM | 304 (2.2%) | 468 (3.5%) |
| 11:00 AM to 11:59 AM | 257 (1.9%) | 94 (0.7%) |
| 12:00 PM to 3:59 PM | 1,077 (7.9%) | 960 (7.2%) |
| 4:00 PM to 11:59 PM | 1,780 (13.1%) | 1,166 (8.7%) |
| Total | 13,629 (100.0%) | 13,346 (100.0%) |
Housing Occupancy in Laurens County
Occupancy by Ownership in Laurens County
Of the total 25,757 dwellings in Laurens County, owner-occupied units account for 18,366 (71.3%), while renter-occupied units make up 7,391 (28.7%).
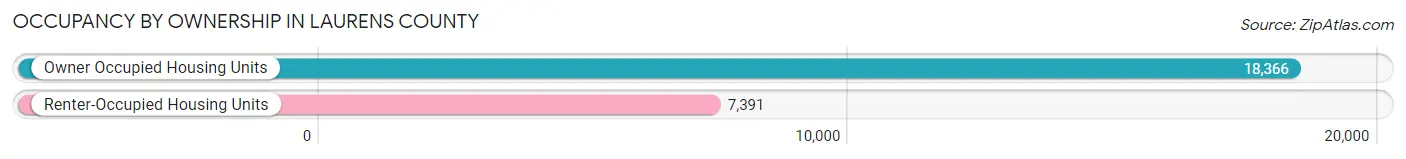
| Occupancy | # Housing Units | % Housing Units |
| Owner Occupied Housing Units | 18,366 | 71.3% |
| Renter-Occupied Housing Units | 7,391 | 28.7% |
| Total Occupied Housing Units | 25,757 | 100.0% |
Occupancy by Household Size in Laurens County
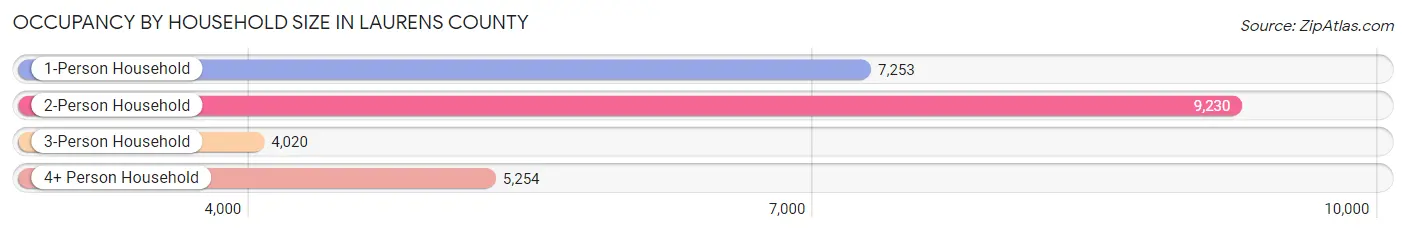
| Household Size | # Housing Units | % Housing Units |
| 1-Person Household | 7,253 | 28.2% |
| 2-Person Household | 9,230 | 35.8% |
| 3-Person Household | 4,020 | 15.6% |
| 4+ Person Household | 5,254 | 20.4% |
| Total Housing Units | 25,757 | 100.0% |
Occupancy by Ownership by Household Size in Laurens County
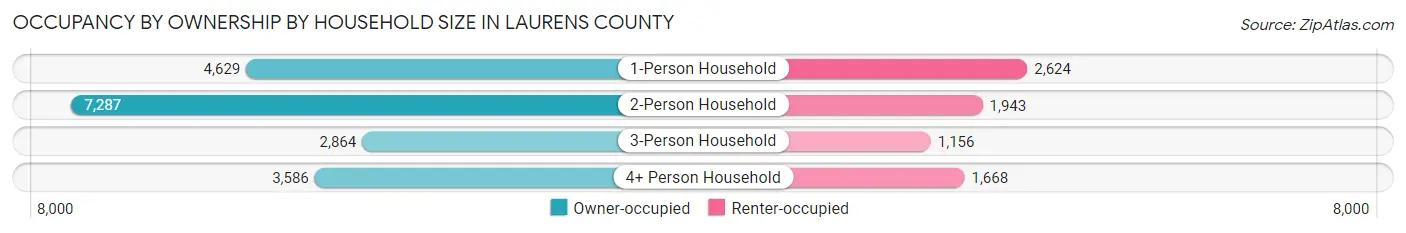
| Household Size | Owner-occupied | Renter-occupied |
| 1-Person Household | 4,629 (63.8%) | 2,624 (36.2%) |
| 2-Person Household | 7,287 (78.9%) | 1,943 (21.0%) |
| 3-Person Household | 2,864 (71.2%) | 1,156 (28.8%) |
| 4+ Person Household | 3,586 (68.2%) | 1,668 (31.8%) |
| Total Housing Units | 18,366 (71.3%) | 7,391 (28.7%) |
Occupancy by Educational Attainment in Laurens County
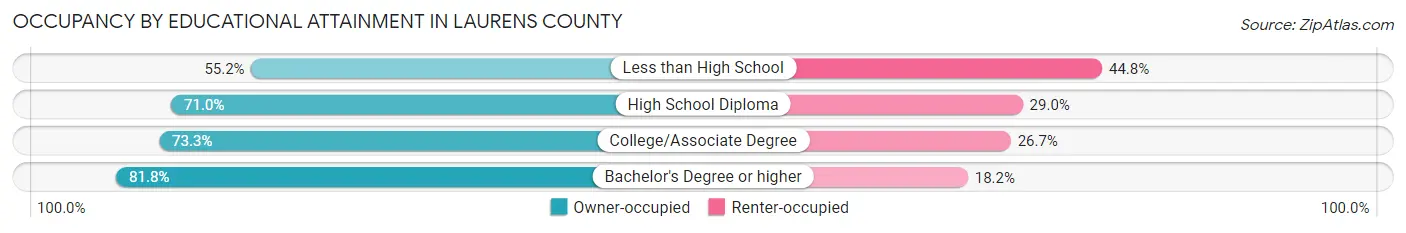
| Household Size | Owner-occupied | Renter-occupied |
| Less than High School | 2,297 (55.2%) | 1,863 (44.8%) |
| High School Diploma | 5,943 (71.0%) | 2,432 (29.0%) |
| College/Associate Degree | 5,988 (73.3%) | 2,178 (26.7%) |
| Bachelor's Degree or higher | 4,138 (81.8%) | 918 (18.2%) |
Occupancy by Age of Householder in Laurens County
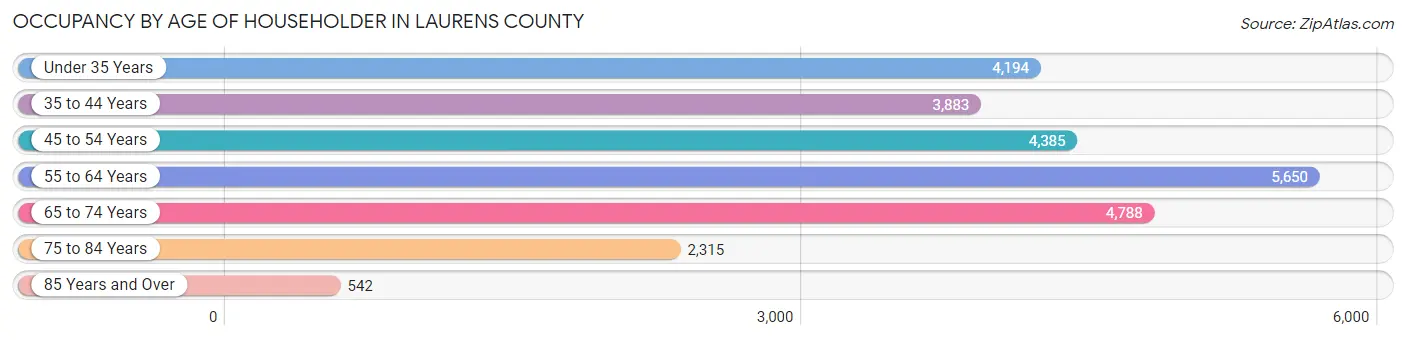
| Age Bracket | # Households | % Households |
| Under 35 Years | 4,194 | 16.3% |
| 35 to 44 Years | 3,883 | 15.1% |
| 45 to 54 Years | 4,385 | 17.0% |
| 55 to 64 Years | 5,650 | 21.9% |
| 65 to 74 Years | 4,788 | 18.6% |
| 75 to 84 Years | 2,315 | 9.0% |
| 85 Years and Over | 542 | 2.1% |
| Total | 25,757 | 100.0% |
Housing Finances in Laurens County
Median Income by Occupancy in Laurens County
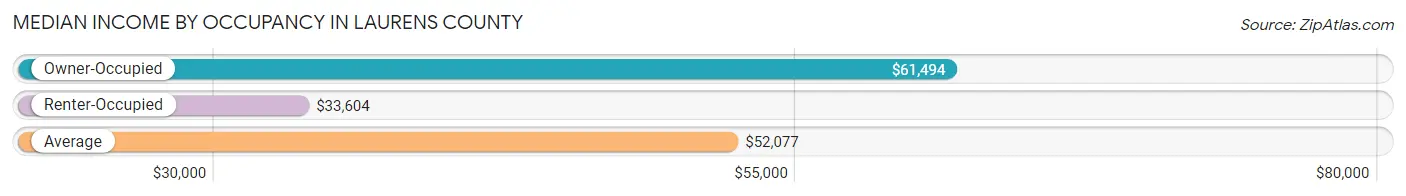
| Occupancy Type | # Households | Median Income |
| Owner-Occupied | 18,366 (71.3%) | $61,494 |
| Renter-Occupied | 7,391 (28.7%) | $33,604 |
| Average | 25,757 (100.0%) | $52,077 |
Occupancy by Householder Income Bracket in Laurens County
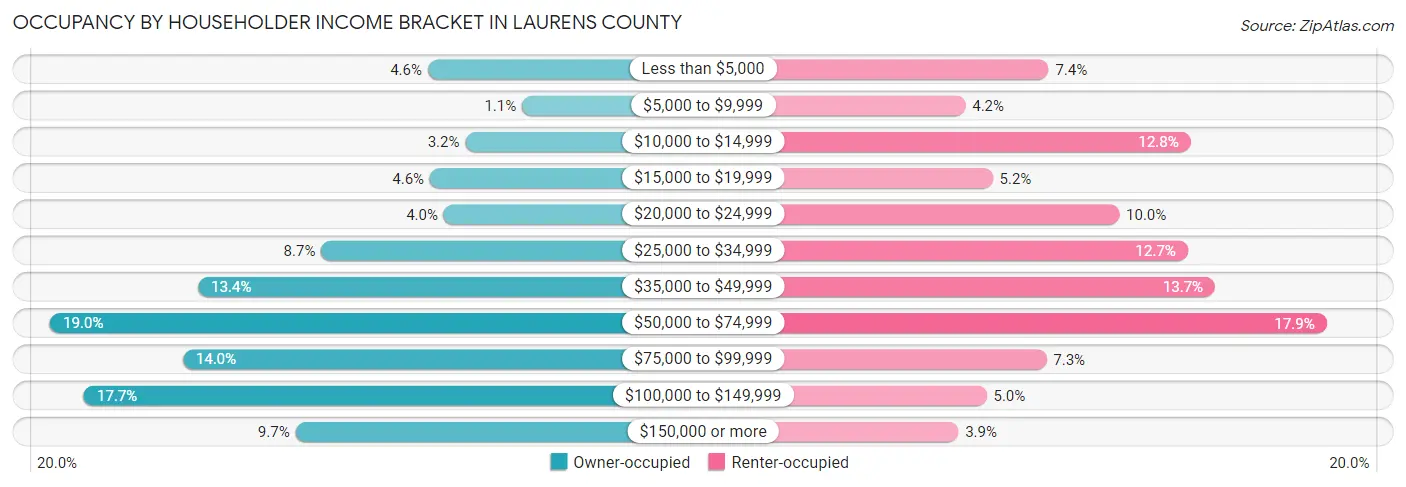
| Income Bracket | Owner-occupied | Renter-occupied |
| Less than $5,000 | 852 (4.6%) | 543 (7.3%) |
| $5,000 to $9,999 | 192 (1.1%) | 309 (4.2%) |
| $10,000 to $14,999 | 590 (3.2%) | 943 (12.8%) |
| $15,000 to $19,999 | 838 (4.6%) | 386 (5.2%) |
| $20,000 to $24,999 | 741 (4.0%) | 742 (10.0%) |
| $25,000 to $34,999 | 1,597 (8.7%) | 935 (12.7%) |
| $35,000 to $49,999 | 2,460 (13.4%) | 1,012 (13.7%) |
| $50,000 to $74,999 | 3,495 (19.0%) | 1,326 (17.9%) |
| $75,000 to $99,999 | 2,566 (14.0%) | 537 (7.3%) |
| $100,000 to $149,999 | 3,258 (17.7%) | 369 (5.0%) |
| $150,000 or more | 1,777 (9.7%) | 289 (3.9%) |
| Total | 18,366 (100.0%) | 7,391 (100.0%) |
Monthly Housing Cost Tiers in Laurens County
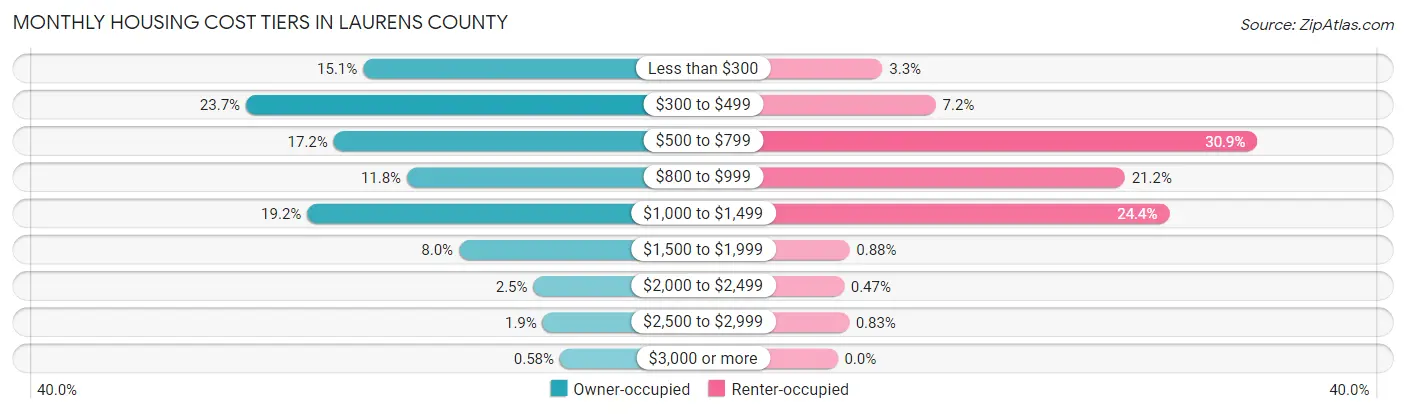
| Monthly Cost | Owner-occupied | Renter-occupied |
| Less than $300 | 2,768 (15.1%) | 245 (3.3%) |
| $300 to $499 | 4,352 (23.7%) | 534 (7.2%) |
| $500 to $799 | 3,166 (17.2%) | 2,285 (30.9%) |
| $800 to $999 | 2,174 (11.8%) | 1,564 (21.2%) |
| $1,000 to $1,499 | 3,524 (19.2%) | 1,806 (24.4%) |
| $1,500 to $1,999 | 1,472 (8.0%) | 65 (0.9%) |
| $2,000 to $2,499 | 464 (2.5%) | 35 (0.5%) |
| $2,500 to $2,999 | 340 (1.8%) | 61 (0.8%) |
| $3,000 or more | 106 (0.6%) | 0 (0.0%) |
| Total | 18,366 (100.0%) | 7,391 (100.0%) |
Physical Housing Characteristics in Laurens County
Housing Structures in Laurens County
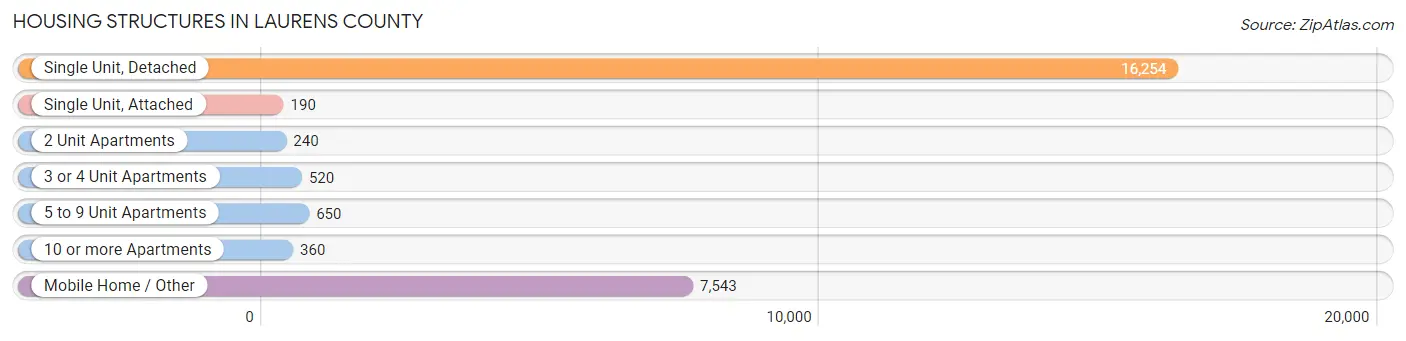
| Structure Type | # Housing Units | % Housing Units |
| Single Unit, Detached | 16,254 | 63.1% |
| Single Unit, Attached | 190 | 0.7% |
| 2 Unit Apartments | 240 | 0.9% |
| 3 or 4 Unit Apartments | 520 | 2.0% |
| 5 to 9 Unit Apartments | 650 | 2.5% |
| 10 or more Apartments | 360 | 1.4% |
| Mobile Home / Other | 7,543 | 29.3% |
| Total | 25,757 | 100.0% |
Housing Structures by Occupancy in Laurens County
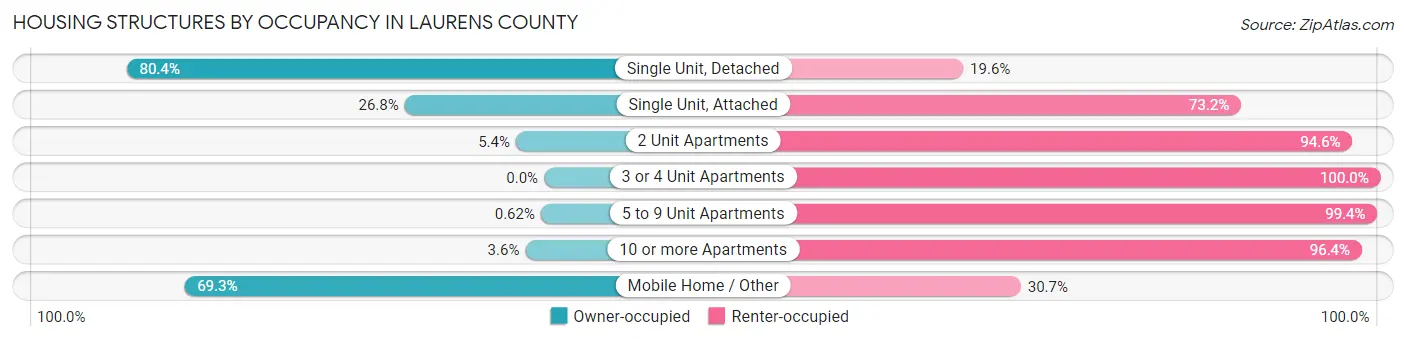
| Structure Type | Owner-occupied | Renter-occupied |
| Single Unit, Detached | 13,061 (80.4%) | 3,193 (19.6%) |
| Single Unit, Attached | 51 (26.8%) | 139 (73.2%) |
| 2 Unit Apartments | 13 (5.4%) | 227 (94.6%) |
| 3 or 4 Unit Apartments | 0 (0.0%) | 520 (100.0%) |
| 5 to 9 Unit Apartments | 4 (0.6%) | 646 (99.4%) |
| 10 or more Apartments | 13 (3.6%) | 347 (96.4%) |
| Mobile Home / Other | 5,224 (69.3%) | 2,319 (30.7%) |
| Total | 18,366 (71.3%) | 7,391 (28.7%) |
Housing Structures by Number of Rooms in Laurens County
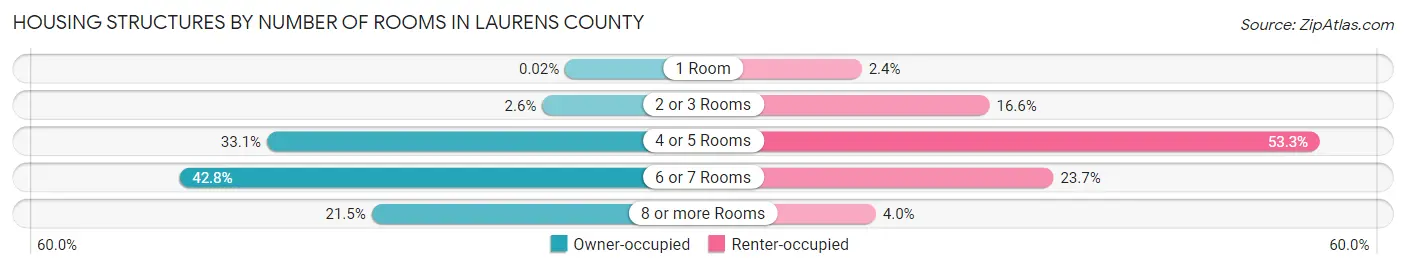
| Number of Rooms | Owner-occupied | Renter-occupied |
| 1 Room | 3 (0.0%) | 179 (2.4%) |
| 2 or 3 Rooms | 469 (2.5%) | 1,228 (16.6%) |
| 4 or 5 Rooms | 6,081 (33.1%) | 3,937 (53.3%) |
| 6 or 7 Rooms | 7,867 (42.8%) | 1,752 (23.7%) |
| 8 or more Rooms | 3,946 (21.5%) | 295 (4.0%) |
| Total | 18,366 (100.0%) | 7,391 (100.0%) |
Housing Structure by Heating Type in Laurens County
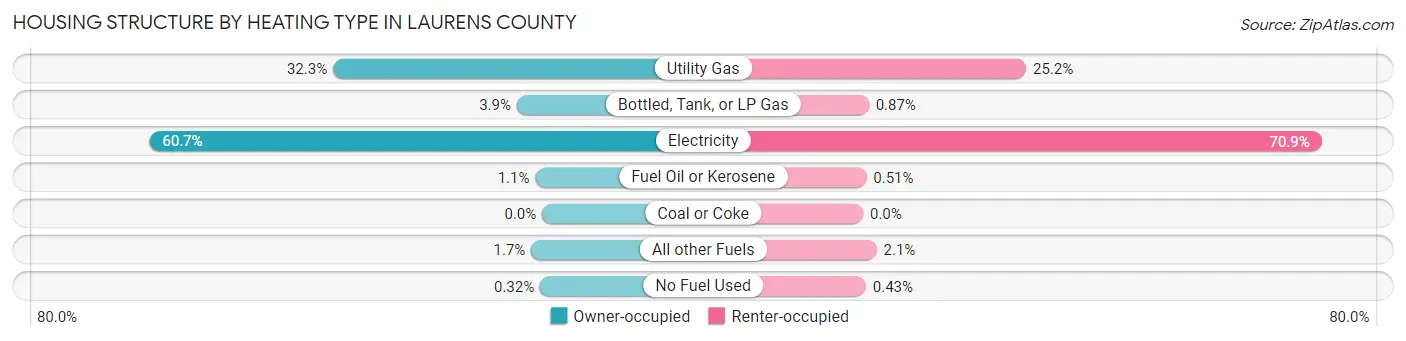
| Heating Type | Owner-occupied | Renter-occupied |
| Utility Gas | 5,938 (32.3%) | 1,863 (25.2%) |
| Bottled, Tank, or LP Gas | 718 (3.9%) | 64 (0.9%) |
| Electricity | 11,150 (60.7%) | 5,239 (70.9%) |
| Fuel Oil or Kerosene | 192 (1.1%) | 38 (0.5%) |
| Coal or Coke | 0 (0.0%) | 0 (0.0%) |
| All other Fuels | 310 (1.7%) | 155 (2.1%) |
| No Fuel Used | 58 (0.3%) | 32 (0.4%) |
| Total | 18,366 (100.0%) | 7,391 (100.0%) |
Household Vehicle Usage in Laurens County
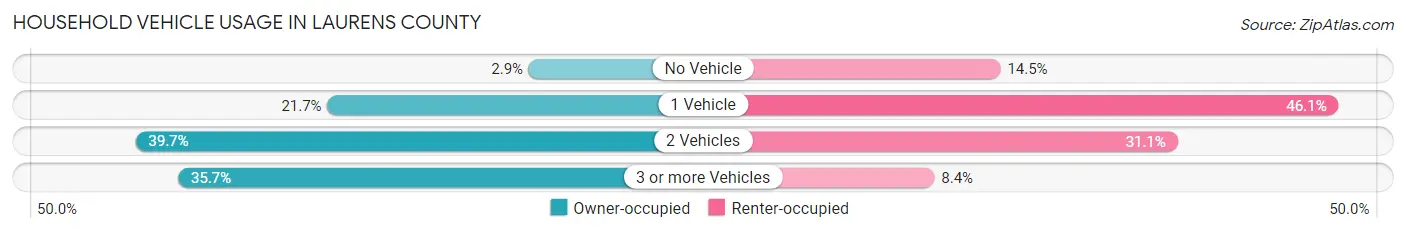
| Vehicles per Household | Owner-occupied | Renter-occupied |
| No Vehicle | 537 (2.9%) | 1,073 (14.5%) |
| 1 Vehicle | 3,991 (21.7%) | 3,405 (46.1%) |
| 2 Vehicles | 7,284 (39.7%) | 2,296 (31.1%) |
| 3 or more Vehicles | 6,554 (35.7%) | 617 (8.4%) |
| Total | 18,366 (100.0%) | 7,391 (100.0%) |
Real Estate & Mortgages in Laurens County
Real Estate and Mortgage Overview in Laurens County
| Characteristic | Without Mortgage | With Mortgage |
| Housing Units | 9,390 | 8,976 |
| Median Property Value | $107,000 | $162,900 |
| Median Household Income | $48,938 | $1,059 |
| Monthly Housing Costs | $374 | $104 |
| Real Estate Taxes | $456 | $184 |
Property Value by Mortgage Status in Laurens County
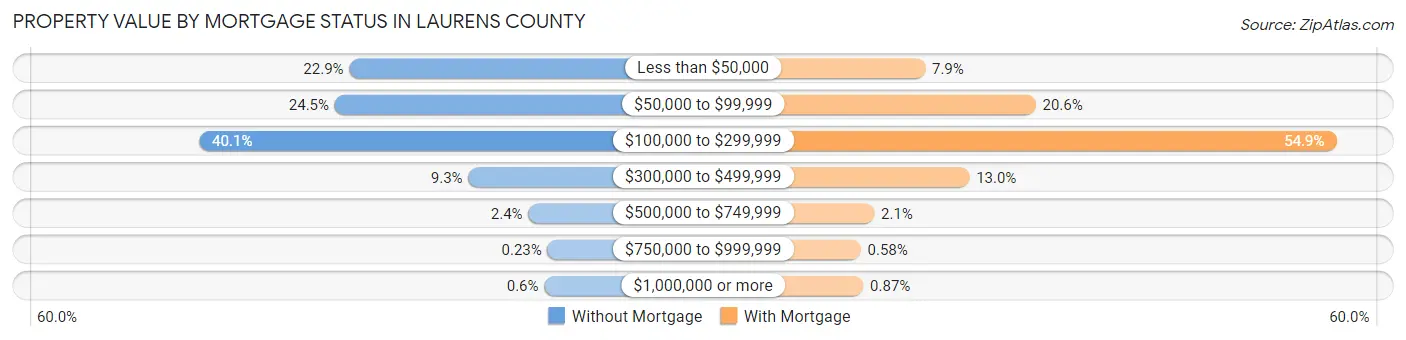
| Property Value | Without Mortgage | With Mortgage |
| Less than $50,000 | 2,148 (22.9%) | 713 (7.9%) |
| $50,000 to $99,999 | 2,304 (24.5%) | 1,846 (20.6%) |
| $100,000 to $299,999 | 3,762 (40.1%) | 4,931 (54.9%) |
| $300,000 to $499,999 | 871 (9.3%) | 1,166 (13.0%) |
| $500,000 to $749,999 | 227 (2.4%) | 190 (2.1%) |
| $750,000 to $999,999 | 22 (0.2%) | 52 (0.6%) |
| $1,000,000 or more | 56 (0.6%) | 78 (0.9%) |
| Total | 9,390 (100.0%) | 8,976 (100.0%) |
Household Income by Mortgage Status in Laurens County
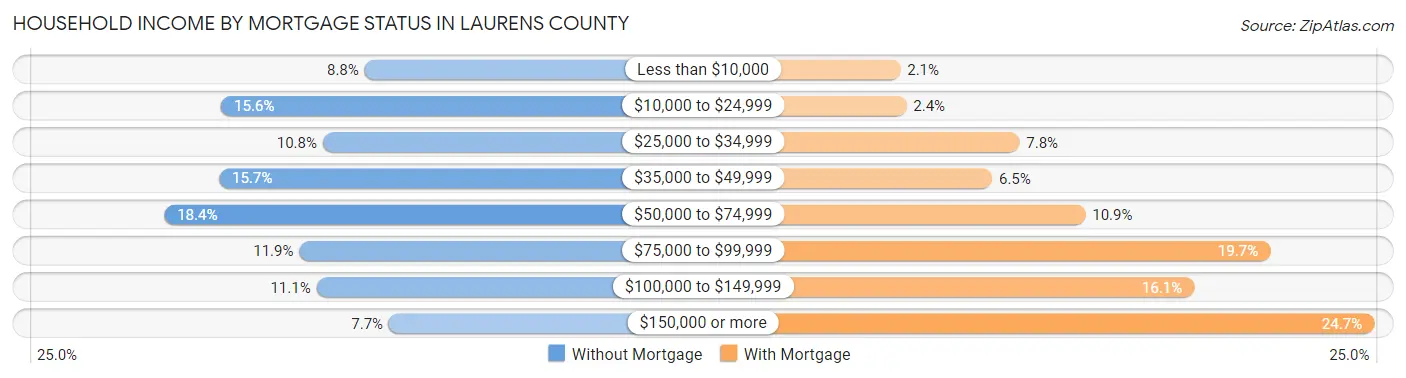
| Household Income | Without Mortgage | With Mortgage |
| Less than $10,000 | 827 (8.8%) | 191 (2.1%) |
| $10,000 to $24,999 | 1,469 (15.6%) | 217 (2.4%) |
| $25,000 to $34,999 | 1,014 (10.8%) | 700 (7.8%) |
| $35,000 to $49,999 | 1,478 (15.7%) | 583 (6.5%) |
| $50,000 to $74,999 | 1,723 (18.3%) | 982 (10.9%) |
| $75,000 to $99,999 | 1,119 (11.9%) | 1,772 (19.7%) |
| $100,000 to $149,999 | 1,042 (11.1%) | 1,447 (16.1%) |
| $150,000 or more | 718 (7.6%) | 2,216 (24.7%) |
| Total | 9,390 (100.0%) | 8,976 (100.0%) |
Property Value to Household Income Ratio in Laurens County
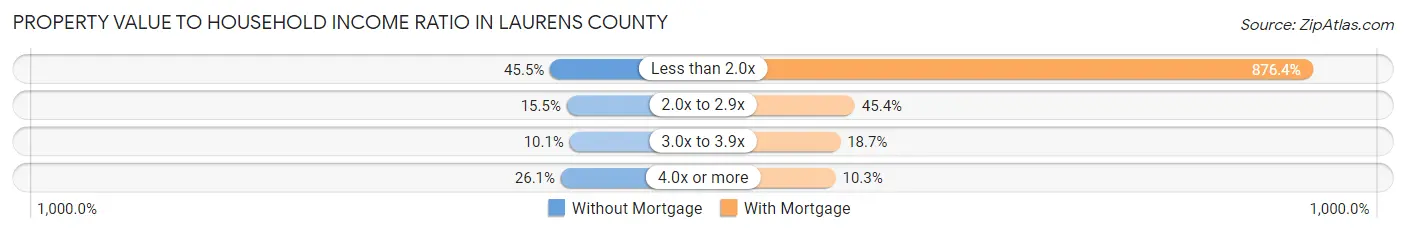
| Value-to-Income Ratio | Without Mortgage | With Mortgage |
| Less than 2.0x | 4,275 (45.5%) | 78,666 (876.4%) |
| 2.0x to 2.9x | 1,451 (15.4%) | 4,074 (45.4%) |
| 3.0x to 3.9x | 944 (10.1%) | 1,677 (18.7%) |
| 4.0x or more | 2,448 (26.1%) | 923 (10.3%) |
| Total | 9,390 (100.0%) | 8,976 (100.0%) |
Real Estate Taxes by Mortgage Status in Laurens County
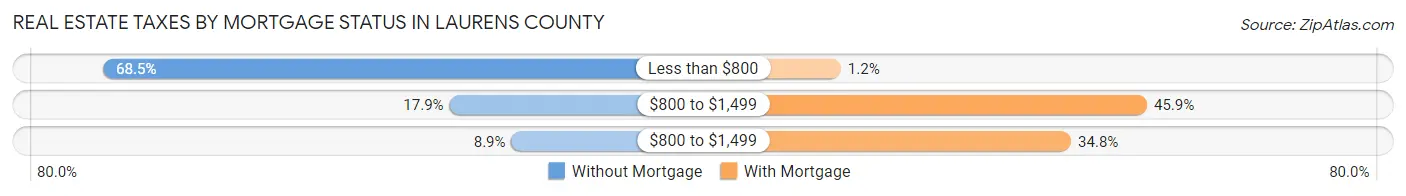
| Property Taxes | Without Mortgage | With Mortgage |
| Less than $800 | 6,435 (68.5%) | 103 (1.1%) |
| $800 to $1,499 | 1,684 (17.9%) | 4,118 (45.9%) |
| $800 to $1,499 | 833 (8.9%) | 3,123 (34.8%) |
| Total | 9,390 (100.0%) | 8,976 (100.0%) |
Health & Disability in Laurens County
Health Insurance Coverage by Age in Laurens County
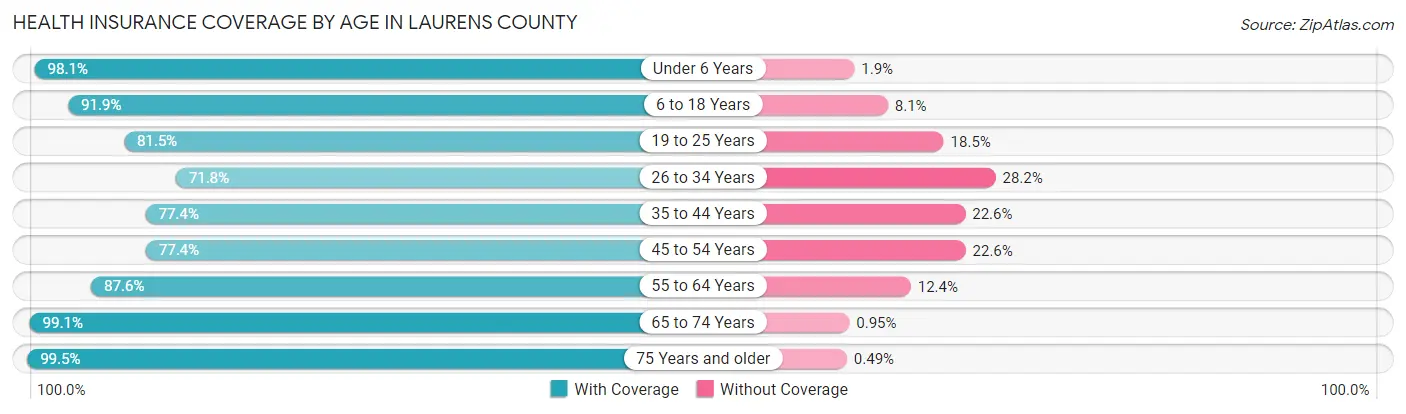
| Age Bracket | With Coverage | Without Coverage |
| Under 6 Years | 4,582 (98.1%) | 88 (1.9%) |
| 6 to 18 Years | 9,950 (91.9%) | 879 (8.1%) |
| 19 to 25 Years | 4,586 (81.5%) | 1,043 (18.5%) |
| 26 to 34 Years | 5,387 (71.8%) | 2,117 (28.2%) |
| 35 to 44 Years | 6,067 (77.4%) | 1,767 (22.6%) |
| 45 to 54 Years | 6,584 (77.4%) | 1,925 (22.6%) |
| 55 to 64 Years | 8,327 (87.6%) | 1,179 (12.4%) |
| 65 to 74 Years | 7,435 (99.1%) | 71 (0.9%) |
| 75 Years and older | 4,253 (99.5%) | 21 (0.5%) |
| Total | 57,171 (86.3%) | 9,090 (13.7%) |
Health Insurance Coverage by Citizenship Status in Laurens County
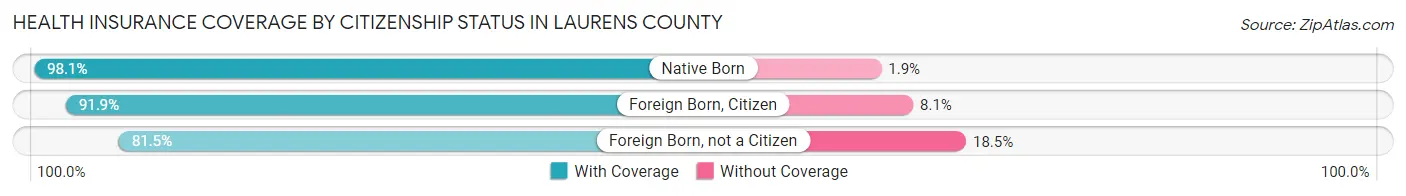
| Citizenship Status | With Coverage | Without Coverage |
| Native Born | 4,582 (98.1%) | 88 (1.9%) |
| Foreign Born, Citizen | 9,950 (91.9%) | 879 (8.1%) |
| Foreign Born, not a Citizen | 4,586 (81.5%) | 1,043 (18.5%) |
Health Insurance Coverage by Household Income in Laurens County
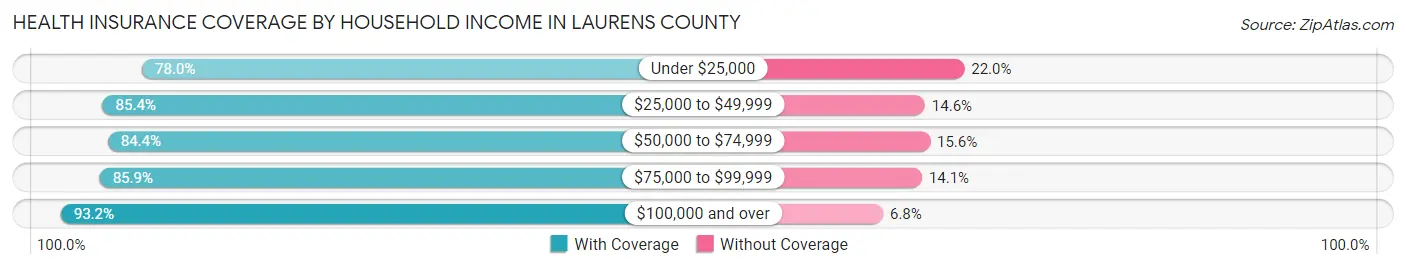
| Household Income | With Coverage | Without Coverage |
| Under $25,000 | 8,707 (78.0%) | 2,459 (22.0%) |
| $25,000 to $49,999 | 11,557 (85.4%) | 1,981 (14.6%) |
| $50,000 to $74,999 | 10,432 (84.4%) | 1,927 (15.6%) |
| $75,000 to $99,999 | 7,909 (85.9%) | 1,296 (14.1%) |
| $100,000 and over | 17,447 (93.2%) | 1,270 (6.8%) |
Public vs Private Health Insurance Coverage by Age in Laurens County
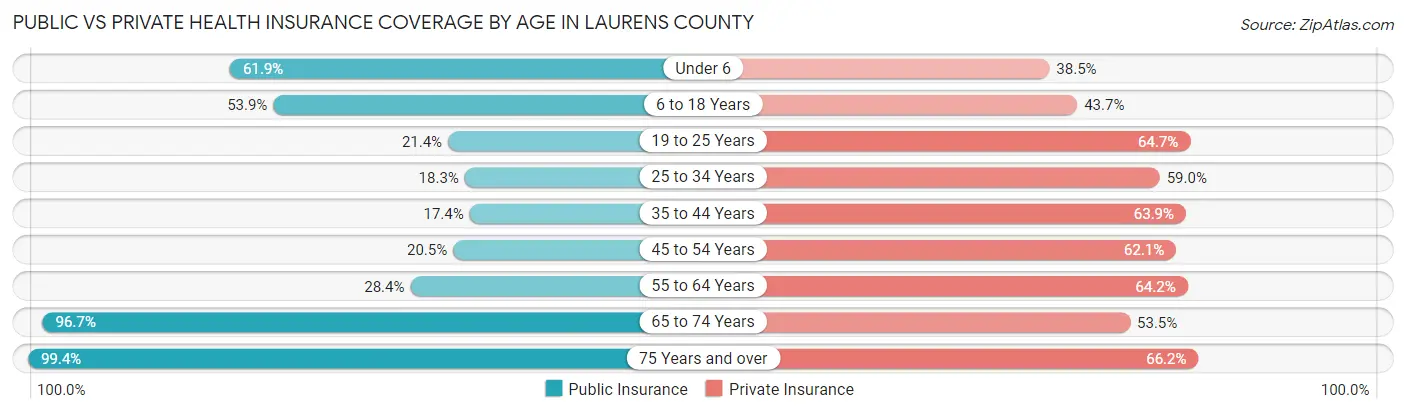
| Age Bracket | Public Insurance | Private Insurance |
| Under 6 | 2,890 (61.9%) | 1,800 (38.5%) |
| 6 to 18 Years | 5,832 (53.9%) | 4,732 (43.7%) |
| 19 to 25 Years | 1,206 (21.4%) | 3,639 (64.6%) |
| 25 to 34 Years | 1,375 (18.3%) | 4,428 (59.0%) |
| 35 to 44 Years | 1,364 (17.4%) | 5,003 (63.9%) |
| 45 to 54 Years | 1,743 (20.5%) | 5,280 (62.1%) |
| 55 to 64 Years | 2,701 (28.4%) | 6,101 (64.2%) |
| 65 to 74 Years | 7,256 (96.7%) | 4,017 (53.5%) |
| 75 Years and over | 4,247 (99.4%) | 2,828 (66.2%) |
| Total | 28,614 (43.2%) | 37,828 (57.1%) |
Disability Status by Sex by Age in Laurens County
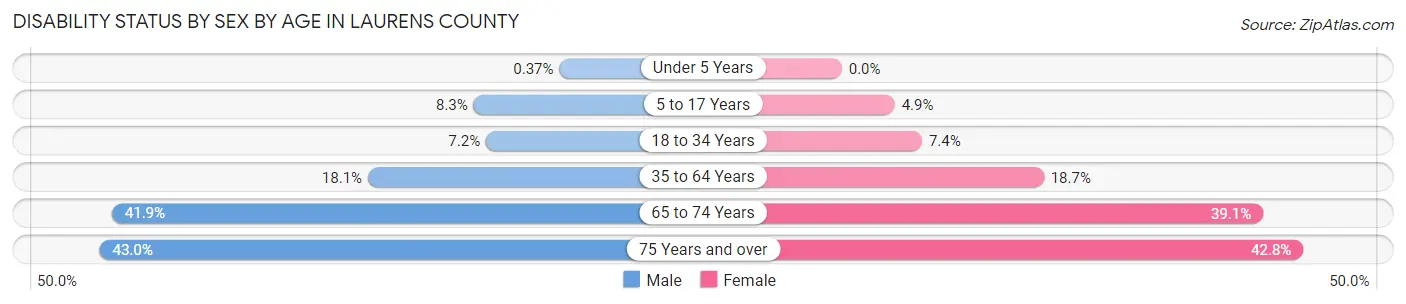
| Age Bracket | Male | Female |
| Under 5 Years | 8 (0.4%) | 0 (0.0%) |
| 5 to 17 Years | 461 (8.3%) | 258 (4.9%) |
| 18 to 34 Years | 504 (7.2%) | 522 (7.4%) |
| 35 to 64 Years | 2,257 (18.1%) | 2,513 (18.7%) |
| 65 to 74 Years | 1,501 (41.9%) | 1,534 (39.1%) |
| 75 Years and over | 727 (43.0%) | 1,107 (42.8%) |
Disability Class by Sex by Age in Laurens County
Disability Class: Hearing Difficulty
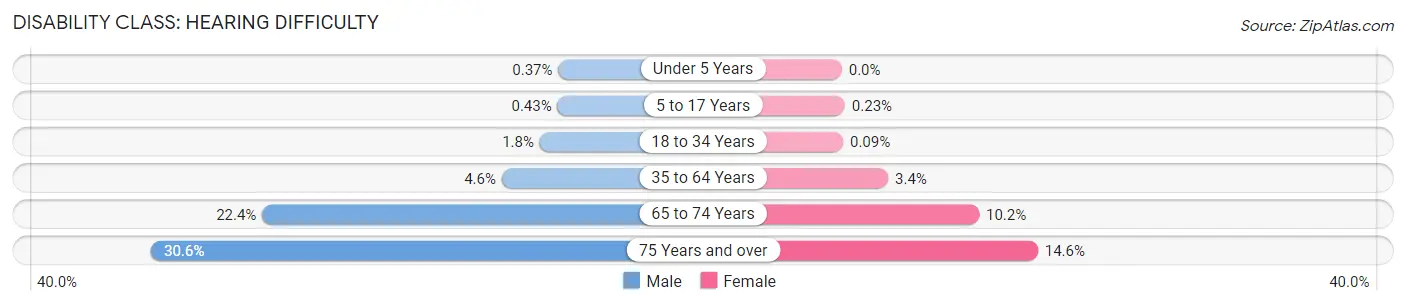
| Age Bracket | Male | Female |
| Under 5 Years | 8 (0.4%) | 0 (0.0%) |
| 5 to 17 Years | 24 (0.4%) | 12 (0.2%) |
| 18 to 34 Years | 123 (1.8%) | 6 (0.1%) |
| 35 to 64 Years | 569 (4.6%) | 461 (3.4%) |
| 65 to 74 Years | 801 (22.4%) | 400 (10.2%) |
| 75 Years and over | 517 (30.6%) | 376 (14.5%) |
Disability Class: Vision Difficulty
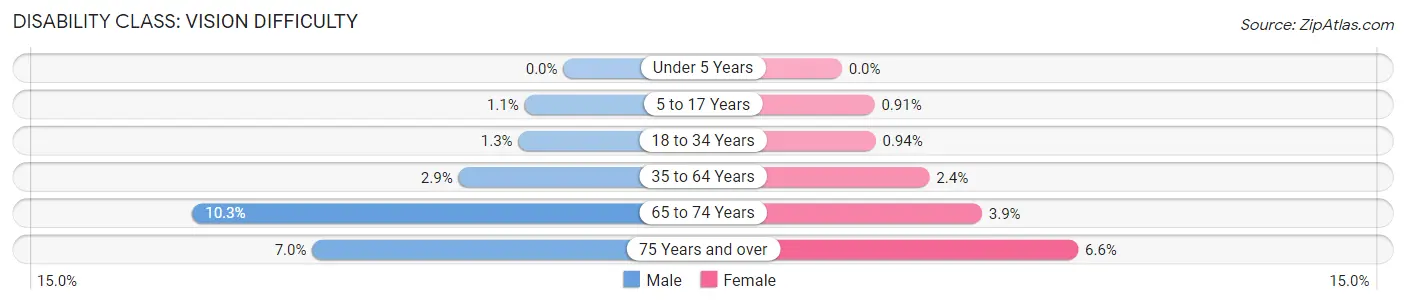
| Age Bracket | Male | Female |
| Under 5 Years | 0 (0.0%) | 0 (0.0%) |
| 5 to 17 Years | 60 (1.1%) | 48 (0.9%) |
| 18 to 34 Years | 88 (1.3%) | 66 (0.9%) |
| 35 to 64 Years | 363 (2.9%) | 327 (2.4%) |
| 65 to 74 Years | 370 (10.3%) | 153 (3.9%) |
| 75 Years and over | 118 (7.0%) | 170 (6.6%) |
Disability Class: Cognitive Difficulty
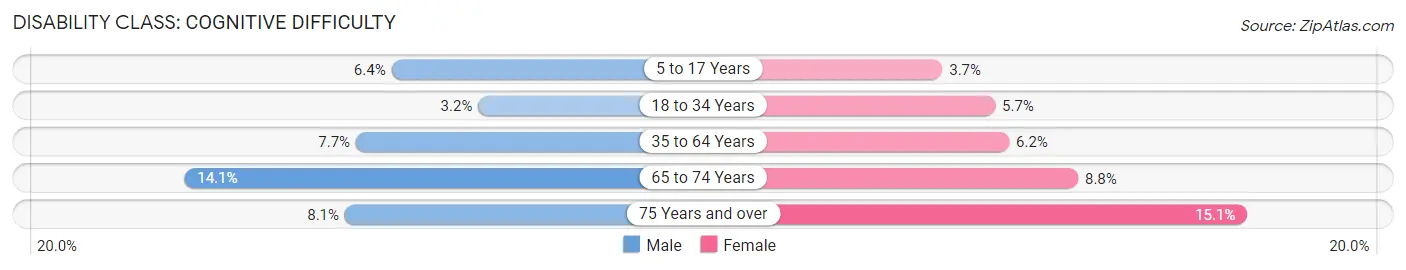
| Age Bracket | Male | Female |
| 5 to 17 Years | 353 (6.4%) | 196 (3.7%) |
| 18 to 34 Years | 222 (3.2%) | 399 (5.7%) |
| 35 to 64 Years | 958 (7.7%) | 833 (6.2%) |
| 65 to 74 Years | 504 (14.1%) | 344 (8.8%) |
| 75 Years and over | 137 (8.1%) | 389 (15.0%) |
Disability Class: Ambulatory Difficulty
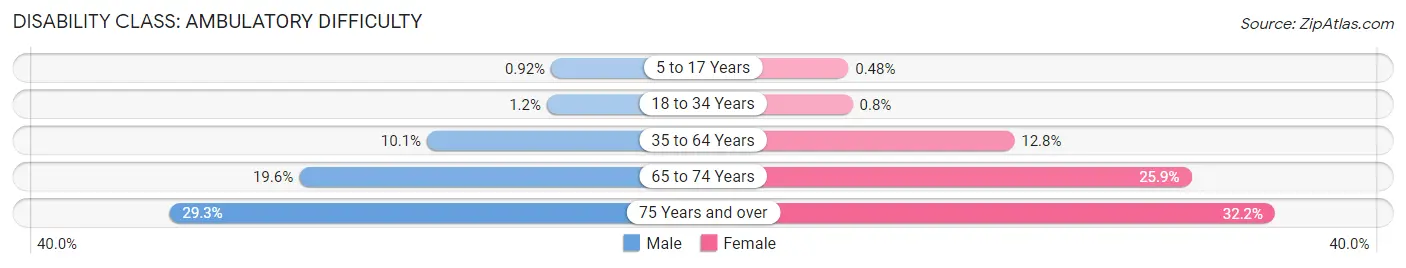
| Age Bracket | Male | Female |
| 5 to 17 Years | 51 (0.9%) | 25 (0.5%) |
| 18 to 34 Years | 86 (1.2%) | 56 (0.8%) |
| 35 to 64 Years | 1,260 (10.1%) | 1,718 (12.8%) |
| 65 to 74 Years | 703 (19.6%) | 1,018 (25.9%) |
| 75 Years and over | 494 (29.2%) | 831 (32.2%) |
Disability Class: Self-Care Difficulty
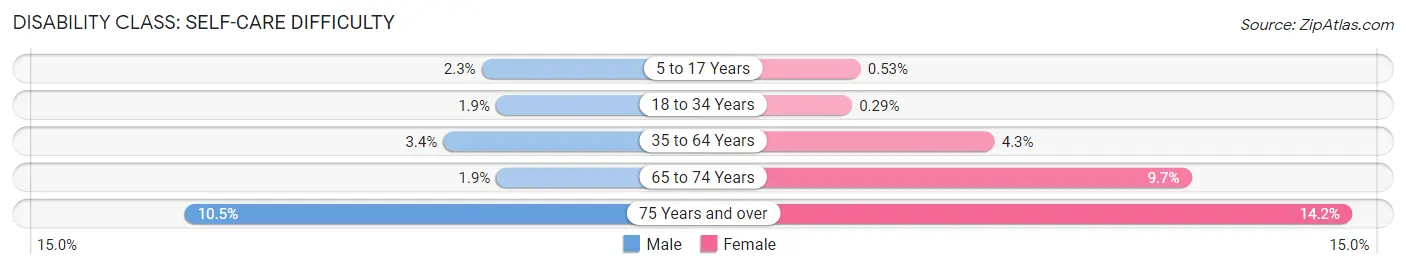
| Age Bracket | Male | Female |
| 5 to 17 Years | 126 (2.3%) | 28 (0.5%) |
| 18 to 34 Years | 132 (1.9%) | 20 (0.3%) |
| 35 to 64 Years | 417 (3.4%) | 571 (4.3%) |
| 65 to 74 Years | 67 (1.9%) | 382 (9.7%) |
| 75 Years and over | 178 (10.5%) | 367 (14.2%) |
Technology Access in Laurens County
Computing Device Access in Laurens County
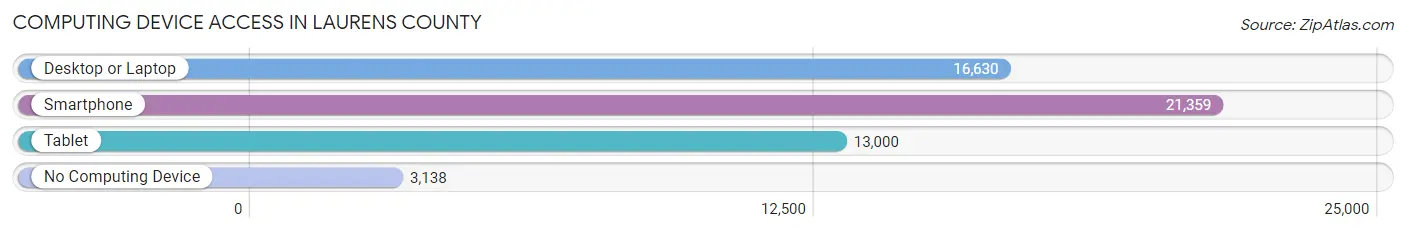
| Device Type | # Households | % Households |
| Desktop or Laptop | 16,630 | 64.6% |
| Smartphone | 21,359 | 82.9% |
| Tablet | 13,000 | 50.5% |
| No Computing Device | 3,138 | 12.2% |
| Total | 25,757 | 100.0% |
Internet Access in Laurens County
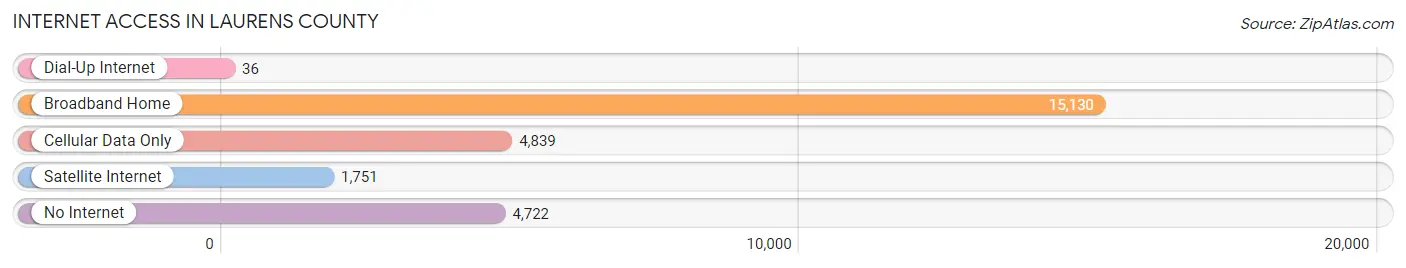
| Internet Type | # Households | % Households |
| Dial-Up Internet | 36 | 0.1% |
| Broadband Home | 15,130 | 58.7% |
| Cellular Data Only | 4,839 | 18.8% |
| Satellite Internet | 1,751 | 6.8% |
| No Internet | 4,722 | 18.3% |
| Total | 25,757 | 100.0% |
Laurens County Summary
Laurens County is located in the Upstate region of South Carolina, and is part of the Greenville-Spartanburg-Anderson Combined Statistical Area. The county was established in 1785 and is named after Henry Laurens, a South Carolina statesman and president of the Continental Congress. As of the 2010 census, the population of Laurens County was 66,537.
Geography
Laurens County is located in the northwestern corner of South Carolina, and is bordered by Greenville County to the north, Spartanburg County to the east, Union County to the south, and Greenwood County to the west. The county covers an area of 590 square miles, and is home to several rivers, including the Enoree, Little River, Reedy River, and Saluda River. The county is also home to several lakes, including Lake Greenwood, Lake Rabon, and Lake Secession. The highest point in the county is located at the summit of Musgrove Mill State Historic Site, which has an elevation of 1,068 feet.
Economy
The economy of Laurens County is largely based on manufacturing, with the largest employers in the county being Laurens County School District 56, Laurens County Hospital, and Laurens County Government. Other major employers in the county include Laurens Electric Cooperative, Laurens County Water and Sewer Commission, and Laurens County Memorial Hospital. The county is also home to several large manufacturing companies, including Milliken & Company, JTEKT Automotive, and Michelin North America.
Demographics
As of the 2010 census, the population of Laurens County was 66,537, with a population density of 113 people per square mile. The racial makeup of the county was 73.2% White, 22.2% African American, 0.5% Native American, 1.2% Asian, 0.1% Pacific Islander, 1.7% from other races, and 1.2% from two or more races. Hispanic or Latino of any race were 3.7% of the population.
The median income for a household in the county was $37,845, and the median income for a family was $45,945. The per capita income for the county was $19,945. About 17.2% of the population was below the poverty line.
Education
Laurens County is served by the Laurens County School District 56, which operates 15 elementary schools, five middle schools, and four high schools. The county is also home to several private schools, including Laurens Academy, Laurens Christian Academy, and Laurens Academy of Arts. The county is also home to Presbyterian College, a private liberal arts college located in Clinton.
Common Questions
What is Per Capita Income in Laurens County?
Per Capita income in Laurens County is $27,221.
What is the Median Family Income in Laurens County?
Median Family Income in Laurens County is $65,689.
What is the Median Household income in Laurens County?
Median Household Income in Laurens County is $52,077.
What is Income or Wage Gap in Laurens County?
Income or Wage Gap in Laurens County is 22.3%.
Women in Laurens County earn 77.7 cents for every dollar earned by a man.
What is Family Income Deficit in Laurens County?
Family Income Deficit in Laurens County is $11,293.
Families that are below poverty line in Laurens County earn $11,293 less on average than the poverty threshold level.
What is Inequality or Gini Index in Laurens County?
Inequality or Gini Index in Laurens County is 0.45.
What is the Total Population of Laurens County?
Total Population of Laurens County is 67,456.
What is the Total Male Population of Laurens County?
Total Male Population of Laurens County is 33,111.
What is the Total Female Population of Laurens County?
Total Female Population of Laurens County is 34,345.
What is the Ratio of Males per 100 Females in Laurens County?
There are 96.41 Males per 100 Females in Laurens County.
What is the Ratio of Females per 100 Males in Laurens County?
There are 103.73 Females per 100 Males in Laurens County.
What is the Median Population Age in Laurens County?
Median Population Age in Laurens County is 41.2 Years.
What is the Average Family Size in Laurens County
Average Family Size in Laurens County is 3.1 People.
What is the Average Household Size in Laurens County
Average Household Size in Laurens County is 2.5 People.
How Large is the Labor Force in Laurens County?
There are 30,934 People in the Labor Forcein in Laurens County.
What is the Percentage of People in the Labor Force in Laurens County?
57.0% of People are in the Labor Force in Laurens County.
What is the Unemployment Rate in Laurens County?
Unemployment Rate in Laurens County is 5.2%.