Cities with the Most Immigrants from Armenia in the United States
RELATED REPORTS & OPTIONS
Armenia
United States
Compare Cities
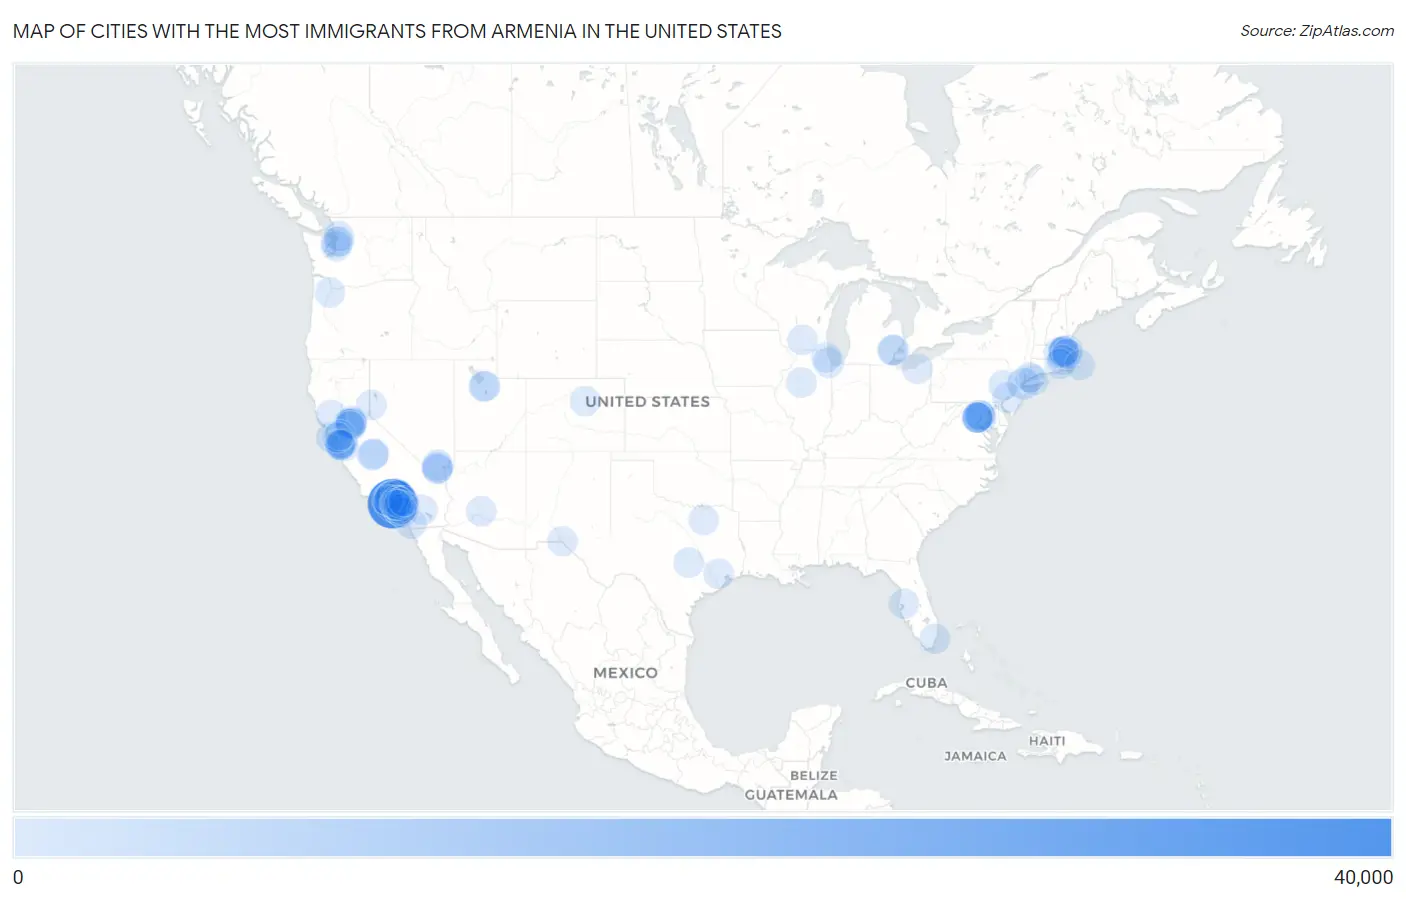
Map of Cities with the Most Immigrants from Armenia in the United States
0
40,000
Cities with the Most Immigrants from Armenia in the United States
| City | Armenia | vs State | vs National | |
| 1. | Los Angeles | 38,218 | 78,847(48.47%)#1 | 96,007(39.81%)#1 |
| 2. | Glendale | 23,284 | 78,847(29.53%)#2 | 96,007(24.25%)#2 |
| 3. | New York | 2,326 | 2,881(80.74%)#1 | 96,007(2.42%)#3 |
| 4. | Rancho Cordova | 1,536 | 78,847(1.95%)#3 | 96,007(1.60%)#4 |
| 5. | Fresno | 1,327 | 78,847(1.68%)#4 | 96,007(1.38%)#5 |
| 6. | Altadena | 887 | 78,847(1.12%)#5 | 96,007(0.92%)#6 |
| 7. | Montebello | 884 | 78,847(1.12%)#6 | 96,007(0.92%)#7 |
| 8. | Las Vegas | 817 | 2,307(35.41%)#1 | 96,007(0.85%)#8 |
| 9. | Spring Valley | 742 | 2,307(32.16%)#2 | 96,007(0.77%)#9 |
| 10. | Santa Clarita | 614 | 78,847(0.78%)#7 | 96,007(0.64%)#10 |
| 11. | Enterprise | 474 | 2,307(20.55%)#3 | 96,007(0.49%)#11 |
| 12. | Swampscott | 437 | 2,307(18.94%)#1 | 96,007(0.46%)#12 |
| 13. | Pasadena | 385 | 78,847(0.49%)#8 | 96,007(0.40%)#13 |
| 14. | San Diego | 355 | 78,847(0.45%)#9 | 96,007(0.37%)#14 |
| 15. | San Francisco | 331 | 78,847(0.42%)#10 | 96,007(0.34%)#15 |
| 16. | Palmdale | 324 | 78,847(0.41%)#11 | 96,007(0.34%)#16 |
| 17. | Chicago | 308 | 734(41.96%)#1 | 96,007(0.32%)#17 |
| 18. | Irvine | 303 | 78,847(0.38%)#12 | 96,007(0.32%)#18 |
| 19. | Phoenix | 295 | 450(65.56%)#1 | 96,007(0.31%)#19 |
| 20. | Citrus Heights | 292 | 78,847(0.37%)#13 | 96,007(0.30%)#20 |
| 21. | Watertown Town | 266 | 2,307(11.53%)#2 | 96,007(0.28%)#21 |
| 22. | La Crescenta Montrose | 265 | 78,847(0.34%)#14 | 96,007(0.28%)#22 |
| 23. | Peoria | 250 | 734(34.06%)#2 | 96,007(0.26%)#23 |
| 24. | Marlborough | 249 | 2,307(10.79%)#3 | 96,007(0.26%)#24 |
| 25. | Lynnwood | 248 | 1,170(21.20%)#1 | 96,007(0.26%)#25 |
| 26. | San Jose | 244 | 78,847(0.31%)#15 | 96,007(0.25%)#26 |
| 27. | Waltham | 233 | 2,307(10.10%)#4 | 96,007(0.24%)#27 |
| 28. | Seattle | 214 | 1,170(18.29%)#2 | 96,007(0.22%)#28 |
| 29. | Carmichael | 193 | 78,847(0.24%)#16 | 96,007(0.20%)#29 |
| 30. | Hutto | 170 | 910(18.68%)#1 | 96,007(0.18%)#30 |
| 31. | Denver | 164 | 389(42.16%)#1 | 96,007(0.17%)#31 |
| 32. | Houston | 160 | 910(17.58%)#2 | 96,007(0.17%)#32 |
| 33. | Whittier | 159 | 78,847(0.20%)#17 | 96,007(0.17%)#33 |
| 34. | Lexington | 156 | 2,307(6.76%)#5 | 96,007(0.16%)#34 |
| 35. | Clovis | 147 | 78,847(0.19%)#18 | 96,007(0.15%)#35 |
| 36. | East Pasadena | 145 | 78,847(0.18%)#19 | 96,007(0.15%)#36 |
| 37. | Washington | 139 | 139(100.00%)#1 | 96,007(0.14%)#37 |
| 38. | Anaheim | 137 | 78,847(0.17%)#20 | 96,007(0.14%)#38 |
| 39. | Sun Village | 137 | 78,847(0.17%)#21 | 96,007(0.14%)#39 |
| 40. | Oakton | 135 | 822(16.42%)#1 | 96,007(0.14%)#40 |
| 41. | Philadelphia | 133 | 466(28.54%)#1 | 96,007(0.14%)#41 |
| 42. | Marysville | 129 | 1,170(11.03%)#3 | 96,007(0.13%)#42 |
| 43. | Bethesda | 128 | 442(28.96%)#1 | 96,007(0.13%)#43 |
| 44. | Fremont | 124 | 78,847(0.16%)#22 | 96,007(0.13%)#44 |
| 45. | Reno | 122 | 2,307(5.29%)#4 | 96,007(0.13%)#45 |
| 46. | Huntington Beach | 121 | 78,847(0.15%)#23 | 96,007(0.13%)#46 |
| 47. | Clearlake Oaks | 117 | 78,847(0.15%)#24 | 96,007(0.12%)#47 |
| 48. | Mayfield Heights | 114 | 417(27.34%)#1 | 96,007(0.12%)#48 |
| 49. | Belmont | 112 | 2,307(4.85%)#6 | 96,007(0.12%)#49 |
| 50. | Tysons | 111 | 822(13.50%)#2 | 96,007(0.12%)#50 |
| 51. | Madison Heights | 108 | 517(20.89%)#1 | 96,007(0.11%)#51 |
| 52. | Corona | 102 | 78,847(0.13%)#25 | 96,007(0.11%)#52 |
| 53. | Merrifield | 101 | 822(12.29%)#3 | 96,007(0.11%)#53 |
| 54. | Milpitas | 100 | 78,847(0.13%)#26 | 96,007(0.10%)#54 |
| 55. | Sacramento | 99 | 78,847(0.13%)#27 | 96,007(0.10%)#55 |
| 56. | New Milford Borough | 94 | 736(12.77%)#1 | 96,007(0.10%)#56 |
| 57. | Mather | 92 | 78,847(0.12%)#28 | 96,007(0.10%)#57 |
| 58. | Costa Mesa | 91 | 78,847(0.12%)#29 | 96,007(0.09%)#58 |
| 59. | Tampa | 90 | 519(17.34%)#1 | 96,007(0.09%)#59 |
| 60. | Bethlehem | 89 | 466(19.10%)#2 | 96,007(0.09%)#60 |
| 61. | Southfield | 89 | 517(17.21%)#2 | 96,007(0.09%)#61 |
| 62. | Silver Firs | 87 | 1,170(7.44%)#4 | 96,007(0.09%)#62 |
| 63. | La Canada Flintridge | 86 | 78,847(0.11%)#30 | 96,007(0.09%)#63 |
| 64. | Cranston | 85 | 147(57.82%)#1 | 96,007(0.09%)#64 |
| 65. | North Bethesda | 85 | 442(19.23%)#2 | 96,007(0.09%)#65 |
| 66. | Bayview Cdp Contra Costa County | 85 | 78,847(0.11%)#31 | 96,007(0.09%)#66 |
| 67. | West Jordan | 83 | 340(24.41%)#1 | 96,007(0.09%)#67 |
| 68. | Garden Grove | 81 | 78,847(0.10%)#32 | 96,007(0.08%)#68 |
| 69. | Attleboro | 80 | 2,307(3.47%)#7 | 96,007(0.08%)#69 |
| 70. | Stevenson Ranch | 80 | 78,847(0.10%)#33 | 96,007(0.08%)#70 |
| 71. | Arcadia | 78 | 78,847(0.10%)#34 | 96,007(0.08%)#71 |
| 72. | Elk Grove | 77 | 78,847(0.10%)#35 | 96,007(0.08%)#72 |
| 73. | Calabasas | 77 | 78,847(0.10%)#36 | 96,007(0.08%)#73 |
| 74. | Laguna Niguel | 76 | 78,847(0.10%)#37 | 96,007(0.08%)#74 |
| 75. | Four Square Mile | 75 | 389(19.28%)#2 | 96,007(0.08%)#75 |
| 76. | Tustin | 73 | 78,847(0.09%)#38 | 96,007(0.08%)#76 |
| 77. | Sandy | 69 | 340(20.29%)#2 | 96,007(0.07%)#77 |
| 78. | Mountain View | 69 | 78,847(0.09%)#39 | 96,007(0.07%)#78 |
| 79. | Verona | 69 | 141(48.94%)#1 | 96,007(0.07%)#79 |
| 80. | Sunnyvale | 68 | 78,847(0.09%)#40 | 96,007(0.07%)#80 |
| 81. | Simi Valley | 67 | 78,847(0.08%)#41 | 96,007(0.07%)#81 |
| 82. | Maywood | 67 | 78,847(0.08%)#42 | 96,007(0.07%)#82 |
| 83. | Walnut Creek | 66 | 78,847(0.08%)#43 | 96,007(0.07%)#83 |
| 84. | Miami | 65 | 519(12.52%)#2 | 96,007(0.07%)#84 |
| 85. | Covina | 65 | 78,847(0.08%)#44 | 96,007(0.07%)#85 |
| 86. | La Quinta | 65 | 78,847(0.08%)#45 | 96,007(0.07%)#86 |
| 87. | La Habra Heights | 65 | 78,847(0.08%)#46 | 96,007(0.07%)#87 |
| 88. | Downey | 64 | 78,847(0.08%)#47 | 96,007(0.07%)#88 |
| 89. | Tigard | 64 | 197(32.49%)#1 | 96,007(0.07%)#89 |
| 90. | Los Altos | 64 | 78,847(0.08%)#48 | 96,007(0.07%)#90 |
| 91. | East Northport | 64 | 2,881(2.22%)#2 | 96,007(0.07%)#91 |
| 92. | Prospect Heights | 64 | 734(8.72%)#3 | 96,007(0.07%)#92 |
| 93. | Vienna | 62 | 822(7.54%)#4 | 96,007(0.06%)#93 |
| 94. | East Harwich | 61 | 2,307(2.64%)#8 | 96,007(0.06%)#94 |
| 95. | Boston | 60 | 2,307(2.60%)#9 | 96,007(0.06%)#95 |
| 96. | Stamford | 59 | 96(61.46%)#1 | 96,007(0.06%)#96 |
| 97. | Oakland | 57 | 78,847(0.07%)#49 | 96,007(0.06%)#97 |
| 98. | Rancho Cucamonga | 57 | 78,847(0.07%)#50 | 96,007(0.06%)#98 |
| 99. | El Paso | 56 | 910(6.15%)#3 | 96,007(0.06%)#99 |
| 100. | Wylie | 56 | 910(6.15%)#4 | 96,007(0.06%)#100 |
Common Questions
What are the Top 10 Cities with the Most Immigrants from Armenia in the United States?
Top 10 Cities with the Most Immigrants from Armenia in the United States are:
#1
38,218
#2
23,284
#3
2,326
#4
1,536
#5
1,327
#6
887
#7
884
#8
817
#9
742
#10
614
What city has the Most Immigrants from Armenia in the United States?
Los Angeles has the Most Immigrants from Armenia in the United States with 38,218.
What is the Total Immigrants from Armenia in the United States?
Total Immigrants from Armenia in the United States is 96,007.