Cities with the Highest Percentage of Immigrants from Iraq in the United States
RELATED REPORTS & OPTIONS
Iraq
United States
Compare Cities
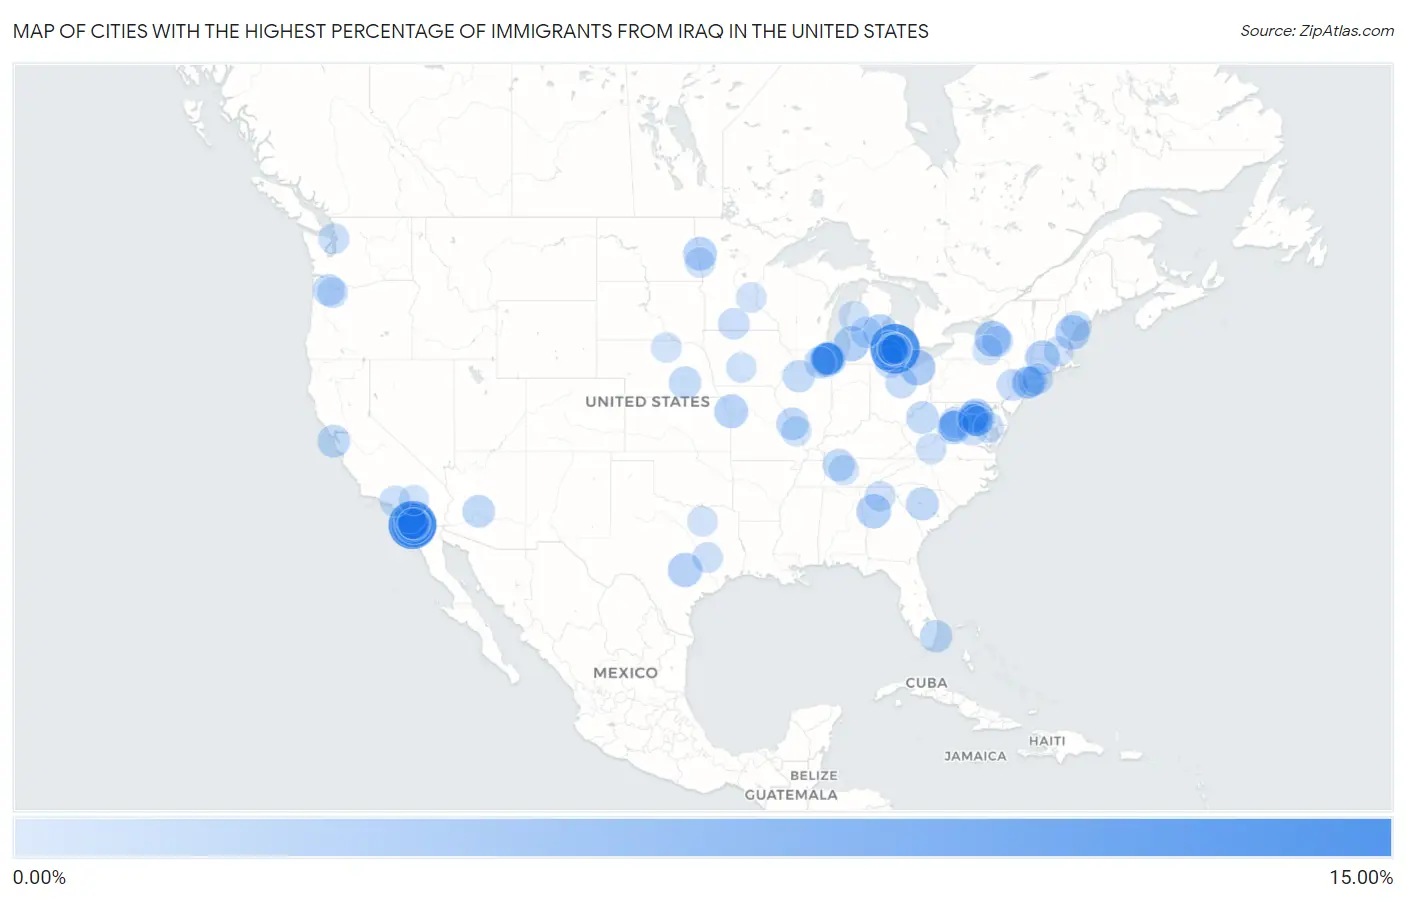
Map of Cities with the Highest Percentage of Immigrants from Iraq in the United States
0.00%
15.00%
Cities with the Highest Percentage of Immigrants from Iraq in the United States
| City | Iraq | vs State | vs National | |
| 1. | Sterling Heights | 13.14% | 0.56%(+12.6)#8 | 0.071%(+13.1)#316 |
| 2. | El Cajon | 12.19% | 0.10%(+12.1)#-1 | 0.071%(+12.1)#317 |
| 3. | Rancho San Diego | 10.17% | 0.10%(+10.1)#0 | 0.071%(+10.1)#318 |
| 4. | Granite Hills | 7.14% | 0.10%(+7.03)#1 | 0.071%(+7.07)#319 |
| 5. | Walled Lake | 4.90% | 0.56%(+4.35)#9 | 0.071%(+4.83)#320 |
| 6. | Jamul | 4.60% | 0.10%(+4.50)#2 | 0.071%(+4.53)#321 |
| 7. | Mayfield | 4.40% | 0.029%(+4.37)#-1 | 0.071%(+4.33)#322 |
| 8. | Solvay | 4.34% | 0.031%(+4.31)#-1 | 0.071%(+4.27)#323 |
| 9. | Bostonia | 4.30% | 0.10%(+4.20)#3 | 0.071%(+4.23)#324 |
| 10. | Dearborn Heights | 4.05% | 0.56%(+3.49)#10 | 0.071%(+3.98)#325 |
| 11. | Beechwood | 4.00% | 0.56%(+3.44)#11 | 0.071%(+3.93)#326 |
| 12. | Wixom | 3.93% | 0.56%(+3.37)#12 | 0.071%(+3.86)#327 |
| 13. | Madison Heights | 3.91% | 0.56%(+3.35)#13 | 0.071%(+3.84)#328 |
| 14. | Skokie | 3.85% | 0.10%(+3.75)#-1 | 0.071%(+3.78)#329 |
| 15. | Kennebunk | 3.58% | 0.063%(+3.52)#-1 | 0.071%(+3.51)#330 |
| 16. | Fairburn | 3.54% | 0.037%(+3.50)#-1 | 0.071%(+3.47)#331 |
| 17. | Buda | 3.45% | 0.091%(+3.36)#-1 | 0.071%(+3.38)#332 |
| 18. | West Springfield Town | 3.43% | 0.068%(+3.36)#-1 | 0.071%(+3.36)#333 |
| 19. | Shields | 3.34% | 0.56%(+2.79)#14 | 0.071%(+3.27)#334 |
| 20. | Kings Park | 3.22% | 0.11%(+3.11)#-1 | 0.071%(+3.15)#335 |
| 21. | Oakwood Park | 3.19% | 0.057%(+3.13)#-1 | 0.071%(+3.12)#336 |
| 22. | Mount Crawford | 3.14% | 0.11%(+3.03)#0 | 0.071%(+3.07)#337 |
| 23. | Rosemont | 3.08% | 0.10%(+2.98)#0 | 0.071%(+3.01)#338 |
| 24. | Hendrum | 3.05% | 0.040%(+3.01)#-1 | 0.071%(+2.98)#339 |
| 25. | Warren | 2.98% | 0.56%(+2.42)#15 | 0.071%(+2.90)#340 |
| 26. | Dearborn | 2.88% | 0.56%(+2.33)#16 | 0.071%(+2.81)#341 |
| 27. | Lowes Island | 2.73% | 0.11%(+2.63)#8 | 0.071%(+2.66)#342 |
| 28. | Niles | 2.71% | 0.10%(+2.61)#1 | 0.071%(+2.64)#343 |
| 29. | Seven Oaks | 2.68% | 0.017%(+2.66)#-1 | 0.071%(+2.61)#344 |
| 30. | West Pittston Borough | 2.62% | 0.018%(+2.60)#-1 | 0.071%(+2.55)#345 |
| 31. | Farmington Hills | 2.56% | 0.56%(+2.00)#17 | 0.071%(+2.49)#346 |
| 32. | Hazel Park | 2.56% | 0.56%(+2.00)#18 | 0.071%(+2.48)#347 |
| 33. | Montara | 2.49% | 0.10%(+2.39)#4 | 0.071%(+2.42)#348 |
| 34. | Youngtown | 2.48% | 0.13%(+2.35)#-1 | 0.071%(+2.41)#349 |
| 35. | Grantsville | 2.43% | 0.0043%(+2.42)#-1 | 0.071%(+2.36)#350 |
| 36. | Orchard Lake Village | 2.39% | 0.56%(+1.83)#19 | 0.071%(+2.32)#351 |
| 37. | Golden Beach | 2.37% | 0.023%(+2.35)#-1 | 0.071%(+2.30)#352 |
| 38. | Lemay | 2.30% | 0.057%(+2.24)#0 | 0.071%(+2.23)#353 |
| 39. | Lincolnwood | 2.29% | 0.10%(+2.19)#2 | 0.071%(+2.22)#354 |
| 40. | Toulon | 2.27% | 0.10%(+2.16)#3 | 0.071%(+2.20)#355 |
| 41. | Ashland City | 2.24% | 0.11%(+2.13)#-1 | 0.071%(+2.17)#356 |
| 42. | Saddle Rock | 2.24% | 0.031%(+2.21)#0 | 0.071%(+2.17)#357 |
| 43. | Troy | 2.20% | 0.56%(+1.65)#20 | 0.071%(+2.13)#358 |
| 44. | Henderson | 2.19% | 0.16%(+2.03)#-1 | 0.071%(+2.12)#359 |
| 45. | Winter Gardens | 2.16% | 0.10%(+2.06)#5 | 0.071%(+2.09)#360 |
| 46. | Morton Grove | 2.11% | 0.10%(+2.00)#4 | 0.071%(+2.04)#361 |
| 47. | Harrisonburg | 2.07% | 0.11%(+1.97)#9 | 0.071%(+2.00)#362 |
| 48. | Manassas Park | 2.07% | 0.11%(+1.96)#10 | 0.071%(+2.00)#363 |
| 49. | Spring Valley Cdp San Diego County | 2.03% | 0.10%(+1.93)#6 | 0.071%(+1.96)#364 |
| 50. | Four Square Mile | 2.03% | 0.057%(+1.97)#3 | 0.071%(+1.96)#365 |
| 51. | North Aurora | 2.01% | 0.10%(+1.90)#5 | 0.071%(+1.93)#366 |
| 52. | Oak Hills | 1.94% | 0.073%(+1.87)#-1 | 0.071%(+1.87)#367 |
| 53. | Manhasset Hills | 1.92% | 0.031%(+1.89)#1 | 0.071%(+1.85)#368 |
| 54. | Hidden Meadows | 1.92% | 0.10%(+1.82)#7 | 0.071%(+1.85)#369 |
| 55. | Arcola | 1.85% | 0.11%(+1.74)#11 | 0.071%(+1.78)#370 |
| 56. | Ontario | 1.82% | 0.029%(+1.79)#0 | 0.071%(+1.75)#371 |
| 57. | White House Station | 1.82% | 0.020%(+1.80)#-1 | 0.071%(+1.75)#372 |
| 58. | Truman | 1.81% | 0.040%(+1.77)#0 | 0.071%(+1.74)#373 |
| 59. | Lakeside | 1.78% | 0.10%(+1.68)#8 | 0.071%(+1.71)#374 |
| 60. | Seaview | 1.74% | 0.0023%(+1.74)#-1 | 0.071%(+1.67)#375 |
| 61. | Luna Pier | 1.71% | 0.56%(+1.16)#21 | 0.071%(+1.64)#376 |
| 62. | Stepney | 1.69% | 0.019%(+1.67)#-1 | 0.071%(+1.62)#377 |
| 63. | Sudley | 1.66% | 0.11%(+1.56)#12 | 0.071%(+1.59)#378 |
| 64. | Edmore | 1.56% | 0.56%(+1.00)#22 | 0.071%(+1.49)#379 |
| 65. | Broadway | 1.56% | 0.11%(+1.45)#13 | 0.071%(+1.49)#380 |
| 66. | North East Borough | 1.54% | 0.018%(+1.52)#0 | 0.071%(+1.47)#381 |
| 67. | Glendale | 1.49% | 0.10%(+1.39)#9 | 0.071%(+1.42)#382 |
| 68. | Belle Terre | 1.48% | 0.031%(+1.45)#2 | 0.071%(+1.41)#383 |
| 69. | Cazenovia | 1.45% | 0.031%(+1.42)#3 | 0.071%(+1.38)#384 |
| 70. | Freeland | 1.43% | 0.081%(+1.34)#-1 | 0.071%(+1.35)#385 |
| 71. | Jennings Lodge | 1.42% | 0.073%(+1.35)#0 | 0.071%(+1.35)#386 |
| 72. | Ypsilanti | 1.42% | 0.56%(+0.864)#23 | 0.071%(+1.35)#387 |
| 73. | Spotsylvania Courthouse | 1.41% | 0.11%(+1.30)#14 | 0.071%(+1.34)#388 |
| 74. | Dawsonville | 1.39% | 0.037%(+1.36)#0 | 0.071%(+1.32)#389 |
| 75. | Santee | 1.36% | 0.10%(+1.26)#173 | 0.071%(+1.29)#416 |
| 76. | Kurten | 1.34% | 0.091%(+1.25)#0 | 0.071%(+1.27)#417 |
| 77. | Wellston | 1.34% | 0.56%(+0.783)#24 | 0.071%(+1.27)#418 |
| 78. | Bloomfield Hills | 1.32% | 0.56%(+0.761)#25 | 0.071%(+1.25)#419 |
| 79. | Bridgewater | 1.31% | 0.11%(+1.20)#15 | 0.071%(+1.24)#420 |
| 80. | Plum Creek | 1.24% | 0.11%(+1.13)#16 | 0.071%(+1.17)#421 |
| 81. | Waukee | 1.21% | 0.047%(+1.17)#-1 | 0.071%(+1.14)#422 |
| 82. | Haymarket | 1.21% | 0.11%(+1.10)#17 | 0.071%(+1.14)#423 |
| 83. | Solomons | 1.20% | 0.028%(+1.18)#-1 | 0.071%(+1.13)#424 |
| 84. | Sachse | 1.20% | 0.091%(+1.11)#1 | 0.071%(+1.13)#425 |
| 85. | Lorton | 1.18% | 0.11%(+1.08)#18 | 0.071%(+1.11)#426 |
| 86. | Circle Pines | 1.18% | 0.040%(+1.14)#1 | 0.071%(+1.11)#427 |
| 87. | Ida | 1.17% | 0.56%(+0.610)#26 | 0.071%(+1.10)#428 |
| 88. | Moorhead | 1.16% | 0.040%(+1.12)#2 | 0.071%(+1.09)#429 |
| 89. | Ruma | 1.16% | 0.10%(+1.05)#6 | 0.071%(+1.09)#430 |
| 90. | Nolensville | 1.15% | 0.11%(+1.04)#0 | 0.071%(+1.08)#431 |
| 91. | West Hills | 1.15% | 0.031%(+1.12)#4 | 0.071%(+1.08)#432 |
| 92. | Hudson | 1.14% | 0.068%(+1.07)#0 | 0.071%(+1.07)#433 |
| 93. | Big Bear Lake | 1.13% | 0.10%(+1.02)#174 | 0.071%(+1.06)#434 |
| 94. | Southfield | 1.12% | 0.56%(+0.564)#27 | 0.071%(+1.05)#435 |
| 95. | Stuart | 1.12% | 0.16%(+0.957)#0 | 0.071%(+1.05)#436 |
| 96. | Northwest Ithaca | 1.11% | 0.031%(+1.08)#5 | 0.071%(+1.04)#437 |
| 97. | Westbrook | 1.11% | 0.063%(+1.04)#0 | 0.071%(+1.04)#438 |
| 98. | Oak Park | 1.11% | 0.56%(+0.549)#28 | 0.071%(+1.03)#439 |
| 99. | Troy Hills | 1.09% | 0.020%(+1.08)#0 | 0.071%(+1.02)#440 |
| 100. | Fraser | 1.08% | 0.56%(+0.521)#29 | 0.071%(+1.01)#441 |
Common Questions
What are the Top 10 Cities with the Highest Percentage of Immigrants from Iraq in the United States?
Top 10 Cities with the Highest Percentage of Immigrants from Iraq in the United States are:
#1
13.14%
#2
12.19%
#3
10.17%
#4
7.14%
#5
4.90%
#6
4.60%
#7
4.40%
#8
4.34%
#9
4.30%
#10
4.05%
What city has the Highest Percentage of Immigrants from Iraq in the United States?
Sterling Heights has the Highest Percentage of Immigrants from Iraq in the United States with 13.14%.
What is the Percentage of Immigrants from Iraq in the United States?
Percentage of Immigrants from Iraq in the United States is 0.071%.