Cities with the Largest Costa Rican Community in the United States
RELATED REPORTS & OPTIONS
Costa Rican
United States
Compare Cities
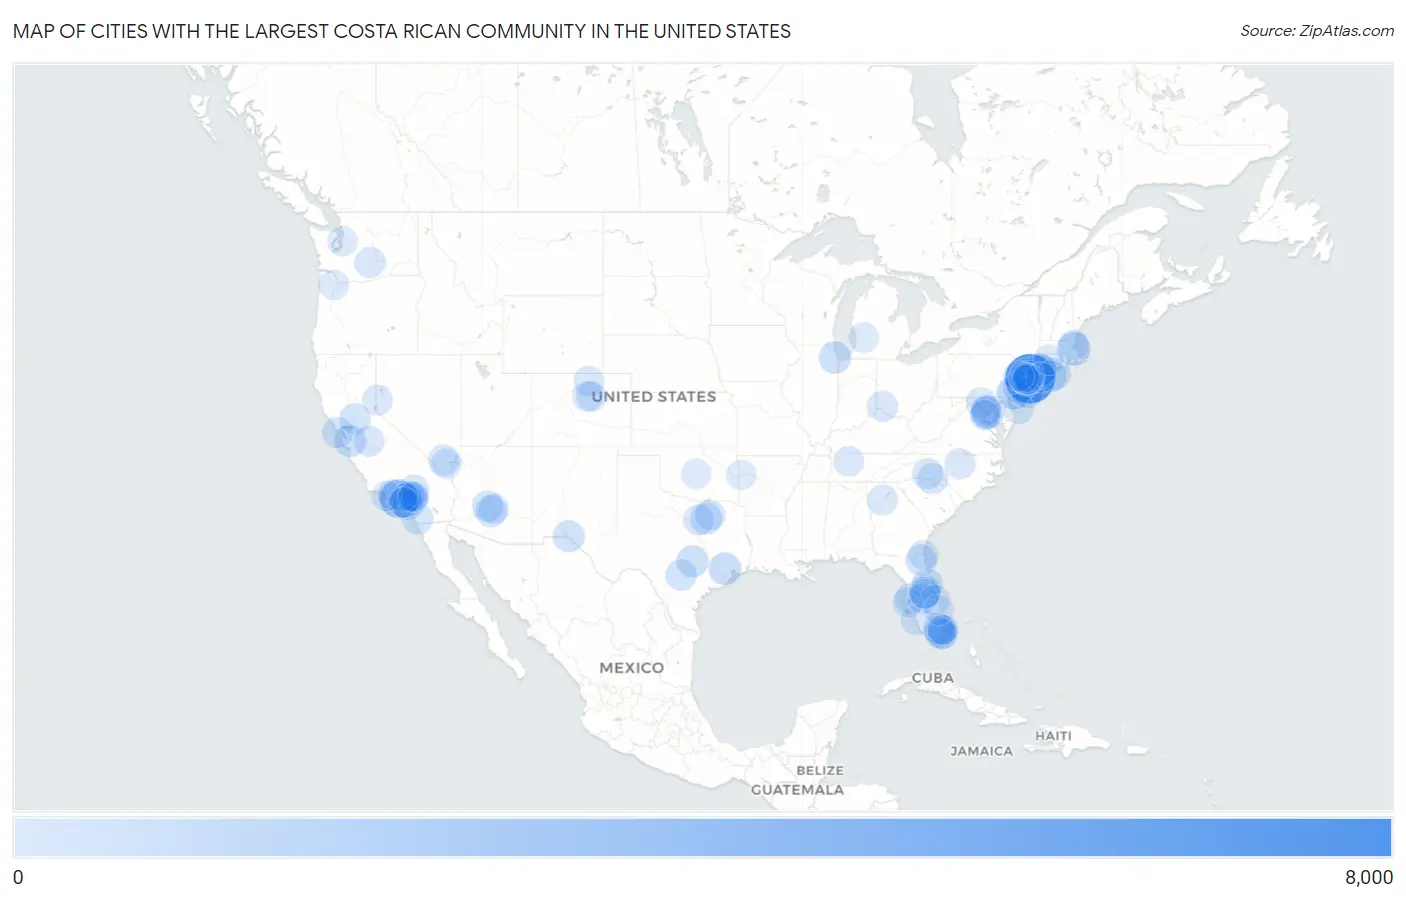
Map of Cities with the Largest Costa Rican Community in the United States
0
8,000
Cities with the Largest Costa Rican Community in the United States
| City | Costa Rican | vs State | vs National | |
| 1. | New York | 6,614 | 12,733(51.94%)#1 | 173,375(3.81%)#1 |
| 2. | Los Angeles | 2,869 | 28,570(10.04%)#1 | 173,375(1.65%)#2 |
| 3. | Norwalk | 1,758 | 4,101(42.87%)#1 | 173,375(1.01%)#3 |
| 4. | Paterson | 1,420 | 23,222(6.11%)#1 | 173,375(0.82%)#4 |
| 5. | Philadelphia | 1,370 | 4,512(30.36%)#1 | 173,375(0.79%)#5 |
| 6. | Boston | 1,318 | 3,988(33.05%)#1 | 173,375(0.76%)#6 |
| 7. | Washington | 1,205 | 1,205(100.00%)#1 | 173,375(0.70%)#7 |
| 8. | Bound Brook Borough | 1,167 | 23,222(5.03%)#2 | 173,375(0.67%)#8 |
| 9. | Orlando | 978 | 26,435(3.70%)#1 | 173,375(0.56%)#9 |
| 10. | Houston | 970 | 11,344(8.55%)#1 | 173,375(0.56%)#10 |
| 11. | Chicago | 909 | 2,785(32.64%)#1 | 173,375(0.52%)#11 |
| 12. | Trenton | 891 | 23,222(3.84%)#3 | 173,375(0.51%)#12 |
| 13. | Elizabeth | 845 | 23,222(3.64%)#4 | 173,375(0.49%)#13 |
| 14. | Austin | 836 | 11,344(7.37%)#2 | 173,375(0.48%)#14 |
| 15. | San Jose | 806 | 28,570(2.82%)#2 | 173,375(0.46%)#15 |
| 16. | El Paso | 801 | 11,344(7.06%)#3 | 173,375(0.46%)#16 |
| 17. | Dallas | 734 | 11,344(6.47%)#4 | 173,375(0.42%)#17 |
| 18. | Northwest Harbor | 706 | 12,733(5.54%)#2 | 173,375(0.41%)#18 |
| 19. | Chandler | 693 | 3,042(22.78%)#1 | 173,375(0.40%)#19 |
| 20. | Summit | 674 | 23,222(2.90%)#5 | 173,375(0.39%)#20 |
| 21. | Hampton Bays | 671 | 12,733(5.27%)#3 | 173,375(0.39%)#21 |
| 22. | Stanton | 661 | 28,570(2.31%)#3 | 173,375(0.38%)#22 |
| 23. | Toms River | 647 | 23,222(2.79%)#6 | 173,375(0.37%)#23 |
| 24. | Miami | 628 | 26,435(2.38%)#2 | 173,375(0.36%)#24 |
| 25. | San Antonio | 621 | 11,344(5.47%)#5 | 173,375(0.36%)#25 |
| 26. | Jacksonville | 615 | 26,435(2.33%)#3 | 173,375(0.35%)#26 |
| 27. | San Diego | 601 | 28,570(2.10%)#4 | 173,375(0.35%)#27 |
| 28. | San Francisco | 595 | 28,570(2.08%)#5 | 173,375(0.34%)#28 |
| 29. | Pembroke Pines | 568 | 26,435(2.15%)#4 | 173,375(0.33%)#29 |
| 30. | Bridgeport | 559 | 4,101(13.63%)#2 | 173,375(0.32%)#30 |
| 31. | Phoenix | 537 | 3,042(17.65%)#2 | 173,375(0.31%)#31 |
| 32. | Meadow Woods | 535 | 26,435(2.02%)#5 | 173,375(0.31%)#32 |
| 33. | Sacramento | 533 | 28,570(1.87%)#6 | 173,375(0.31%)#33 |
| 34. | Simi Valley | 494 | 28,570(1.73%)#7 | 173,375(0.28%)#34 |
| 35. | Anaheim | 491 | 28,570(1.72%)#8 | 173,375(0.28%)#35 |
| 36. | Kenwood | 485 | 2,242(21.63%)#1 | 173,375(0.28%)#36 |
| 37. | Charlotte | 475 | 5,531(8.59%)#1 | 173,375(0.27%)#37 |
| 38. | Las Vegas | 471 | 2,418(19.48%)#1 | 173,375(0.27%)#38 |
| 39. | West Puente Valley | 458 | 28,570(1.60%)#9 | 173,375(0.26%)#39 |
| 40. | Tampa | 455 | 26,435(1.72%)#6 | 173,375(0.26%)#40 |
| 41. | Lincolnton | 444 | 5,531(8.03%)#2 | 173,375(0.26%)#41 |
| 42. | Hacienda Heights | 433 | 28,570(1.52%)#10 | 173,375(0.25%)#42 |
| 43. | Terrace Heights | 431 | 3,253(13.25%)#1 | 173,375(0.25%)#43 |
| 44. | Long Beach | 424 | 28,570(1.48%)#11 | 173,375(0.24%)#44 |
| 45. | Raritan Borough | 423 | 23,222(1.82%)#7 | 173,375(0.24%)#45 |
| 46. | Merced | 418 | 28,570(1.46%)#12 | 173,375(0.24%)#46 |
| 47. | Riverside | 417 | 28,570(1.46%)#13 | 173,375(0.24%)#47 |
| 48. | Deltona | 408 | 26,435(1.54%)#7 | 173,375(0.24%)#48 |
| 49. | Weston | 407 | 26,435(1.54%)#8 | 173,375(0.23%)#49 |
| 50. | Hialeah | 406 | 26,435(1.54%)#9 | 173,375(0.23%)#50 |
| 51. | Garfield | 402 | 23,222(1.73%)#8 | 173,375(0.23%)#51 |
| 52. | Fort Worth | 400 | 11,344(3.53%)#6 | 173,375(0.23%)#52 |
| 53. | Cape Coral | 394 | 26,435(1.49%)#10 | 173,375(0.23%)#53 |
| 54. | Victorville | 389 | 28,570(1.36%)#14 | 173,375(0.22%)#54 |
| 55. | Reno | 387 | 2,418(16.00%)#2 | 173,375(0.22%)#55 |
| 56. | Durham | 380 | 5,531(6.87%)#3 | 173,375(0.22%)#56 |
| 57. | Newark | 377 | 23,222(1.62%)#9 | 173,375(0.22%)#57 |
| 58. | Frederick | 374 | 3,527(10.60%)#1 | 173,375(0.22%)#58 |
| 59. | Fort Lauderdale | 373 | 26,435(1.41%)#11 | 173,375(0.22%)#59 |
| 60. | Sandy Springs | 364 | 5,719(6.36%)#1 | 173,375(0.21%)#60 |
| 61. | Palm Bay | 355 | 26,435(1.34%)#12 | 173,375(0.20%)#61 |
| 62. | Fort Collins | 354 | 2,849(12.43%)#1 | 173,375(0.20%)#62 |
| 63. | Irvine | 346 | 28,570(1.21%)#15 | 173,375(0.20%)#63 |
| 64. | Pomona | 342 | 28,570(1.20%)#16 | 173,375(0.20%)#64 |
| 65. | Wylie | 339 | 11,344(2.99%)#7 | 173,375(0.20%)#65 |
| 66. | Nashville | 336 | 1,061(31.67%)#1 | 173,375(0.19%)#66 |
| 67. | Dundee | 334 | 26,435(1.26%)#13 | 173,375(0.19%)#67 |
| 68. | Applewood | 331 | 2,849(11.62%)#2 | 173,375(0.19%)#68 |
| 69. | Jersey City | 323 | 23,222(1.39%)#10 | 173,375(0.19%)#69 |
| 70. | Denver | 321 | 2,849(11.27%)#3 | 173,375(0.19%)#70 |
| 71. | Arlington | 321 | 3,734(8.60%)#1 | 173,375(0.19%)#71 |
| 72. | South Bound Brook Borough | 320 | 23,222(1.38%)#11 | 173,375(0.18%)#72 |
| 73. | Rancho Cucamonga | 317 | 28,570(1.11%)#17 | 173,375(0.18%)#73 |
| 74. | Pasadena | 300 | 28,570(1.05%)#18 | 173,375(0.17%)#74 |
| 75. | Seattle | 298 | 3,253(9.16%)#2 | 173,375(0.17%)#75 |
| 76. | Fontana | 293 | 28,570(1.03%)#19 | 173,375(0.17%)#76 |
| 77. | Oxnard | 293 | 28,570(1.03%)#20 | 173,375(0.17%)#77 |
| 78. | Wyoming | 289 | 1,834(15.76%)#1 | 173,375(0.17%)#78 |
| 79. | Fernandina Beach | 288 | 26,435(1.09%)#14 | 173,375(0.17%)#79 |
| 80. | Hillsboro | 283 | 2,105(13.44%)#1 | 173,375(0.16%)#80 |
| 81. | North Bethesda | 282 | 3,527(8.00%)#2 | 173,375(0.16%)#81 |
| 82. | Henderson | 280 | 2,418(11.58%)#3 | 173,375(0.16%)#82 |
| 83. | Wethersfield | 275 | 4,101(6.71%)#3 | 173,375(0.16%)#83 |
| 84. | Miami Beach | 273 | 26,435(1.03%)#15 | 173,375(0.16%)#84 |
| 85. | St Petersburg | 272 | 26,435(1.03%)#16 | 173,375(0.16%)#85 |
| 86. | Fort Smith | 270 | 676(39.94%)#1 | 173,375(0.16%)#86 |
| 87. | Brentwood | 266 | 12,733(2.09%)#4 | 173,375(0.15%)#87 |
| 88. | Linden | 266 | 23,222(1.15%)#12 | 173,375(0.15%)#88 |
| 89. | Rossmoor | 266 | 28,570(0.93%)#21 | 173,375(0.15%)#89 |
| 90. | Hackettstown | 266 | 23,222(1.15%)#13 | 173,375(0.15%)#90 |
| 91. | Morristown | 263 | 23,222(1.13%)#14 | 173,375(0.15%)#91 |
| 92. | San Bernardino | 261 | 28,570(0.91%)#22 | 173,375(0.15%)#92 |
| 93. | Oklahoma City | 255 | 744(34.27%)#1 | 173,375(0.15%)#93 |
| 94. | Port St Lucie | 254 | 26,435(0.96%)#17 | 173,375(0.15%)#94 |
| 95. | Mesa | 252 | 3,042(8.28%)#3 | 173,375(0.15%)#95 |
| 96. | Buenaventura Lakes | 252 | 26,435(0.95%)#18 | 173,375(0.15%)#96 |
| 97. | Cape May Court House | 252 | 23,222(1.09%)#15 | 173,375(0.15%)#97 |
| 98. | Hollywood | 251 | 26,435(0.95%)#19 | 173,375(0.14%)#98 |
| 99. | Newington | 248 | 3,734(6.64%)#2 | 173,375(0.14%)#99 |
| 100. | Lynn | 246 | 3,988(6.17%)#2 | 173,375(0.14%)#100 |
Common Questions
What are the Top 10 Cities with the Largest Costa Rican Community in the United States?
Top 10 Cities with the Largest Costa Rican Community in the United States are:
What city has the Largest Costa Rican Community in the United States?
New York has the Largest Costa Rican Community in the United States with 6,614.
What is the Total Costa Rican Population in the United States?
Total Costa Rican Population in the United States is 173,375.