Cities with the Highest Percentage of Families with Income Above $100,000 in the United States
RELATED REPORTS & OPTIONS
Family Income | $100k+
United States
Compare Cities
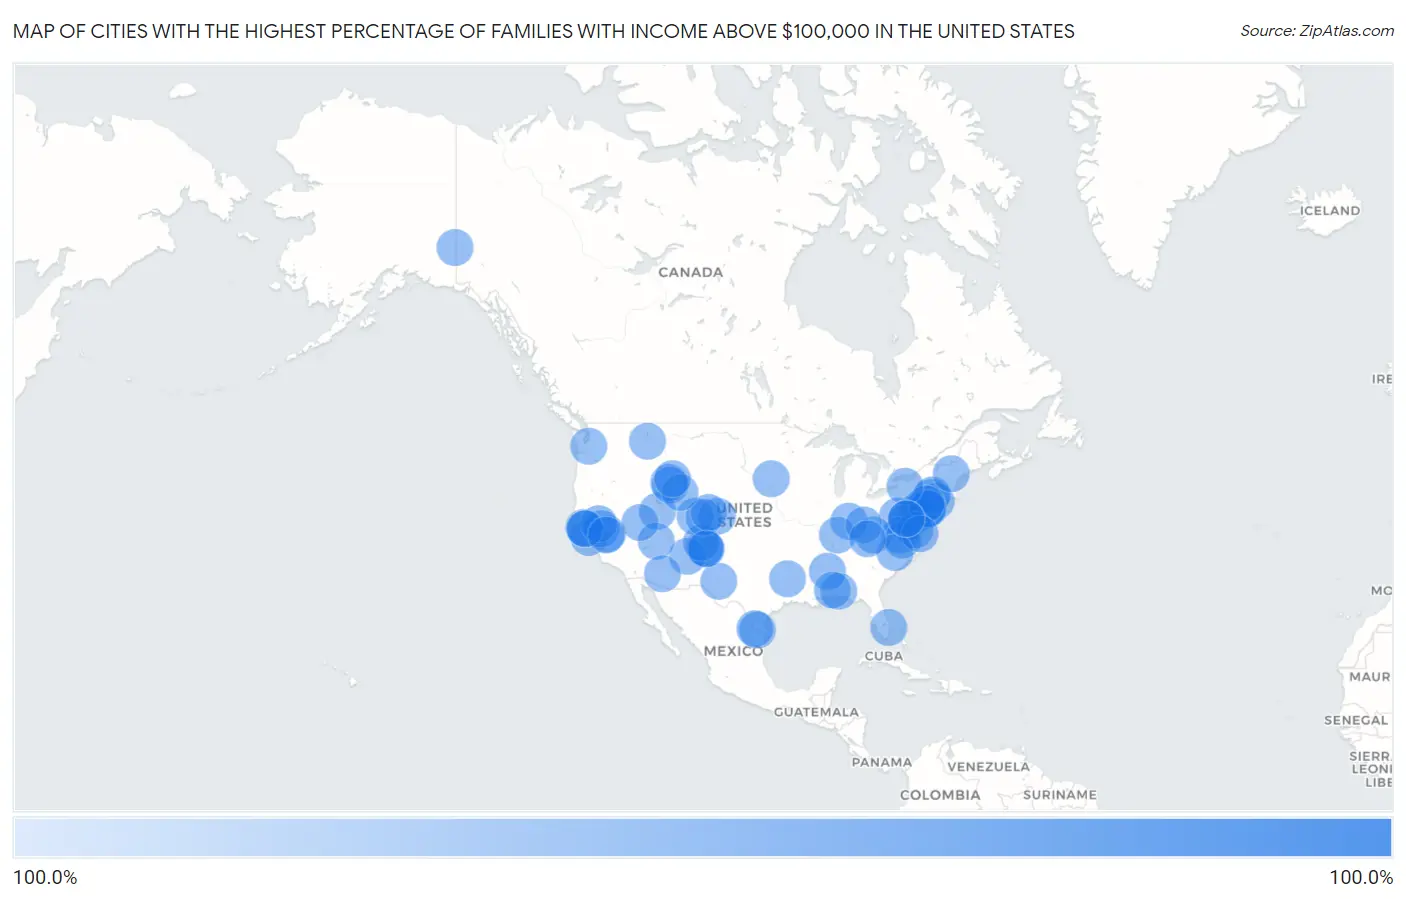
Map of Cities with the Highest Percentage of Families with Income Above $100,000 in the United States
0.0%
100.0%
Cities with the Highest Percentage of Families with Income Above $100,000 in the United States
| City | Families with Income > $100k | vs State | vs National | |
| 1. | Bull Run Mountain Estates | 100.0% | 53.6%(+46.4)#1 | 46.1%(+53.9)#1 |
| 2. | Bard College | 100.0% | 50.3%(+49.7)#1 | 46.1%(+53.9)#2 |
| 3. | Mamanasco Lake | 100.0% | 56.8%(+43.2)#1 | 46.1%(+53.9)#3 |
| 4. | Washington Crossing | 100.0% | 58.5%(+41.5)#1 | 46.1%(+53.9)#4 |
| 5. | Dugway | 100.0% | 50.0%(+50.0)#1 | 46.1%(+53.9)#5 |
| 6. | Pine Lakes Addition | 100.0% | 42.6%(+57.4)#1 | 46.1%(+53.9)#6 |
| 7. | Harrison Lake | 100.0% | 40.5%(+59.5)#1 | 46.1%(+53.9)#7 |
| 8. | Fenwick Borough | 100.0% | 56.8%(+43.2)#2 | 46.1%(+53.9)#8 |
| 9. | The College Of New Jersey | 100.0% | 58.5%(+41.5)#2 | 46.1%(+53.9)#9 |
| 10. | Mississippi State | 100.0% | 31.1%(+68.9)#1 | 46.1%(+53.9)#10 |
| 11. | Vassar College | 100.0% | 50.3%(+49.7)#2 | 46.1%(+53.9)#11 |
| 12. | Berry College | 100.0% | 42.7%(+57.3)#1 | 46.1%(+53.9)#12 |
| 13. | St. John's University | 100.0% | 53.9%(+46.1)#1 | 46.1%(+53.9)#13 |
| 14. | La Honda | 100.0% | 52.2%(+47.8)#1 | 46.1%(+53.9)#14 |
| 15. | Refton | 100.0% | 46.6%(+53.4)#1 | 46.1%(+53.9)#15 |
| 16. | The University Of Virginia's College At Wise | 100.0% | 53.6%(+46.4)#2 | 46.1%(+53.9)#16 |
| 17. | Gardiner | 100.0% | 50.3%(+49.7)#3 | 46.1%(+53.9)#17 |
| 18. | Elfin Forest | 100.0% | 52.2%(+47.8)#2 | 46.1%(+53.9)#18 |
| 19. | Canova | 100.0% | 34.7%(+65.3)#1 | 46.1%(+53.9)#19 |
| 20. | Bodega | 100.0% | 52.2%(+47.8)#3 | 46.1%(+53.9)#20 |
| 21. | Cannondale | 100.0% | 56.8%(+43.2)#3 | 46.1%(+53.9)#21 |
| 22. | Comanche Creek | 100.0% | 54.4%(+45.6)#1 | 46.1%(+53.9)#22 |
| 23. | Wellsboro | 100.0% | 40.5%(+59.5)#2 | 46.1%(+53.9)#23 |
| 24. | Pennwyn | 100.0% | 46.6%(+53.4)#2 | 46.1%(+53.9)#24 |
| 25. | El Portal | 100.0% | 52.2%(+47.8)#4 | 46.1%(+53.9)#25 |
| 26. | Nesco | 100.0% | 58.5%(+41.5)#3 | 46.1%(+53.9)#26 |
| 27. | Dillon Beach | 100.0% | 52.2%(+47.8)#5 | 46.1%(+53.9)#27 |
| 28. | Cuartelez | 100.0% | 34.7%(+65.3)#2 | 46.1%(+53.9)#28 |
| 29. | Harlingen | 100.0% | 58.5%(+41.5)#4 | 46.1%(+53.9)#29 |
| 30. | Chacra | 100.0% | 54.4%(+45.6)#2 | 46.1%(+53.9)#30 |
| 31. | East Rocky Hill | 100.0% | 58.5%(+41.5)#5 | 46.1%(+53.9)#31 |
| 32. | Prairiewood | 100.0% | 42.6%(+57.4)#2 | 46.1%(+53.9)#32 |
| 33. | Ramah | 100.0% | 34.7%(+65.3)#3 | 46.1%(+53.9)#33 |
| 34. | Rhinecliff | 100.0% | 50.3%(+49.7)#4 | 46.1%(+53.9)#34 |
| 35. | Runnelstown | 100.0% | 31.1%(+68.9)#2 | 46.1%(+53.9)#35 |
| 36. | Acacia Villas | 100.0% | 39.6%(+60.4)#1 | 46.1%(+53.9)#36 |
| 37. | Echo Hills | 100.0% | 54.4%(+45.6)#3 | 46.1%(+53.9)#37 |
| 38. | Hortense | 100.0% | 42.7%(+57.3)#2 | 46.1%(+53.9)#38 |
| 39. | Keswick | 100.0% | 53.6%(+46.4)#3 | 46.1%(+53.9)#39 |
| 40. | Grahamtown | 100.0% | 59.4%(+40.6)#1 | 46.1%(+53.9)#40 |
| 41. | Danby | 100.0% | 50.3%(+49.7)#5 | 46.1%(+53.9)#41 |
| 42. | Pablo Pena | 100.0% | 43.7%(+56.3)#1 | 46.1%(+53.9)#42 |
| 43. | Alpine Northeast | 100.0% | 45.0%(+55.0)#1 | 46.1%(+53.9)#43 |
| 44. | Judah | 100.0% | 40.5%(+59.5)#3 | 46.1%(+53.9)#44 |
| 45. | Skillman | 100.0% | 58.5%(+41.5)#6 | 46.1%(+53.9)#45 |
| 46. | Scipio | 100.0% | 40.5%(+59.5)#4 | 46.1%(+53.9)#46 |
| 47. | Ensenada | 100.0% | 34.7%(+65.3)#4 | 46.1%(+53.9)#47 |
| 48. | Mountain Ranch | 100.0% | 52.2%(+47.8)#6 | 46.1%(+53.9)#48 |
| 49. | Copper Mountain | 100.0% | 54.4%(+45.6)#4 | 46.1%(+53.9)#49 |
| 50. | Smarr | 100.0% | 42.7%(+57.3)#3 | 46.1%(+53.9)#50 |
| 51. | Coloma | 100.0% | 52.2%(+47.8)#7 | 46.1%(+53.9)#51 |
| 52. | Captree | 100.0% | 50.3%(+49.7)#6 | 46.1%(+53.9)#52 |
| 53. | Buckingham Courthouse | 100.0% | 53.6%(+46.4)#4 | 46.1%(+53.9)#53 |
| 54. | Rio | 100.0% | 36.7%(+63.3)#1 | 46.1%(+53.9)#54 |
| 55. | Blairstown | 100.0% | 58.5%(+41.5)#7 | 46.1%(+53.9)#55 |
| 56. | Norene | 100.0% | 38.3%(+61.7)#1 | 46.1%(+53.9)#56 |
| 57. | Elyria | 100.0% | 43.8%(+56.2)#1 | 46.1%(+53.9)#57 |
| 58. | Bartlett | 100.0% | 57.1%(+42.9)#1 | 46.1%(+53.9)#58 |
| 59. | Mountain Meadows | 100.0% | 52.2%(+47.8)#8 | 46.1%(+53.9)#59 |
| 60. | Gold Hill | 100.0% | 54.4%(+45.6)#5 | 46.1%(+53.9)#60 |
| 61. | Cane Beds | 100.0% | 42.5%(+57.5)#1 | 46.1%(+53.9)#61 |
| 62. | Retsof | 100.0% | 50.3%(+49.7)#7 | 46.1%(+53.9)#62 |
| 63. | Copake | 100.0% | 50.3%(+49.7)#8 | 46.1%(+53.9)#63 |
| 64. | Belfry | 100.0% | 36.1%(+63.9)#1 | 46.1%(+53.9)#65 |
| 65. | Pocahontas | 100.0% | 38.3%(+61.7)#2 | 46.1%(+53.9)#66 |
| 66. | Bedford | 100.0% | 45.0%(+55.0)#2 | 46.1%(+53.9)#67 |
| 67. | Solsberry | 100.0% | 40.5%(+59.5)#5 | 46.1%(+53.9)#68 |
| 68. | Shelbyville | 100.0% | 43.7%(+56.3)#2 | 46.1%(+53.9)#69 |
| 69. | Lunenburg | 100.0% | 53.6%(+46.4)#5 | 46.1%(+53.9)#70 |
| 70. | Goldsmith | 100.0% | 40.5%(+59.5)#6 | 46.1%(+53.9)#71 |
| 71. | La Grande | 100.0% | 54.2%(+45.8)#1 | 46.1%(+53.9)#72 |
| 72. | Farson | 100.0% | 45.0%(+55.0)#3 | 46.1%(+53.9)#73 |
| 73. | New Boston | 100.0% | 57.1%(+42.9)#2 | 46.1%(+53.9)#74 |
| 74. | Nesbitt | 100.0% | 43.7%(+56.3)#3 | 46.1%(+53.9)#75 |
| 75. | Schaefer Lake | 100.0% | 40.5%(+59.5)#7 | 46.1%(+53.9)#76 |
| 76. | Lamington | 100.0% | 58.5%(+41.5)#8 | 46.1%(+53.9)#77 |
| 77. | St George Island | 100.0% | 59.4%(+40.6)#2 | 46.1%(+53.9)#78 |
| 78. | Mount Carmel | 100.0% | 39.6%(+60.4)#2 | 46.1%(+53.9)#79 |
| 79. | Kelly | 100.0% | 45.0%(+55.0)#4 | 46.1%(+53.9)#80 |
| 80. | Roots | 100.0% | 46.6%(+53.4)#3 | 46.1%(+53.9)#81 |
| 81. | Sandy Hook | 100.0% | 59.4%(+40.6)#3 | 46.1%(+53.9)#82 |
| 82. | Preston | 100.0% | 41.4%(+58.6)#1 | 46.1%(+53.9)#83 |
| 83. | Taft | 100.0% | 38.3%(+61.7)#3 | 46.1%(+53.9)#84 |
| 84. | La Rosita | 100.0% | 43.7%(+56.3)#4 | 46.1%(+53.9)#85 |
| 85. | Beech Grove | 100.0% | 36.1%(+63.9)#2 | 46.1%(+53.9)#86 |
| 86. | Bloomfield | 100.0% | 52.2%(+47.8)#9 | 46.1%(+53.9)#87 |
| 87. | Bayside | 100.0% | 53.6%(+46.4)#6 | 46.1%(+53.9)#88 |
| 88. | Bentonville | 100.0% | 42.3%(+57.7)#1 | 46.1%(+53.9)#89 |
| 89. | Fairford | 100.0% | 37.1%(+62.9)#1 | 46.1%(+53.9)#90 |
| 90. | Midpines | 100.0% | 52.2%(+47.8)#10 | 46.1%(+53.9)#91 |
| 91. | Malaga | 100.0% | 34.7%(+65.3)#5 | 46.1%(+53.9)#92 |
| 92. | Cordova | 100.0% | 34.7%(+65.3)#6 | 46.1%(+53.9)#93 |
| 93. | Alcan Border | 100.0% | 52.3%(+47.7)#1 | 46.1%(+53.9)#94 |
| 94. | Gulf | 100.0% | 40.4%(+59.6)#1 | 46.1%(+53.9)#95 |
| 95. | Jeff | 100.0% | 36.1%(+63.9)#3 | 46.1%(+53.9)#96 |
| 96. | Ravalli | 100.0% | 40.5%(+59.5)#1 | 46.1%(+53.9)#97 |
| 97. | Yarrowsburg | 100.0% | 59.4%(+40.6)#4 | 46.1%(+53.9)#98 |
| 98. | Shawneetown | 100.0% | 40.8%(+59.2)#1 | 46.1%(+53.9)#99 |
| 99. | Sacate Village | 100.0% | 42.5%(+57.5)#2 | 46.1%(+53.9)#100 |
| 100. | Brookfield Center | 100.0% | 56.8%(+43.2)#4 | 46.1%(+53.9)#101 |
Common Questions
What are the Top 10 Cities with the Highest Percentage of Families with Income Above $100,000 in the United States?
Top 10 Cities with the Highest Percentage of Families with Income Above $100,000 in the United States are:
#1
100.0%
#2
100.0%
#3
100.0%
#4
100.0%
#5
100.0%
#6
100.0%
#7
100.0%
#8
100.0%
#9
100.0%
#10
100.0%
What city has the Highest Percentage of Families with Income Above $100,000 in the United States?
Bull Run Mountain Estates has the Highest Percentage of Families with Income Above $100,000 in the United States with 100.0%.
What is the Percentage of Families with Income Above $100,000 in the United States?
Percentage of Families with Income Above $100,000 in the United States is 46.1%.