Cities with the Highest Poverty Level in the United States
RELATED REPORTS & OPTIONS
Highest Poverty
United States
Compare Cities
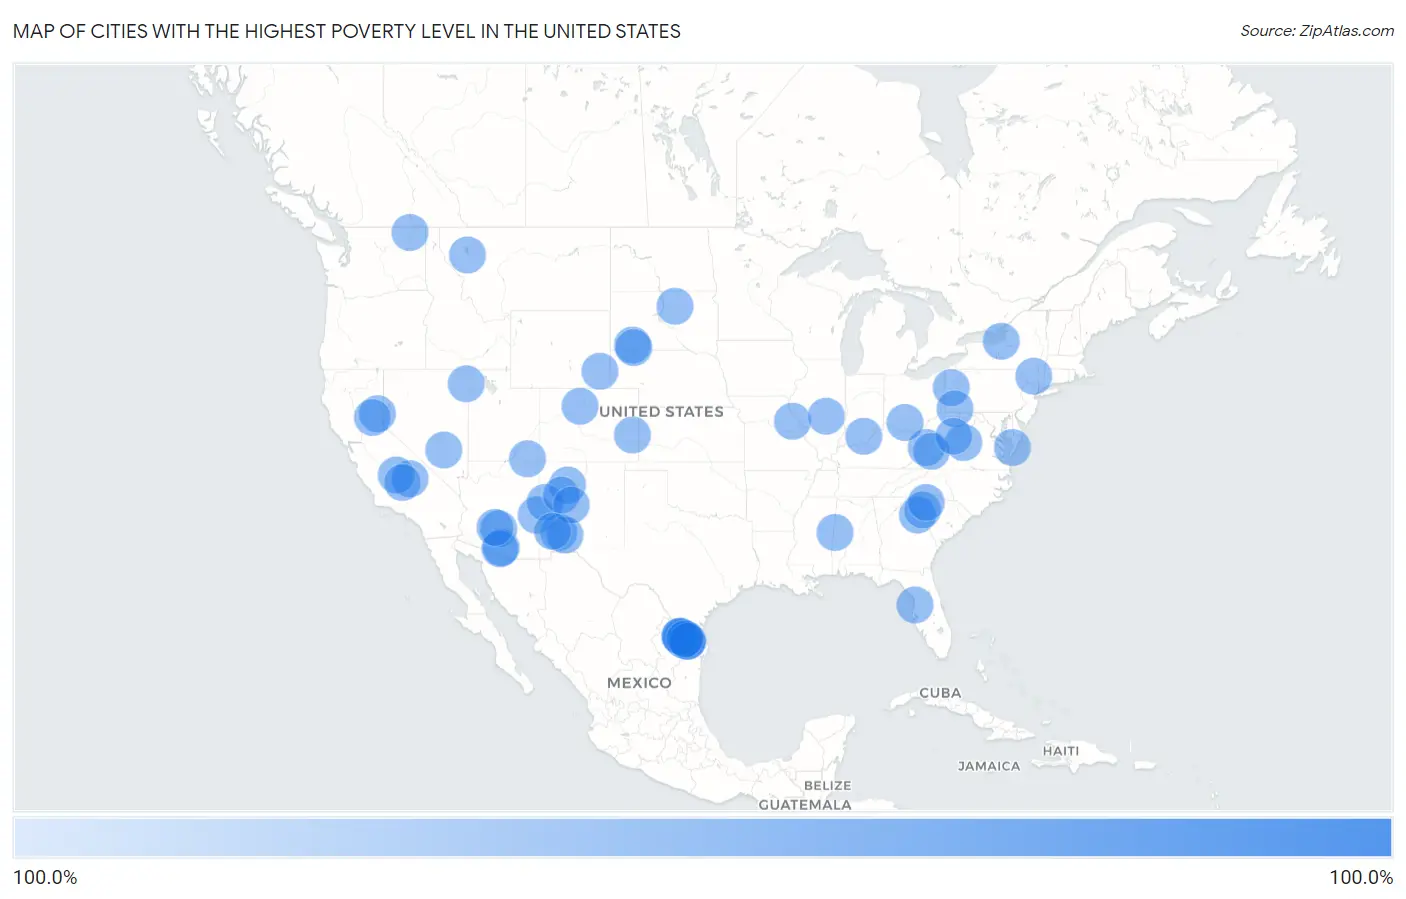
Map of Cities with the Highest Poverty Level in the United States
0.0%
100.0%
Cities with the Highest Poverty Level in the United States
| City | Poverty | vs State | vs National | |
| 1. | Suny Oswego | 100.0% | 13.6%(+86.4)#1 | 12.5%(+87.5)#1 |
| 2. | Fairfield University | 100.0% | 10.1%(+89.9)#1 | 12.5%(+87.5)#2 |
| 3. | Slippery Rock University | 100.0% | 11.8%(+88.2)#1 | 12.5%(+87.5)#3 |
| 4. | Siena College | 100.0% | 13.6%(+86.4)#2 | 12.5%(+87.5)#4 |
| 5. | Nazareth College | 100.0% | 13.6%(+86.4)#3 | 12.5%(+87.5)#5 |
| 6. | Manderson White Horse Creek | 100.0% | 12.3%(+87.7)#1 | 12.5%(+87.5)#6 |
| 7. | Watchtower | 100.0% | 13.6%(+86.4)#4 | 12.5%(+87.5)#7 |
| 8. | Placitas Cdp Dona Ana County | 100.0% | 18.3%(+81.7)#1 | 12.5%(+87.5)#8 |
| 9. | Nutrioso | 100.0% | 13.1%(+86.9)#1 | 12.5%(+87.5)#9 |
| 10. | Wounded Knee | 100.0% | 12.3%(+87.7)#2 | 12.5%(+87.5)#10 |
| 11. | Hilltop Cdp Starr County | 100.0% | 13.9%(+86.1)#1 | 12.5%(+87.5)#11 |
| 12. | La Esperanza | 100.0% | 13.9%(+86.1)#2 | 12.5%(+87.5)#12 |
| 13. | North Escobares | 100.0% | 13.9%(+86.1)#3 | 12.5%(+87.5)#13 |
| 14. | Millville | 100.0% | 12.3%(+87.7)#1 | 12.5%(+87.5)#14 |
| 15. | Swift Bird | 100.0% | 12.3%(+87.7)#3 | 12.5%(+87.5)#15 |
| 16. | Alden | 100.0% | 11.8%(+88.2)#1 | 12.5%(+87.5)#16 |
| 17. | San Luis | 100.0% | 18.3%(+81.7)#2 | 12.5%(+87.5)#17 |
| 18. | Pence | 100.0% | 12.3%(+87.7)#2 | 12.5%(+87.5)#18 |
| 19. | Haivana Nakya | 100.0% | 13.1%(+86.9)#2 | 12.5%(+87.5)#19 |
| 20. | El Castillo | 100.0% | 13.9%(+86.1)#4 | 12.5%(+87.5)#20 |
| 21. | Turtle Lake | 100.0% | 12.4%(+87.6)#1 | 12.5%(+87.5)#21 |
| 22. | Buffington | 100.0% | 11.8%(+88.2)#2 | 12.5%(+87.5)#22 |
| 23. | Fence Lake | 100.0% | 18.3%(+81.7)#3 | 12.5%(+87.5)#23 |
| 24. | El Quiote | 100.0% | 13.9%(+86.1)#5 | 12.5%(+87.5)#24 |
| 25. | Sweet Water Village | 100.0% | 13.1%(+86.9)#3 | 12.5%(+87.5)#25 |
| 26. | Bayport | 100.0% | 12.9%(+87.1)#1 | 12.5%(+87.5)#26 |
| 27. | Kennedy Meadows | 100.0% | 12.1%(+87.9)#1 | 12.5%(+87.5)#28 |
| 28. | Kingston | 100.0% | 18.3%(+81.7)#4 | 12.5%(+87.5)#29 |
| 29. | Argenta | 100.0% | 12.4%(+87.6)#2 | 12.5%(+87.5)#30 |
| 30. | Chiawuli Tak | 100.0% | 13.1%(+86.9)#4 | 12.5%(+87.5)#31 |
| 31. | Santa Cruz | 100.0% | 13.1%(+86.9)#5 | 12.5%(+87.5)#32 |
| 32. | Panola | 100.0% | 15.7%(+84.3)#1 | 12.5%(+87.5)#33 |
| 33. | Willington | 100.0% | 14.4%(+85.6)#1 | 12.5%(+87.5)#34 |
| 34. | Garfield | 100.0% | 18.3%(+81.7)#5 | 12.5%(+87.5)#35 |
| 35. | Penntown | 100.0% | 12.3%(+87.7)#3 | 12.5%(+87.5)#36 |
| 36. | Cubero | 100.0% | 18.3%(+81.7)#6 | 12.5%(+87.5)#37 |
| 37. | Evergreen Colony | 100.0% | 12.3%(+87.7)#4 | 12.5%(+87.5)#38 |
| 38. | Brentwood Colony | 100.0% | 12.3%(+87.7)#5 | 12.5%(+87.5)#39 |
| 39. | El Rancho | 100.0% | 12.1%(+87.9)#2 | 12.5%(+87.5)#40 |
| 40. | Quesada | 100.0% | 13.9%(+86.1)#6 | 12.5%(+87.5)#41 |
| 41. | Amherstdale | 100.0% | 16.8%(+83.2)#1 | 12.5%(+87.5)#42 |
| 42. | Shallow Water | 100.0% | 11.6%(+88.4)#1 | 12.5%(+87.5)#43 |
| 43. | Eagle Creek Colony | 100.0% | 12.4%(+87.6)#3 | 12.5%(+87.5)#44 |
| 44. | Slater | 100.0% | 10.7%(+89.3)#1 | 12.5%(+87.5)#45 |
| 45. | Sunset Colony | 100.0% | 12.3%(+87.7)#6 | 12.5%(+87.5)#46 |
| 46. | Mayfield Colony | 100.0% | 12.3%(+87.7)#7 | 12.5%(+87.5)#47 |
| 47. | Parshall | 100.0% | 9.6%(+90.4)#1 | 12.5%(+87.5)#48 |
| 48. | Shamrock Colony | 100.0% | 12.3%(+87.7)#8 | 12.5%(+87.5)#49 |
| 49. | La Loma De Falcon | 100.0% | 13.9%(+86.1)#7 | 12.5%(+87.5)#50 |
| 50. | Pleasant Valley Colony | 100.0% | 12.4%(+87.6)#4 | 12.5%(+87.5)#52 |
| 51. | Normandy | 100.0% | 13.9%(+86.1)#8 | 12.5%(+87.5)#53 |
| 52. | Middlebrook | 100.0% | 10.0%(+90.0)#1 | 12.5%(+87.5)#54 |
| 53. | Los Ebanos Cdp Hidalgo County | 100.0% | 13.9%(+86.1)#9 | 12.5%(+87.5)#55 |
| 54. | Osage | 100.0% | 16.8%(+83.2)#2 | 12.5%(+87.5)#56 |
| 55. | New Elm Spring Colony | 100.0% | 12.3%(+87.7)#9 | 12.5%(+87.5)#57 |
| 56. | Clearfield Colony | 100.0% | 12.3%(+87.7)#10 | 12.5%(+87.5)#58 |
| 57. | Deep Creek | 100.0% | 10.0%(+90.0)#2 | 12.5%(+87.5)#59 |
| 58. | Fredericksburg | 100.0% | 12.3%(+87.7)#4 | 12.5%(+87.5)#60 |
| 59. | Villa Sin Miedo | 100.0% | 42.2%(+57.8)#1 | 12.5%(+87.5)#61 |
| 60. | Ashley | 100.0% | 12.8%(+87.2)#1 | 12.5%(+87.5)#62 |
| 61. | Silverdale | 100.0% | 11.6%(+88.4)#2 | 12.5%(+87.5)#63 |
| 62. | Boyds | 100.0% | 9.9%(+90.1)#1 | 12.5%(+87.5)#64 |
| 63. | Coronaca | 100.0% | 14.4%(+85.6)#2 | 12.5%(+87.5)#65 |
| 64. | Midway Colony | 100.0% | 12.4%(+87.6)#5 | 12.5%(+87.5)#66 |
| 65. | Veguita | 100.0% | 18.3%(+81.7)#7 | 12.5%(+87.5)#67 |
| 66. | Burney | 100.0% | 12.3%(+87.7)#5 | 12.5%(+87.5)#68 |
| 67. | Acala | 100.0% | 13.9%(+86.1)#10 | 12.5%(+87.5)#69 |
| 68. | Westervelt | 100.0% | 11.8%(+88.2)#2 | 12.5%(+87.5)#70 |
| 69. | Sattley | 100.0% | 12.1%(+87.9)#3 | 12.5%(+87.5)#71 |
| 70. | Symonds | 100.0% | 19.2%(+80.8)#1 | 12.5%(+87.5)#72 |
| 71. | Brandon | 100.0% | 9.6%(+90.4)#2 | 12.5%(+87.5)#73 |
| 72. | Victoria Vera | 100.0% | 13.9%(+86.1)#11 | 12.5%(+87.5)#74 |
| 73. | Lawrenceport | 100.0% | 12.3%(+87.7)#6 | 12.5%(+87.5)#75 |
| 74. | Cross Anchor | 100.0% | 14.4%(+85.6)#3 | 12.5%(+87.5)#76 |
| 75. | Lake Roberts Heights | 100.0% | 18.3%(+81.7)#8 | 12.5%(+87.5)#77 |
| 76. | Cynthiana | 100.0% | 13.3%(+86.7)#1 | 12.5%(+87.5)#78 |
| 77. | Sage Creek Colony | 100.0% | 12.4%(+87.6)#6 | 12.5%(+87.5)#79 |
| 78. | Cascade Colony | 100.0% | 12.4%(+87.6)#7 | 12.5%(+87.5)#80 |
| 79. | Onaka | 100.0% | 12.3%(+87.7)#11 | 12.5%(+87.5)#81 |
| 80. | Martinsdale Colony | 100.0% | 12.4%(+87.6)#8 | 12.5%(+87.5)#82 |
| 81. | Montello | 100.0% | 12.7%(+87.3)#1 | 12.5%(+87.5)#83 |
| 82. | Mexican Hat | 100.0% | 8.5%(+91.5)#1 | 12.5%(+87.5)#84 |
| 83. | New Richmond | 100.0% | 16.8%(+83.2)#3 | 12.5%(+87.5)#85 |
| 84. | Rachel | 100.0% | 12.7%(+87.3)#2 | 12.5%(+87.5)#86 |
| 85. | Mcclenney Tract | 100.0% | 12.1%(+87.9)#4 | 12.5%(+87.5)#87 |
| 86. | Clay | 100.0% | 13.9%(+86.1)#13 | 12.5%(+87.5)#88 |
| 87. | Falconaire | 100.0% | 13.9%(+86.1)#14 | 12.5%(+87.5)#89 |
| 88. | Palo Blanco | 100.0% | 13.9%(+86.1)#15 | 12.5%(+87.5)#90 |
| 89. | Beaver | 100.0% | 11.6%(+88.4)#3 | 12.5%(+87.5)#91 |
| 90. | Chapeno | 100.0% | 13.9%(+86.1)#16 | 12.5%(+87.5)#92 |
| 91. | Leamersville | 100.0% | 11.8%(+88.2)#3 | 12.5%(+87.5)#93 |
| 92. | Cold Springs Cdp Tuolumne County | 100.0% | 12.1%(+87.9)#5 | 12.5%(+87.5)#94 |
| 93. | Warm Spring Creek | 100.0% | 12.4%(+87.6)#9 | 12.5%(+87.5)#95 |
| 94. | Loring Colony | 100.0% | 12.4%(+87.6)#10 | 12.5%(+87.5)#96 |
| 95. | Doran | 100.0% | 10.0%(+90.0)#3 | 12.5%(+87.5)#97 |
| 96. | Cass | 100.0% | 16.8%(+83.2)#4 | 12.5%(+87.5)#98 |
| 97. | Rafael Pena | 100.0% | 13.9%(+86.1)#17 | 12.5%(+87.5)#99 |
| 98. | Graniteville | 100.0% | 12.1%(+87.9)#6 | 12.5%(+87.5)#100 |
| 99. | Martinez | 100.0% | 13.9%(+86.1)#18 | 12.5%(+87.5)#101 |
| 100. | Coosawhatchie | 100.0% | 14.4%(+85.6)#4 | 12.5%(+87.5)#102 |
Common Questions
What are the Top 10 Cities with the Highest Poverty Level in the United States?
Top 10 Cities with the Highest Poverty Level in the United States are:
#1
100.0%
#2
100.0%
#3
100.0%
#4
100.0%
#5
100.0%
#6
100.0%
#7
100.0%
#8
100.0%
#9
100.0%
#10
100.0%
What city has the Highest Poverty Level in the United States?
SUNY Oswego has the Highest Poverty Level in the United States with 100.0%.
What is the Poverty Level in the United States?
Poverty Level in the United States is 12.5%.