Florence, SC Map & Demographics
Florence Map
Florence Overview
$33,867
PER CAPITA INCOME
$76,030
AVG FAMILY INCOME
$56,031
AVG HOUSEHOLD INCOME
26.4%
WAGE / INCOME GAP [ % ]
73.6¢/ $1
WAGE / INCOME GAP [ $ ]
$10,744
FAMILY INCOME DEFICIT
0.51
INEQUALITY / GINI INDEX
39,931
TOTAL POPULATION
18,173
MALE POPULATION
21,758
FEMALE POPULATION
83.52
MALES / 100 FEMALES
119.73
FEMALES / 100 MALES
38.0
MEDIAN AGE
3.2
AVG FAMILY SIZE
2.4
AVG HOUSEHOLD SIZE
18,983
LABOR FORCE [ PEOPLE ]
60.5%
PERCENT IN LABOR FORCE
4.8%
UNEMPLOYMENT RATE
Florence Area Codes
Income in Florence
Income Overview in Florence
Per Capita Income in Florence is $33,867, while median incomes of families and households are $76,030 and $56,031 respectively.
| Characteristic | Number | Measure |
| Per Capita Income | 39,931 | $33,867 |
| Median Family Income | 9,891 | $76,030 |
| Mean Family Income | 9,891 | $100,521 |
| Median Household Income | 16,322 | $56,031 |
| Mean Household Income | 16,322 | $80,687 |
| Income Deficit | 9,891 | $10,744 |
| Wage / Income Gap (%) | 39,931 | 26.44% |
| Wage / Income Gap ($) | 39,931 | 73.56¢ per $1 |
| Gini / Inequality Index | 39,931 | 0.51 |
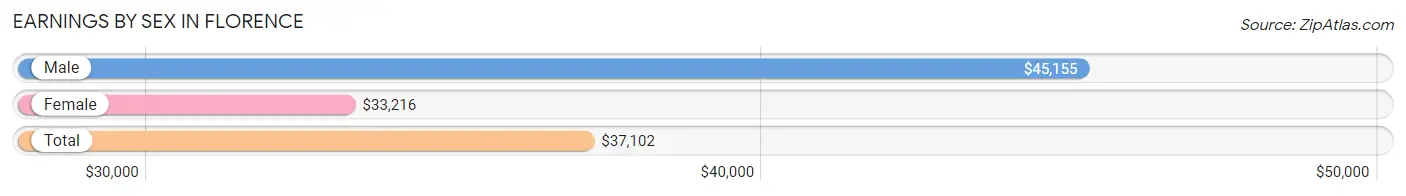
Earnings by Sex in Florence
Average Earnings in Florence are $37,102, $45,155 for men and $33,216 for women, a difference of 26.4%.
| Sex | Number | Average Earnings |
| Male | 9,172 (47.0%) | $45,155 |
| Female | 10,355 (53.0%) | $33,216 |
| Total | 19,527 (100.0%) | $37,102 |
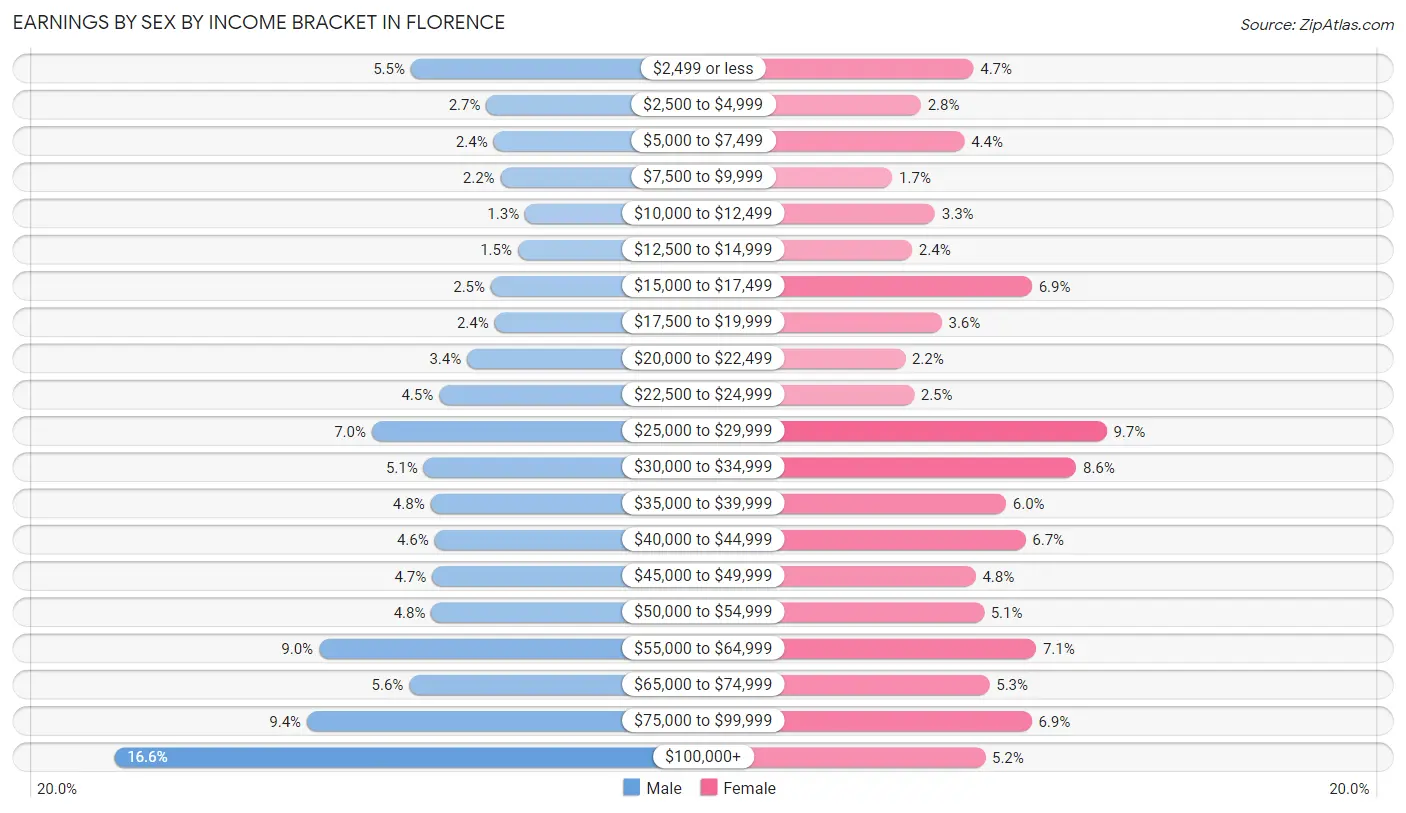
Earnings by Sex by Income Bracket in Florence
The most common earnings brackets in Florence are $100,000+ for men (1,526 | 16.6%) and $25,000 to $29,999 for women (1,008 | 9.7%).
| Income | Male | Female |
| $2,499 or less | 507 (5.5%) | 491 (4.7%) |
| $2,500 to $4,999 | 248 (2.7%) | 287 (2.8%) |
| $5,000 to $7,499 | 223 (2.4%) | 456 (4.4%) |
| $7,500 to $9,999 | 199 (2.2%) | 176 (1.7%) |
| $10,000 to $12,499 | 115 (1.3%) | 342 (3.3%) |
| $12,500 to $14,999 | 139 (1.5%) | 253 (2.4%) |
| $15,000 to $17,499 | 232 (2.5%) | 718 (6.9%) |
| $17,500 to $19,999 | 219 (2.4%) | 368 (3.5%) |
| $20,000 to $22,499 | 314 (3.4%) | 226 (2.2%) |
| $22,500 to $24,999 | 410 (4.5%) | 260 (2.5%) |
| $25,000 to $29,999 | 641 (7.0%) | 1,008 (9.7%) |
| $30,000 to $34,999 | 463 (5.1%) | 890 (8.6%) |
| $35,000 to $39,999 | 439 (4.8%) | 617 (6.0%) |
| $40,000 to $44,999 | 426 (4.6%) | 693 (6.7%) |
| $45,000 to $49,999 | 434 (4.7%) | 499 (4.8%) |
| $50,000 to $54,999 | 437 (4.8%) | 531 (5.1%) |
| $55,000 to $64,999 | 823 (9.0%) | 734 (7.1%) |
| $65,000 to $74,999 | 513 (5.6%) | 553 (5.3%) |
| $75,000 to $99,999 | 864 (9.4%) | 717 (6.9%) |
| $100,000+ | 1,526 (16.6%) | 536 (5.2%) |
| Total | 9,172 (100.0%) | 10,355 (100.0%) |
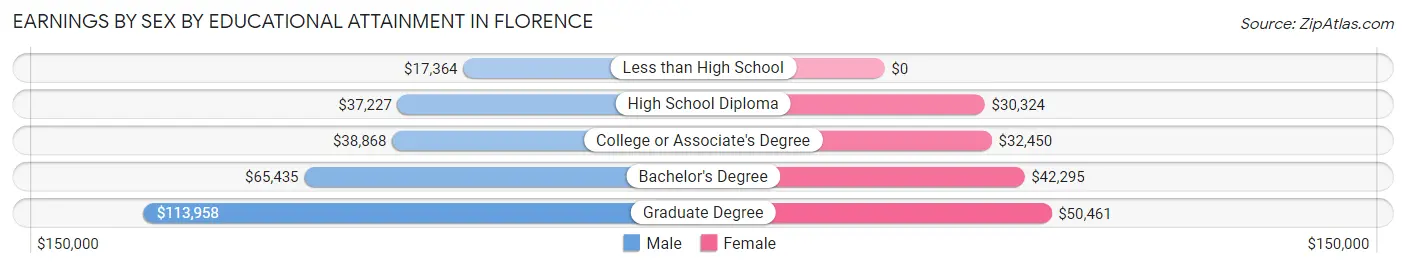
Earnings by Sex by Educational Attainment in Florence
Average earnings in Florence are $49,065 for men and $36,130 for women, a difference of 26.4%. Men with an educational attainment of graduate degree enjoy the highest average annual earnings of $113,958, while those with less than high school education earn the least with $17,364. Women with an educational attainment of graduate degree earn the most with the average annual earnings of $50,461, while those with high school diploma education have the smallest earnings of $30,324.
| Educational Attainment | Male Income | Female Income |
| Less than High School | $17,364 | $0 |
| High School Diploma | $37,227 | $30,324 |
| College or Associate's Degree | $38,868 | $32,450 |
| Bachelor's Degree | $65,435 | $42,295 |
| Graduate Degree | $113,958 | $50,461 |
| Total | $49,065 | $36,130 |
Family Income in Florence
Family Income Brackets in Florence
According to the Florence family income data, there are 1,988 families falling into the $100,000 to $149,999 income range, which is the most common income bracket and makes up 20.1% of all families. Conversely, the $10,000 to $14,999 income bracket is the least frequent group with only 267 families (2.7%) belonging to this category.
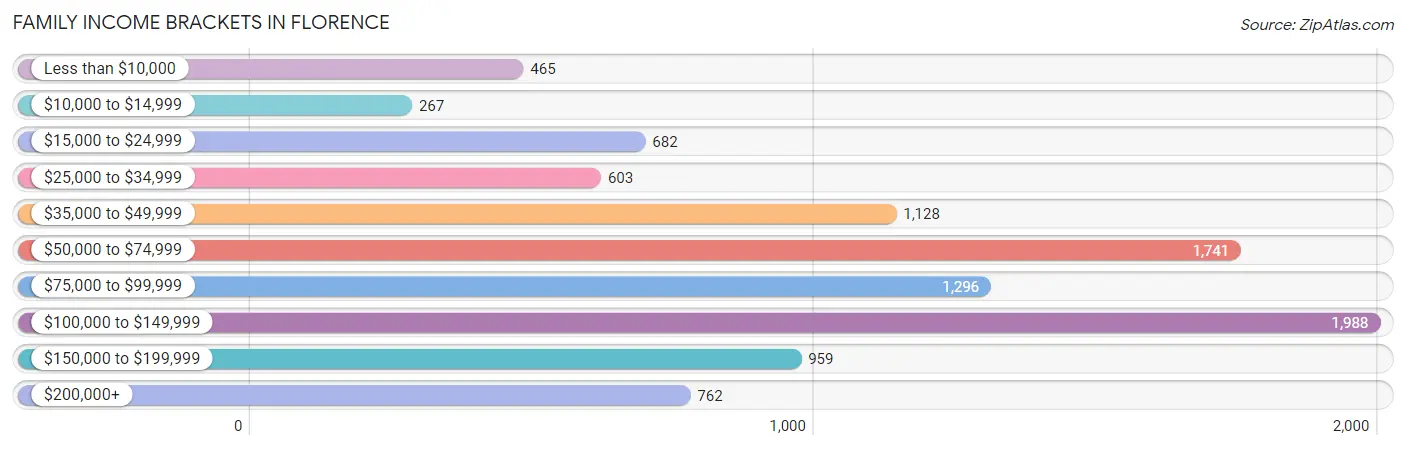
| Income Bracket | # Families | % Families |
| Less than $10,000 | 465 | 4.7% |
| $10,000 to $14,999 | 267 | 2.7% |
| $15,000 to $24,999 | 682 | 6.9% |
| $25,000 to $34,999 | 603 | 6.1% |
| $35,000 to $49,999 | 1,128 | 11.4% |
| $50,000 to $74,999 | 1,741 | 17.6% |
| $75,000 to $99,999 | 1,296 | 13.1% |
| $100,000 to $149,999 | 1,988 | 20.1% |
| $150,000 to $199,999 | 959 | 9.7% |
| $200,000+ | 762 | 7.7% |
Family Income by Famaliy Size in Florence
5-person families (719 | 7.3%) account for the highest median family income in Florence with $105,673 per family, while 3-person families (2,428 | 24.5%) have the highest median income of $32,178 per family member.
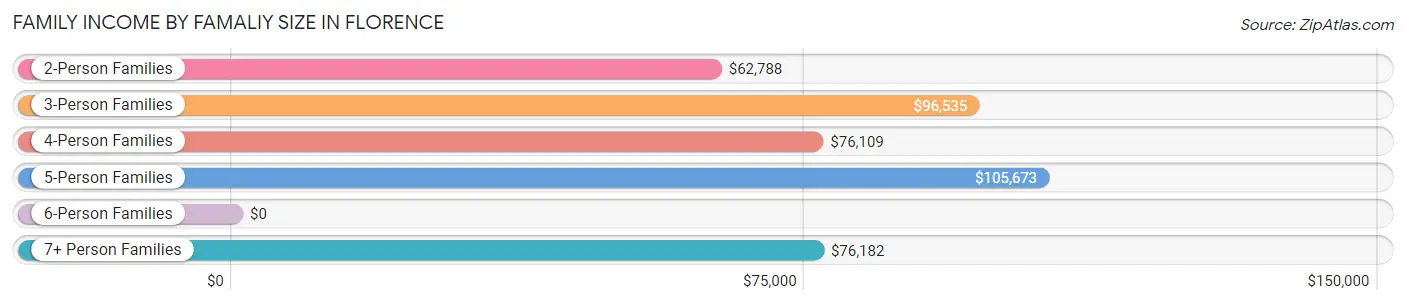
| Income Bracket | # Families | Median Income |
| 2-Person Families | 4,842 (48.9%) | $62,788 |
| 3-Person Families | 2,428 (24.5%) | $96,535 |
| 4-Person Families | 1,555 (15.7%) | $76,109 |
| 5-Person Families | 719 (7.3%) | $105,673 |
| 6-Person Families | 218 (2.2%) | $0 |
| 7+ Person Families | 129 (1.3%) | $76,182 |
| Total | 9,891 (100.0%) | $76,030 |
Family Income by Number of Earners in Florence
The median family income in Florence is $76,030, with families comprising 2 earners (3,885) having the highest median family income of $101,422, while families with no earners (1,592) have the lowest median family income of $31,633, accounting for 39.3% and 16.1% of families, respectively.
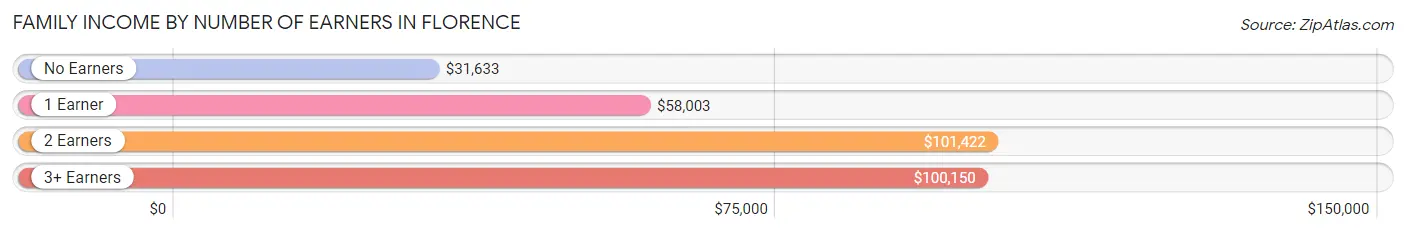
| Number of Earners | # Families | Median Income |
| No Earners | 1,592 (16.1%) | $31,633 |
| 1 Earner | 3,393 (34.3%) | $58,003 |
| 2 Earners | 3,885 (39.3%) | $101,422 |
| 3+ Earners | 1,021 (10.3%) | $100,150 |
| Total | 9,891 (100.0%) | $76,030 |
Household Income in Florence
Household Income Brackets in Florence
With 3,101 households falling in the category, the $50,000 to $74,999 income range is the most frequent in Florence, accounting for 19.0% of all households. In contrast, only 881 households (5.4%) fall into the $200,000+ income bracket, making it the least populous group.
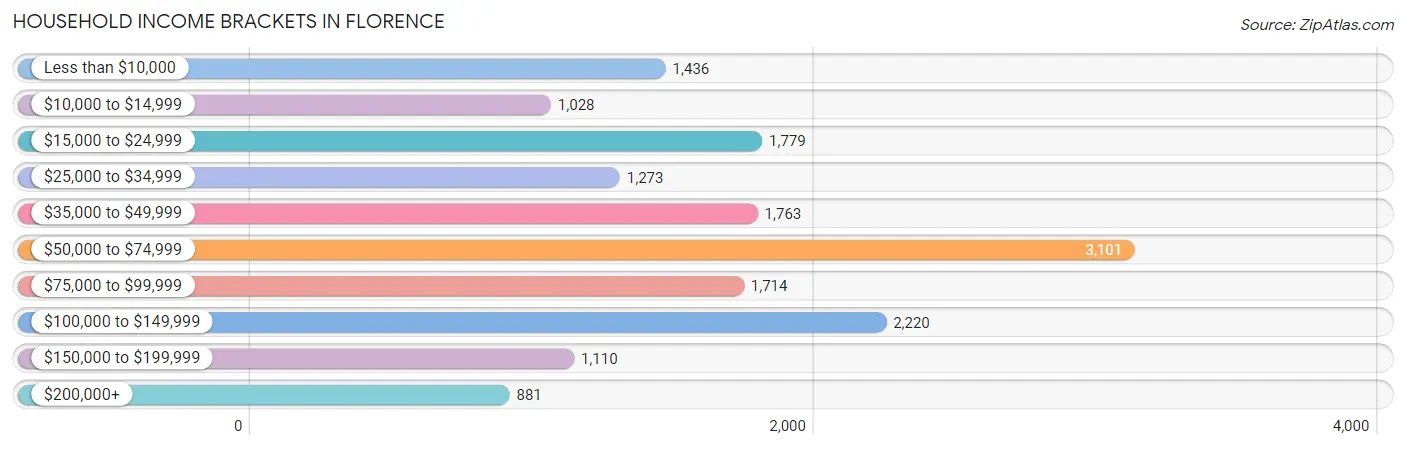
| Income Bracket | # Households | % Households |
| Less than $10,000 | 1,436 | 8.8% |
| $10,000 to $14,999 | 1,028 | 6.3% |
| $15,000 to $24,999 | 1,779 | 10.9% |
| $25,000 to $34,999 | 1,273 | 7.8% |
| $35,000 to $49,999 | 1,763 | 10.8% |
| $50,000 to $74,999 | 3,101 | 19.0% |
| $75,000 to $99,999 | 1,714 | 10.5% |
| $100,000 to $149,999 | 2,220 | 13.6% |
| $150,000 to $199,999 | 1,110 | 6.8% |
| $200,000+ | 881 | 5.4% |
Household Income by Householder Age in Florence
The median household income in Florence is $56,031, with the highest median household income of $67,370 found in the 25 to 44 years age bracket for the primary householder. A total of 5,735 households (35.1%) fall into this category. Meanwhile, the 15 to 24 years age bracket for the primary householder has the lowest median household income of $0, with 598 households (3.7%) in this group.
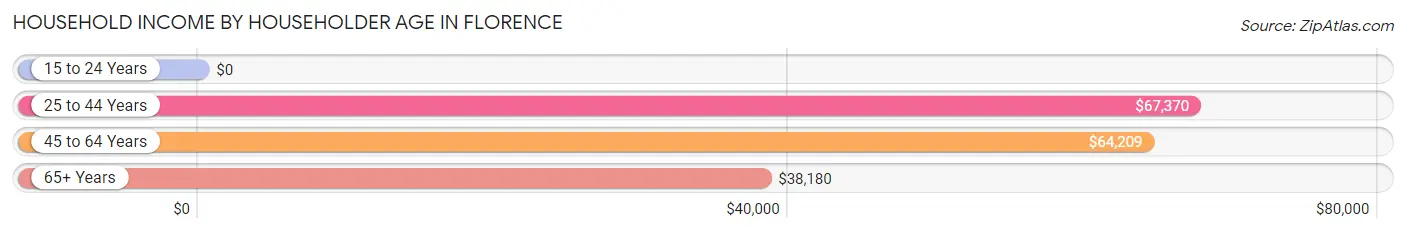
| Income Bracket | # Households | Median Income |
| 15 to 24 Years | 598 (3.7%) | $0 |
| 25 to 44 Years | 5,735 (35.1%) | $67,370 |
| 45 to 64 Years | 5,393 (33.0%) | $64,209 |
| 65+ Years | 4,596 (28.2%) | $38,180 |
| Total | 16,322 (100.0%) | $56,031 |
Poverty in Florence
Income Below Poverty by Sex and Age in Florence
With 19.2% poverty level for males and 18.5% for females among the residents of Florence, under 5 year old males and 12 to 14 year old females are the most vulnerable to poverty, with 431 males (34.4%) and 393 females (31.0%) in their respective age groups living below the poverty level.
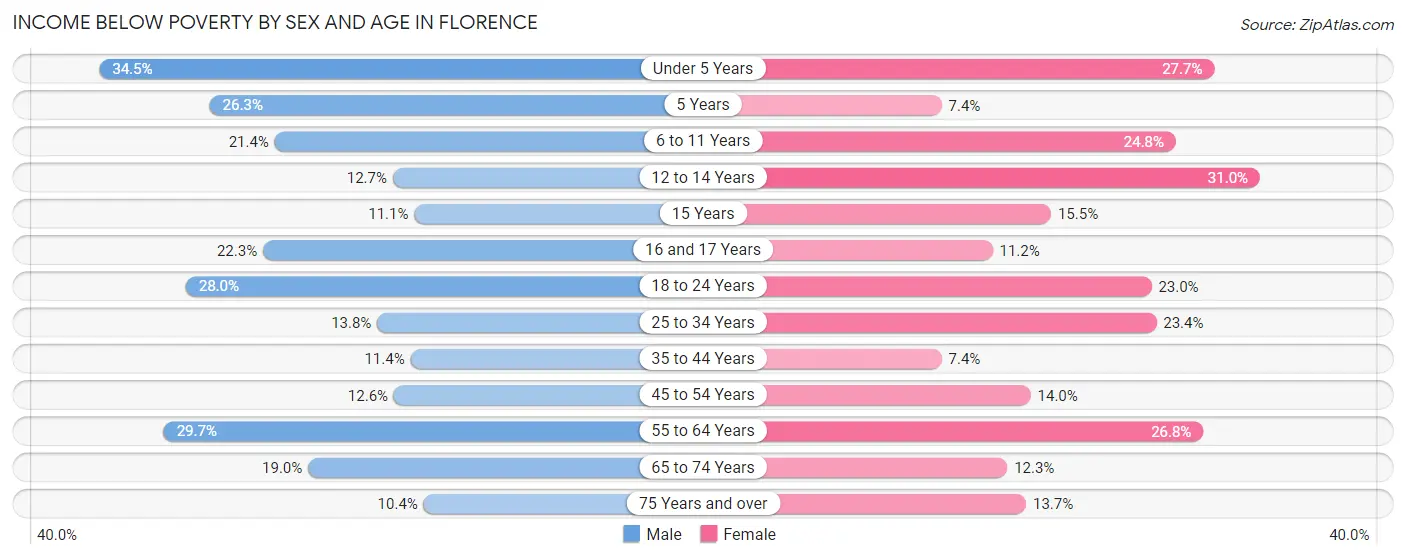
| Age Bracket | Male | Female |
| Under 5 Years | 431 (34.4%) | 362 (27.7%) |
| 5 Years | 78 (26.3%) | 34 (7.4%) |
| 6 to 11 Years | 296 (21.4%) | 304 (24.8%) |
| 12 to 14 Years | 112 (12.7%) | 393 (31.0%) |
| 15 Years | 28 (11.1%) | 32 (15.5%) |
| 16 and 17 Years | 124 (22.3%) | 76 (11.2%) |
| 18 to 24 Years | 365 (28.0%) | 391 (23.0%) |
| 25 to 34 Years | 375 (13.8%) | 688 (23.4%) |
| 35 to 44 Years | 243 (11.4%) | 197 (7.4%) |
| 45 to 54 Years | 240 (12.6%) | 368 (14.0%) |
| 55 to 64 Years | 707 (29.7%) | 595 (26.8%) |
| 65 to 74 Years | 340 (19.0%) | 306 (12.3%) |
| 75 Years and over | 110 (10.4%) | 238 (13.7%) |
| Total | 3,449 (19.2%) | 3,984 (18.5%) |
Income Above Poverty by Sex and Age in Florence
According to the poverty statistics in Florence, males aged 75 years and over and females aged 5 years are the age groups that are most secure financially, with 89.6% of males and 92.6% of females in these age groups living above the poverty line.
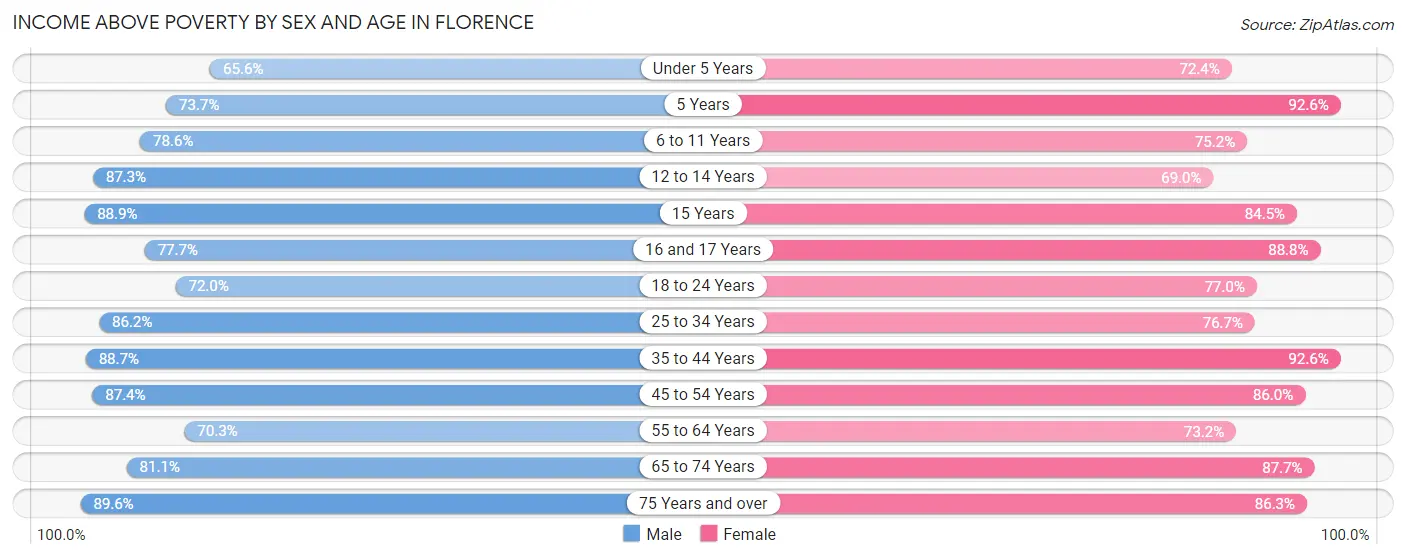
| Age Bracket | Male | Female |
| Under 5 Years | 820 (65.5%) | 947 (72.4%) |
| 5 Years | 219 (73.7%) | 425 (92.6%) |
| 6 to 11 Years | 1,085 (78.6%) | 922 (75.2%) |
| 12 to 14 Years | 773 (87.3%) | 873 (69.0%) |
| 15 Years | 225 (88.9%) | 174 (84.5%) |
| 16 and 17 Years | 432 (77.7%) | 603 (88.8%) |
| 18 to 24 Years | 937 (72.0%) | 1,310 (77.0%) |
| 25 to 34 Years | 2,339 (86.2%) | 2,259 (76.6%) |
| 35 to 44 Years | 1,898 (88.6%) | 2,461 (92.6%) |
| 45 to 54 Years | 1,668 (87.4%) | 2,256 (86.0%) |
| 55 to 64 Years | 1,676 (70.3%) | 1,623 (73.2%) |
| 65 to 74 Years | 1,454 (81.0%) | 2,185 (87.7%) |
| 75 Years and over | 951 (89.6%) | 1,502 (86.3%) |
| Total | 14,477 (80.8%) | 17,540 (81.5%) |
Income Below Poverty Among Married-Couple Families in Florence
The poverty statistics for married-couple families in Florence show that 3.9% or 255 of the total 6,579 families live below the poverty line. Families with 5 or more children have the highest poverty rate of 100.0%, comprising of 22 families. On the other hand, families with 3 or 4 children have the lowest poverty rate of 0.0%, which includes 0 families.
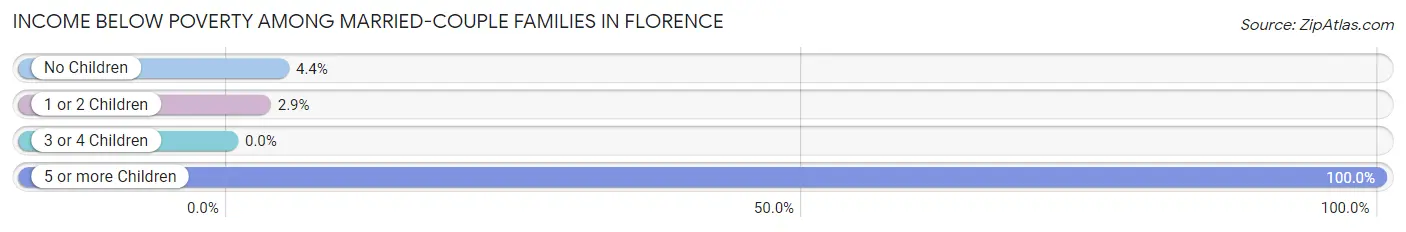
| Children | Above Poverty | Below Poverty |
| No Children | 3,699 (95.6%) | 172 (4.4%) |
| 1 or 2 Children | 2,079 (97.2%) | 61 (2.9%) |
| 3 or 4 Children | 546 (100.0%) | 0 (0.0%) |
| 5 or more Children | 0 (0.0%) | 22 (100.0%) |
| Total | 6,324 (96.1%) | 255 (3.9%) |
Income Below Poverty Among Single-Parent Households in Florence
According to the poverty data in Florence, 46.3% or 259 single-father households and 28.5% or 786 single-mother households are living below the poverty line. Among single-father households, those with 5 or more children have the highest poverty rate, with 111 households (100.0%) experiencing poverty. Likewise, among single-mother households, those with 3 or 4 children have the highest poverty rate, with 134 households (66.0%) falling below the poverty line.
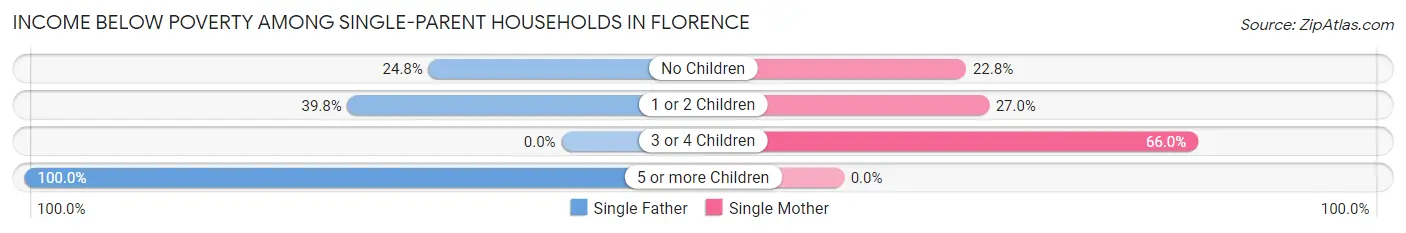
| Children | Single Father | Single Mother |
| No Children | 50 (24.7%) | 198 (22.8%) |
| 1 or 2 Children | 98 (39.8%) | 454 (27.0%) |
| 3 or 4 Children | 0 (0.0%) | 134 (66.0%) |
| 5 or more Children | 111 (100.0%) | 0 (0.0%) |
| Total | 259 (46.3%) | 786 (28.5%) |
Income Below Poverty Among Married-Couple vs Single-Parent Households in Florence
The poverty data for Florence shows that 255 of the married-couple family households (3.9%) and 1,045 of the single-parent households (31.6%) are living below the poverty level. Within the married-couple family households, those with 5 or more children have the highest poverty rate, with 22 households (100.0%) falling below the poverty line. Among the single-parent households, those with 5 or more children have the highest poverty rate, with 111 household (100.0%) living below poverty.
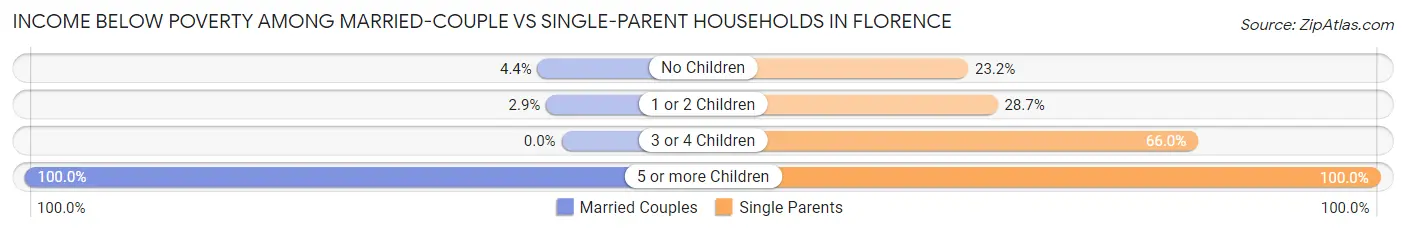
| Children | Married-Couple Families | Single-Parent Households |
| No Children | 172 (4.4%) | 248 (23.2%) |
| 1 or 2 Children | 61 (2.9%) | 552 (28.6%) |
| 3 or 4 Children | 0 (0.0%) | 134 (66.0%) |
| 5 or more Children | 22 (100.0%) | 111 (100.0%) |
| Total | 255 (3.9%) | 1,045 (31.6%) |
Race in Florence
The most populous races in Florence are Black / African American (20,123 | 50.4%), White / Caucasian (17,254 | 43.2%), and Asian (1,060 | 2.6%).
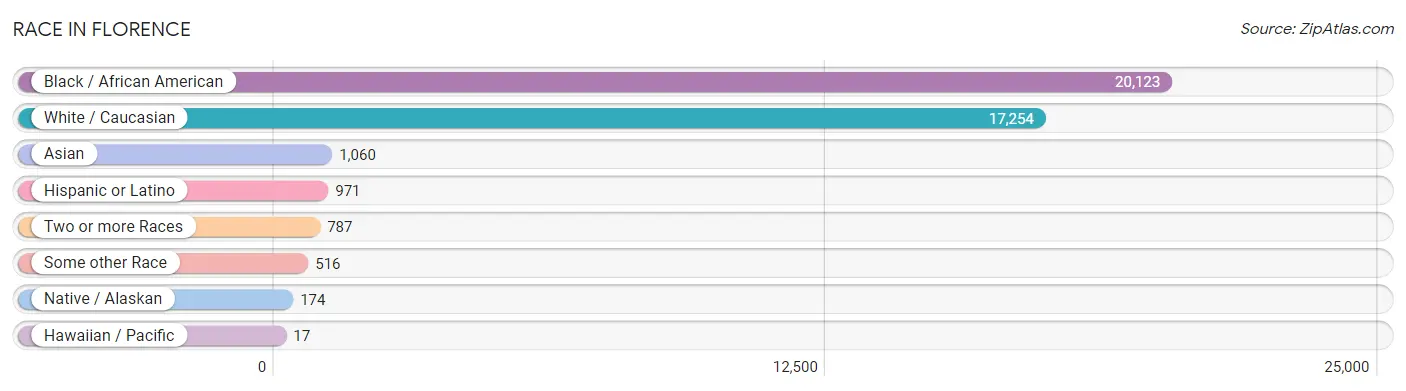
| Race | # Population | % Population |
| Asian | 1,060 | 2.6% |
| Black / African American | 20,123 | 50.4% |
| Hawaiian / Pacific | 17 | 0.0% |
| Hispanic or Latino | 971 | 2.4% |
| Native / Alaskan | 174 | 0.4% |
| White / Caucasian | 17,254 | 43.2% |
| Two or more Races | 787 | 2.0% |
| Some other Race | 516 | 1.3% |
| Total | 39,931 | 100.0% |
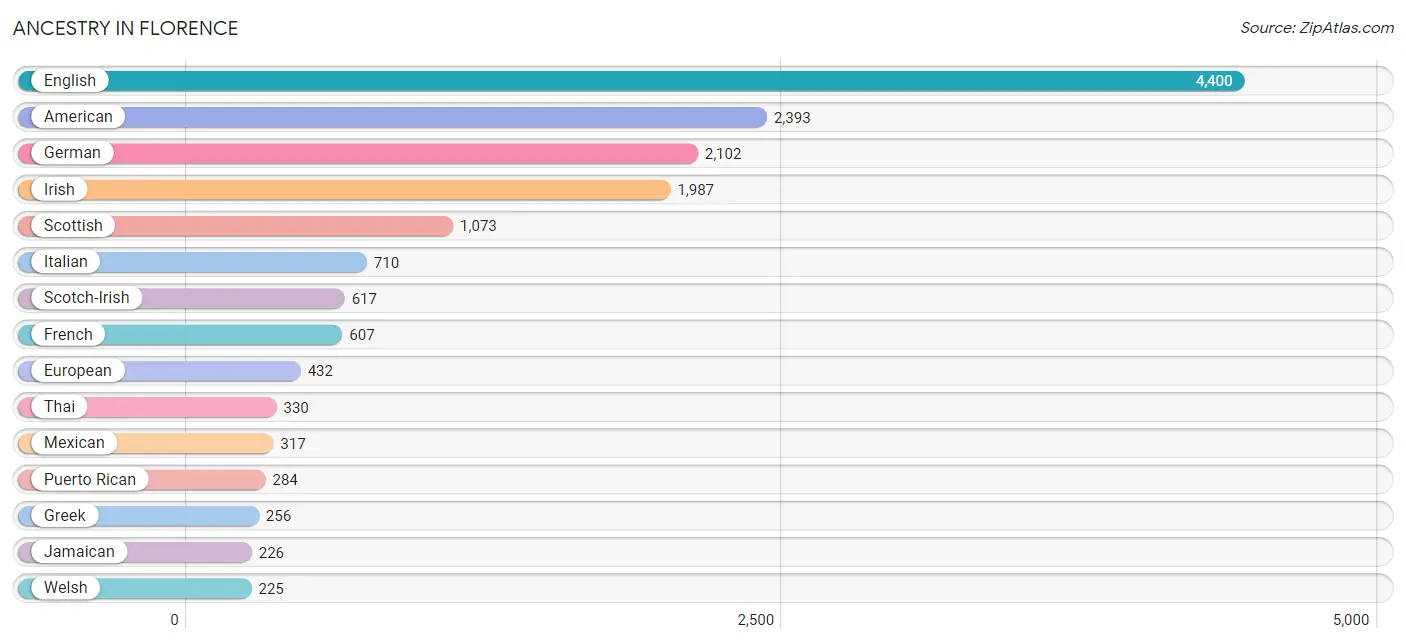
Ancestry in Florence
The most populous ancestries reported in Florence are English (4,400 | 11.0%), American (2,393 | 6.0%), German (2,102 | 5.3%), Irish (1,987 | 5.0%), and Scottish (1,073 | 2.7%), together accounting for 29.9% of all Florence residents.
| Ancestry | # Population | % Population |
| African | 54 | 0.1% |
| American | 2,393 | 6.0% |
| Arab | 160 | 0.4% |
| Argentinean | 6 | 0.0% |
| Armenian | 8 | 0.0% |
| Australian | 4 | 0.0% |
| Austrian | 50 | 0.1% |
| Bahamian | 6 | 0.0% |
| Bangladeshi | 60 | 0.2% |
| Belgian | 12 | 0.0% |
| Bhutanese | 8 | 0.0% |
| British | 138 | 0.4% |
| Burmese | 147 | 0.4% |
| Central American | 172 | 0.4% |
| Central American Indian | 14 | 0.0% |
| Cherokee | 68 | 0.2% |
| Chilean | 2 | 0.0% |
| Colombian | 105 | 0.3% |
| Costa Rican | 43 | 0.1% |
| Croatian | 158 | 0.4% |
| Cuban | 8 | 0.0% |
| Czechoslovakian | 20 | 0.1% |
| Danish | 9 | 0.0% |
| Dutch | 68 | 0.2% |
| English | 4,400 | 11.0% |
| European | 432 | 1.1% |
| French | 607 | 1.5% |
| French Canadian | 51 | 0.1% |
| German | 2,102 | 5.3% |
| Greek | 256 | 0.6% |
| Guatemalan | 26 | 0.1% |
| Hungarian | 32 | 0.1% |
| Indian (Asian) | 187 | 0.5% |
| Irish | 1,987 | 5.0% |
| Italian | 710 | 1.8% |
| Jamaican | 226 | 0.6% |
| Jordanian | 41 | 0.1% |
| Kenyan | 45 | 0.1% |
| Korean | 197 | 0.5% |
| Lebanese | 115 | 0.3% |
| Lithuanian | 11 | 0.0% |
| Lumbee | 93 | 0.2% |
| Mexican | 317 | 0.8% |
| Native Hawaiian | 17 | 0.0% |
| Norwegian | 22 | 0.1% |
| Panamanian | 2 | 0.0% |
| Polish | 179 | 0.4% |
| Portuguese | 16 | 0.0% |
| Puerto Rican | 284 | 0.7% |
| Russian | 9 | 0.0% |
| Salvadoran | 101 | 0.3% |
| Samoan | 58 | 0.2% |
| Scotch-Irish | 617 | 1.5% |
| Scottish | 1,073 | 2.7% |
| Slavic | 44 | 0.1% |
| South American | 113 | 0.3% |
| Spaniard | 12 | 0.0% |
| Sri Lankan | 6 | 0.0% |
| Subsaharan African | 135 | 0.3% |
| Swedish | 20 | 0.1% |
| Swiss | 3 | 0.0% |
| Syrian | 4 | 0.0% |
| Thai | 330 | 0.8% |
| Welsh | 225 | 0.6% |
| West Indian | 14 | 0.0% | View All 65 Rows |
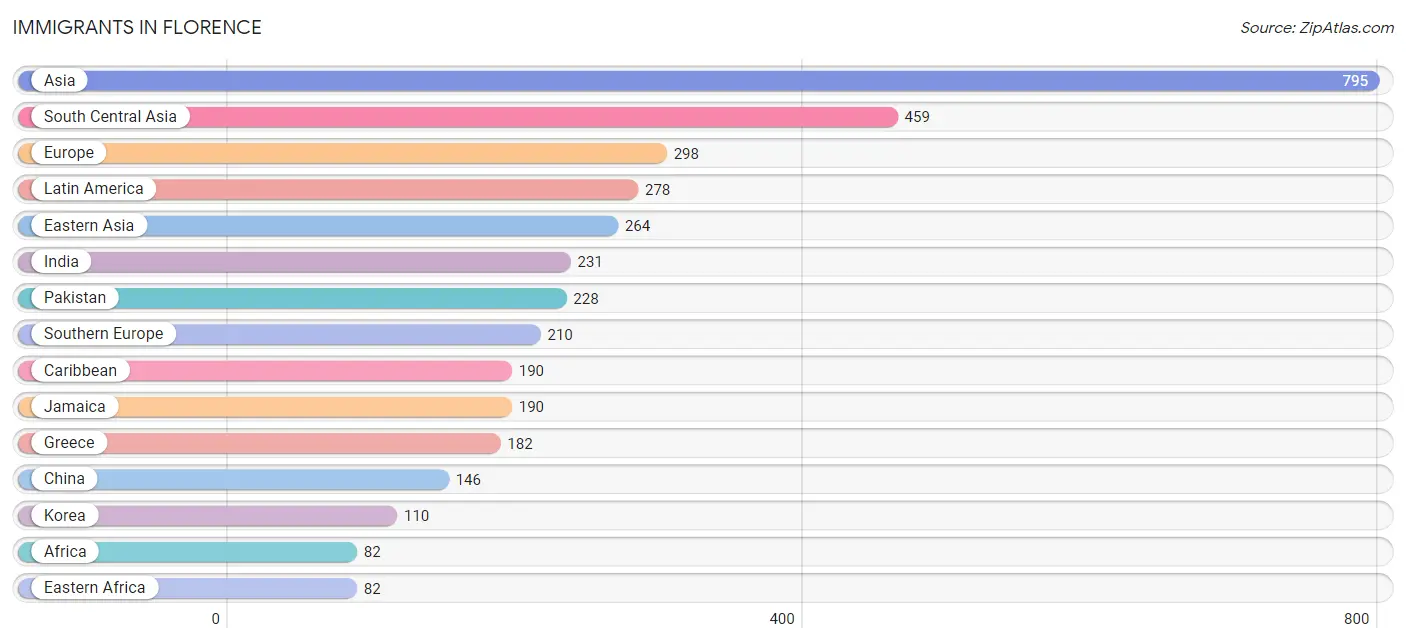
Immigrants in Florence
The most numerous immigrant groups reported in Florence came from Asia (795 | 2.0%), South Central Asia (459 | 1.1%), Europe (298 | 0.7%), Latin America (278 | 0.7%), and Eastern Asia (264 | 0.7%), together accounting for 5.2% of all Florence residents.
| Immigration Origin | # Population | % Population |
| Africa | 82 | 0.2% |
| Argentina | 6 | 0.0% |
| Asia | 795 | 2.0% |
| Australia | 4 | 0.0% |
| Canada | 40 | 0.1% |
| Caribbean | 190 | 0.5% |
| Central America | 51 | 0.1% |
| Chile | 2 | 0.0% |
| China | 146 | 0.4% |
| Colombia | 29 | 0.1% |
| Costa Rica | 2 | 0.0% |
| Eastern Africa | 82 | 0.2% |
| Eastern Asia | 264 | 0.7% |
| Eastern Europe | 40 | 0.1% |
| El Salvador | 16 | 0.0% |
| England | 11 | 0.0% |
| Europe | 298 | 0.7% |
| Greece | 182 | 0.5% |
| Guatemala | 26 | 0.1% |
| Hong Kong | 21 | 0.1% |
| Hungary | 10 | 0.0% |
| India | 231 | 0.6% |
| Jamaica | 190 | 0.5% |
| Japan | 8 | 0.0% |
| Jordan | 15 | 0.0% |
| Kenya | 82 | 0.2% |
| Korea | 110 | 0.3% |
| Latin America | 278 | 0.7% |
| Mexico | 5 | 0.0% |
| Northern Europe | 48 | 0.1% |
| Oceania | 4 | 0.0% |
| Pakistan | 228 | 0.6% |
| Panama | 2 | 0.0% |
| Philippines | 51 | 0.1% |
| Russia | 30 | 0.1% |
| South America | 37 | 0.1% |
| South Central Asia | 459 | 1.1% |
| South Eastern Asia | 57 | 0.1% |
| Southern Europe | 210 | 0.5% |
| Spain | 28 | 0.1% |
| Vietnam | 6 | 0.0% |
| Western Asia | 15 | 0.0% | View All 42 Rows |
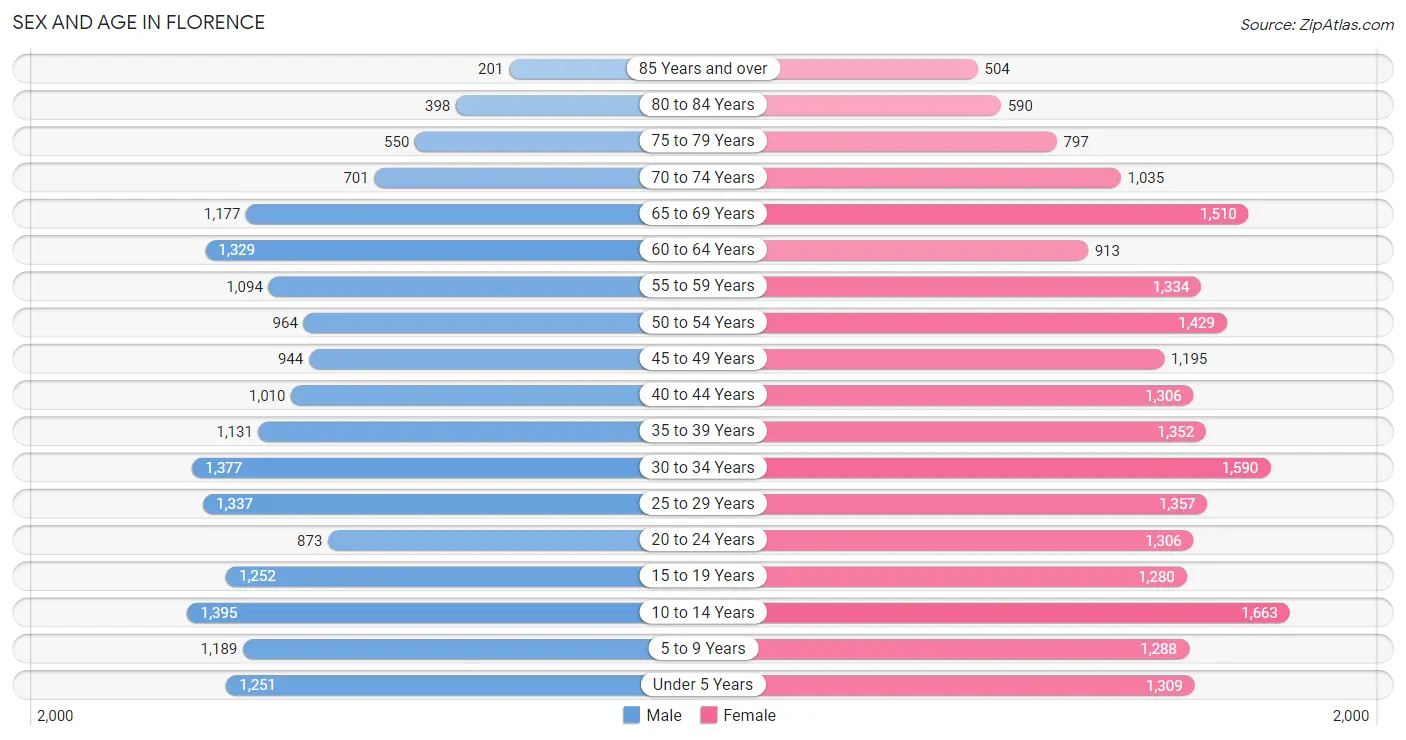
Sex and Age in Florence
Sex and Age in Florence
The most populous age groups in Florence are 10 to 14 Years (1,395 | 7.7%) for men and 10 to 14 Years (1,663 | 7.6%) for women.
| Age Bracket | Male | Female |
| Under 5 Years | 1,251 (6.9%) | 1,309 (6.0%) |
| 5 to 9 Years | 1,189 (6.5%) | 1,288 (5.9%) |
| 10 to 14 Years | 1,395 (7.7%) | 1,663 (7.6%) |
| 15 to 19 Years | 1,252 (6.9%) | 1,280 (5.9%) |
| 20 to 24 Years | 873 (4.8%) | 1,306 (6.0%) |
| 25 to 29 Years | 1,337 (7.4%) | 1,357 (6.2%) |
| 30 to 34 Years | 1,377 (7.6%) | 1,590 (7.3%) |
| 35 to 39 Years | 1,131 (6.2%) | 1,352 (6.2%) |
| 40 to 44 Years | 1,010 (5.6%) | 1,306 (6.0%) |
| 45 to 49 Years | 944 (5.2%) | 1,195 (5.5%) |
| 50 to 54 Years | 964 (5.3%) | 1,429 (6.6%) |
| 55 to 59 Years | 1,094 (6.0%) | 1,334 (6.1%) |
| 60 to 64 Years | 1,329 (7.3%) | 913 (4.2%) |
| 65 to 69 Years | 1,177 (6.5%) | 1,510 (6.9%) |
| 70 to 74 Years | 701 (3.9%) | 1,035 (4.8%) |
| 75 to 79 Years | 550 (3.0%) | 797 (3.7%) |
| 80 to 84 Years | 398 (2.2%) | 590 (2.7%) |
| 85 Years and over | 201 (1.1%) | 504 (2.3%) |
| Total | 18,173 (100.0%) | 21,758 (100.0%) |
Families and Households in Florence
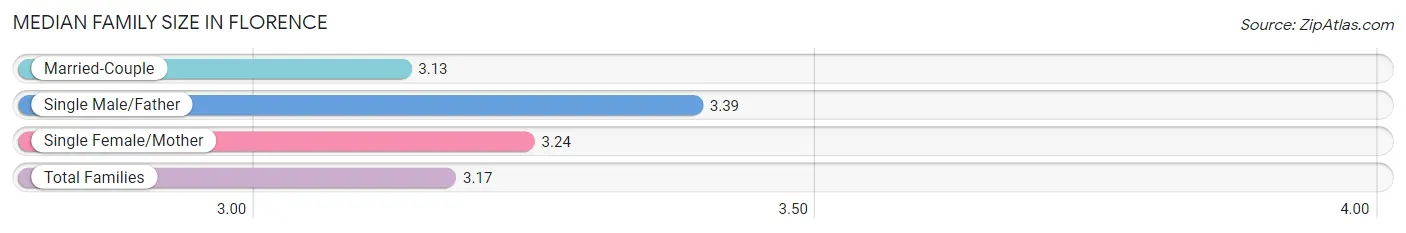
Median Family Size in Florence
The median family size in Florence is 3.17 persons per family, with single male/father families (559 | 5.7%) accounting for the largest median family size of 3.39 persons per family. On the other hand, married-couple families (6,579 | 66.5%) represent the smallest median family size with 3.13 persons per family.
| Family Type | # Families | Family Size |
| Married-Couple | 6,579 (66.5%) | 3.13 |
| Single Male/Father | 559 (5.7%) | 3.39 |
| Single Female/Mother | 2,753 (27.8%) | 3.24 |
| Total Families | 9,891 (100.0%) | 3.17 |
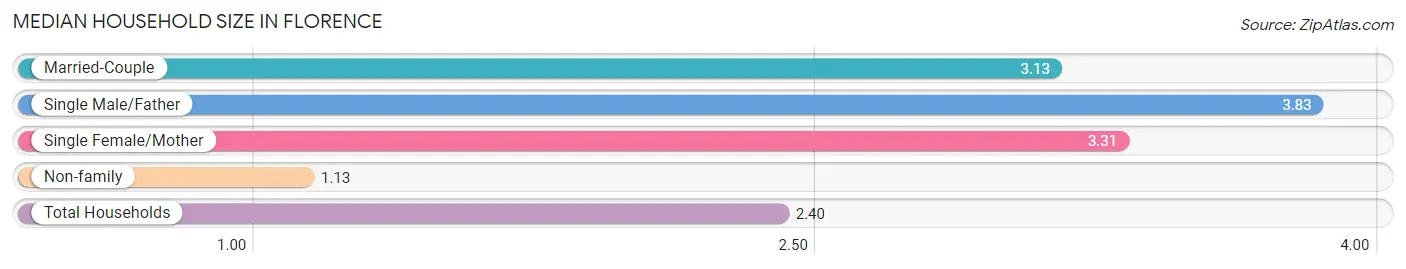
Median Household Size in Florence
The median household size in Florence is 2.40 persons per household, with single male/father households (559 | 3.4%) accounting for the largest median household size of 3.83 persons per household. non-family households (6,431 | 39.4%) represent the smallest median household size with 1.13 persons per household.
| Household Type | # Households | Household Size |
| Married-Couple | 6,579 (40.3%) | 3.13 |
| Single Male/Father | 559 (3.4%) | 3.83 |
| Single Female/Mother | 2,753 (16.9%) | 3.31 |
| Non-family | 6,431 (39.4%) | 1.13 |
| Total Households | 16,322 (100.0%) | 2.40 |
Household Size by Marriage Status in Florence
Out of a total of 16,322 households in Florence, 9,891 (60.6%) are family households, while 6,431 (39.4%) are nonfamily households. The most numerous type of family households are 2-person households, comprising 4,685, and the most common type of nonfamily households are 1-person households, comprising 5,850.
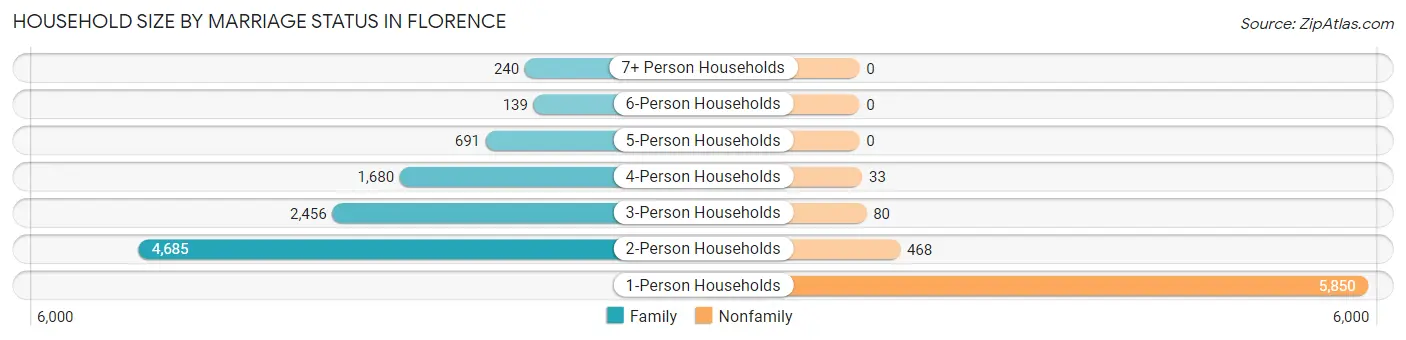
| Household Size | Family Households | Nonfamily Households |
| 1-Person Households | - | 5,850 (35.8%) |
| 2-Person Households | 4,685 (28.7%) | 468 (2.9%) |
| 3-Person Households | 2,456 (15.0%) | 80 (0.5%) |
| 4-Person Households | 1,680 (10.3%) | 33 (0.2%) |
| 5-Person Households | 691 (4.2%) | 0 (0.0%) |
| 6-Person Households | 139 (0.9%) | 0 (0.0%) |
| 7+ Person Households | 240 (1.5%) | 0 (0.0%) |
| Total | 9,891 (60.6%) | 6,431 (39.4%) |
Female Fertility in Florence
Fertility by Age in Florence
Average fertility rate in Florence is 62.0 births per 1,000 women. Women in the age bracket of 20 to 34 years have the highest fertility rate with 128.0 births per 1,000 women. Women in the age bracket of 20 to 34 years acount for 92.7% of all women with births.
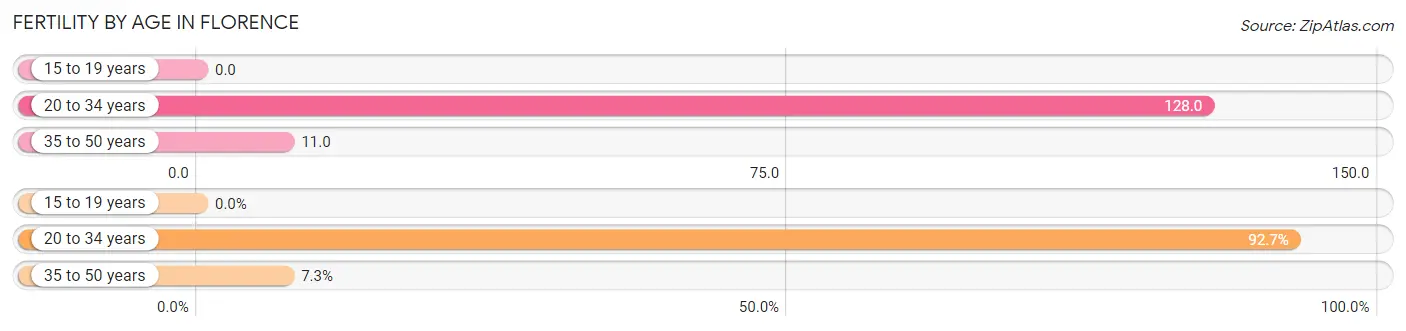
| Age Bracket | Women with Births | Births / 1,000 Women |
| 15 to 19 years | 0 (0.0%) | 0.0 |
| 20 to 34 years | 545 (92.7%) | 128.0 |
| 35 to 50 years | 43 (7.3%) | 11.0 |
| Total | 588 (100.0%) | 62.0 |
Fertility by Age by Marriage Status in Florence
41.7% of women with births (588) in Florence are married. The highest percentage of unmarried women with births falls into 20 to 34 years age bracket with 60.0% of them unmarried at the time of birth, while the lowest percentage of unmarried women with births belong to 35 to 50 years age bracket with 37.2% of them unmarried.
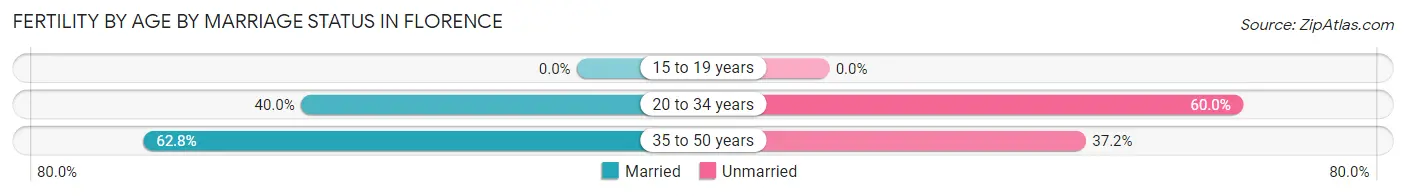
| Age Bracket | Married | Unmarried |
| 15 to 19 years | 0 (0.0%) | 0 (0.0%) |
| 20 to 34 years | 218 (40.0%) | 327 (60.0%) |
| 35 to 50 years | 27 (62.8%) | 16 (37.2%) |
| Total | 245 (41.7%) | 343 (58.3%) |
Fertility by Education in Florence
Average fertility rate in Florence is 62.0 births per 1,000 women. Women with the education attainment of bachelor's degree have the highest fertility rate of 94.0 births per 1,000 women, while women with the education attainment of less than high school have the lowest fertility at 17.0 births per 1,000 women. Women with the education attainment of college or associate's degree represent 43.4% of all women with births.
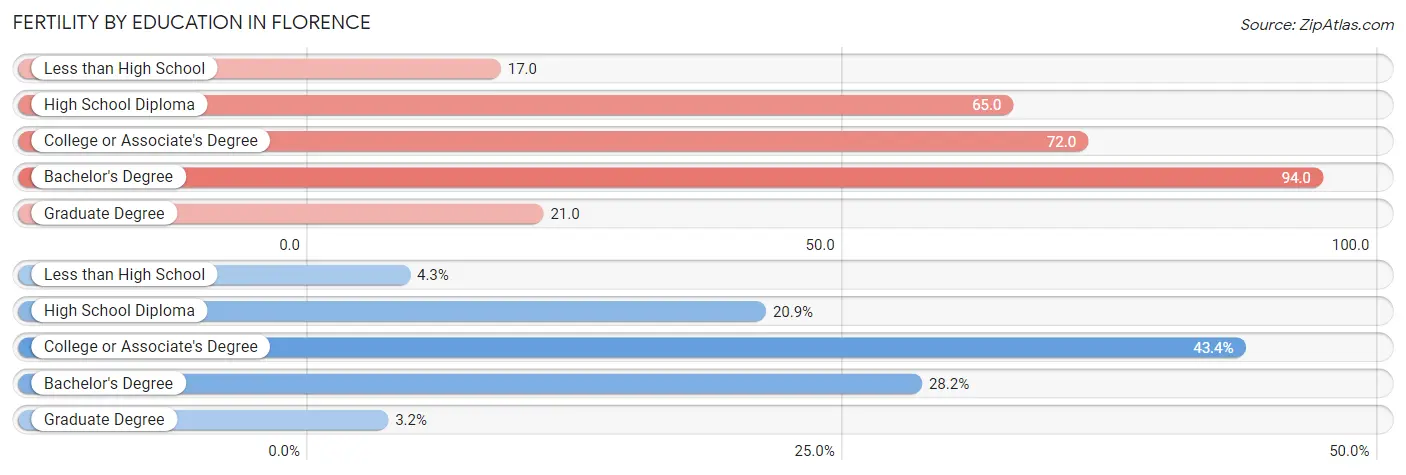
| Educational Attainment | Women with Births | Births / 1,000 Women |
| Less than High School | 25 (4.3%) | 17.0 |
| High School Diploma | 123 (20.9%) | 65.0 |
| College or Associate's Degree | 255 (43.4%) | 72.0 |
| Bachelor's Degree | 166 (28.2%) | 94.0 |
| Graduate Degree | 19 (3.2%) | 21.0 |
| Total | 588 (100.0%) | 62.0 |
Fertility by Education by Marriage Status in Florence
58.3% of women with births in Florence are unmarried. Women with the educational attainment of graduate degree are most likely to be married with 100.0% of them married at childbirth, while women with the educational attainment of college or associate's degree are least likely to be married with 94.5% of them unmarried at childbirth.
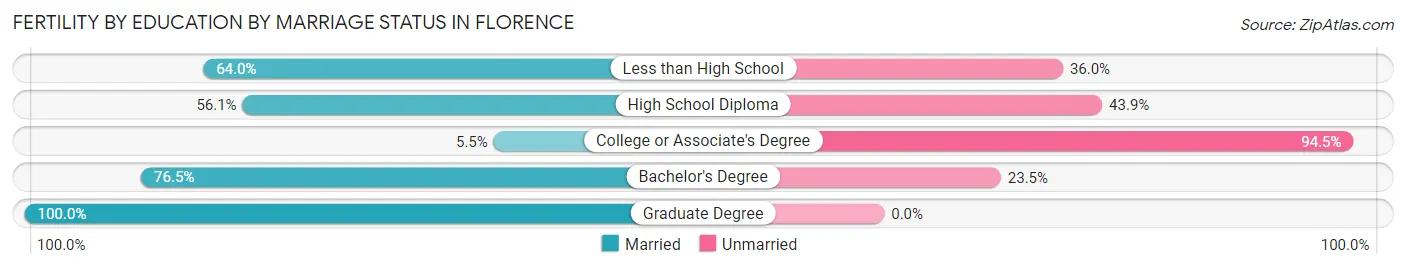
| Educational Attainment | Married | Unmarried |
| Less than High School | 16 (64.0%) | 9 (36.0%) |
| High School Diploma | 69 (56.1%) | 54 (43.9%) |
| College or Associate's Degree | 14 (5.5%) | 241 (94.5%) |
| Bachelor's Degree | 127 (76.5%) | 39 (23.5%) |
| Graduate Degree | 19 (100.0%) | 0 (0.0%) |
| Total | 245 (41.7%) | 343 (58.3%) |
Employment Characteristics in Florence
Employment by Class of Employer in Florence
Among the 17,812 employed individuals in Florence, private company employees (11,467 | 64.4%), not-for-profit organizations (1,850 | 10.4%), and local government employees (1,423 | 8.0%) make up the most common classes of employment.
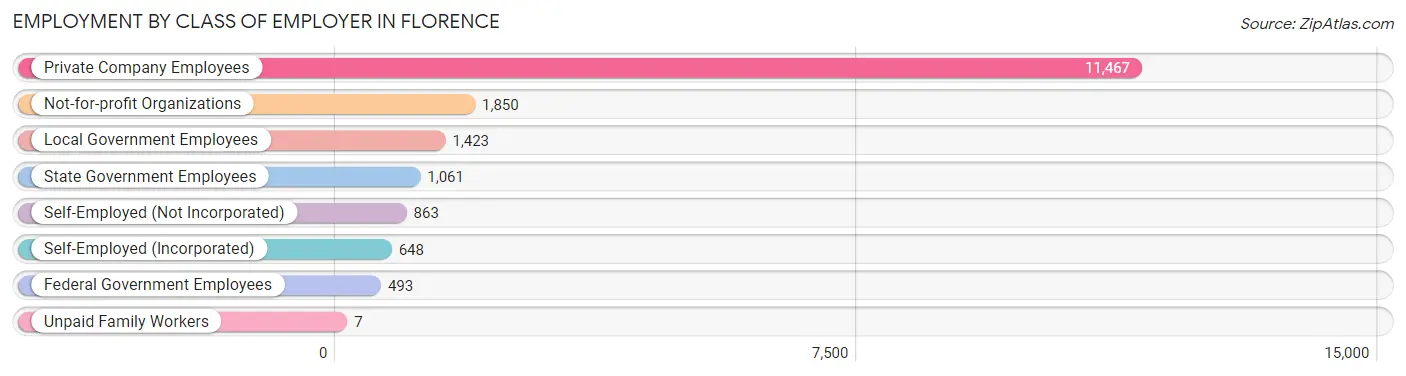
| Employer Class | # Employees | % Employees |
| Private Company Employees | 11,467 | 64.4% |
| Self-Employed (Incorporated) | 648 | 3.6% |
| Self-Employed (Not Incorporated) | 863 | 4.9% |
| Not-for-profit Organizations | 1,850 | 10.4% |
| Local Government Employees | 1,423 | 8.0% |
| State Government Employees | 1,061 | 6.0% |
| Federal Government Employees | 493 | 2.8% |
| Unpaid Family Workers | 7 | 0.0% |
| Total | 17,812 | 100.0% |
Employment Status by Age in Florence
According to the labor force statistics for Florence, out of the total population over 16 years of age (31,377), 60.5% or 18,983 individuals are in the labor force, with 4.8% or 911 of them unemployed. The age group with the highest labor force participation rate is 35 to 44 years, with 87.2% or 4,185 individuals in the labor force. Within the labor force, the 20 to 24 years age range has the highest percentage of unemployed individuals, with 12.7% or 202 of them being unemployed.
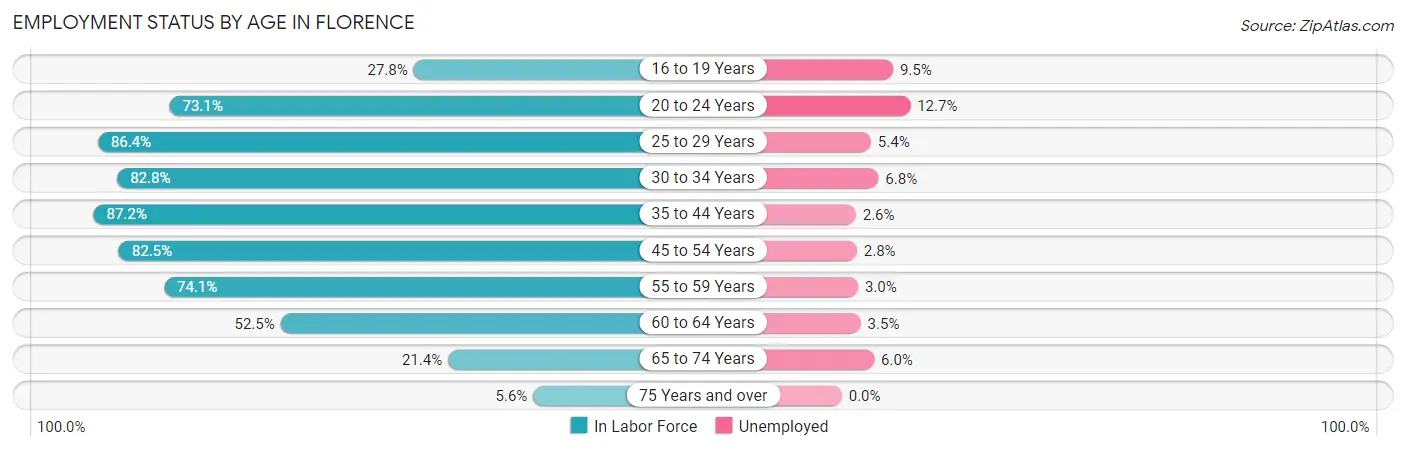
| Age Bracket | In Labor Force | Unemployed |
| 16 to 19 Years | 576 (27.8%) | 55 (9.5%) |
| 20 to 24 Years | 1,593 (73.1%) | 202 (12.7%) |
| 25 to 29 Years | 2,328 (86.4%) | 126 (5.4%) |
| 30 to 34 Years | 2,457 (82.8%) | 167 (6.8%) |
| 35 to 44 Years | 4,185 (87.2%) | 109 (2.6%) |
| 45 to 54 Years | 3,739 (82.5%) | 105 (2.8%) |
| 55 to 59 Years | 1,799 (74.1%) | 54 (3.0%) |
| 60 to 64 Years | 1,177 (52.5%) | 41 (3.5%) |
| 65 to 74 Years | 947 (21.4%) | 57 (6.0%) |
| 75 Years and over | 170 (5.6%) | 0 (0.0%) |
| Total | 18,983 (60.5%) | 911 (4.8%) |
Employment Status by Educational Attainment in Florence
According to labor force statistics for Florence, 79.8% of individuals (15,690) out of the total population between 25 and 64 years of age (19,662) are in the labor force, with 3.8% or 596 of them being unemployed. The group with the highest labor force participation rate are those with the educational attainment of bachelor's degree or higher, with 88.2% or 5,744 individuals in the labor force. Within the labor force, individuals with high school diploma education have the highest percentage of unemployment, with 7.9% or 258 of them being unemployed.
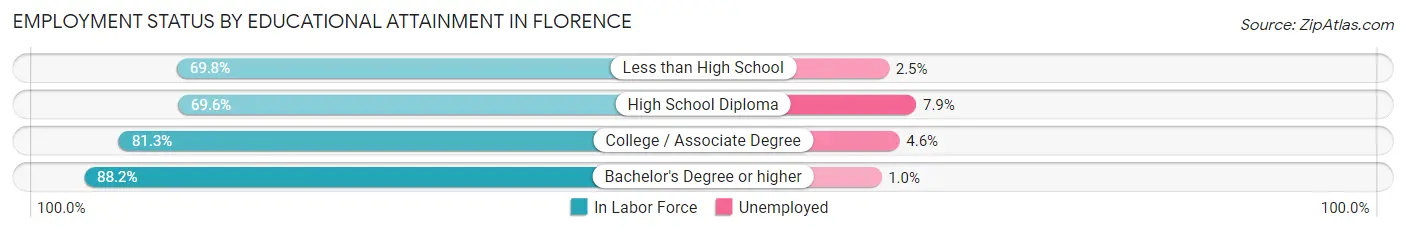
| Educational Attainment | In Labor Force | Unemployed |
| Less than High School | 1,228 (69.8%) | 44 (2.5%) |
| High School Diploma | 3,266 (69.6%) | 371 (7.9%) |
| College / Associate Degree | 5,445 (81.3%) | 308 (4.6%) |
| Bachelor's Degree or higher | 5,744 (88.2%) | 65 (1.0%) |
| Total | 15,690 (79.8%) | 747 (3.8%) |
Employment Occupations by Sex in Florence
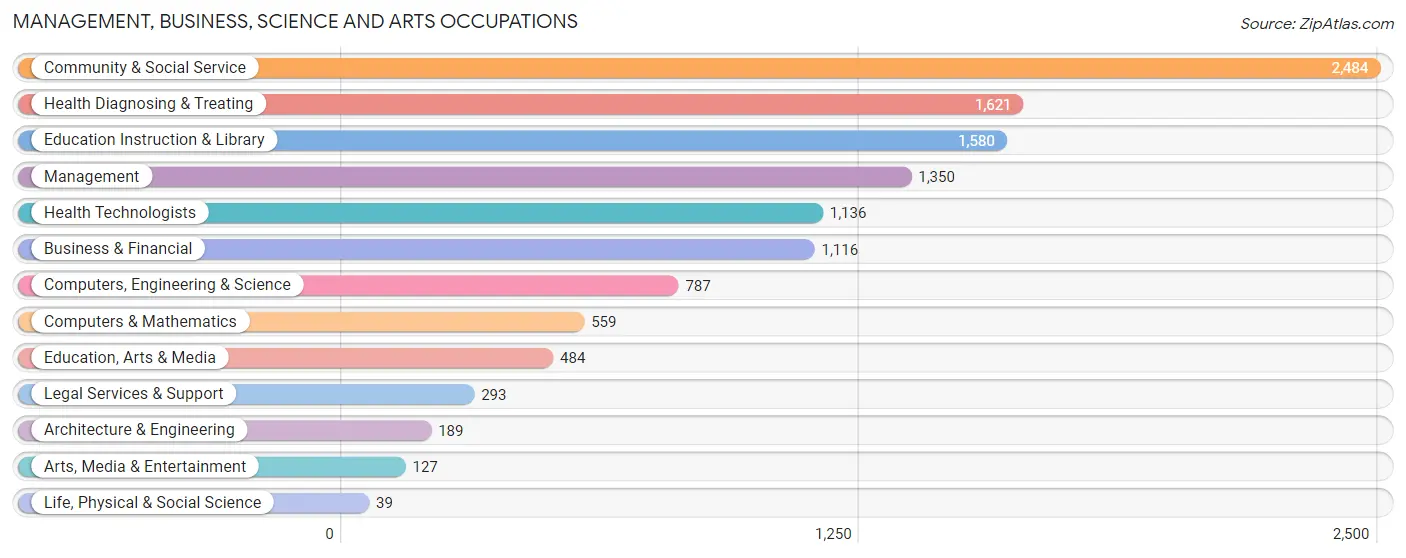
Management, Business, Science and Arts Occupations
The most common Management, Business, Science and Arts occupations in Florence are Community & Social Service (2,484 | 13.9%), Health Diagnosing & Treating (1,621 | 9.1%), Education Instruction & Library (1,580 | 8.9%), Management (1,350 | 7.6%), and Health Technologists (1,136 | 6.4%).
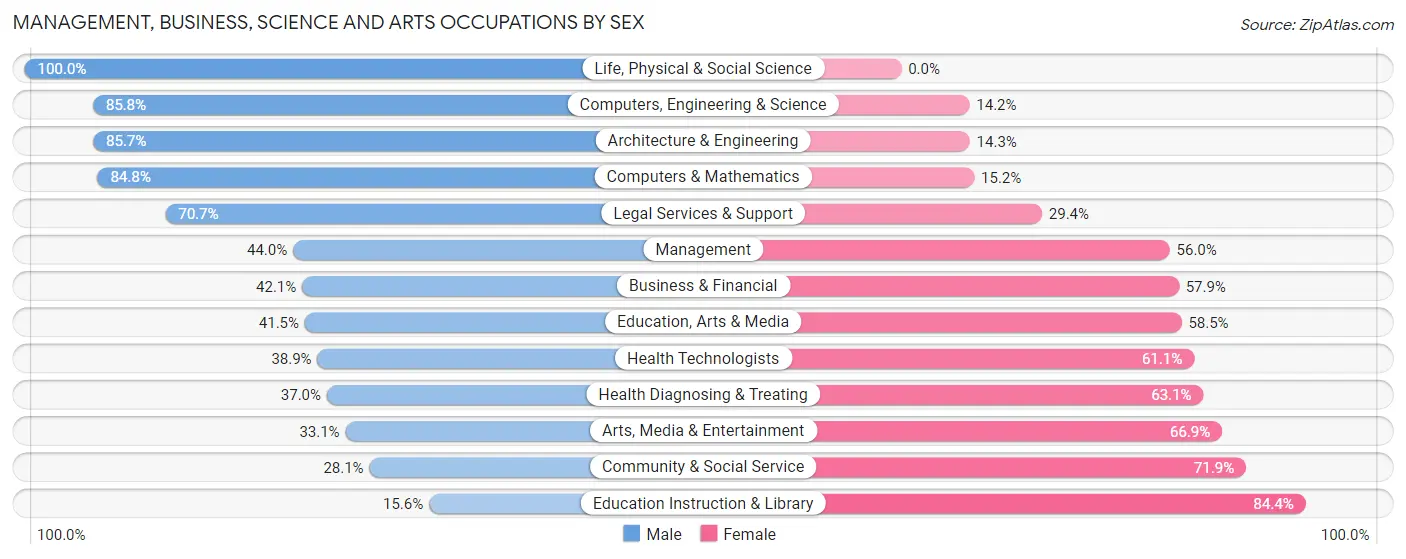
Management, Business, Science and Arts Occupations by Sex
Within the Management, Business, Science and Arts occupations in Florence, the most male-oriented occupations are Life, Physical & Social Science (100.0%), Computers, Engineering & Science (85.8%), and Architecture & Engineering (85.7%), while the most female-oriented occupations are Education Instruction & Library (84.4%), Community & Social Service (71.9%), and Arts, Media & Entertainment (66.9%).
| Occupation | Male | Female |
| Management | 594 (44.0%) | 756 (56.0%) |
| Business & Financial | 470 (42.1%) | 646 (57.9%) |
| Computers, Engineering & Science | 675 (85.8%) | 112 (14.2%) |
| Computers & Mathematics | 474 (84.8%) | 85 (15.2%) |
| Architecture & Engineering | 162 (85.7%) | 27 (14.3%) |
| Life, Physical & Social Science | 39 (100.0%) | 0 (0.0%) |
| Community & Social Service | 697 (28.1%) | 1,787 (71.9%) |
| Education, Arts & Media | 201 (41.5%) | 283 (58.5%) |
| Legal Services & Support | 207 (70.7%) | 86 (29.3%) |
| Education Instruction & Library | 247 (15.6%) | 1,333 (84.4%) |
| Arts, Media & Entertainment | 42 (33.1%) | 85 (66.9%) |
| Health Diagnosing & Treating | 599 (36.9%) | 1,022 (63.0%) |
| Health Technologists | 442 (38.9%) | 694 (61.1%) |
| Total (Category) | 3,035 (41.2%) | 4,323 (58.8%) |
| Total (Overall) | 8,404 (47.1%) | 9,421 (52.8%) |
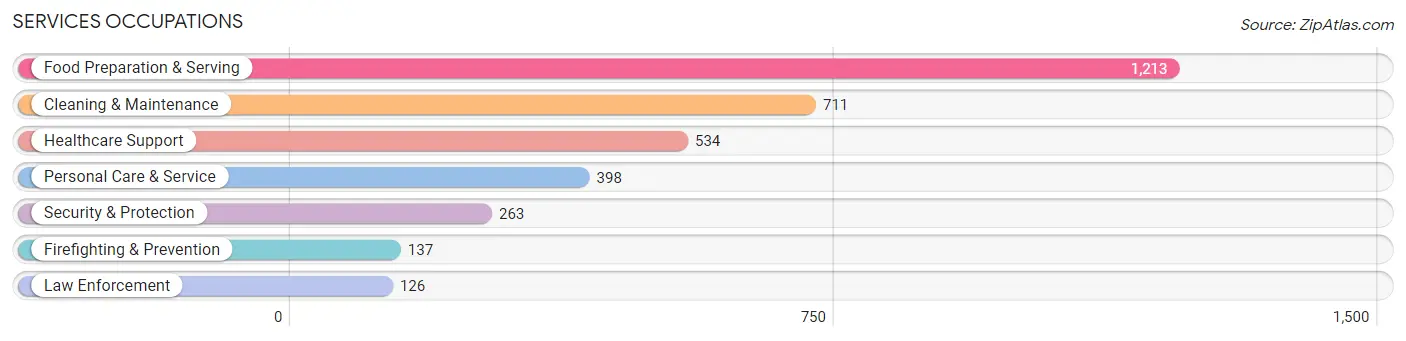
Services Occupations
The most common Services occupations in Florence are Food Preparation & Serving (1,213 | 6.8%), Cleaning & Maintenance (711 | 4.0%), Healthcare Support (534 | 3.0%), Personal Care & Service (398 | 2.2%), and Security & Protection (263 | 1.5%).
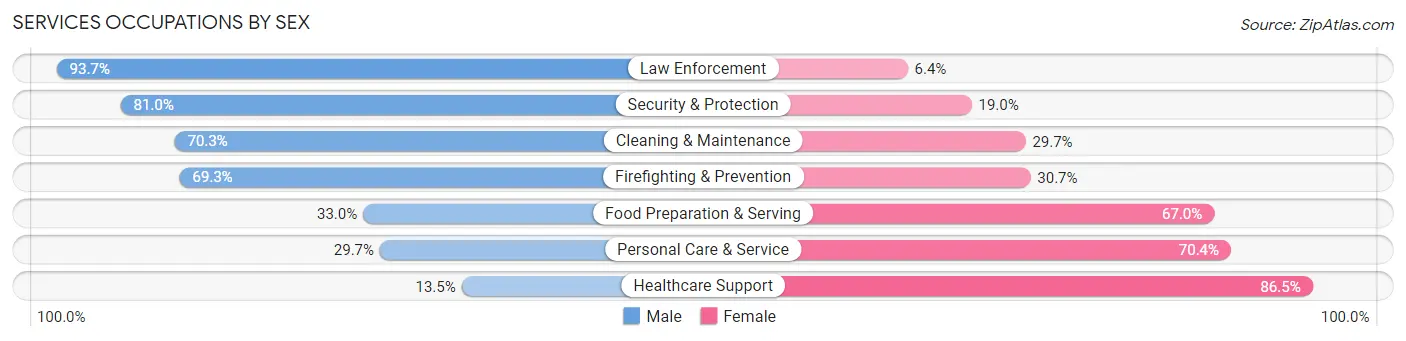
Services Occupations by Sex
Within the Services occupations in Florence, the most male-oriented occupations are Law Enforcement (93.6%), Security & Protection (81.0%), and Cleaning & Maintenance (70.3%), while the most female-oriented occupations are Healthcare Support (86.5%), Personal Care & Service (70.4%), and Food Preparation & Serving (67.0%).
| Occupation | Male | Female |
| Healthcare Support | 72 (13.5%) | 462 (86.5%) |
| Security & Protection | 213 (81.0%) | 50 (19.0%) |
| Firefighting & Prevention | 95 (69.3%) | 42 (30.7%) |
| Law Enforcement | 118 (93.6%) | 8 (6.4%) |
| Food Preparation & Serving | 400 (33.0%) | 813 (67.0%) |
| Cleaning & Maintenance | 500 (70.3%) | 211 (29.7%) |
| Personal Care & Service | 118 (29.6%) | 280 (70.4%) |
| Total (Category) | 1,303 (41.8%) | 1,816 (58.2%) |
| Total (Overall) | 8,404 (47.1%) | 9,421 (52.8%) |
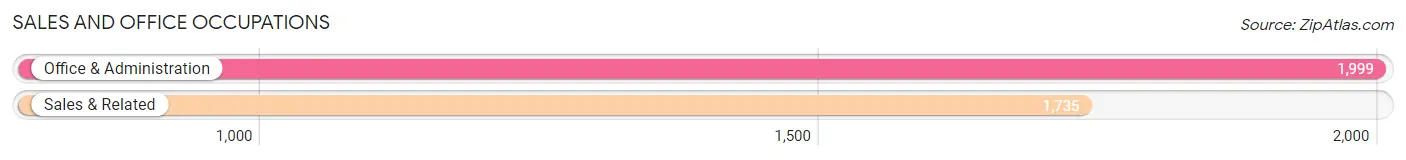
Sales and Office Occupations
The most common Sales and Office occupations in Florence are Office & Administration (1,999 | 11.2%), and Sales & Related (1,735 | 9.7%).
Sales and Office Occupations by Sex
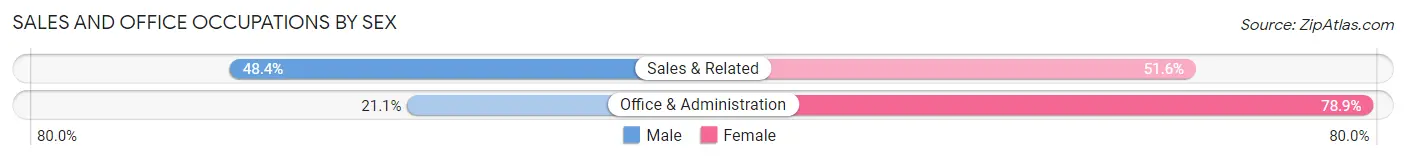
| Occupation | Male | Female |
| Sales & Related | 840 (48.4%) | 895 (51.6%) |
| Office & Administration | 422 (21.1%) | 1,577 (78.9%) |
| Total (Category) | 1,262 (33.8%) | 2,472 (66.2%) |
| Total (Overall) | 8,404 (47.1%) | 9,421 (52.8%) |
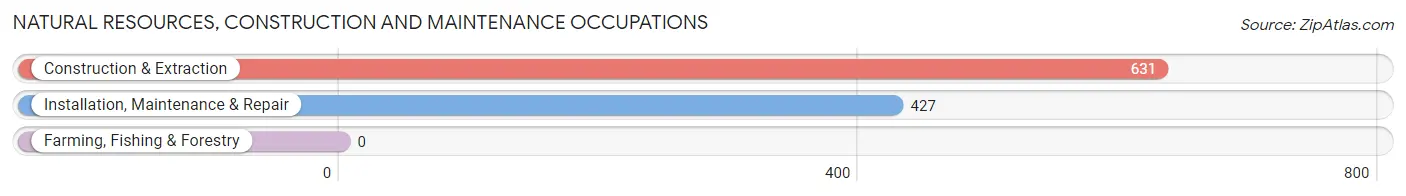
Natural Resources, Construction and Maintenance Occupations
The most common Natural Resources, Construction and Maintenance occupations in Florence are Construction & Extraction (631 | 3.5%), and Installation, Maintenance & Repair (427 | 2.4%).
Natural Resources, Construction and Maintenance Occupations by Sex
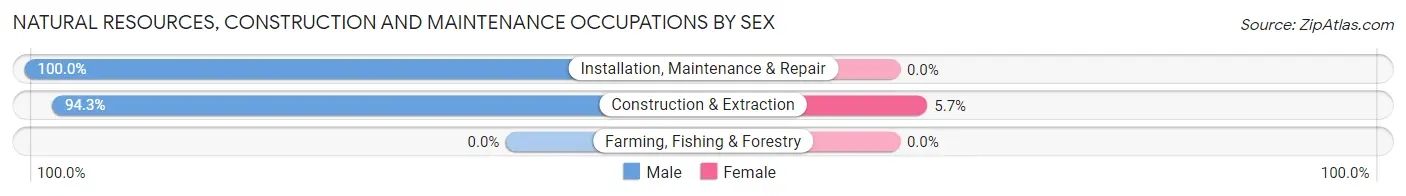
| Occupation | Male | Female |
| Farming, Fishing & Forestry | 0 (0.0%) | 0 (0.0%) |
| Construction & Extraction | 595 (94.3%) | 36 (5.7%) |
| Installation, Maintenance & Repair | 427 (100.0%) | 0 (0.0%) |
| Total (Category) | 1,022 (96.6%) | 36 (3.4%) |
| Total (Overall) | 8,404 (47.1%) | 9,421 (52.8%) |
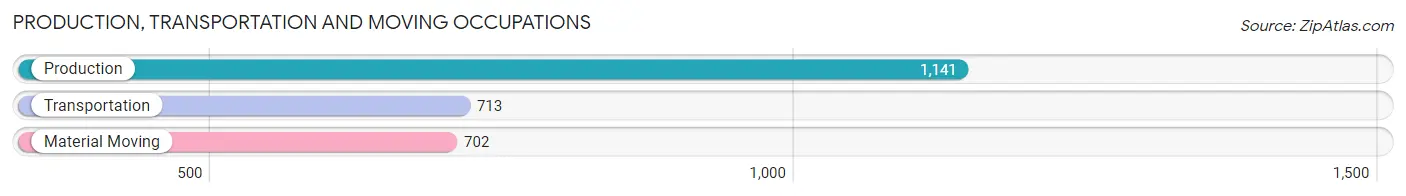
Production, Transportation and Moving Occupations
The most common Production, Transportation and Moving occupations in Florence are Production (1,141 | 6.4%), Transportation (713 | 4.0%), and Material Moving (702 | 3.9%).
Production, Transportation and Moving Occupations by Sex
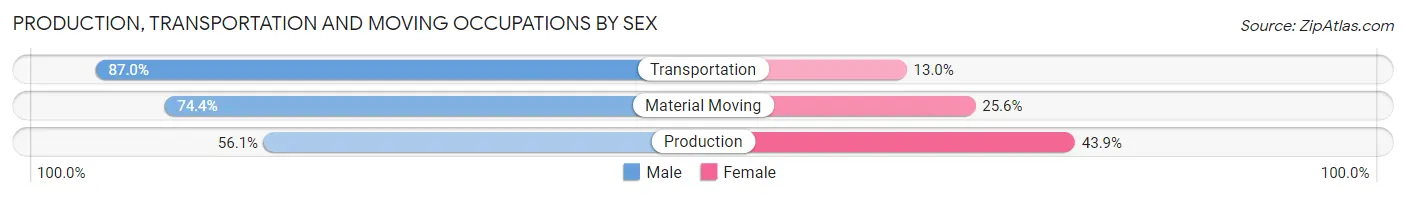
| Occupation | Male | Female |
| Production | 640 (56.1%) | 501 (43.9%) |
| Transportation | 620 (87.0%) | 93 (13.0%) |
| Material Moving | 522 (74.4%) | 180 (25.6%) |
| Total (Category) | 1,782 (69.7%) | 774 (30.3%) |
| Total (Overall) | 8,404 (47.1%) | 9,421 (52.8%) |
Employment Industries by Sex in Florence
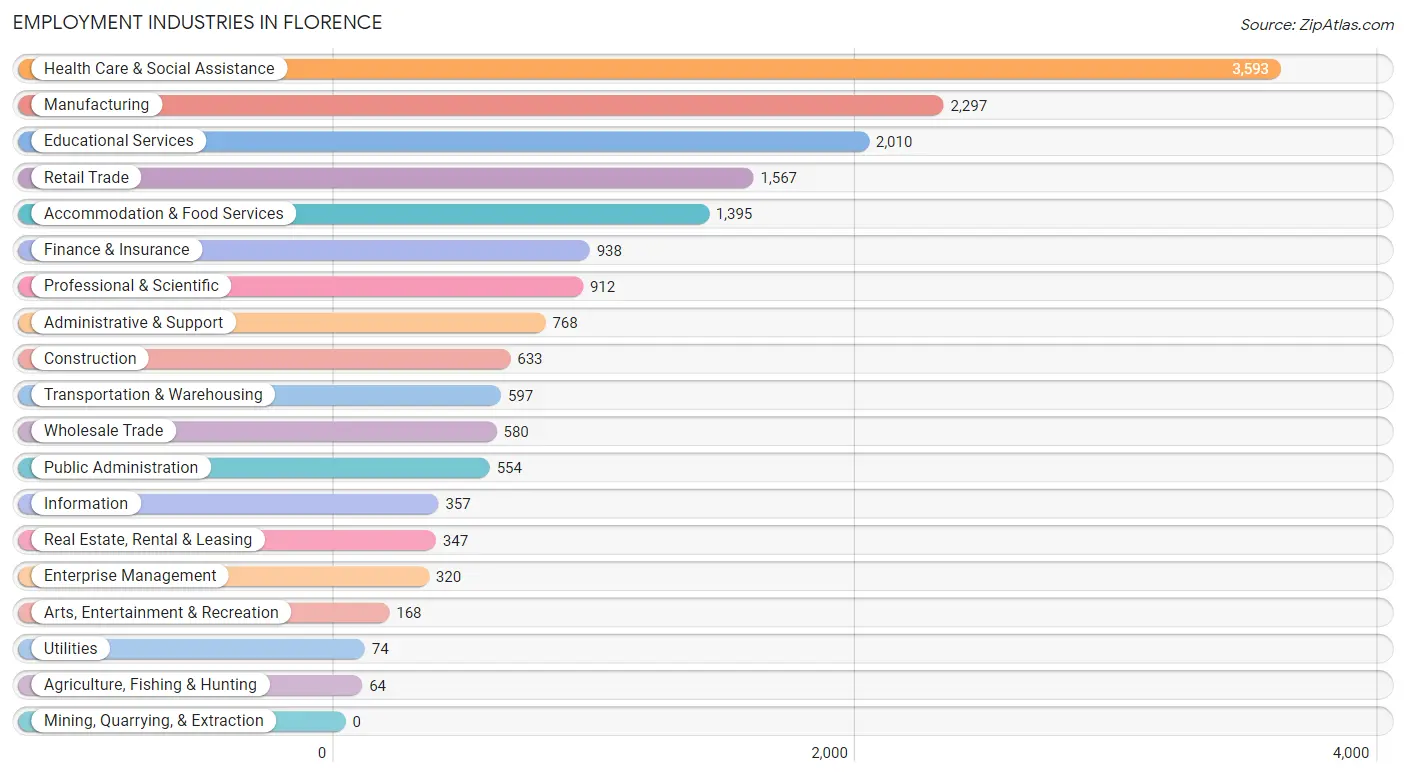
Employment Industries in Florence
The major employment industries in Florence include Health Care & Social Assistance (3,593 | 20.2%), Manufacturing (2,297 | 12.9%), Educational Services (2,010 | 11.3%), Retail Trade (1,567 | 8.8%), and Accommodation & Food Services (1,395 | 7.8%).
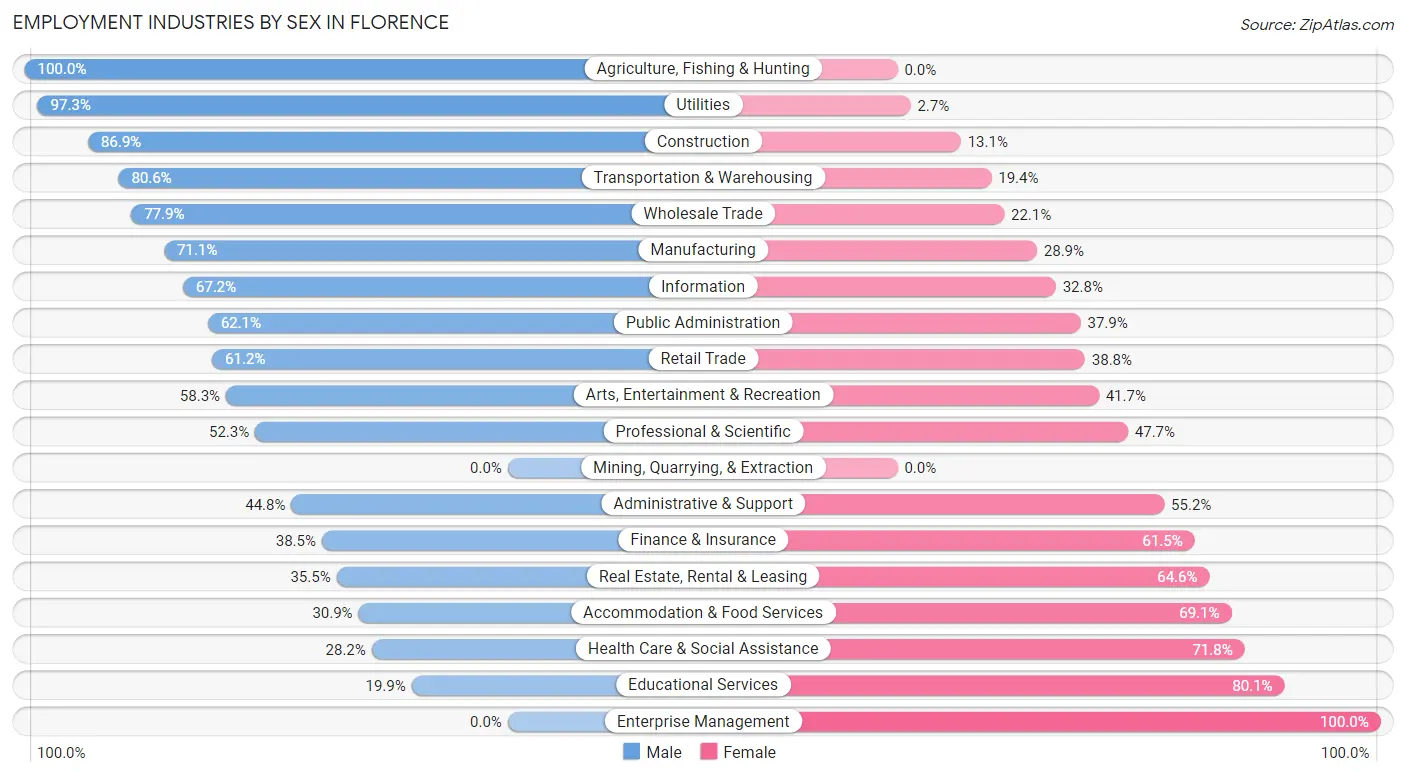
Employment Industries by Sex in Florence
The Florence industries that see more men than women are Agriculture, Fishing & Hunting (100.0%), Utilities (97.3%), and Construction (86.9%), whereas the industries that tend to have a higher number of women are Enterprise Management (100.0%), Educational Services (80.1%), and Health Care & Social Assistance (71.8%).
| Industry | Male | Female |
| Agriculture, Fishing & Hunting | 64 (100.0%) | 0 (0.0%) |
| Mining, Quarrying, & Extraction | 0 (0.0%) | 0 (0.0%) |
| Construction | 550 (86.9%) | 83 (13.1%) |
| Manufacturing | 1,634 (71.1%) | 663 (28.9%) |
| Wholesale Trade | 452 (77.9%) | 128 (22.1%) |
| Retail Trade | 959 (61.2%) | 608 (38.8%) |
| Transportation & Warehousing | 481 (80.6%) | 116 (19.4%) |
| Utilities | 72 (97.3%) | 2 (2.7%) |
| Information | 240 (67.2%) | 117 (32.8%) |
| Finance & Insurance | 361 (38.5%) | 577 (61.5%) |
| Real Estate, Rental & Leasing | 123 (35.4%) | 224 (64.5%) |
| Professional & Scientific | 477 (52.3%) | 435 (47.7%) |
| Enterprise Management | 0 (0.0%) | 320 (100.0%) |
| Administrative & Support | 344 (44.8%) | 424 (55.2%) |
| Educational Services | 400 (19.9%) | 1,610 (80.1%) |
| Health Care & Social Assistance | 1,012 (28.2%) | 2,581 (71.8%) |
| Arts, Entertainment & Recreation | 98 (58.3%) | 70 (41.7%) |
| Accommodation & Food Services | 431 (30.9%) | 964 (69.1%) |
| Public Administration | 344 (62.1%) | 210 (37.9%) |
| Total | 8,404 (47.1%) | 9,421 (52.8%) |
Education in Florence
School Enrollment in Florence
The most common levels of schooling among the 9,542 students in Florence are middle school (2,524 | 26.5%), high school (2,146 | 22.5%), and elementary school (1,782 | 18.7%).
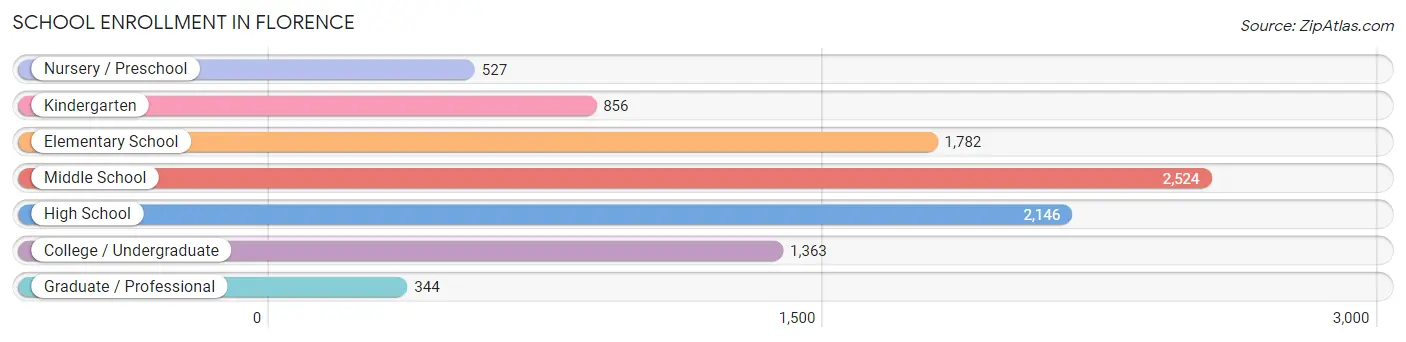
| School Level | # Students | % Students |
| Nursery / Preschool | 527 | 5.5% |
| Kindergarten | 856 | 9.0% |
| Elementary School | 1,782 | 18.7% |
| Middle School | 2,524 | 26.5% |
| High School | 2,146 | 22.5% |
| College / Undergraduate | 1,363 | 14.3% |
| Graduate / Professional | 344 | 3.6% |
| Total | 9,542 | 100.0% |
School Enrollment by Age by Funding Source in Florence
Out of a total of 9,542 students who are enrolled in schools in Florence, 1,498 (15.7%) attend a private institution, while the remaining 8,044 (84.3%) are enrolled in public schools. The age group of 3 to 4 year olds has the highest likelihood of being enrolled in private schools, with 249 (41.2% in the age bracket) enrolled. Conversely, the age group of 18 to 19 year olds has the lowest likelihood of being enrolled in a private school, with 605 (97.0% in the age bracket) attending a public institution.
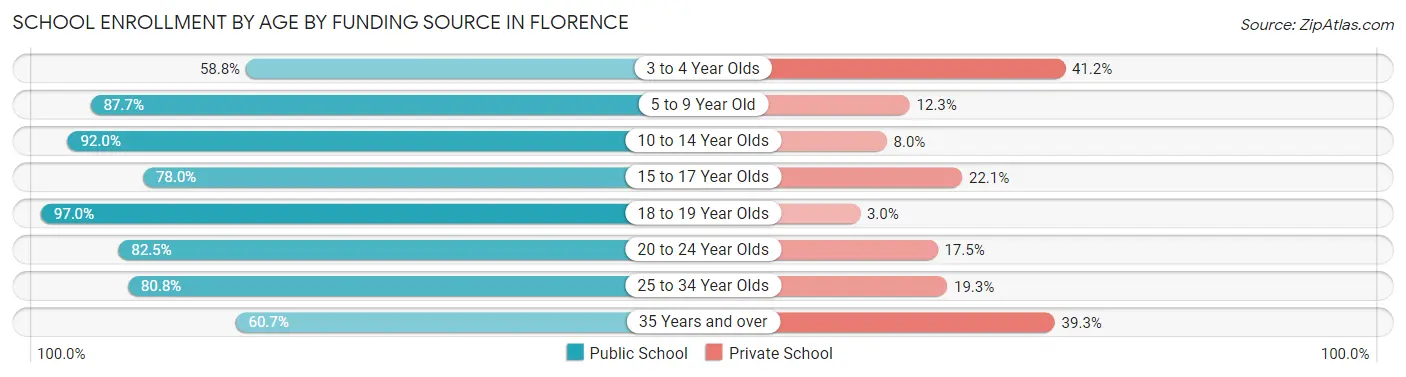
| Age Bracket | Public School | Private School |
| 3 to 4 Year Olds | 355 (58.8%) | 249 (41.2%) |
| 5 to 9 Year Old | 2,000 (87.7%) | 280 (12.3%) |
| 10 to 14 Year Olds | 2,774 (92.0%) | 241 (8.0%) |
| 15 to 17 Year Olds | 1,255 (77.9%) | 355 (22.1%) |
| 18 to 19 Year Olds | 605 (97.0%) | 19 (3.0%) |
| 20 to 24 Year Olds | 496 (82.5%) | 105 (17.5%) |
| 25 to 34 Year Olds | 260 (80.7%) | 62 (19.3%) |
| 35 Years and over | 295 (60.7%) | 191 (39.3%) |
| Total | 8,044 (84.3%) | 1,498 (15.7%) |
Educational Attainment by Field of Study in Florence
Business (1,914 | 21.3%), education (1,501 | 16.7%), science & technology (954 | 10.6%), bio, nature & agricultural (784 | 8.7%), and social sciences (603 | 6.7%) are the most common fields of study among 8,985 individuals in Florence who have obtained a bachelor's degree or higher.
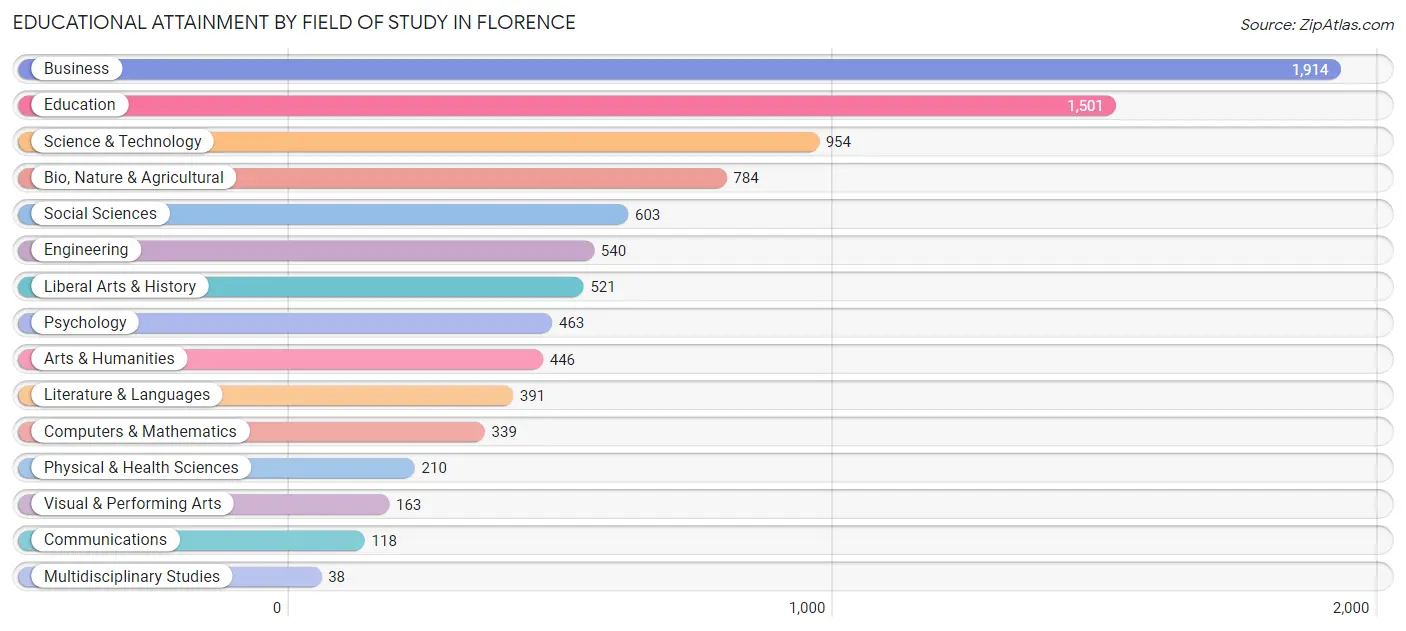
| Field of Study | # Graduates | % Graduates |
| Computers & Mathematics | 339 | 3.8% |
| Bio, Nature & Agricultural | 784 | 8.7% |
| Physical & Health Sciences | 210 | 2.3% |
| Psychology | 463 | 5.1% |
| Social Sciences | 603 | 6.7% |
| Engineering | 540 | 6.0% |
| Multidisciplinary Studies | 38 | 0.4% |
| Science & Technology | 954 | 10.6% |
| Business | 1,914 | 21.3% |
| Education | 1,501 | 16.7% |
| Literature & Languages | 391 | 4.3% |
| Liberal Arts & History | 521 | 5.8% |
| Visual & Performing Arts | 163 | 1.8% |
| Communications | 118 | 1.3% |
| Arts & Humanities | 446 | 5.0% |
| Total | 8,985 | 100.0% |
Transportation & Commute in Florence
Vehicle Availability by Sex in Florence
The most prevalent vehicle ownership categories in Florence are males with 2 vehicles (3,841, accounting for 45.5%) and females with 2 vehicles (3,795, making up 41.1%).
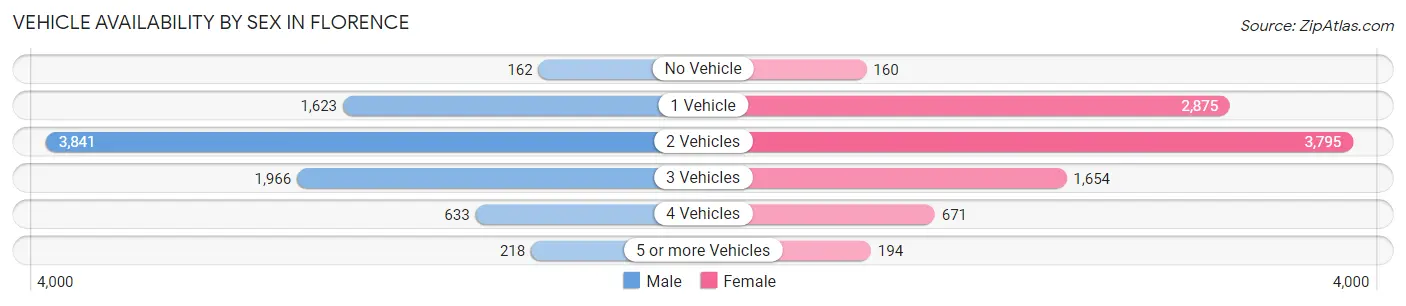
| Vehicles Available | Male | Female |
| No Vehicle | 162 (1.9%) | 160 (1.7%) |
| 1 Vehicle | 1,623 (19.2%) | 2,875 (30.7%) |
| 2 Vehicles | 3,841 (45.5%) | 3,795 (40.6%) |
| 3 Vehicles | 1,966 (23.3%) | 1,654 (17.7%) |
| 4 Vehicles | 633 (7.5%) | 671 (7.2%) |
| 5 or more Vehicles | 218 (2.6%) | 194 (2.1%) |
| Total | 8,443 (100.0%) | 9,349 (100.0%) |
Commute Time in Florence
The most frequently occuring commute durations in Florence are 15 to 19 minutes (4,345 commuters, 27.2%), 10 to 14 minutes (3,400 commuters, 21.3%), and 5 to 9 minutes (2,450 commuters, 15.3%).
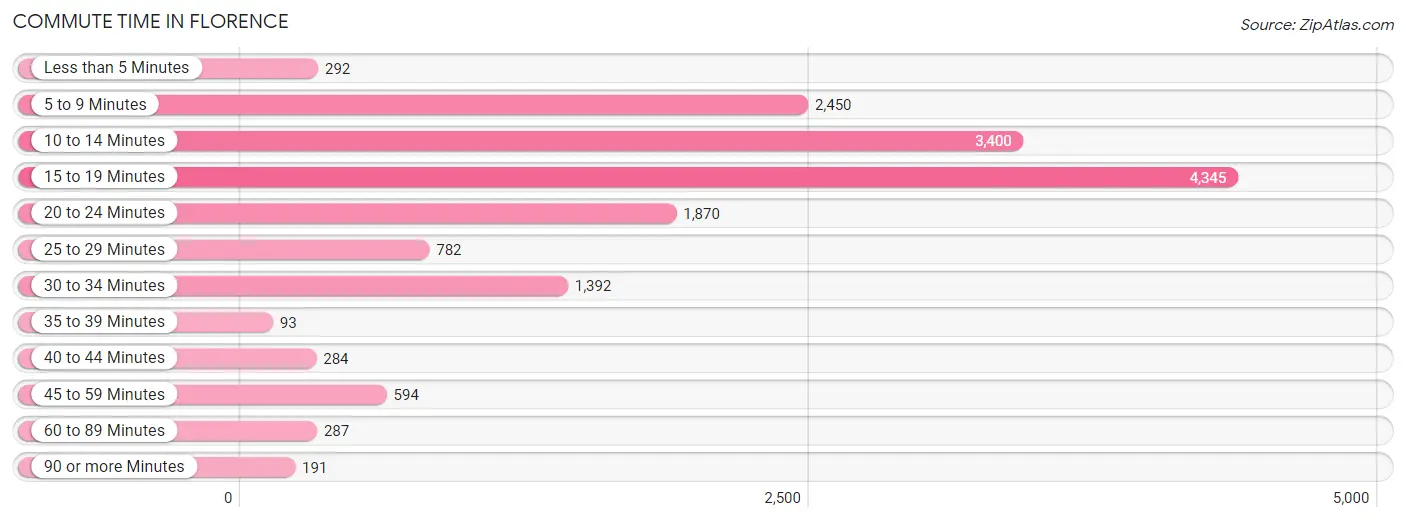
| Commute Time | # Commuters | % Commuters |
| Less than 5 Minutes | 292 | 1.8% |
| 5 to 9 Minutes | 2,450 | 15.3% |
| 10 to 14 Minutes | 3,400 | 21.3% |
| 15 to 19 Minutes | 4,345 | 27.2% |
| 20 to 24 Minutes | 1,870 | 11.7% |
| 25 to 29 Minutes | 782 | 4.9% |
| 30 to 34 Minutes | 1,392 | 8.7% |
| 35 to 39 Minutes | 93 | 0.6% |
| 40 to 44 Minutes | 284 | 1.8% |
| 45 to 59 Minutes | 594 | 3.7% |
| 60 to 89 Minutes | 287 | 1.8% |
| 90 or more Minutes | 191 | 1.2% |
Commute Time by Sex in Florence
The most common commute times in Florence are 15 to 19 minutes (2,042 commuters, 26.5%) for males and 15 to 19 minutes (2,303 commuters, 27.9%) for females.
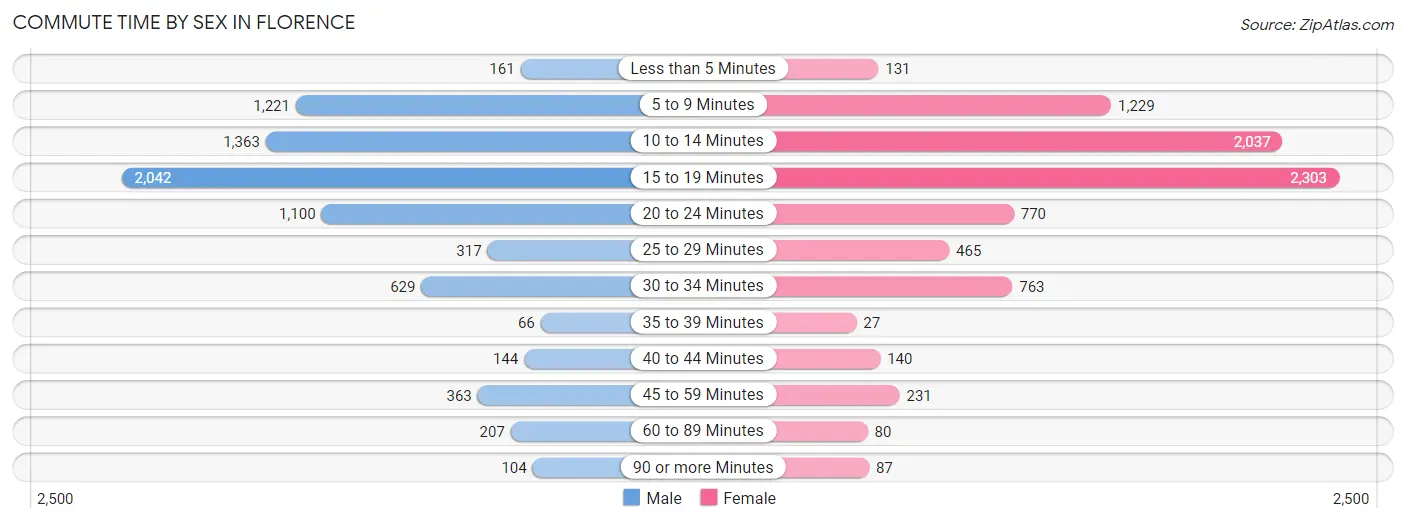
| Commute Time | Male | Female |
| Less than 5 Minutes | 161 (2.1%) | 131 (1.6%) |
| 5 to 9 Minutes | 1,221 (15.8%) | 1,229 (14.9%) |
| 10 to 14 Minutes | 1,363 (17.7%) | 2,037 (24.6%) |
| 15 to 19 Minutes | 2,042 (26.5%) | 2,303 (27.9%) |
| 20 to 24 Minutes | 1,100 (14.2%) | 770 (9.3%) |
| 25 to 29 Minutes | 317 (4.1%) | 465 (5.6%) |
| 30 to 34 Minutes | 629 (8.2%) | 763 (9.2%) |
| 35 to 39 Minutes | 66 (0.9%) | 27 (0.3%) |
| 40 to 44 Minutes | 144 (1.9%) | 140 (1.7%) |
| 45 to 59 Minutes | 363 (4.7%) | 231 (2.8%) |
| 60 to 89 Minutes | 207 (2.7%) | 80 (1.0%) |
| 90 or more Minutes | 104 (1.3%) | 87 (1.1%) |
Time of Departure to Work by Sex in Florence
The most frequent times of departure to work in Florence are 7:00 AM to 7:29 AM (1,126, 14.6%) for males and 7:00 AM to 7:29 AM (2,037, 24.6%) for females.
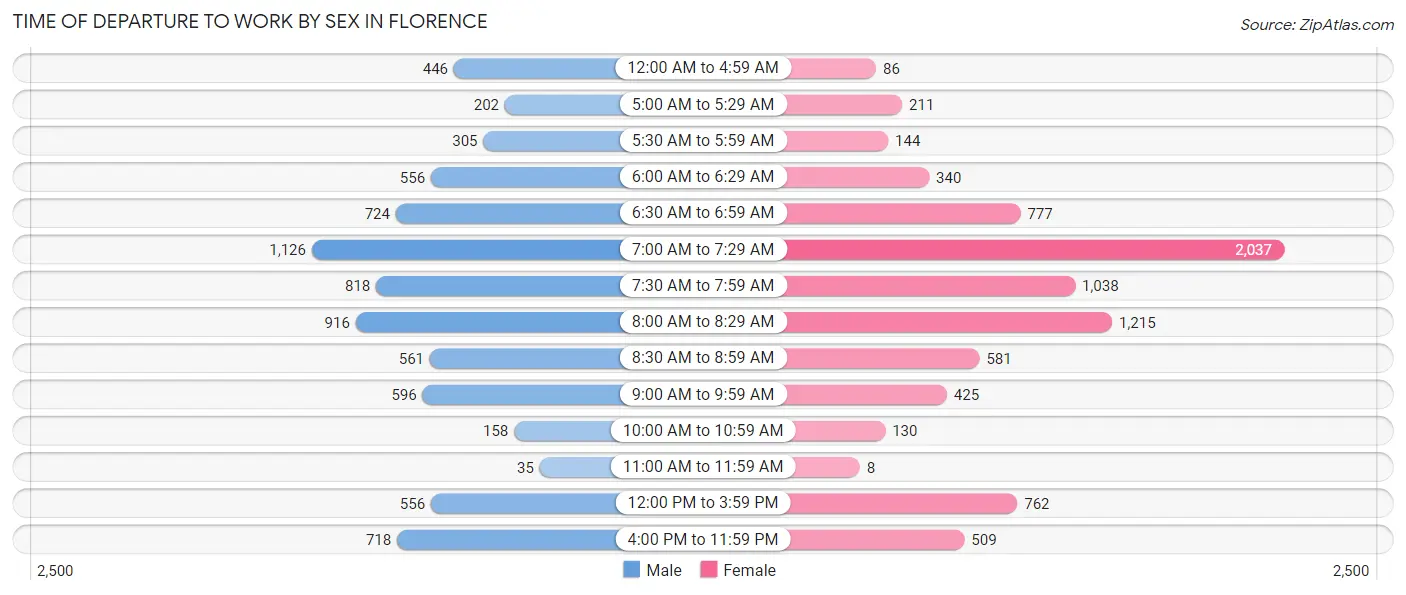
| Time of Departure | Male | Female |
| 12:00 AM to 4:59 AM | 446 (5.8%) | 86 (1.0%) |
| 5:00 AM to 5:29 AM | 202 (2.6%) | 211 (2.5%) |
| 5:30 AM to 5:59 AM | 305 (4.0%) | 144 (1.7%) |
| 6:00 AM to 6:29 AM | 556 (7.2%) | 340 (4.1%) |
| 6:30 AM to 6:59 AM | 724 (9.4%) | 777 (9.4%) |
| 7:00 AM to 7:29 AM | 1,126 (14.6%) | 2,037 (24.6%) |
| 7:30 AM to 7:59 AM | 818 (10.6%) | 1,038 (12.6%) |
| 8:00 AM to 8:29 AM | 916 (11.9%) | 1,215 (14.7%) |
| 8:30 AM to 8:59 AM | 561 (7.3%) | 581 (7.0%) |
| 9:00 AM to 9:59 AM | 596 (7.7%) | 425 (5.1%) |
| 10:00 AM to 10:59 AM | 158 (2.1%) | 130 (1.6%) |
| 11:00 AM to 11:59 AM | 35 (0.4%) | 8 (0.1%) |
| 12:00 PM to 3:59 PM | 556 (7.2%) | 762 (9.2%) |
| 4:00 PM to 11:59 PM | 718 (9.3%) | 509 (6.2%) |
| Total | 7,717 (100.0%) | 8,263 (100.0%) |
Housing Occupancy in Florence
Occupancy by Ownership in Florence
Of the total 16,322 dwellings in Florence, owner-occupied units account for 9,625 (59.0%), while renter-occupied units make up 6,697 (41.0%).
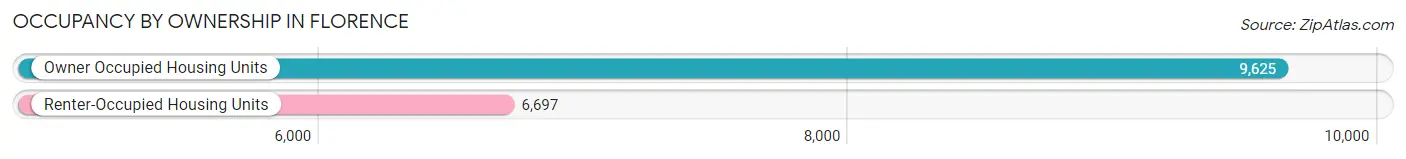
| Occupancy | # Housing Units | % Housing Units |
| Owner Occupied Housing Units | 9,625 | 59.0% |
| Renter-Occupied Housing Units | 6,697 | 41.0% |
| Total Occupied Housing Units | 16,322 | 100.0% |
Occupancy by Household Size in Florence
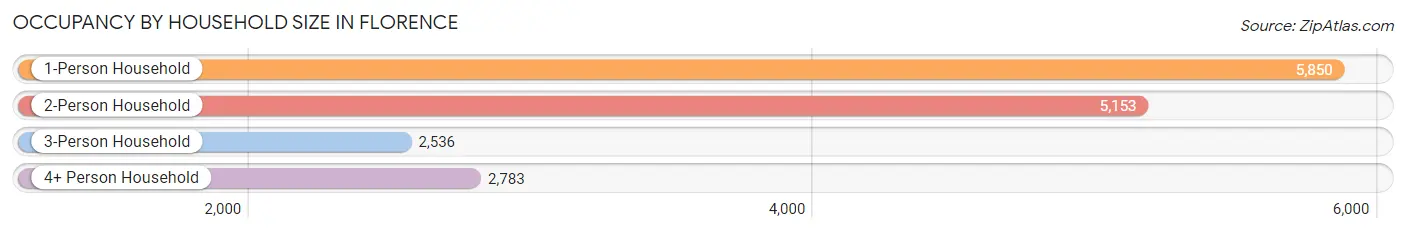
| Household Size | # Housing Units | % Housing Units |
| 1-Person Household | 5,850 | 35.8% |
| 2-Person Household | 5,153 | 31.6% |
| 3-Person Household | 2,536 | 15.5% |
| 4+ Person Household | 2,783 | 17.1% |
| Total Housing Units | 16,322 | 100.0% |
Occupancy by Ownership by Household Size in Florence
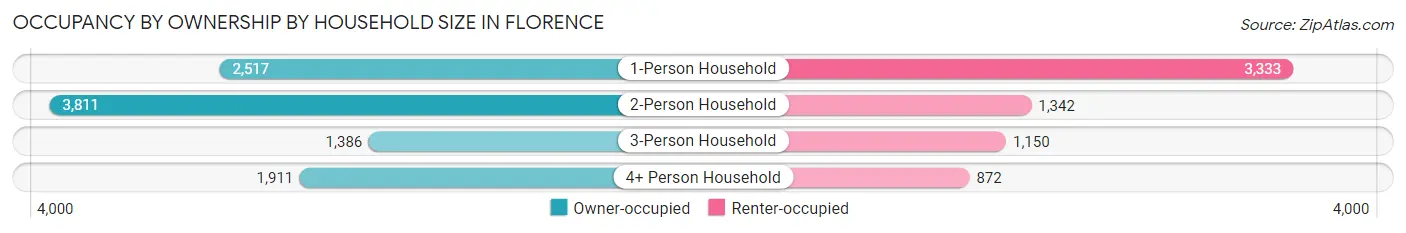
| Household Size | Owner-occupied | Renter-occupied |
| 1-Person Household | 2,517 (43.0%) | 3,333 (57.0%) |
| 2-Person Household | 3,811 (74.0%) | 1,342 (26.0%) |
| 3-Person Household | 1,386 (54.6%) | 1,150 (45.4%) |
| 4+ Person Household | 1,911 (68.7%) | 872 (31.3%) |
| Total Housing Units | 9,625 (59.0%) | 6,697 (41.0%) |
Occupancy by Educational Attainment in Florence
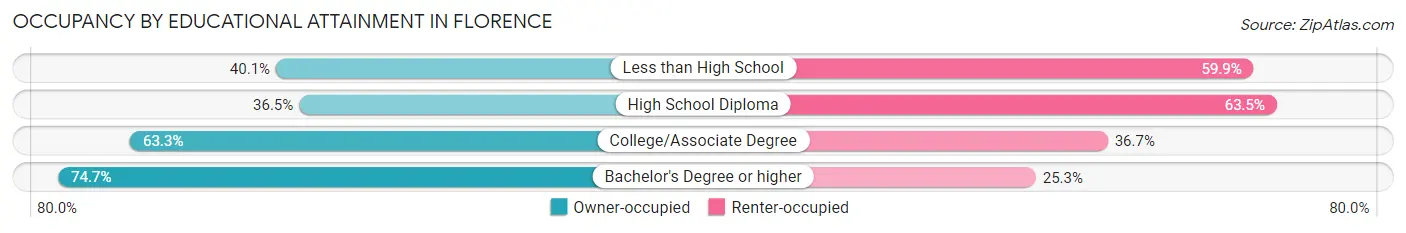
| Household Size | Owner-occupied | Renter-occupied |
| Less than High School | 509 (40.1%) | 759 (59.9%) |
| High School Diploma | 1,428 (36.5%) | 2,489 (63.5%) |
| College/Associate Degree | 3,490 (63.3%) | 2,026 (36.7%) |
| Bachelor's Degree or higher | 4,198 (74.7%) | 1,423 (25.3%) |
Occupancy by Age of Householder in Florence
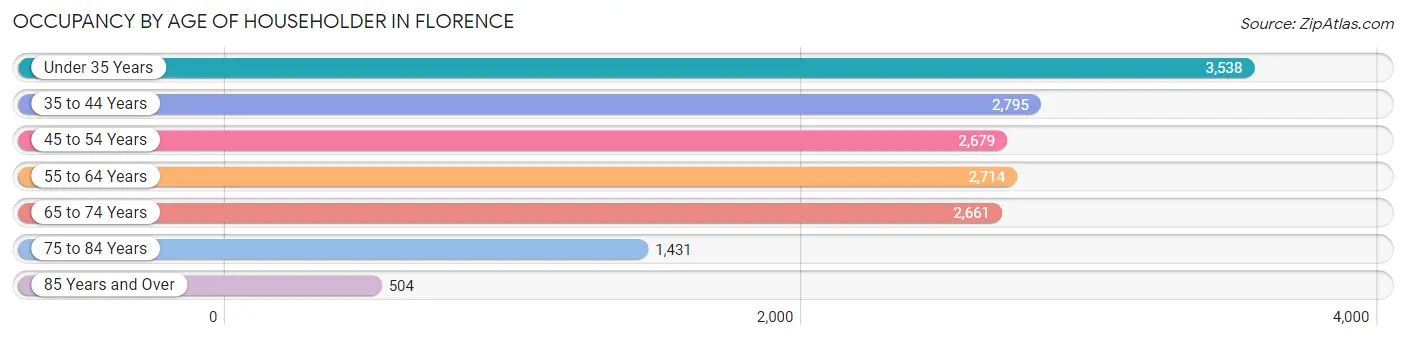
| Age Bracket | # Households | % Households |
| Under 35 Years | 3,538 | 21.7% |
| 35 to 44 Years | 2,795 | 17.1% |
| 45 to 54 Years | 2,679 | 16.4% |
| 55 to 64 Years | 2,714 | 16.6% |
| 65 to 74 Years | 2,661 | 16.3% |
| 75 to 84 Years | 1,431 | 8.8% |
| 85 Years and Over | 504 | 3.1% |
| Total | 16,322 | 100.0% |
Housing Finances in Florence
Median Income by Occupancy in Florence
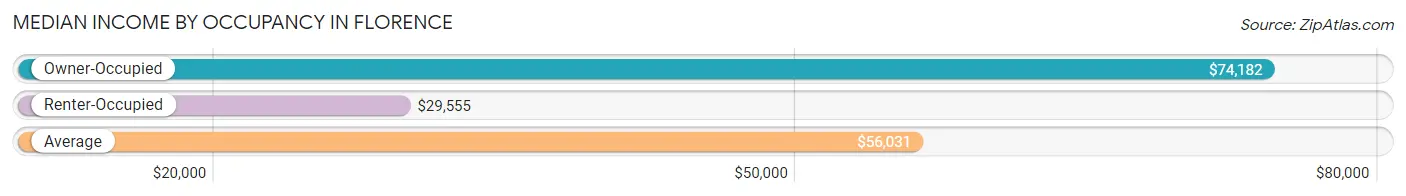
| Occupancy Type | # Households | Median Income |
| Owner-Occupied | 9,625 (59.0%) | $74,182 |
| Renter-Occupied | 6,697 (41.0%) | $29,555 |
| Average | 16,322 (100.0%) | $56,031 |
Occupancy by Householder Income Bracket in Florence
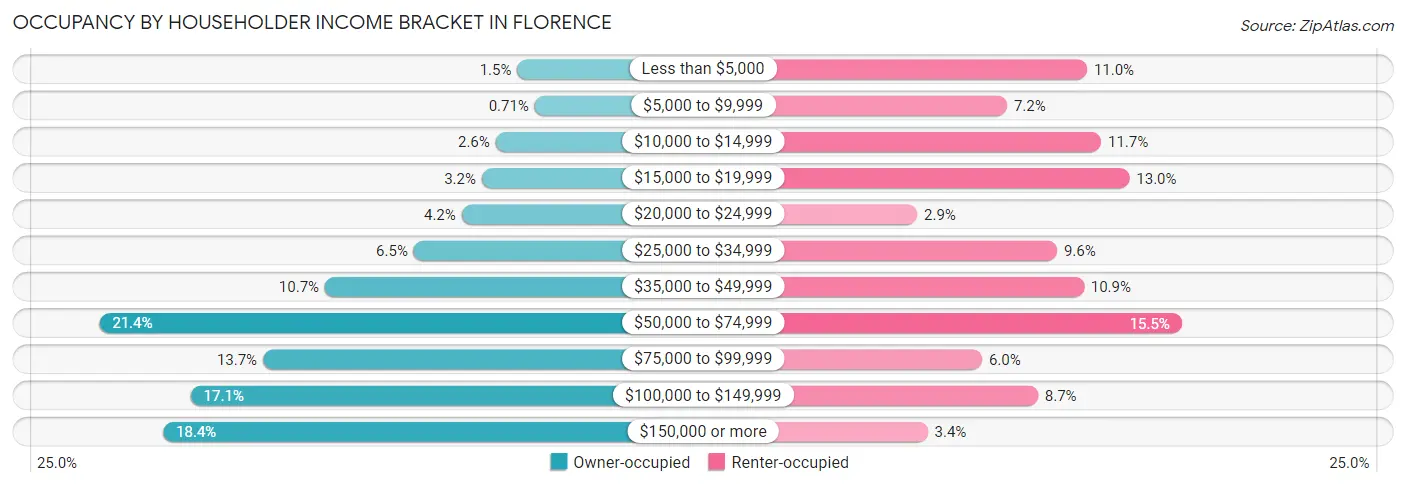
| Income Bracket | Owner-occupied | Renter-occupied |
| Less than $5,000 | 148 (1.5%) | 738 (11.0%) |
| $5,000 to $9,999 | 68 (0.7%) | 483 (7.2%) |
| $10,000 to $14,999 | 247 (2.6%) | 783 (11.7%) |
| $15,000 to $19,999 | 311 (3.2%) | 873 (13.0%) |
| $20,000 to $24,999 | 403 (4.2%) | 196 (2.9%) |
| $25,000 to $34,999 | 623 (6.5%) | 642 (9.6%) |
| $35,000 to $49,999 | 1,030 (10.7%) | 728 (10.9%) |
| $50,000 to $74,999 | 2,064 (21.4%) | 1,040 (15.5%) |
| $75,000 to $99,999 | 1,314 (13.7%) | 403 (6.0%) |
| $100,000 to $149,999 | 1,645 (17.1%) | 581 (8.7%) |
| $150,000 or more | 1,772 (18.4%) | 230 (3.4%) |
| Total | 9,625 (100.0%) | 6,697 (100.0%) |
Monthly Housing Cost Tiers in Florence
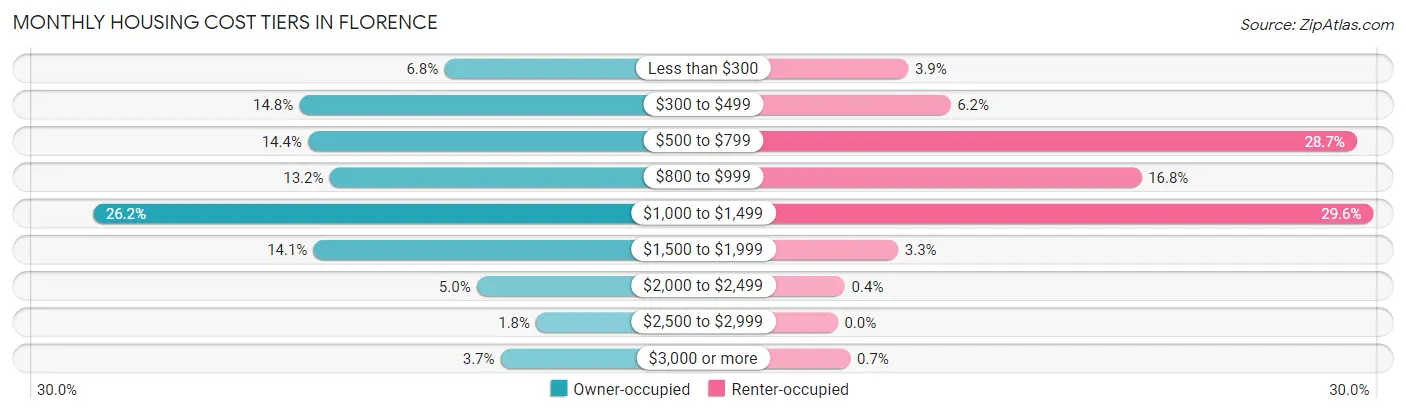
| Monthly Cost | Owner-occupied | Renter-occupied |
| Less than $300 | 657 (6.8%) | 261 (3.9%) |
| $300 to $499 | 1,428 (14.8%) | 417 (6.2%) |
| $500 to $799 | 1,382 (14.4%) | 1,921 (28.7%) |
| $800 to $999 | 1,268 (13.2%) | 1,124 (16.8%) |
| $1,000 to $1,499 | 2,525 (26.2%) | 1,982 (29.6%) |
| $1,500 to $1,999 | 1,353 (14.1%) | 224 (3.3%) |
| $2,000 to $2,499 | 485 (5.0%) | 27 (0.4%) |
| $2,500 to $2,999 | 169 (1.8%) | 0 (0.0%) |
| $3,000 or more | 358 (3.7%) | 47 (0.7%) |
| Total | 9,625 (100.0%) | 6,697 (100.0%) |
Physical Housing Characteristics in Florence
Housing Structures in Florence
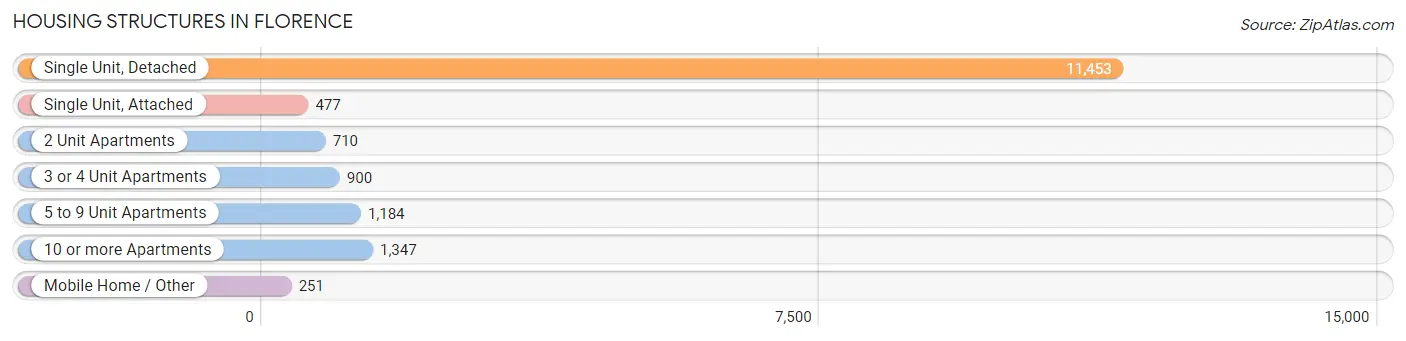
| Structure Type | # Housing Units | % Housing Units |
| Single Unit, Detached | 11,453 | 70.2% |
| Single Unit, Attached | 477 | 2.9% |
| 2 Unit Apartments | 710 | 4.3% |
| 3 or 4 Unit Apartments | 900 | 5.5% |
| 5 to 9 Unit Apartments | 1,184 | 7.2% |
| 10 or more Apartments | 1,347 | 8.3% |
| Mobile Home / Other | 251 | 1.5% |
| Total | 16,322 | 100.0% |
Housing Structures by Occupancy in Florence
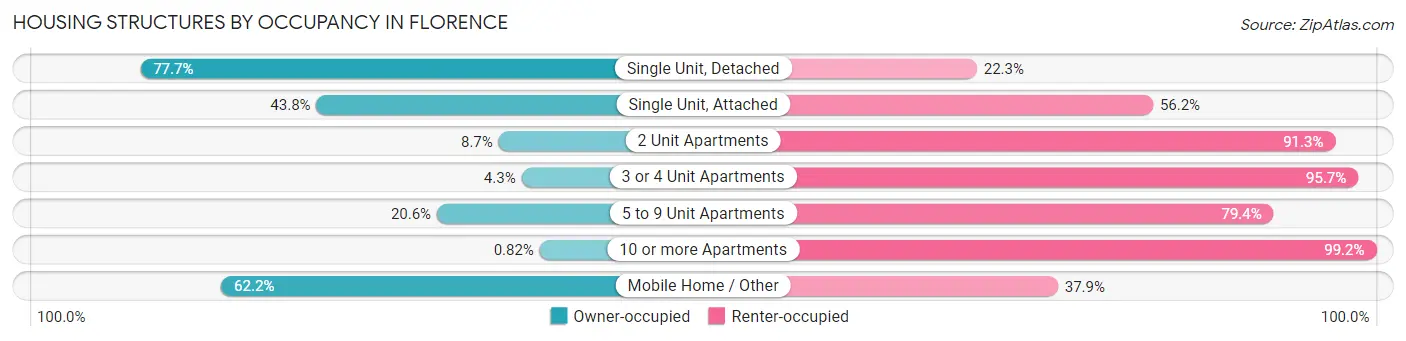
| Structure Type | Owner-occupied | Renter-occupied |
| Single Unit, Detached | 8,904 (77.7%) | 2,549 (22.3%) |
| Single Unit, Attached | 209 (43.8%) | 268 (56.2%) |
| 2 Unit Apartments | 62 (8.7%) | 648 (91.3%) |
| 3 or 4 Unit Apartments | 39 (4.3%) | 861 (95.7%) |
| 5 to 9 Unit Apartments | 244 (20.6%) | 940 (79.4%) |
| 10 or more Apartments | 11 (0.8%) | 1,336 (99.2%) |
| Mobile Home / Other | 156 (62.2%) | 95 (37.9%) |
| Total | 9,625 (59.0%) | 6,697 (41.0%) |
Housing Structures by Number of Rooms in Florence
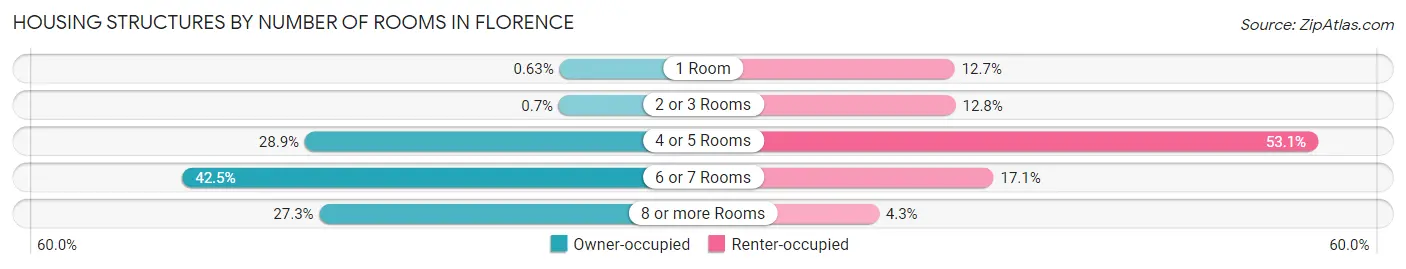
| Number of Rooms | Owner-occupied | Renter-occupied |
| 1 Room | 61 (0.6%) | 853 (12.7%) |
| 2 or 3 Rooms | 67 (0.7%) | 860 (12.8%) |
| 4 or 5 Rooms | 2,781 (28.9%) | 3,553 (53.0%) |
| 6 or 7 Rooms | 4,090 (42.5%) | 1,142 (17.1%) |
| 8 or more Rooms | 2,626 (27.3%) | 289 (4.3%) |
| Total | 9,625 (100.0%) | 6,697 (100.0%) |
Housing Structure by Heating Type in Florence
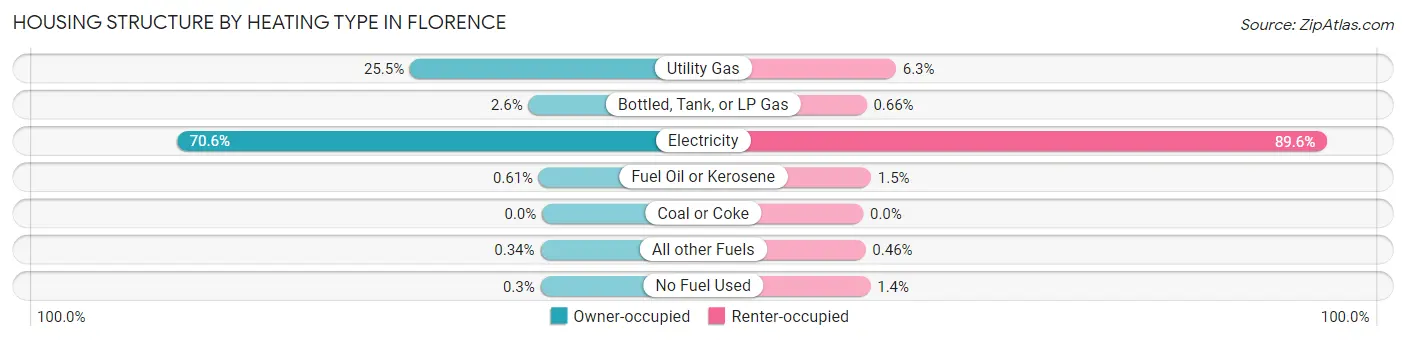
| Heating Type | Owner-occupied | Renter-occupied |
| Utility Gas | 2,455 (25.5%) | 424 (6.3%) |
| Bottled, Tank, or LP Gas | 253 (2.6%) | 44 (0.7%) |
| Electricity | 6,796 (70.6%) | 6,003 (89.6%) |
| Fuel Oil or Kerosene | 59 (0.6%) | 101 (1.5%) |
| Coal or Coke | 0 (0.0%) | 0 (0.0%) |
| All other Fuels | 33 (0.3%) | 31 (0.5%) |
| No Fuel Used | 29 (0.3%) | 94 (1.4%) |
| Total | 9,625 (100.0%) | 6,697 (100.0%) |
Household Vehicle Usage in Florence
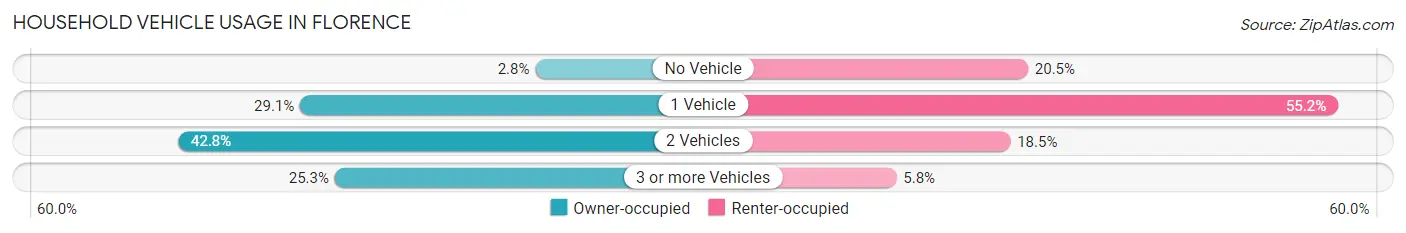
| Vehicles per Household | Owner-occupied | Renter-occupied |
| No Vehicle | 269 (2.8%) | 1,372 (20.5%) |
| 1 Vehicle | 2,804 (29.1%) | 3,699 (55.2%) |
| 2 Vehicles | 4,122 (42.8%) | 1,240 (18.5%) |
| 3 or more Vehicles | 2,430 (25.3%) | 386 (5.8%) |
| Total | 9,625 (100.0%) | 6,697 (100.0%) |
Real Estate & Mortgages in Florence
Real Estate and Mortgage Overview in Florence
| Characteristic | Without Mortgage | With Mortgage |
| Housing Units | 3,267 | 6,358 |
| Median Property Value | $149,700 | $185,900 |
| Median Household Income | $59,529 | $1,281 |
| Monthly Housing Costs | $431 | $358 |
| Real Estate Taxes | $611 | $203 |
Property Value by Mortgage Status in Florence
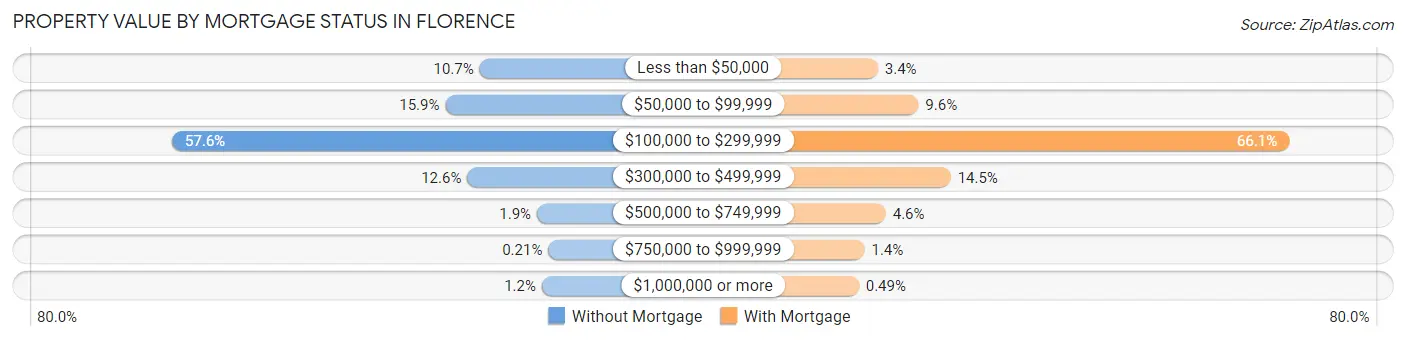
| Property Value | Without Mortgage | With Mortgage |
| Less than $50,000 | 349 (10.7%) | 216 (3.4%) |
| $50,000 to $99,999 | 519 (15.9%) | 609 (9.6%) |
| $100,000 to $299,999 | 1,880 (57.6%) | 4,200 (66.1%) |
| $300,000 to $499,999 | 410 (12.6%) | 922 (14.5%) |
| $500,000 to $749,999 | 63 (1.9%) | 293 (4.6%) |
| $750,000 to $999,999 | 7 (0.2%) | 87 (1.4%) |
| $1,000,000 or more | 39 (1.2%) | 31 (0.5%) |
| Total | 3,267 (100.0%) | 6,358 (100.0%) |
Household Income by Mortgage Status in Florence
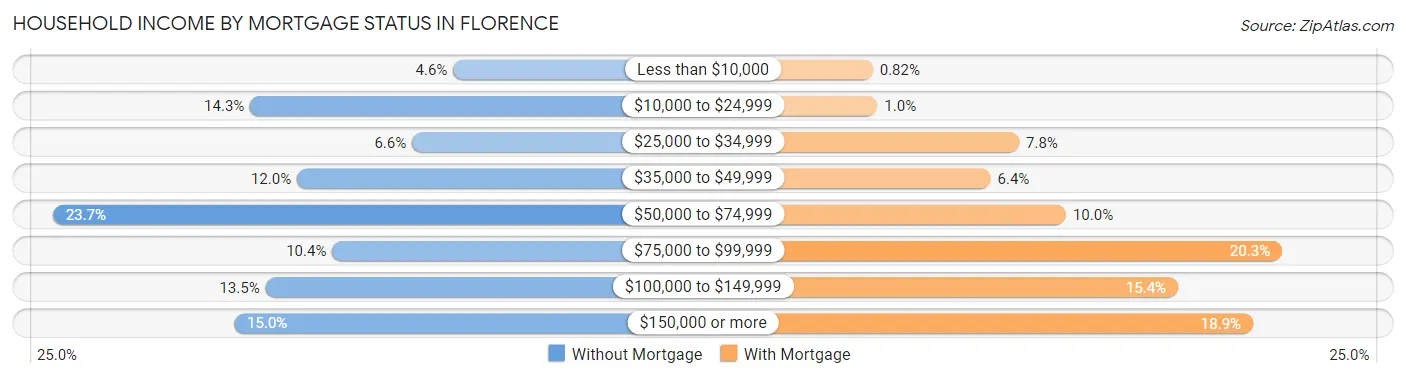
| Household Income | Without Mortgage | With Mortgage |
| Less than $10,000 | 150 (4.6%) | 52 (0.8%) |
| $10,000 to $24,999 | 466 (14.3%) | 66 (1.0%) |
| $25,000 to $34,999 | 214 (6.6%) | 495 (7.8%) |
| $35,000 to $49,999 | 393 (12.0%) | 409 (6.4%) |
| $50,000 to $74,999 | 773 (23.7%) | 637 (10.0%) |
| $75,000 to $99,999 | 338 (10.3%) | 1,291 (20.3%) |
| $100,000 to $149,999 | 442 (13.5%) | 976 (15.3%) |
| $150,000 or more | 491 (15.0%) | 1,203 (18.9%) |
| Total | 3,267 (100.0%) | 6,358 (100.0%) |
Property Value to Household Income Ratio in Florence
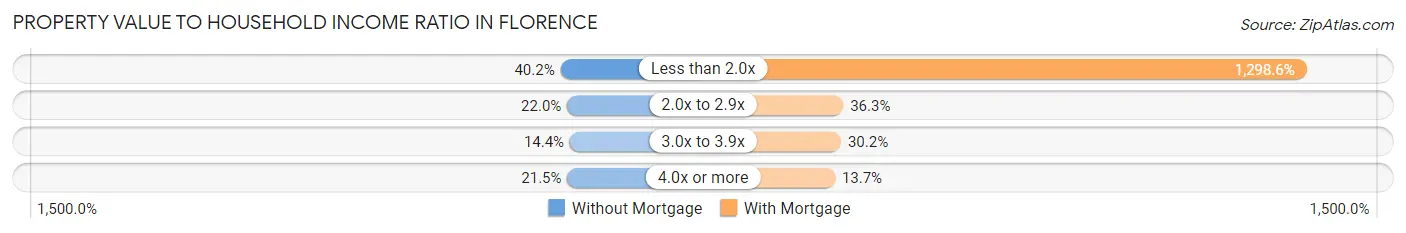
| Value-to-Income Ratio | Without Mortgage | With Mortgage |
| Less than 2.0x | 1,312 (40.2%) | 82,565 (1,298.6%) |
| 2.0x to 2.9x | 719 (22.0%) | 2,306 (36.3%) |
| 3.0x to 3.9x | 469 (14.4%) | 1,918 (30.2%) |
| 4.0x or more | 701 (21.5%) | 870 (13.7%) |
| Total | 3,267 (100.0%) | 6,358 (100.0%) |
Real Estate Taxes by Mortgage Status in Florence
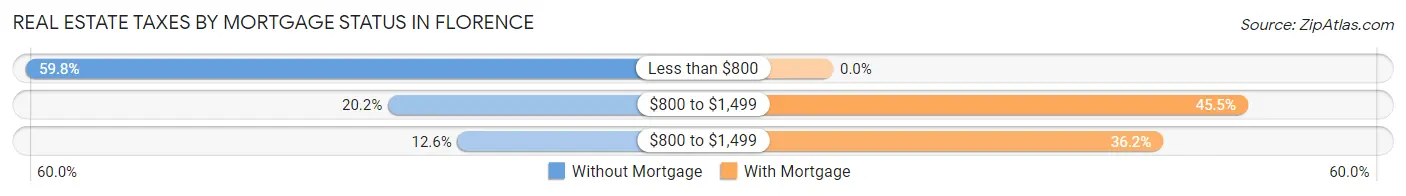
| Property Taxes | Without Mortgage | With Mortgage |
| Less than $800 | 1,955 (59.8%) | 0 (0.0%) |
| $800 to $1,499 | 659 (20.2%) | 2,890 (45.5%) |
| $800 to $1,499 | 410 (12.6%) | 2,300 (36.2%) |
| Total | 3,267 (100.0%) | 6,358 (100.0%) |
Health & Disability in Florence
Health Insurance Coverage by Age in Florence
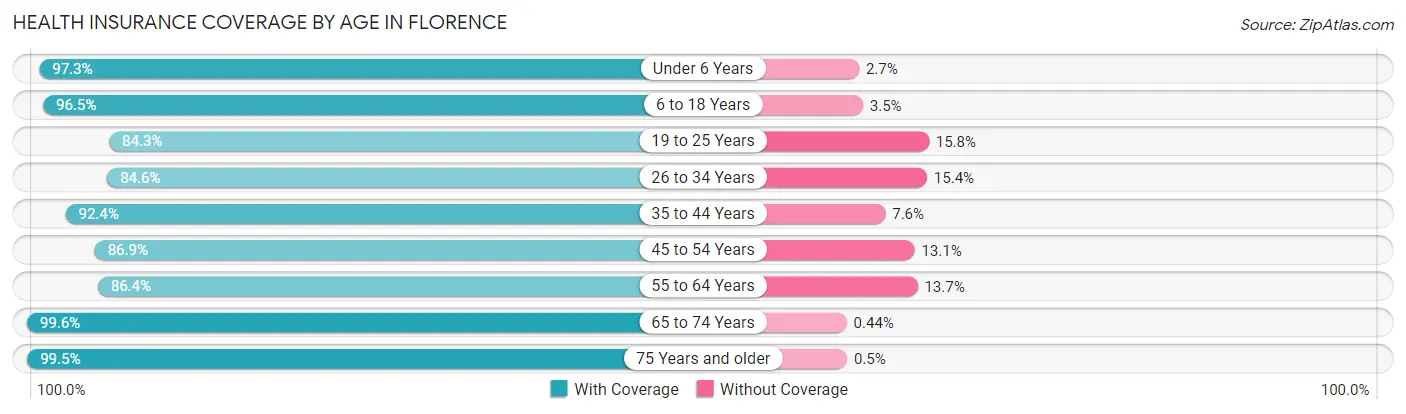
| Age Bracket | With Coverage | Without Coverage |
| Under 6 Years | 3,225 (97.3%) | 91 (2.7%) |
| 6 to 18 Years | 6,586 (96.5%) | 236 (3.5%) |
| 19 to 25 Years | 2,818 (84.3%) | 527 (15.8%) |
| 26 to 34 Years | 4,122 (84.6%) | 751 (15.4%) |
| 35 to 44 Years | 4,362 (92.4%) | 361 (7.6%) |
| 45 to 54 Years | 3,889 (86.9%) | 586 (13.1%) |
| 55 to 64 Years | 3,973 (86.4%) | 628 (13.7%) |
| 65 to 74 Years | 4,266 (99.6%) | 19 (0.4%) |
| 75 Years and older | 2,787 (99.5%) | 14 (0.5%) |
| Total | 36,028 (91.8%) | 3,213 (8.2%) |
Health Insurance Coverage by Citizenship Status in Florence
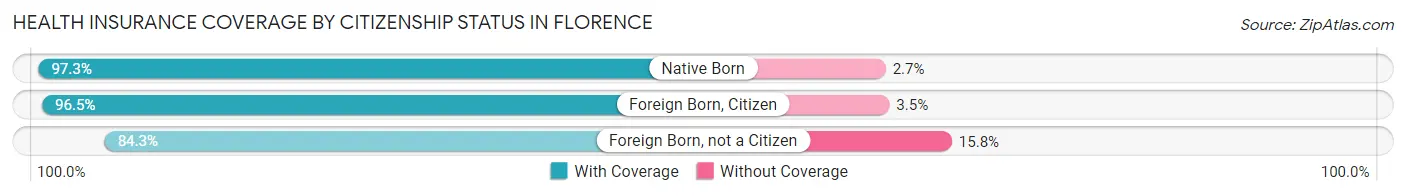
| Citizenship Status | With Coverage | Without Coverage |
| Native Born | 3,225 (97.3%) | 91 (2.7%) |
| Foreign Born, Citizen | 6,586 (96.5%) | 236 (3.5%) |
| Foreign Born, not a Citizen | 2,818 (84.3%) | 527 (15.8%) |
Health Insurance Coverage by Household Income in Florence
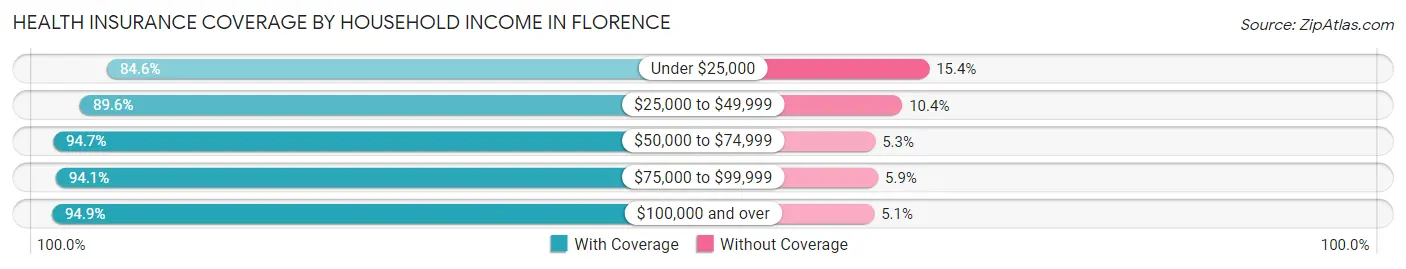
| Household Income | With Coverage | Without Coverage |
| Under $25,000 | 6,096 (84.6%) | 1,113 (15.4%) |
| $25,000 to $49,999 | 5,767 (89.6%) | 669 (10.4%) |
| $50,000 to $74,999 | 7,081 (94.7%) | 399 (5.3%) |
| $75,000 to $99,999 | 4,984 (94.1%) | 310 (5.9%) |
| $100,000 and over | 11,839 (94.9%) | 641 (5.1%) |
Public vs Private Health Insurance Coverage by Age in Florence
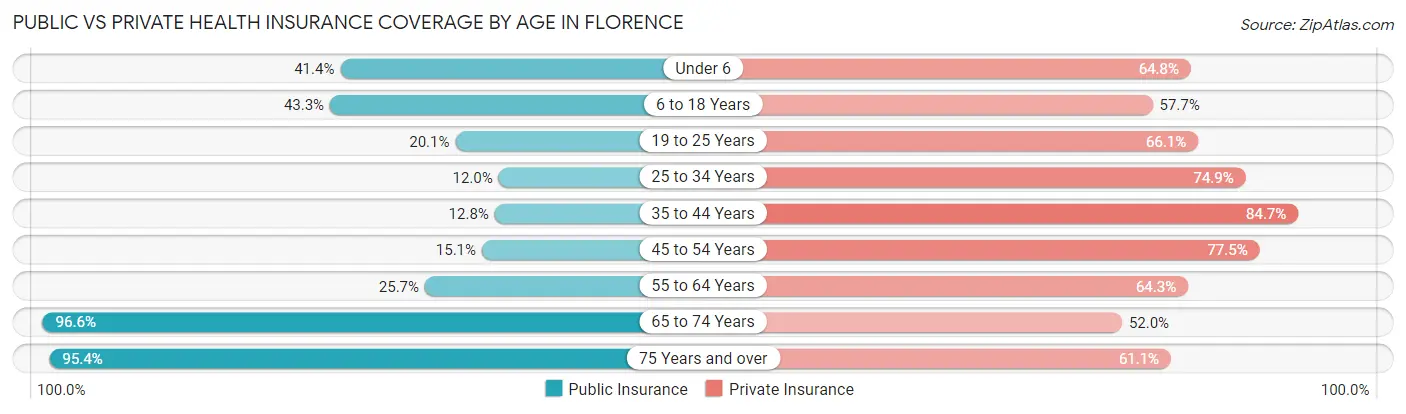
| Age Bracket | Public Insurance | Private Insurance |
| Under 6 | 1,373 (41.4%) | 2,148 (64.8%) |
| 6 to 18 Years | 2,955 (43.3%) | 3,935 (57.7%) |
| 19 to 25 Years | 671 (20.1%) | 2,212 (66.1%) |
| 25 to 34 Years | 586 (12.0%) | 3,652 (74.9%) |
| 35 to 44 Years | 602 (12.8%) | 4,000 (84.7%) |
| 45 to 54 Years | 677 (15.1%) | 3,469 (77.5%) |
| 55 to 64 Years | 1,183 (25.7%) | 2,956 (64.2%) |
| 65 to 74 Years | 4,141 (96.6%) | 2,228 (52.0%) |
| 75 Years and over | 2,672 (95.4%) | 1,711 (61.1%) |
| Total | 14,860 (37.9%) | 26,311 (67.0%) |
Disability Status by Sex by Age in Florence
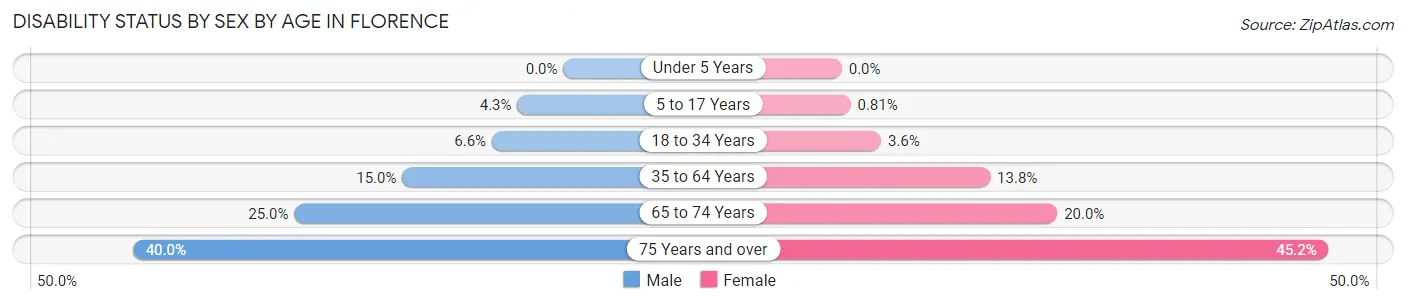
| Age Bracket | Male | Female |
| Under 5 Years | 0 (0.0%) | 0 (0.0%) |
| 5 to 17 Years | 145 (4.3%) | 31 (0.8%) |
| 18 to 34 Years | 264 (6.6%) | 167 (3.6%) |
| 35 to 64 Years | 942 (14.9%) | 1,033 (13.8%) |
| 65 to 74 Years | 448 (25.0%) | 498 (20.0%) |
| 75 Years and over | 424 (40.0%) | 786 (45.2%) |
Disability Class by Sex by Age in Florence
Disability Class: Hearing Difficulty
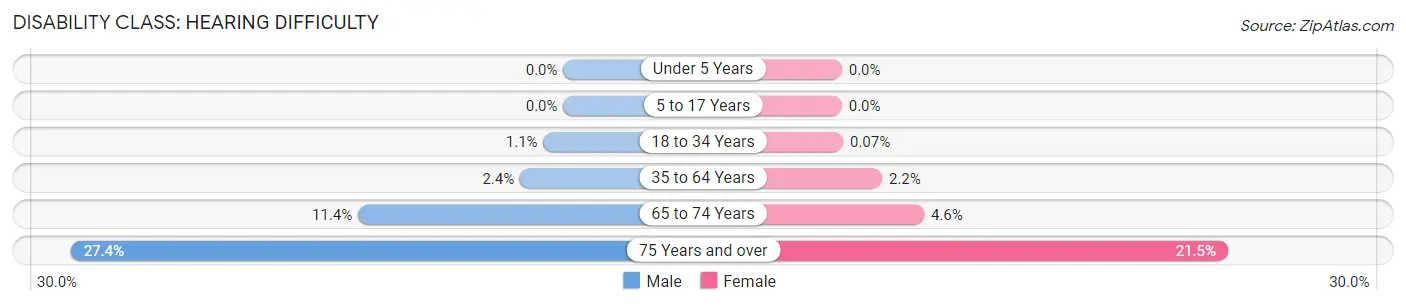
| Age Bracket | Male | Female |
| Under 5 Years | 0 (0.0%) | 0 (0.0%) |
| 5 to 17 Years | 0 (0.0%) | 0 (0.0%) |
| 18 to 34 Years | 44 (1.1%) | 3 (0.1%) |
| 35 to 64 Years | 152 (2.4%) | 168 (2.2%) |
| 65 to 74 Years | 205 (11.4%) | 114 (4.6%) |
| 75 Years and over | 291 (27.4%) | 374 (21.5%) |
Disability Class: Vision Difficulty
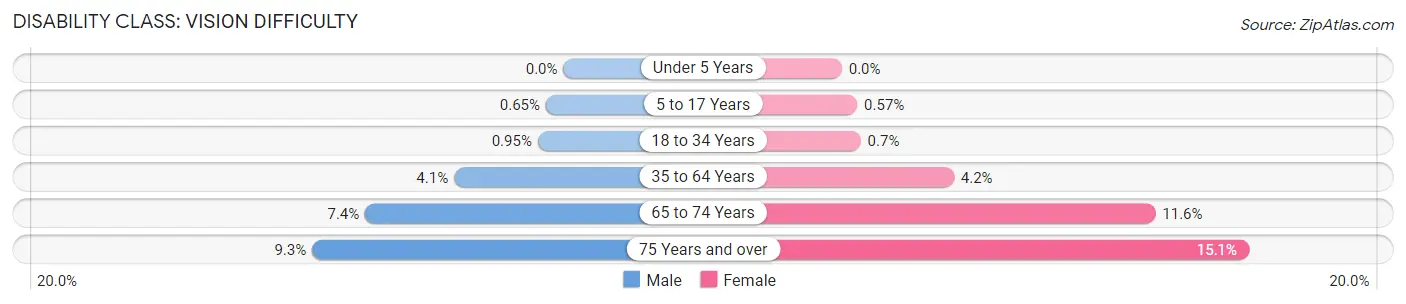
| Age Bracket | Male | Female |
| Under 5 Years | 0 (0.0%) | 0 (0.0%) |
| 5 to 17 Years | 22 (0.6%) | 22 (0.6%) |
| 18 to 34 Years | 38 (0.9%) | 32 (0.7%) |
| 35 to 64 Years | 256 (4.1%) | 312 (4.2%) |
| 65 to 74 Years | 132 (7.4%) | 290 (11.6%) |
| 75 Years and over | 99 (9.3%) | 263 (15.1%) |
Disability Class: Cognitive Difficulty
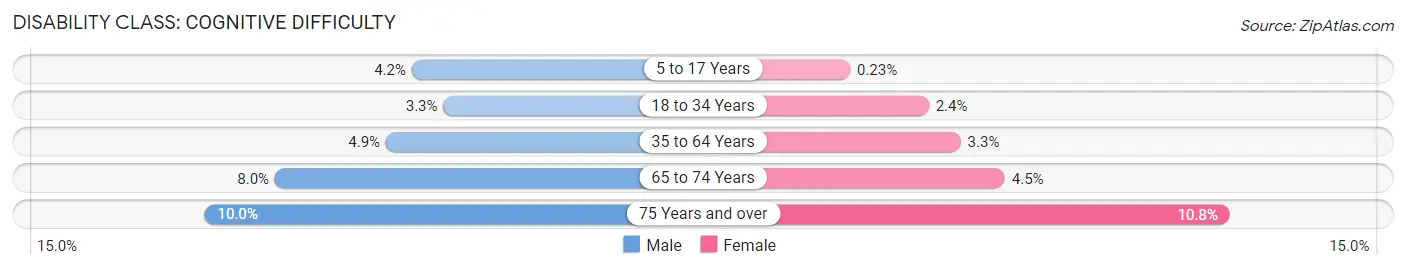
| Age Bracket | Male | Female |
| 5 to 17 Years | 143 (4.2%) | 9 (0.2%) |
| 18 to 34 Years | 133 (3.3%) | 111 (2.4%) |
| 35 to 64 Years | 311 (4.9%) | 248 (3.3%) |
| 65 to 74 Years | 144 (8.0%) | 113 (4.5%) |
| 75 Years and over | 106 (10.0%) | 188 (10.8%) |
Disability Class: Ambulatory Difficulty
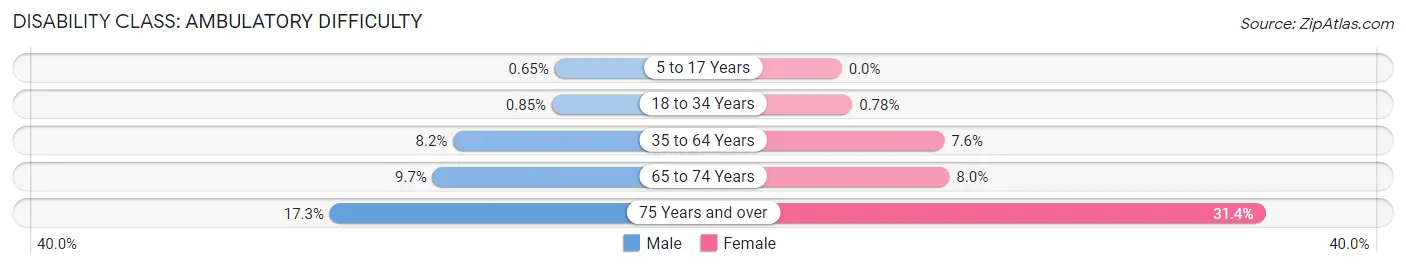
| Age Bracket | Male | Female |
| 5 to 17 Years | 22 (0.6%) | 0 (0.0%) |
| 18 to 34 Years | 34 (0.9%) | 36 (0.8%) |
| 35 to 64 Years | 515 (8.2%) | 571 (7.6%) |
| 65 to 74 Years | 174 (9.7%) | 199 (8.0%) |
| 75 Years and over | 184 (17.3%) | 547 (31.4%) |
Disability Class: Self-Care Difficulty
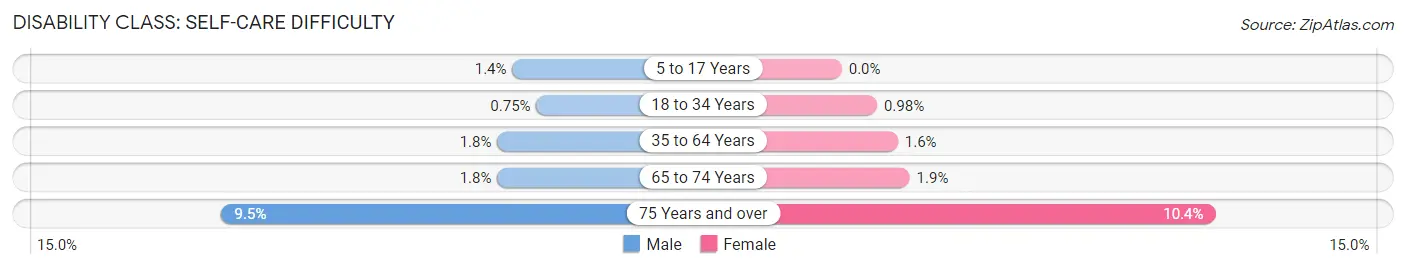
| Age Bracket | Male | Female |
| 5 to 17 Years | 48 (1.4%) | 0 (0.0%) |
| 18 to 34 Years | 30 (0.7%) | 45 (1.0%) |
| 35 to 64 Years | 116 (1.8%) | 117 (1.6%) |
| 65 to 74 Years | 33 (1.8%) | 47 (1.9%) |
| 75 Years and over | 101 (9.5%) | 181 (10.4%) |
Technology Access in Florence
Computing Device Access in Florence
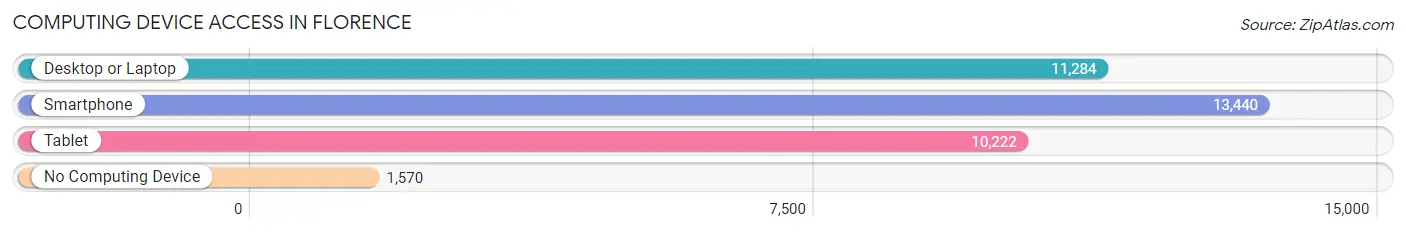
| Device Type | # Households | % Households |
| Desktop or Laptop | 11,284 | 69.1% |
| Smartphone | 13,440 | 82.3% |
| Tablet | 10,222 | 62.6% |
| No Computing Device | 1,570 | 9.6% |
| Total | 16,322 | 100.0% |
Internet Access in Florence
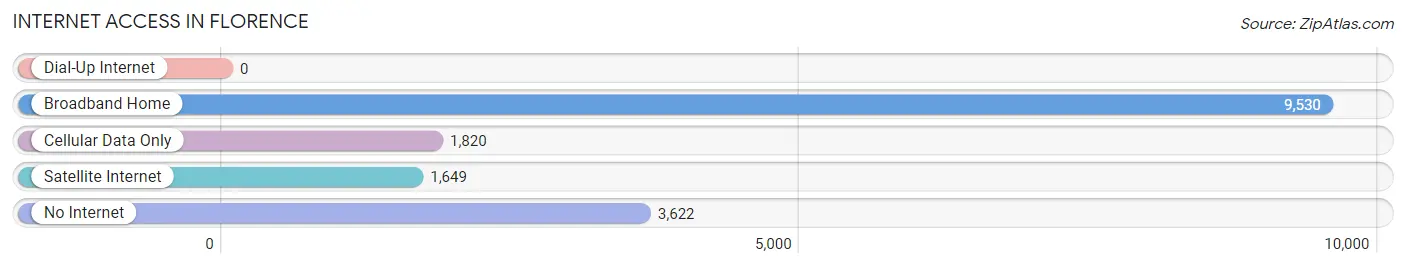
| Internet Type | # Households | % Households |
| Dial-Up Internet | 0 | 0.0% |
| Broadband Home | 9,530 | 58.4% |
| Cellular Data Only | 1,820 | 11.2% |
| Satellite Internet | 1,649 | 10.1% |
| No Internet | 3,622 | 22.2% |
| Total | 16,322 | 100.0% |
Florence Summary
Florence, South Carolina is a city located in the Pee Dee region of the state. It is the county seat of Florence County and is the largest city in the region. The city is located along the banks of the Great Pee Dee River and is home to a population of 37,056 people as of the 2010 census.
History
Florence was founded in 1826 and named after the daughter of General William Richardson Davie, the founder of the city. The city was originally known as Cross Creek and was later renamed Florence after the daughter of General Davie. The city was incorporated in 1871 and has since grown to become the largest city in the Pee Dee region.
The city was an important center for the cotton industry during the 19th century and was home to several cotton mills. The city was also an important railroad hub and was home to the Florence Stockade, a Confederate prison camp during the Civil War.
Geography
Florence is located in the Pee Dee region of South Carolina, in the northeastern part of the state. The city is situated along the banks of the Great Pee Dee River and is located about halfway between the cities of Charleston and Columbia. The city has a total area of 24.2 square miles, of which 23.9 square miles is land and 0.3 square miles is water.
The city is located in a humid subtropical climate zone and has hot, humid summers and mild winters. The average annual temperature is around 70 degrees Fahrenheit and the average annual precipitation is around 48 inches.
Economy
Florence is an important economic center for the Pee Dee region of South Carolina. The city is home to several major employers, including McLeod Regional Medical Center, the Florence County School District, and the Florence County Government. The city is also home to several manufacturing companies, including Sonoco Products Company, which produces paper and plastic products, and the Florence-Darlington Technical College.
The city is also home to several retail stores, restaurants, and other businesses. The city is served by the Florence Regional Airport, which provides air service to the city and the surrounding area.
Demographics
As of the 2010 census, the population of Florence was 37,056. The racial makeup of the city was 57.3% White, 37.2% African American, 0.4% Native American, 1.2% Asian, 0.1% Pacific Islander, 1.7% from other races, and 2.1% from two or more races. Hispanic or Latino of any race were 4.2% of the population.
The median income for a household in the city was $32,917 and the median income for a family was $41,945. The per capita income for the city was $19,845. About 17.2% of the population was below the poverty line.
Florence is a diverse city with a rich history and a vibrant economy. The city is home to a variety of businesses, industries, and educational institutions, and is an important economic center for the Pee Dee region of South Carolina. The city is also home to a diverse population, with a variety of racial and ethnic backgrounds.
Common Questions
What is Per Capita Income in Florence?
Per Capita income in Florence is $33,867.
What is the Median Family Income in Florence?
Median Family Income in Florence is $76,030.
What is the Median Household income in Florence?
Median Household Income in Florence is $56,031.
What is Income or Wage Gap in Florence?
Income or Wage Gap in Florence is 26.4%.
Women in Florence earn 73.6 cents for every dollar earned by a man.
What is Family Income Deficit in Florence?
Family Income Deficit in Florence is $10,744.
Families that are below poverty line in Florence earn $10,744 less on average than the poverty threshold level.
What is Inequality or Gini Index in Florence?
Inequality or Gini Index in Florence is 0.51.
What is the Total Population of Florence?
Total Population of Florence is 39,931.
What is the Total Male Population of Florence?
Total Male Population of Florence is 18,173.
What is the Total Female Population of Florence?
Total Female Population of Florence is 21,758.
What is the Ratio of Males per 100 Females in Florence?
There are 83.52 Males per 100 Females in Florence.
What is the Ratio of Females per 100 Males in Florence?
There are 119.73 Females per 100 Males in Florence.
What is the Median Population Age in Florence?
Median Population Age in Florence is 38.0 Years.
What is the Average Family Size in Florence
Average Family Size in Florence is 3.2 People.
What is the Average Household Size in Florence
Average Household Size in Florence is 2.4 People.
How Large is the Labor Force in Florence?
There are 18,983 People in the Labor Forcein in Florence.
What is the Percentage of People in the Labor Force in Florence?
60.5% of People are in the Labor Force in Florence.
What is the Unemployment Rate in Florence?
Unemployment Rate in Florence is 4.8%.