Cities with the Highest Percentage of Ghanaian Population in the United States
RELATED REPORTS & OPTIONS
Ghanaian
United States
Compare Cities
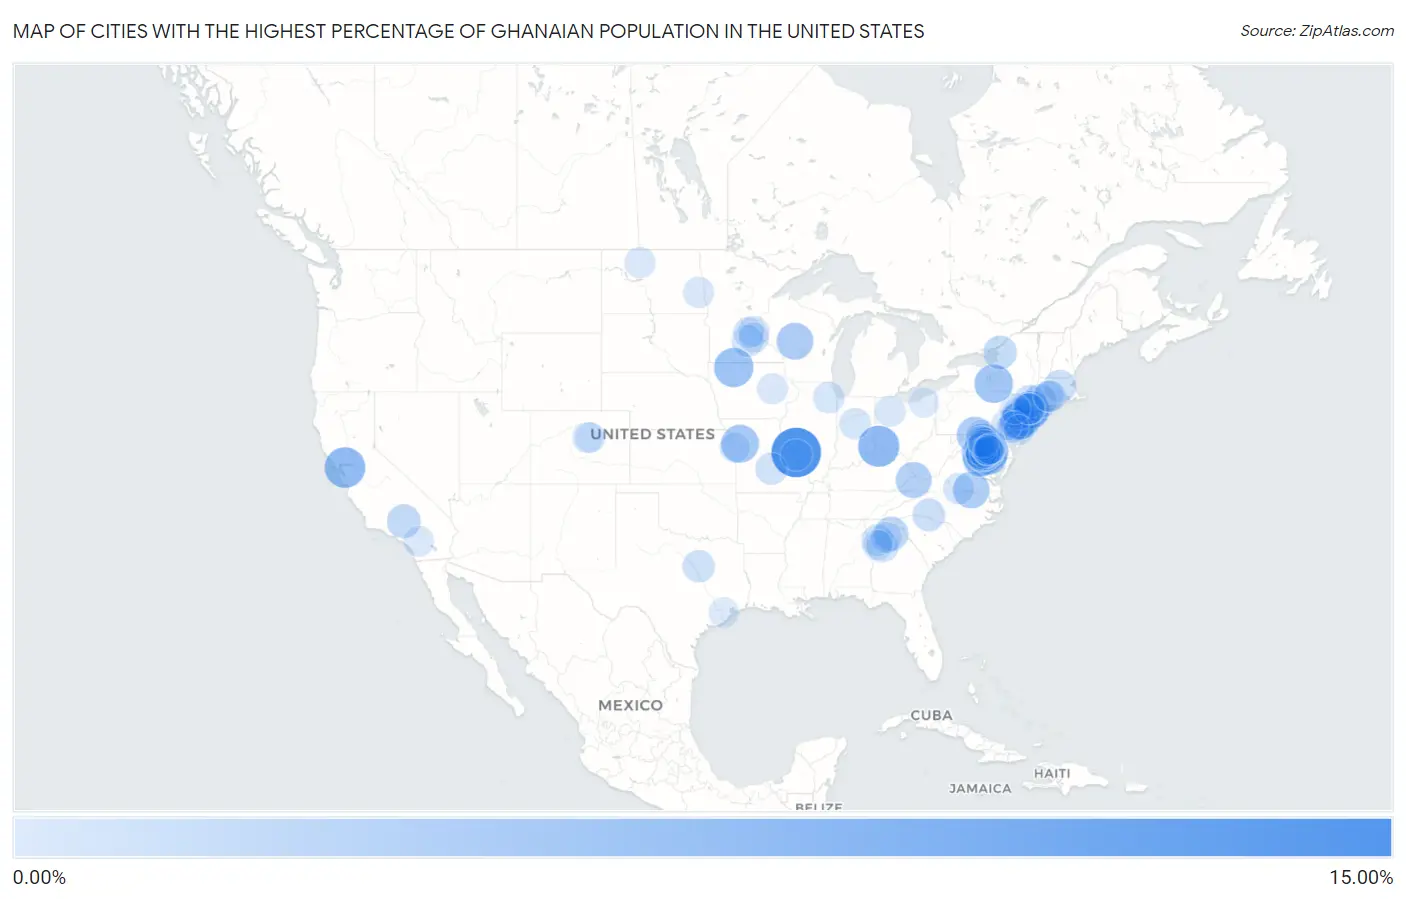
Map of Cities with the Highest Percentage of Ghanaian Population in the United States
0.00%
15.00%
Cities with the Highest Percentage of Ghanaian Population in the United States
| City | Ghanaian | vs State | vs National | |
| 1. | Calverton Park | 11.97% | 0.027%(+11.9)#1 | 0.056%(+11.9)#1 |
| 2. | Delshire | 7.22% | 0.085%(+7.13)#1 | 0.056%(+7.16)#2 |
| 3. | Shell Ridge | 6.92% | 0.024%(+6.89)#1 | 0.056%(+6.86)#3 |
| 4. | Queensland | 6.24% | 0.26%(+5.99)#1 | 0.056%(+6.19)#4 |
| 5. | Leesylvania | 6.21% | 0.20%(+6.01)#1 | 0.056%(+6.15)#5 |
| 6. | Graettinger | 6.14% | 0.024%(+6.11)#1 | 0.056%(+6.08)#6 |
| 7. | Cherry Hill | 6.00% | 0.20%(+5.80)#2 | 0.056%(+5.95)#7 |
| 8. | Forest Home | 5.69% | 0.18%(+5.51)#1 | 0.056%(+5.64)#8 |
| 9. | Voorhees | 5.56% | 0.16%(+5.40)#1 | 0.056%(+5.51)#9 |
| 10. | Missouri City | 5.35% | 0.027%(+5.32)#2 | 0.056%(+5.30)#10 |
| 11. | Elmsford | 5.26% | 0.18%(+5.08)#2 | 0.056%(+5.20)#11 |
| 12. | Burtonsville | 5.23% | 0.26%(+4.98)#2 | 0.056%(+5.18)#12 |
| 13. | Skillman | 5.05% | 0.16%(+4.89)#2 | 0.056%(+4.99)#13 |
| 14. | Piermont | 5.03% | 0.18%(+4.85)#3 | 0.056%(+4.97)#14 |
| 15. | Granton | 4.79% | 0.013%(+4.77)#1 | 0.056%(+4.73)#15 |
| 16. | Bryantown | 4.68% | 0.26%(+4.42)#3 | 0.056%(+4.62)#16 |
| 17. | Brodnax | 4.66% | 0.20%(+4.45)#3 | 0.056%(+4.60)#17 |
| 18. | Maugansville | 4.62% | 0.26%(+4.36)#4 | 0.056%(+4.56)#18 |
| 19. | Vansant | 4.37% | 0.20%(+4.16)#4 | 0.056%(+4.31)#19 |
| 20. | Monrovia | 4.19% | 0.26%(+3.94)#5 | 0.056%(+4.14)#20 |
| 21. | Woodlawn Cdp Fairfax County | 3.64% | 0.20%(+3.44)#5 | 0.056%(+3.58)#21 |
| 22. | Pendergrass | 3.46% | 0.085%(+3.38)#1 | 0.056%(+3.40)#22 |
| 23. | Bull Run | 3.35% | 0.20%(+3.14)#6 | 0.056%(+3.29)#23 |
| 24. | County Center | 3.33% | 0.20%(+3.13)#7 | 0.056%(+3.27)#24 |
| 25. | Falmouth | 3.33% | 0.20%(+3.12)#8 | 0.056%(+3.27)#25 |
| 26. | Mount Vernon | 3.32% | 0.20%(+3.12)#9 | 0.056%(+3.27)#26 |
| 27. | Lorton | 3.28% | 0.20%(+3.08)#10 | 0.056%(+3.22)#27 |
| 28. | Edwards Afb | 3.19% | 0.024%(+3.17)#2 | 0.056%(+3.14)#28 |
| 29. | Compo | 3.08% | 0.17%(+2.91)#1 | 0.056%(+3.02)#29 |
| 30. | Woodbridge | 3.02% | 0.20%(+2.81)#11 | 0.056%(+2.96)#30 |
| 31. | Dexter | 3.01% | 0.18%(+2.84)#4 | 0.056%(+2.96)#31 |
| 32. | Heritage Village | 2.99% | 0.17%(+2.82)#2 | 0.056%(+2.94)#32 |
| 33. | Heathcote | 2.66% | 0.16%(+2.49)#3 | 0.056%(+2.60)#33 |
| 34. | Melwood | 2.62% | 0.26%(+2.36)#6 | 0.056%(+2.56)#34 |
| 35. | Accokeek | 2.60% | 0.26%(+2.35)#7 | 0.056%(+2.55)#35 |
| 36. | Worcester | 2.55% | 0.14%(+2.41)#1 | 0.056%(+2.49)#36 |
| 37. | Springdale | 2.53% | 0.26%(+2.27)#8 | 0.056%(+2.47)#37 |
| 38. | Cramerton | 2.49% | 0.044%(+2.45)#1 | 0.056%(+2.44)#38 |
| 39. | Fords | 2.45% | 0.16%(+2.28)#4 | 0.056%(+2.39)#39 |
| 40. | Fishkill | 2.39% | 0.18%(+2.21)#5 | 0.056%(+2.33)#40 |
| 41. | Urbana | 2.37% | 0.26%(+2.11)#9 | 0.056%(+2.31)#41 |
| 42. | Budd Lake | 2.29% | 0.16%(+2.13)#5 | 0.056%(+2.24)#42 |
| 43. | Grandview | 2.28% | 0.037%(+2.24)#1 | 0.056%(+2.22)#43 |
| 44. | Lovejoy | 2.23% | 0.085%(+2.15)#2 | 0.056%(+2.18)#44 |
| 45. | St Robert | 2.14% | 0.027%(+2.11)#3 | 0.056%(+2.08)#45 |
| 46. | New Carrollton | 2.13% | 0.26%(+1.87)#10 | 0.056%(+2.07)#46 |
| 47. | Manchester | 2.13% | 0.17%(+1.95)#3 | 0.056%(+2.07)#47 |
| 48. | Fairland | 2.09% | 0.26%(+1.83)#11 | 0.056%(+2.04)#48 |
| 49. | Richmond Heights | 2.05% | 0.027%(+2.02)#4 | 0.056%(+1.99)#49 |
| 50. | Belle Plaine | 2.04% | 0.067%(+1.97)#1 | 0.056%(+1.98)#50 |
| 51. | Millbourne Borough | 2.04% | 0.037%(+2.00)#1 | 0.056%(+1.98)#51 |
| 52. | Valley Cottage | 2.02% | 0.18%(+1.84)#6 | 0.056%(+1.96)#52 |
| 53. | Lithia Springs | 2.01% | 0.085%(+1.92)#3 | 0.056%(+1.95)#53 |
| 54. | Hybla Valley | 2.01% | 0.20%(+1.80)#12 | 0.056%(+1.95)#54 |
| 55. | Arcadia University | 1.93% | 0.037%(+1.90)#2 | 0.056%(+1.88)#55 |
| 56. | Oak Grove | 1.93% | 0.20%(+1.73)#13 | 0.056%(+1.88)#56 |
| 57. | Dale City | 1.87% | 0.20%(+1.67)#14 | 0.056%(+1.82)#57 |
| 58. | Lawrenceville | 1.85% | 0.085%(+1.77)#4 | 0.056%(+1.80)#58 |
| 59. | Woodridge | 1.85% | 0.051%(+1.80)#1 | 0.056%(+1.80)#59 |
| 60. | Hillcrest | 1.85% | 0.18%(+1.67)#7 | 0.056%(+1.79)#60 |
| 61. | South Boston | 1.84% | 0.20%(+1.63)#15 | 0.056%(+1.78)#61 |
| 62. | Kempton | 1.79% | 0.024%(+1.76)#1 | 0.056%(+1.73)#62 |
| 63. | Nanuet | 1.69% | 0.18%(+1.51)#8 | 0.056%(+1.63)#63 |
| 64. | Brooklyn Center | 1.67% | 0.067%(+1.60)#2 | 0.056%(+1.61)#64 |
| 65. | Amenia | 1.66% | 0.029%(+1.63)#1 | 0.056%(+1.60)#65 |
| 66. | Vinton | 1.66% | 0.024%(+1.63)#2 | 0.056%(+1.60)#66 |
| 67. | East Hartford | 1.65% | 0.17%(+1.47)#4 | 0.056%(+1.59)#67 |
| 68. | Independence | 1.64% | 0.067%(+1.57)#3 | 0.056%(+1.58)#68 |
| 69. | Lansdowne Borough | 1.61% | 0.037%(+1.57)#3 | 0.056%(+1.55)#69 |
| 70. | Honeygo | 1.61% | 0.26%(+1.35)#12 | 0.056%(+1.55)#70 |
| 71. | Lake Ridge | 1.60% | 0.20%(+1.40)#16 | 0.056%(+1.54)#71 |
| 72. | Rawson | 1.59% | 0.085%(+1.51)#2 | 0.056%(+1.54)#72 |
| 73. | Homestead Borough | 1.58% | 0.037%(+1.55)#4 | 0.056%(+1.53)#73 |
| 74. | Minot Afb | 1.58% | 0.029%(+1.55)#2 | 0.056%(+1.52)#74 |
| 75. | Elkins Park | 1.56% | 0.037%(+1.53)#5 | 0.056%(+1.51)#75 |
| 76. | Columbine | 1.53% | 0.051%(+1.48)#1 | 0.056%(+1.47)#76 |
| 77. | Warminster Heights | 1.49% | 0.037%(+1.46)#6 | 0.056%(+1.44)#77 |
| 78. | Emmitsburg | 1.49% | 0.26%(+1.23)#13 | 0.056%(+1.43)#78 |
| 79. | Sanatoga | 1.48% | 0.037%(+1.45)#7 | 0.056%(+1.43)#79 |
| 80. | Pine Ridge | 1.47% | 0.037%(+1.43)#8 | 0.056%(+1.41)#80 |
| 81. | Belle Haven | 1.43% | 0.20%(+1.23)#17 | 0.056%(+1.38)#81 |
| 82. | Valle Vista | 1.41% | 0.024%(+1.39)#3 | 0.056%(+1.36)#82 |
| 83. | Folcroft Borough | 1.39% | 0.037%(+1.35)#9 | 0.056%(+1.33)#83 |
| 84. | Savage | 1.39% | 0.067%(+1.32)#4 | 0.056%(+1.33)#84 |
| 85. | Mission | 1.38% | 0.025%(+1.36)#1 | 0.056%(+1.33)#85 |
| 86. | Hartwick Seminary | 1.37% | 0.18%(+1.20)#9 | 0.056%(+1.32)#86 |
| 87. | New Market | 1.37% | 0.26%(+1.11)#14 | 0.056%(+1.31)#87 |
| 88. | Raritan Borough | 1.36% | 0.16%(+1.20)#6 | 0.056%(+1.31)#88 |
| 89. | Port Morris | 1.36% | 0.16%(+1.19)#7 | 0.056%(+1.30)#89 |
| 90. | Montgomery Village | 1.36% | 0.26%(+1.10)#15 | 0.056%(+1.30)#90 |
| 91. | Palmetto | 1.35% | 0.085%(+1.27)#5 | 0.056%(+1.30)#91 |
| 92. | Peppermill Village | 1.35% | 0.26%(+1.09)#16 | 0.056%(+1.29)#92 |
| 93. | Iowa Colony | 1.35% | 0.037%(+1.31)#2 | 0.056%(+1.29)#93 |
| 94. | Damascus | 1.32% | 0.26%(+1.07)#17 | 0.056%(+1.27)#94 |
| 95. | Chagrin Falls | 1.31% | 0.085%(+1.23)#3 | 0.056%(+1.26)#95 |
| 96. | Westphalia | 1.31% | 0.26%(+1.05)#18 | 0.056%(+1.25)#96 |
| 97. | Woodmore | 1.30% | 0.26%(+1.04)#19 | 0.056%(+1.25)#97 |
| 98. | Inverness | 1.30% | 0.051%(+1.25)#2 | 0.056%(+1.24)#98 |
| 99. | Pemberton Heights | 1.30% | 0.16%(+1.13)#8 | 0.056%(+1.24)#99 |
| 100. | Fairwood | 1.29% | 0.26%(+1.04)#20 | 0.056%(+1.24)#100 |
Common Questions
What are the Top 10 Cities with the Highest Percentage of Ghanaian Population in the United States?
Top 10 Cities with the Highest Percentage of Ghanaian Population in the United States are:
#1
11.97%
#2
7.22%
#3
6.92%
#4
6.24%
#5
6.14%
#6
6.00%
#7
5.69%
#8
5.56%
#9
5.35%
#10
5.26%
What city has the Highest Percentage of Ghanaian Population in the United States?
Calverton Park has the Highest Percentage of Ghanaian Population in the United States with 11.97%.
What is the Percentage of Ghanaian Population in the United States?
Percentage of Ghanaian Population in the United States is 0.056%.