Cities with the Lowest Poverty Level Among Single Females in the United States
RELATED REPORTS & OPTIONS
Lowest Poverty | Single Female
United States
Compare Cities
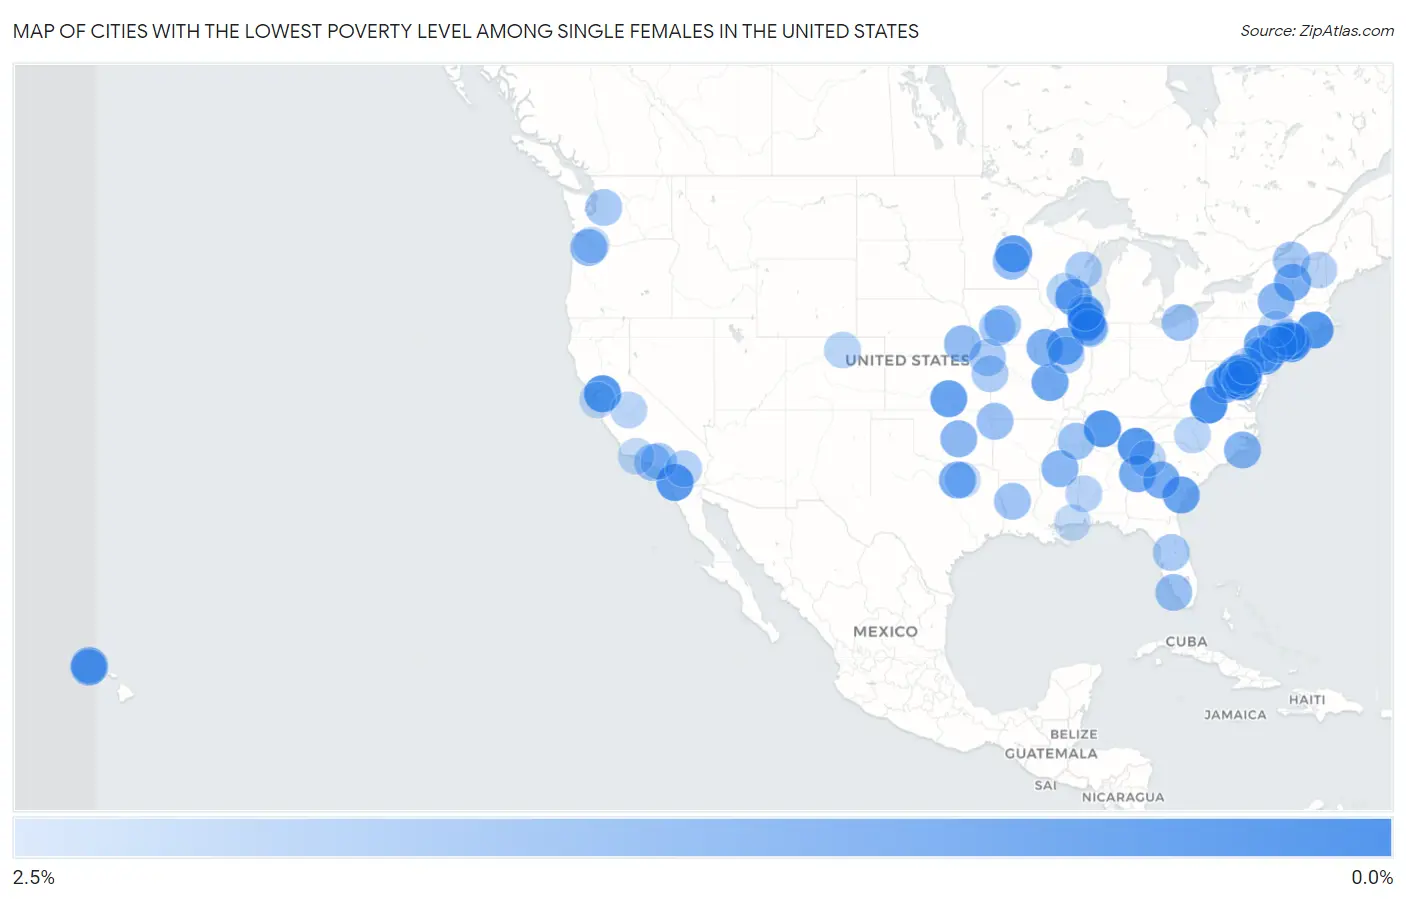
Map of Cities with the Lowest Poverty Level Among Single Females in the United States
2.5%
0.0%
Cities with the Lowest Poverty Level Among Single Females in the United States
| City | Single Female Poverty | vs State | vs National | |
| 1. | Linton Hall | 0.31% | 21.1%(-20.8)#1 | 24.1%(-23.8)#1 |
| 2. | Bryans Road | 0.34% | 16.4%(-16.0)#1 | 24.1%(-23.7)#2 |
| 3. | University Gardens | 0.49% | 22.7%(-22.2)#1 | 24.1%(-23.6)#3 |
| 4. | Timberlake | 0.51% | 21.1%(-20.6)#2 | 24.1%(-23.6)#4 |
| 5. | East Massapequa | 0.55% | 22.7%(-22.2)#2 | 24.1%(-23.5)#5 |
| 6. | Mccaysville | 0.68% | 25.2%(-24.5)#1 | 24.1%(-23.4)#6 |
| 7. | Brentwood | 0.69% | 27.6%(-26.9)#1 | 24.1%(-23.4)#7 |
| 8. | Westerly | 0.69% | 18.9%(-18.2)#1 | 24.1%(-23.4)#8 |
| 9. | Clayton | 0.70% | 20.3%(-19.6)#1 | 24.1%(-23.4)#9 |
| 10. | Harbison Canyon | 0.76% | 20.3%(-19.5)#2 | 24.1%(-23.3)#10 |
| 11. | Forest Lake | 0.84% | 19.9%(-19.0)#1 | 24.1%(-23.2)#11 |
| 12. | Goddard | 0.91% | 24.9%(-24.0)#1 | 24.1%(-23.2)#12 |
| 13. | Ardmore | 0.92% | 24.5%(-23.6)#1 | 24.1%(-23.2)#13 |
| 14. | Pooler | 0.93% | 25.2%(-24.3)#2 | 24.1%(-23.1)#14 |
| 15. | Johnson Creek | 0.94% | 22.6%(-21.7)#1 | 24.1%(-23.1)#15 |
| 16. | Burr Ridge | 0.97% | 23.6%(-22.6)#1 | 24.1%(-23.1)#16 |
| 17. | Mackinaw | 0.97% | 23.6%(-22.6)#2 | 24.1%(-23.1)#17 |
| 18. | Fullerton | 0.97% | 24.5%(-23.5)#2 | 24.1%(-23.1)#18 |
| 19. | Sunset Hills | 1.00% | 25.1%(-24.1)#1 | 24.1%(-23.1)#19 |
| 20. | Hampton | 1.1% | 25.2%(-24.1)#3 | 24.1%(-23.0)#20 |
| 21. | Mitchellville | 1.1% | 16.4%(-15.3)#2 | 24.1%(-23.0)#21 |
| 22. | Davisboro | 1.1% | 25.2%(-24.1)#4 | 24.1%(-23.0)#22 |
| 23. | Coppell | 1.1% | 27.2%(-26.0)#1 | 24.1%(-23.0)#23 |
| 24. | Paramus Borough | 1.1% | 19.6%(-18.5)#1 | 24.1%(-23.0)#24 |
| 25. | Glenn Dale | 1.1% | 16.4%(-15.3)#3 | 24.1%(-22.9)#25 |
| 26. | Ticonderoga | 1.1% | 22.7%(-21.6)#3 | 24.1%(-22.9)#26 |
| 27. | Colesville | 1.2% | 16.4%(-15.2)#4 | 24.1%(-22.9)#27 |
| 28. | Colchester | 1.2% | 23.6%(-22.4)#3 | 24.1%(-22.9)#28 |
| 29. | Deerfield | 1.2% | 23.6%(-22.4)#4 | 24.1%(-22.8)#29 |
| 30. | Brightwood | 1.3% | 21.1%(-19.9)#3 | 24.1%(-22.8)#30 |
| 31. | Newport | 1.3% | 26.6%(-25.3)#1 | 24.1%(-22.8)#31 |
| 32. | Westchester | 1.3% | 23.6%(-22.3)#5 | 24.1%(-22.8)#32 |
| 33. | North Kensington | 1.3% | 16.4%(-15.1)#5 | 24.1%(-22.8)#33 |
| 34. | Duck Hill | 1.3% | 34.9%(-33.6)#1 | 24.1%(-22.8)#34 |
| 35. | Baywood | 1.3% | 22.7%(-21.4)#4 | 24.1%(-22.8)#35 |
| 36. | Canajoharie | 1.3% | 22.7%(-21.4)#5 | 24.1%(-22.7)#36 |
| 37. | Johnson | 1.3% | 29.8%(-28.5)#1 | 24.1%(-22.7)#37 |
| 38. | Aiea | 1.3% | 15.9%(-14.5)#1 | 24.1%(-22.7)#38 |
| 39. | Bethany | 1.4% | 21.4%(-20.0)#1 | 24.1%(-22.7)#39 |
| 40. | Elmont | 1.4% | 22.7%(-21.3)#6 | 24.1%(-22.7)#40 |
| 41. | Hickman | 1.4% | 22.5%(-21.1)#1 | 24.1%(-22.6)#41 |
| 42. | Secaucus | 1.5% | 19.6%(-18.2)#2 | 24.1%(-22.6)#42 |
| 43. | Mendota Heights | 1.5% | 19.9%(-18.4)#2 | 24.1%(-22.6)#43 |
| 44. | Bethpage | 1.5% | 22.7%(-21.2)#7 | 24.1%(-22.6)#44 |
| 45. | Lely Resort | 1.5% | 21.6%(-20.1)#1 | 24.1%(-22.5)#45 |
| 46. | Centerton | 1.6% | 30.8%(-29.2)#1 | 24.1%(-22.5)#46 |
| 47. | Bethel Springs | 1.6% | 27.6%(-26.1)#2 | 24.1%(-22.5)#47 |
| 48. | Pitman Borough | 1.6% | 19.6%(-18.1)#3 | 24.1%(-22.5)#48 |
| 49. | Grimes | 1.6% | 25.4%(-23.9)#1 | 24.1%(-22.5)#49 |
| 50. | Berwyn Heights | 1.6% | 16.4%(-14.8)#6 | 24.1%(-22.5)#50 |
| 51. | Vienna Bend | 1.6% | 34.7%(-33.1)#1 | 24.1%(-22.5)#51 |
| 52. | Grand River | 1.6% | 28.5%(-26.9)#1 | 24.1%(-22.5)#52 |
| 53. | Bloomsbury Borough | 1.6% | 19.6%(-18.0)#4 | 24.1%(-22.4)#53 |
| 54. | Peppermill Village | 1.7% | 16.4%(-14.7)#7 | 24.1%(-22.4)#54 |
| 55. | Crete | 1.7% | 23.6%(-21.9)#6 | 24.1%(-22.4)#55 |
| 56. | Champlain | 1.7% | 22.7%(-21.1)#8 | 24.1%(-22.4)#56 |
| 57. | Ladera Heights | 1.7% | 20.3%(-18.6)#3 | 24.1%(-22.4)#57 |
| 58. | Bellevue Borough | 1.7% | 24.5%(-22.8)#3 | 24.1%(-22.4)#58 |
| 59. | Mascotte | 1.7% | 21.6%(-19.9)#2 | 24.1%(-22.4)#59 |
| 60. | Pensacola Station | 1.7% | 21.6%(-19.9)#3 | 24.1%(-22.4)#60 |
| 61. | Vincent | 1.7% | 20.3%(-18.6)#4 | 24.1%(-22.3)#61 |
| 62. | Snoqualmie | 1.7% | 20.7%(-19.0)#1 | 24.1%(-22.3)#62 |
| 63. | Savannah | 1.7% | 25.1%(-23.3)#2 | 24.1%(-22.3)#63 |
| 64. | Flossmoor | 1.7% | 23.6%(-21.9)#7 | 24.1%(-22.3)#64 |
| 65. | Earlham | 1.8% | 25.4%(-23.7)#2 | 24.1%(-22.3)#65 |
| 66. | Allouez | 1.8% | 22.6%(-20.9)#2 | 24.1%(-22.3)#66 |
| 67. | Lake Hiawatha | 1.8% | 19.6%(-17.9)#5 | 24.1%(-22.3)#67 |
| 68. | Glenside | 1.8% | 24.5%(-22.7)#4 | 24.1%(-22.3)#68 |
| 69. | La Plata | 1.8% | 16.4%(-14.6)#8 | 24.1%(-22.3)#69 |
| 70. | Waipio Acres | 1.8% | 15.9%(-14.1)#2 | 24.1%(-22.3)#70 |
| 71. | Ocean Pointe | 1.8% | 15.9%(-14.1)#3 | 24.1%(-22.3)#71 |
| 72. | Merriam | 1.8% | 24.9%(-23.1)#2 | 24.1%(-22.3)#72 |
| 73. | Ridgefield Borough | 1.8% | 19.6%(-17.8)#6 | 24.1%(-22.3)#73 |
| 74. | Bealeton | 1.8% | 21.1%(-19.3)#4 | 24.1%(-22.3)#74 |
| 75. | Mount Pulaski | 1.8% | 23.6%(-21.8)#8 | 24.1%(-22.3)#75 |
| 76. | Vista Santa Rosa | 1.9% | 20.3%(-18.5)#5 | 24.1%(-22.2)#76 |
| 77. | Highland Park Borough | 1.9% | 19.6%(-17.8)#7 | 24.1%(-22.2)#77 |
| 78. | Lionville | 1.9% | 24.5%(-22.6)#5 | 24.1%(-22.2)#78 |
| 79. | Cascades | 1.9% | 21.1%(-19.3)#5 | 24.1%(-22.2)#79 |
| 80. | Libertyville | 1.9% | 23.6%(-21.7)#9 | 24.1%(-22.2)#80 |
| 81. | Lancaster | 1.9% | 16.3%(-14.4)#1 | 24.1%(-22.2)#81 |
| 82. | Pennington | 1.9% | 31.1%(-29.2)#1 | 24.1%(-22.2)#82 |
| 83. | Lake Arbor | 1.9% | 16.4%(-14.5)#9 | 24.1%(-22.2)#83 |
| 84. | Madera Acres | 1.9% | 20.3%(-18.4)#6 | 24.1%(-22.2)#84 |
| 85. | Granite Quarry | 1.9% | 26.6%(-24.7)#2 | 24.1%(-22.2)#85 |
| 86. | Poynette | 1.9% | 22.6%(-20.7)#3 | 24.1%(-22.2)#86 |
| 87. | West Mayfield Borough | 1.9% | 24.5%(-22.6)#6 | 24.1%(-22.2)#87 |
| 88. | Berthoud | 1.9% | 19.2%(-17.2)#1 | 24.1%(-22.1)#88 |
| 89. | Springdale Borough | 2.0% | 24.5%(-22.5)#7 | 24.1%(-22.1)#89 |
| 90. | Maysville | 2.0% | 25.2%(-23.2)#5 | 24.1%(-22.1)#90 |
| 91. | Scarsdale | 2.0% | 22.7%(-20.8)#9 | 24.1%(-22.1)#91 |
| 92. | Otisville | 2.0% | 22.7%(-20.7)#10 | 24.1%(-22.1)#92 |
| 93. | Fort Hunt | 2.0% | 21.1%(-19.1)#6 | 24.1%(-22.0)#93 |
| 94. | Carpinteria | 2.0% | 20.3%(-18.3)#7 | 24.1%(-22.0)#94 |
| 95. | Foster City | 2.0% | 20.3%(-18.3)#8 | 24.1%(-22.0)#95 |
| 96. | Iselin | 2.0% | 19.6%(-17.6)#8 | 24.1%(-22.0)#96 |
| 97. | Timonium | 2.1% | 16.4%(-14.3)#10 | 24.1%(-22.0)#97 |
| 98. | Sachse | 2.1% | 27.2%(-25.1)#2 | 24.1%(-22.0)#98 |
| 99. | Lake Shore | 2.1% | 20.7%(-18.7)#2 | 24.1%(-22.0)#99 |
| 100. | St Martin | 2.1% | 34.9%(-32.8)#2 | 24.1%(-22.0)#100 |
Common Questions
What are the Top 10 Cities with the Lowest Poverty Level Among Single Females in the United States?
Top 10 Cities with the Lowest Poverty Level Among Single Females in the United States are:
#1
0.31%
#2
0.34%
#3
0.49%
#4
0.51%
#5
0.55%
#6
0.68%
#7
0.69%
#8
0.69%
#9
0.70%
#10
0.76%
What city has the Lowest Poverty Level Among Single Females in the United States?
Linton Hall has the Lowest Poverty Level Among Single Females in the United States with 0.31%.
What is the Poverty Level Among Single Females in the United States?
Poverty Level Among Single Females in the United States is 24.1%.