Cities with the Highest Percentage of Chinese Population in the United States
RELATED REPORTS & OPTIONS
Chinese
United States
Compare Cities
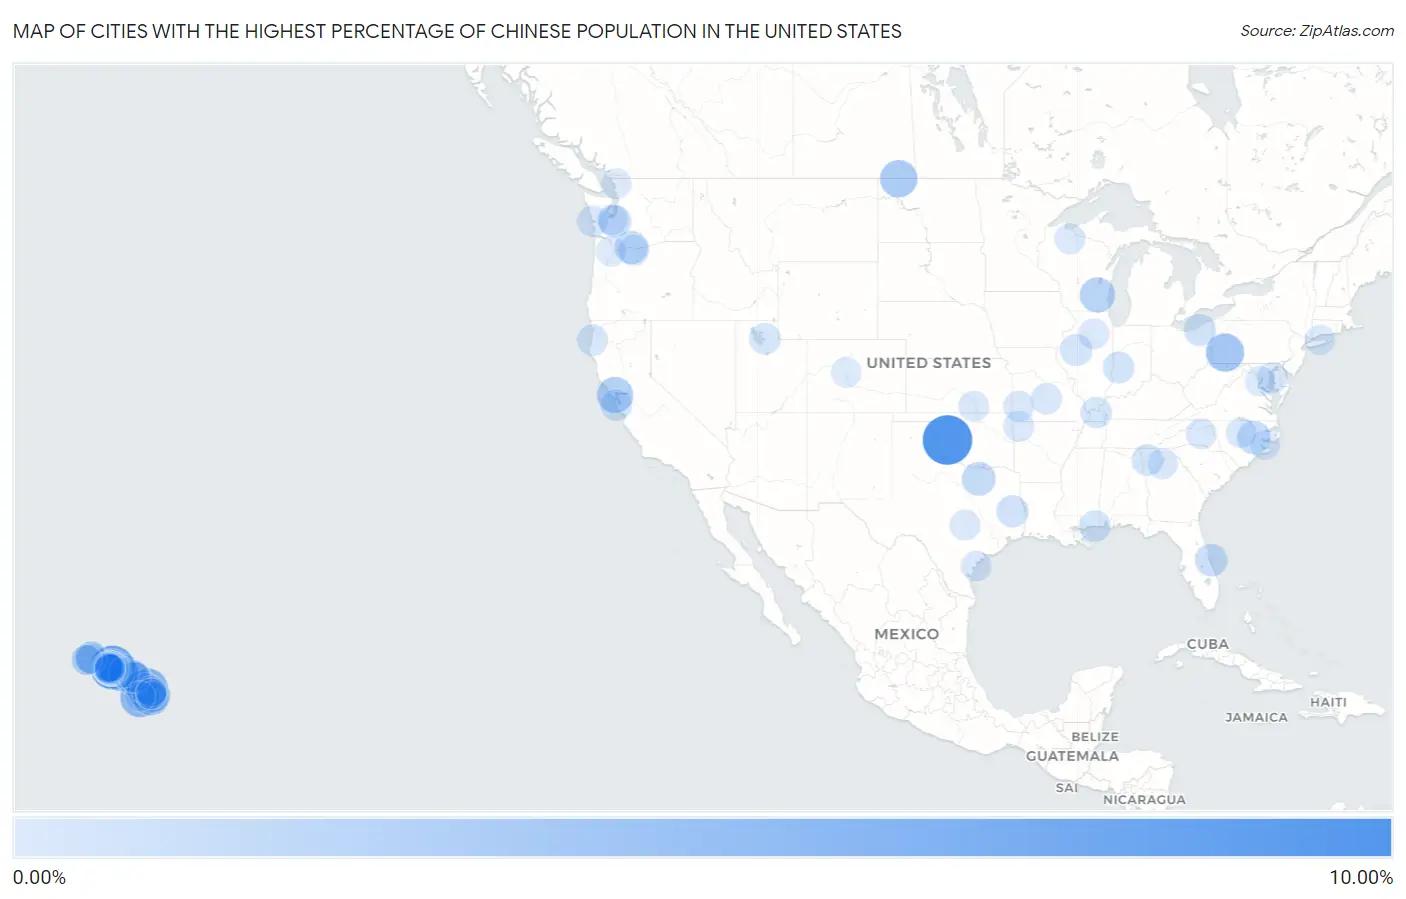
Map of Cities with the Highest Percentage of Chinese Population in the United States
0.00%
10.00%
Cities with the Highest Percentage of Chinese Population in the United States
| City | Chinese | vs State | vs National | |
| 1. | Foss | 8.28% | 0.00043%(+8.28)#1 | 0.0061%(+8.27)#1 |
| 2. | Waiahole-Waikane | 6.68% | 0.72%(+5.97)#1 | 0.0061%(+6.68)#2 |
| 3. | Kahaluu | 5.98% | 0.72%(+5.27)#2 | 0.0061%(+5.98)#3 |
| 4. | Paauilo | 4.56% | 0.72%(+3.84)#3 | 0.0061%(+4.56)#4 |
| 5. | Aiea | 4.14% | 0.72%(+3.42)#4 | 0.0061%(+4.13)#5 |
| 6. | Captain Cook | 4.04% | 0.72%(+3.32)#5 | 0.0061%(+4.03)#6 |
| 7. | Grapeville | 3.50% | 0.0010%(+3.50)#1 | 0.0061%(+3.49)#7 |
| 8. | Mountain View | 3.39% | 0.72%(+2.67)#6 | 0.0061%(+3.39)#8 |
| 9. | Maunaloa | 3.23% | 0.72%(+2.51)#7 | 0.0061%(+3.22)#9 |
| 10. | Portal | 3.08% | 0.00077%(+3.08)#1 | 0.0061%(+3.07)#10 |
| 11. | Santa Venetia | 2.62% | 0.0065%(+2.61)#1 | 0.0061%(+2.61)#11 |
| 12. | Heeia | 2.61% | 0.72%(+1.89)#8 | 0.0061%(+2.61)#12 |
| 13. | Hustisford | 2.29% | 0.0016%(+2.28)#1 | 0.0061%(+2.28)#13 |
| 14. | Waikele | 2.15% | 0.72%(+1.43)#9 | 0.0061%(+2.14)#14 |
| 15. | Keokea | 1.88% | 0.72%(+1.16)#10 | 0.0061%(+1.87)#15 |
| 16. | Kaneohe | 1.77% | 0.72%(+1.06)#11 | 0.0061%(+1.77)#16 |
| 17. | Pearl City | 1.67% | 0.72%(+0.951)#12 | 0.0061%(+1.66)#17 |
| 18. | Savannah | 1.62% | 0.0023%(+1.62)#1 | 0.0061%(+1.62)#18 |
| 19. | Mililani Town | 1.57% | 0.72%(+0.851)#13 | 0.0061%(+1.56)#19 |
| 20. | Farmville | 1.43% | 0.0032%(+1.43)#1 | 0.0061%(+1.42)#20 |
| 21. | Mosier | 1.43% | 0.016%(+1.41)#1 | 0.0061%(+1.42)#21 |
| 22. | Waipio | 1.37% | 0.72%(+0.657)#14 | 0.0061%(+1.37)#22 |
| 23. | Wailuku | 1.22% | 0.72%(+0.506)#15 | 0.0061%(+1.22)#23 |
| 24. | Cocoa Beach | 1.22% | 0.0031%(+1.21)#1 | 0.0061%(+1.21)#24 |
| 25. | East Honolulu | 1.20% | 0.72%(+0.485)#16 | 0.0061%(+1.20)#25 |
| 26. | Royal Kunia | 1.19% | 0.72%(+0.468)#17 | 0.0061%(+1.18)#26 |
| 27. | Waimanalo | 1.17% | 0.72%(+0.449)#18 | 0.0061%(+1.16)#27 |
| 28. | Kapaa | 1.16% | 0.72%(+0.445)#19 | 0.0061%(+1.16)#28 |
| 29. | Mililani Mauka | 1.12% | 0.72%(+0.406)#20 | 0.0061%(+1.12)#29 |
| 30. | Halawa | 1.09% | 0.72%(+0.372)#21 | 0.0061%(+1.08)#30 |
| 31. | Roy | 1.09% | 0.0081%(+1.08)#1 | 0.0061%(+1.08)#31 |
| 32. | Hawi | 1.08% | 0.72%(+0.367)#22 | 0.0061%(+1.08)#32 |
| 33. | East Kapolei | 1.07% | 0.72%(+0.357)#23 | 0.0061%(+1.07)#33 |
| 34. | Cresson Borough | 1.05% | 0.0010%(+1.05)#2 | 0.0061%(+1.04)#34 |
| 35. | Ewa Villages | 1.04% | 0.72%(+0.321)#24 | 0.0061%(+1.03)#35 |
| 36. | Waimea Cdp Kauai County | 1.03% | 0.72%(+0.308)#25 | 0.0061%(+1.02)#36 |
| 37. | Gates Mills | 1.02% | 0.00094%(+1.02)#1 | 0.0061%(+1.01)#37 |
| 38. | Huntington | 1.00% | 0.0023%(+1.00)#2 | 0.0061%(+0.997)#38 |
| 39. | Kapolei | 1.00% | 0.72%(+0.278)#26 | 0.0061%(+0.989)#39 |
| 40. | Kailua Cdp Honolulu County | 0.98% | 0.72%(+0.262)#27 | 0.0061%(+0.973)#40 |
| 41. | Pleasantville Borough Venango County | 0.90% | 0.0010%(+0.900)#3 | 0.0061%(+0.895)#41 |
| 42. | Half Moon Bay | 0.89% | 0.0065%(+0.887)#2 | 0.0061%(+0.888)#42 |
| 43. | Bryant | 0.89% | 0.00074%(+0.888)#1 | 0.0061%(+0.883)#43 |
| 44. | Wahiawa | 0.84% | 0.72%(+0.128)#28 | 0.0061%(+0.839)#44 |
| 45. | Makawao | 0.84% | 0.72%(+0.127)#29 | 0.0061%(+0.838)#45 |
| 46. | Anahola | 0.84% | 0.72%(+0.124)#30 | 0.0061%(+0.835)#46 |
| 47. | Waimalu | 0.82% | 0.72%(+0.101)#31 | 0.0061%(+0.812)#47 |
| 48. | Ahuimanu | 0.82% | 0.72%(+0.100)#32 | 0.0061%(+0.811)#48 |
| 49. | Harmony | 0.81% | 0.0013%(+0.813)#1 | 0.0061%(+0.808)#49 |
| 50. | Kaysville | 0.78% | 0.0097%(+0.770)#1 | 0.0061%(+0.773)#50 |
| 51. | Urban Honolulu | 0.78% | 0.72%(+0.061)#33 | 0.0061%(+0.772)#51 |
| 52. | Ocean Springs | 0.75% | 0.011%(+0.744)#1 | 0.0061%(+0.749)#52 |
| 53. | Honokaa | 0.74% | 0.72%(+0.025)#34 | 0.0061%(+0.736)#53 |
| 54. | Hawaiian Paradise Park | 0.72% | 0.72%(+0.004)#35 | 0.0061%(+0.715)#54 |
| 55. | Massac | 0.70% | 0.0013%(+0.698)#1 | 0.0061%(+0.693)#55 |
| 56. | Fern Acres | 0.67% | 0.72%(-0.043)#36 | 0.0061%(+0.668)#56 |
| 57. | Shannon | 0.66% | 0.0026%(+0.655)#1 | 0.0061%(+0.651)#57 |
| 58. | West Loch Estate | 0.63% | 0.72%(-0.083)#37 | 0.0061%(+0.628)#58 |
| 59. | Ocean Shores | 0.63% | 0.0081%(+0.621)#2 | 0.0061%(+0.623)#59 |
| 60. | Mckinleyville | 0.63% | 0.0065%(+0.620)#3 | 0.0061%(+0.621)#60 |
| 61. | Ewa Beach | 0.62% | 0.72%(-0.097)#38 | 0.0061%(+0.614)#61 |
| 62. | Ewa Gentry | 0.62% | 0.72%(-0.099)#39 | 0.0061%(+0.612)#62 |
| 63. | Olinda | 0.59% | 0.72%(-0.128)#40 | 0.0061%(+0.583)#63 |
| 64. | Hilo | 0.56% | 0.72%(-0.152)#41 | 0.0061%(+0.559)#64 |
| 65. | Chester | 0.56% | 0.0021%(+0.559)#1 | 0.0061%(+0.555)#65 |
| 66. | Waynesville | 0.56% | 0.0030%(+0.555)#1 | 0.0061%(+0.552)#66 |
| 67. | Kaaawa | 0.56% | 0.72%(-0.161)#42 | 0.0061%(+0.550)#67 |
| 68. | Chenoweth | 0.52% | 0.016%(+0.508)#2 | 0.0061%(+0.518)#68 |
| 69. | Whitmore Village | 0.51% | 0.72%(-0.206)#43 | 0.0061%(+0.506)#69 |
| 70. | Nisqually Indian Community | 0.51% | 0.0081%(+0.498)#3 | 0.0061%(+0.500)#70 |
| 71. | Lowell | 0.50% | 0.0026%(+0.497)#1 | 0.0061%(+0.494)#71 |
| 72. | Glidden | 0.49% | 0.0016%(+0.491)#2 | 0.0061%(+0.487)#72 |
| 73. | Golden City | 0.49% | 0.0030%(+0.487)#2 | 0.0061%(+0.484)#73 |
| 74. | Honomu | 0.48% | 0.72%(-0.233)#44 | 0.0061%(+0.478)#74 |
| 75. | Makaha | 0.48% | 0.72%(-0.239)#45 | 0.0061%(+0.472)#75 |
| 76. | Kaumakani | 0.47% | 0.72%(-0.250)#46 | 0.0061%(+0.461)#76 |
| 77. | Ocean Pointe | 0.45% | 0.72%(-0.272)#47 | 0.0061%(+0.439)#77 |
| 78. | Aransas Pass | 0.44% | 0.0023%(+0.433)#3 | 0.0061%(+0.430)#78 |
| 79. | Sugar Hill | 0.43% | 0.0026%(+0.430)#2 | 0.0061%(+0.427)#79 |
| 80. | Naplate | 0.42% | 0.00074%(+0.419)#2 | 0.0061%(+0.413)#80 |
| 81. | Belle Plaine | 0.42% | 0.00068%(+0.415)#1 | 0.0061%(+0.409)#81 |
| 82. | Bethlehem | 0.41% | 0.0032%(+0.403)#2 | 0.0061%(+0.401)#82 |
| 83. | Rolesville | 0.40% | 0.0032%(+0.399)#3 | 0.0061%(+0.396)#83 |
| 84. | Maunawili | 0.39% | 0.72%(-0.330)#48 | 0.0061%(+0.381)#84 |
| 85. | Volente | 0.39% | 0.0023%(+0.383)#4 | 0.0061%(+0.379)#85 |
| 86. | Geneva | 0.38% | 0.0081%(+0.374)#4 | 0.0061%(+0.376)#86 |
| 87. | Leadville | 0.38% | 0.0019%(+0.379)#1 | 0.0061%(+0.375)#87 |
| 88. | Grantsboro | 0.38% | 0.0032%(+0.376)#4 | 0.0061%(+0.373)#88 |
| 89. | Kualapuu | 0.37% | 0.72%(-0.346)#49 | 0.0061%(+0.365)#89 |
| 90. | Wailua | 0.37% | 0.72%(-0.348)#50 | 0.0061%(+0.363)#90 |
| 91. | Kahaluu Keauhou | 0.36% | 0.72%(-0.360)#51 | 0.0061%(+0.351)#91 |
| 92. | Paukaa | 0.36% | 0.72%(-0.361)#52 | 0.0061%(+0.350)#92 |
| 93. | Waianae | 0.35% | 0.72%(-0.368)#53 | 0.0061%(+0.343)#93 |
| 94. | Nanakuli | 0.35% | 0.72%(-0.370)#54 | 0.0061%(+0.342)#94 |
| 95. | Hayfield | 0.34% | 0.0027%(+0.339)#1 | 0.0061%(+0.336)#95 |
| 96. | Shoreham | 0.34% | 0.0012%(+0.337)#1 | 0.0061%(+0.332)#96 |
| 97. | Cedar Hills | 0.33% | 0.016%(+0.315)#3 | 0.0061%(+0.324)#97 |
| 98. | Kekaha | 0.32% | 0.72%(-0.400)#55 | 0.0061%(+0.311)#98 |
| 99. | Waipahu | 0.32% | 0.72%(-0.401)#56 | 0.0061%(+0.310)#99 |
| 100. | Waipio Acres | 0.32% | 0.72%(-0.402)#57 | 0.0061%(+0.309)#100 |
Common Questions
What are the Top 10 Cities with the Highest Percentage of Chinese Population in the United States?
Top 10 Cities with the Highest Percentage of Chinese Population in the United States are:
#1
8.28%
#2
5.98%
#3
4.56%
#4
4.14%
#5
4.04%
#6
3.50%
#7
3.39%
#8
3.23%
#9
3.08%
#10
2.62%
What city has the Highest Percentage of Chinese Population in the United States?
Foss has the Highest Percentage of Chinese Population in the United States with 8.28%.
What is the Percentage of Chinese Population in the United States?
Percentage of Chinese Population in the United States is 0.0061%.