Cities with the Most Immigrants from Bangladesh in the United States
RELATED REPORTS & OPTIONS
Bangladesh
United States
Compare Cities
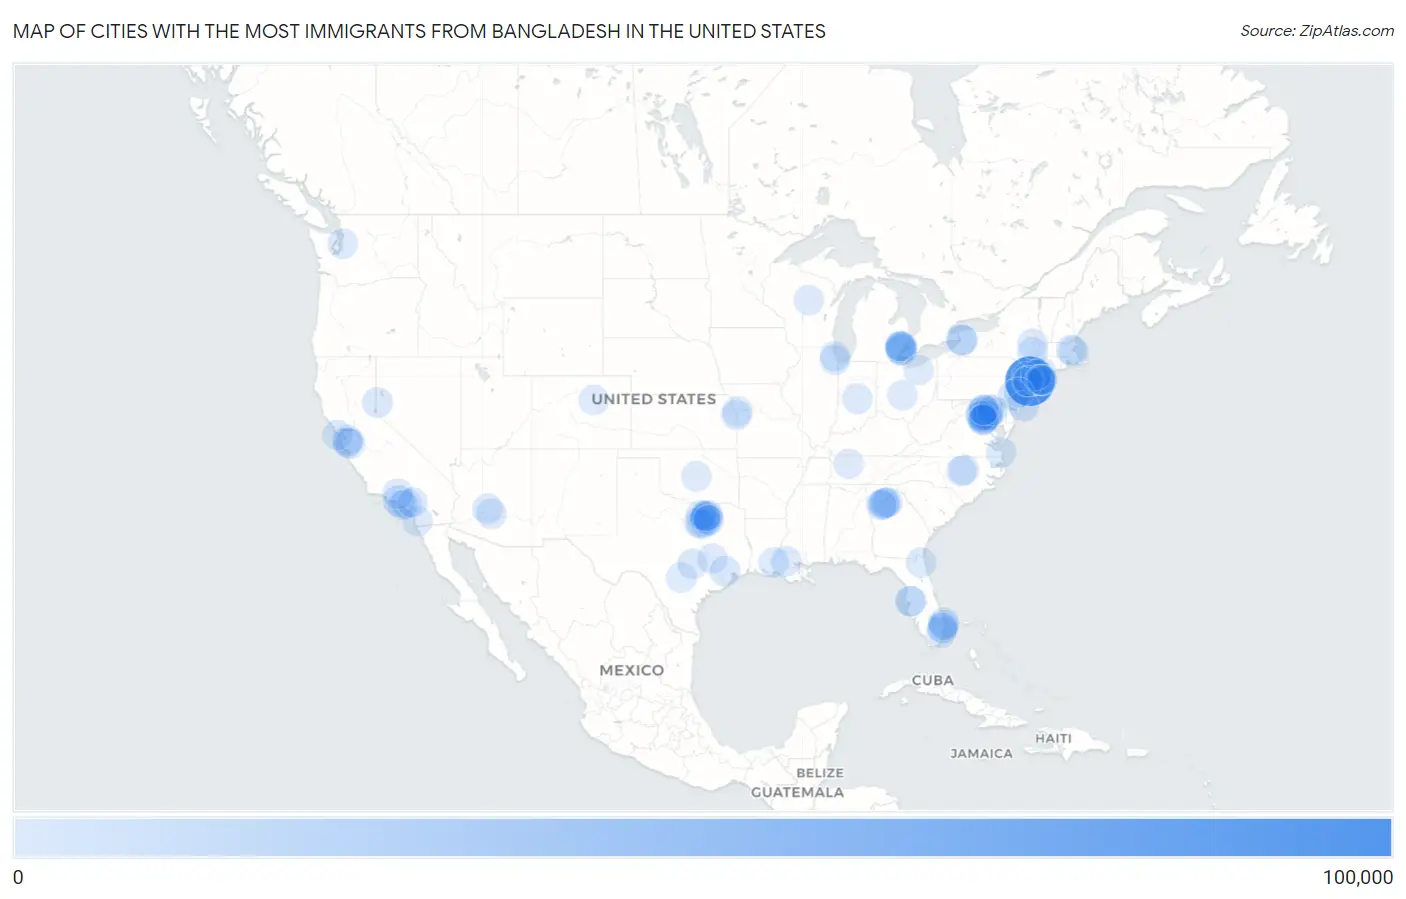
Map of Cities with the Most Immigrants from Bangladesh in the United States
0
100,000
Cities with the Most Immigrants from Bangladesh in the United States
| City | Bangladesh | vs State | vs National | |
| 1. | New York | 99,472 | 117,288(84.81%)#1 | 271,479(36.64%)#1 |
| 2. | Los Angeles | 6,001 | 18,366(32.67%)#1 | 271,479(2.21%)#2 |
| 3. | Buffalo | 4,910 | 117,288(4.19%)#2 | 271,479(1.81%)#3 |
| 4. | Hamtramck | 4,897 | 18,065(27.11%)#1 | 271,479(1.80%)#4 |
| 5. | Warren | 4,495 | 18,065(24.88%)#2 | 271,479(1.66%)#5 |
| 6. | Detroit | 4,439 | 18,065(24.57%)#3 | 271,479(1.64%)#6 |
| 7. | Paterson | 4,238 | 14,405(29.42%)#1 | 271,479(1.56%)#7 |
| 8. | Philadelphia | 2,914 | 8,772(33.22%)#1 | 271,479(1.07%)#8 |
| 9. | Houston | 1,554 | 16,549(9.39%)#1 | 271,479(0.57%)#9 |
| 10. | Irving | 1,332 | 16,549(8.05%)#2 | 271,479(0.49%)#10 |
| 11. | Atlantic City | 1,264 | 14,405(8.77%)#2 | 271,479(0.47%)#11 |
| 12. | Reno | 955 | 1,128(84.66%)#1 | 271,479(0.35%)#12 |
| 13. | Sterling Heights | 951 | 18,065(5.26%)#4 | 271,479(0.35%)#13 |
| 14. | Arlington | 932 | 12,049(7.74%)#1 | 271,479(0.34%)#14 |
| 15. | Lansdale Borough | 931 | 8,772(10.61%)#2 | 271,479(0.34%)#15 |
| 16. | Silver Spring | 860 | 7,124(12.07%)#1 | 271,479(0.32%)#16 |
| 17. | Fremont | 859 | 18,366(4.68%)#2 | 271,479(0.32%)#17 |
| 18. | Indianapolis | 847 | 1,942(43.61%)#1 | 271,479(0.31%)#18 |
| 19. | Sterling | 783 | 12,049(6.50%)#2 | 271,479(0.29%)#19 |
| 20. | Plano | 748 | 16,549(4.52%)#3 | 271,479(0.28%)#20 |
| 21. | College Station | 746 | 16,549(4.51%)#4 | 271,479(0.27%)#21 |
| 22. | Oklahoma City | 729 | 1,320(55.23%)#1 | 271,479(0.27%)#22 |
| 23. | Chandler | 722 | 2,425(29.77%)#1 | 271,479(0.27%)#23 |
| 24. | San Antonio | 715 | 16,549(4.32%)#5 | 271,479(0.26%)#24 |
| 25. | Jacksonville | 712 | 13,053(5.45%)#1 | 271,479(0.26%)#25 |
| 26. | Dallas | 708 | 16,549(4.28%)#6 | 271,479(0.26%)#26 |
| 27. | Mckinney | 699 | 16,549(4.22%)#7 | 271,479(0.26%)#27 |
| 28. | Bridgeport | 693 | 3,362(20.61%)#1 | 271,479(0.26%)#28 |
| 29. | Chicago | 625 | 2,731(22.89%)#1 | 271,479(0.23%)#29 |
| 30. | Baton Rouge | 618 | 1,446(42.74%)#1 | 271,479(0.23%)#30 |
| 31. | Doraville | 601 | 7,441(8.08%)#1 | 271,479(0.22%)#31 |
| 32. | San Jose | 583 | 18,366(3.17%)#3 | 271,479(0.21%)#32 |
| 33. | Phoenix | 578 | 2,425(23.84%)#2 | 271,479(0.21%)#33 |
| 34. | Woodbridge | 574 | 12,049(4.76%)#3 | 271,479(0.21%)#34 |
| 35. | Kansas City | 553 | 1,194(46.31%)#1 | 271,479(0.20%)#35 |
| 36. | Boston | 548 | 4,660(11.76%)#1 | 271,479(0.20%)#36 |
| 37. | Columbus | 532 | 2,091(25.44%)#1 | 271,479(0.20%)#37 |
| 38. | Newark | 529 | 14,405(3.67%)#3 | 271,479(0.19%)#38 |
| 39. | Anaheim | 514 | 18,366(2.80%)#4 | 271,479(0.19%)#39 |
| 40. | San Diego | 500 | 18,366(2.72%)#5 | 271,479(0.18%)#40 |
| 41. | Fort Worth | 497 | 16,549(3.00%)#8 | 271,479(0.18%)#41 |
| 42. | Davie | 496 | 13,053(3.80%)#2 | 271,479(0.18%)#42 |
| 43. | Arlington | 491 | 16,549(2.97%)#9 | 271,479(0.18%)#43 |
| 44. | Hicksville | 487 | 117,288(0.42%)#3 | 271,479(0.18%)#44 |
| 45. | Palm Springs | 486 | 13,053(3.72%)#3 | 271,479(0.18%)#45 |
| 46. | Cambridge | 484 | 4,660(10.39%)#2 | 271,479(0.18%)#46 |
| 47. | Merrifield | 482 | 12,049(4.00%)#4 | 271,479(0.18%)#47 |
| 48. | Troy | 475 | 18,065(2.63%)#5 | 271,479(0.17%)#48 |
| 49. | Jersey City | 470 | 14,405(3.26%)#4 | 271,479(0.17%)#49 |
| 50. | Cheektowaga | 450 | 117,288(0.38%)#4 | 271,479(0.17%)#50 |
| 51. | Overland Park | 441 | 1,150(38.35%)#1 | 271,479(0.16%)#51 |
| 52. | Austin | 439 | 16,549(2.65%)#10 | 271,479(0.16%)#52 |
| 53. | Stamford | 424 | 3,362(12.61%)#2 | 271,479(0.16%)#53 |
| 54. | Columbia | 418 | 7,124(5.87%)#2 | 271,479(0.15%)#54 |
| 55. | Santa Clarita | 408 | 18,366(2.22%)#6 | 271,479(0.15%)#55 |
| 56. | Springfield | 408 | 12,049(3.39%)#5 | 271,479(0.15%)#56 |
| 57. | San Francisco | 406 | 18,366(2.21%)#7 | 271,479(0.15%)#57 |
| 58. | Alexandria | 405 | 12,049(3.36%)#6 | 271,479(0.15%)#58 |
| 59. | Allen | 404 | 16,549(2.44%)#11 | 271,479(0.15%)#59 |
| 60. | Brentwood | 402 | 117,288(0.34%)#5 | 271,479(0.15%)#60 |
| 61. | Virginia Beach | 397 | 12,049(3.29%)#7 | 271,479(0.15%)#61 |
| 62. | Chantilly | 396 | 12,049(3.29%)#8 | 271,479(0.15%)#62 |
| 63. | Seattle | 395 | 1,536(25.72%)#1 | 271,479(0.15%)#63 |
| 64. | Nashville | 393 | 931(42.21%)#1 | 271,479(0.14%)#64 |
| 65. | Washington | 381 | 381(100.00%)#1 | 271,479(0.14%)#65 |
| 66. | Woodlawn Cdp Baltimore County | 380 | 7,124(5.33%)#3 | 271,479(0.14%)#66 |
| 67. | Denton | 376 | 16,549(2.27%)#12 | 271,479(0.14%)#67 |
| 68. | Germantown | 368 | 7,124(5.17%)#4 | 271,479(0.14%)#68 |
| 69. | Hudson | 368 | 117,288(0.31%)#6 | 271,479(0.14%)#69 |
| 70. | Carrollton | 366 | 16,549(2.21%)#13 | 271,479(0.13%)#70 |
| 71. | Albany | 357 | 117,288(0.30%)#7 | 271,479(0.13%)#71 |
| 72. | Aurora | 349 | 1,091(31.99%)#1 | 271,479(0.13%)#72 |
| 73. | Cary | 347 | 1,797(19.31%)#1 | 271,479(0.13%)#73 |
| 74. | Boca Raton | 346 | 13,053(2.65%)#4 | 271,479(0.13%)#74 |
| 75. | Raleigh | 337 | 1,797(18.75%)#2 | 271,479(0.12%)#75 |
| 76. | Sunnyvale | 330 | 18,366(1.80%)#8 | 271,479(0.12%)#76 |
| 77. | East Lake Orient Park | 330 | 13,053(2.53%)#5 | 271,479(0.12%)#77 |
| 78. | Frisco | 323 | 16,549(1.95%)#14 | 271,479(0.12%)#78 |
| 79. | Long Beach | 322 | 18,366(1.75%)#9 | 271,479(0.12%)#79 |
| 80. | Norcross | 322 | 7,441(4.33%)#2 | 271,479(0.12%)#80 |
| 81. | Deer Park | 320 | 117,288(0.27%)#8 | 271,479(0.12%)#81 |
| 82. | Sunset | 319 | 1,446(22.06%)#2 | 271,479(0.12%)#82 |
| 83. | Roebling | 315 | 14,405(2.19%)#5 | 271,479(0.12%)#83 |
| 84. | Glen Burnie | 314 | 7,124(4.41%)#5 | 271,479(0.12%)#84 |
| 85. | Ronkonkoma | 311 | 117,288(0.27%)#9 | 271,479(0.11%)#85 |
| 86. | Chamblee | 308 | 7,441(4.14%)#3 | 271,479(0.11%)#86 |
| 87. | Riverside | 304 | 18,366(1.66%)#10 | 271,479(0.11%)#87 |
| 88. | Centreville | 304 | 12,049(2.52%)#9 | 271,479(0.11%)#88 |
| 89. | Lawrenceville | 301 | 7,441(4.05%)#4 | 271,479(0.11%)#89 |
| 90. | Weston | 298 | 1,015(29.36%)#1 | 271,479(0.11%)#90 |
| 91. | Atlanta | 296 | 7,441(3.98%)#5 | 271,479(0.11%)#91 |
| 92. | Gaithersburg | 284 | 7,124(3.99%)#6 | 271,479(0.10%)#92 |
| 93. | Tampa | 283 | 13,053(2.17%)#6 | 271,479(0.10%)#93 |
| 94. | Deerfield Beach | 283 | 13,053(2.17%)#7 | 271,479(0.10%)#94 |
| 95. | Dale City | 282 | 12,049(2.34%)#10 | 271,479(0.10%)#95 |
| 96. | Lorton | 280 | 12,049(2.32%)#11 | 271,479(0.10%)#96 |
| 97. | Garland | 277 | 16,549(1.67%)#15 | 271,479(0.10%)#97 |
| 98. | Boynton Beach | 277 | 13,053(2.12%)#8 | 271,479(0.10%)#98 |
| 99. | Skokie | 275 | 2,731(10.07%)#2 | 271,479(0.10%)#99 |
| 100. | Strongsville | 274 | 2,091(13.10%)#2 | 271,479(0.10%)#100 |
Common Questions
What are the Top 10 Cities with the Most Immigrants from Bangladesh in the United States?
Top 10 Cities with the Most Immigrants from Bangladesh in the United States are:
What city has the Most Immigrants from Bangladesh in the United States?
New York has the Most Immigrants from Bangladesh in the United States with 99,472.
What is the Total Immigrants from Bangladesh in the United States?
Total Immigrants from Bangladesh in the United States is 271,479.