Cities with the Most Immigrants from Uruguay in the United States
RELATED REPORTS & OPTIONS
Uruguay
United States
Compare Cities
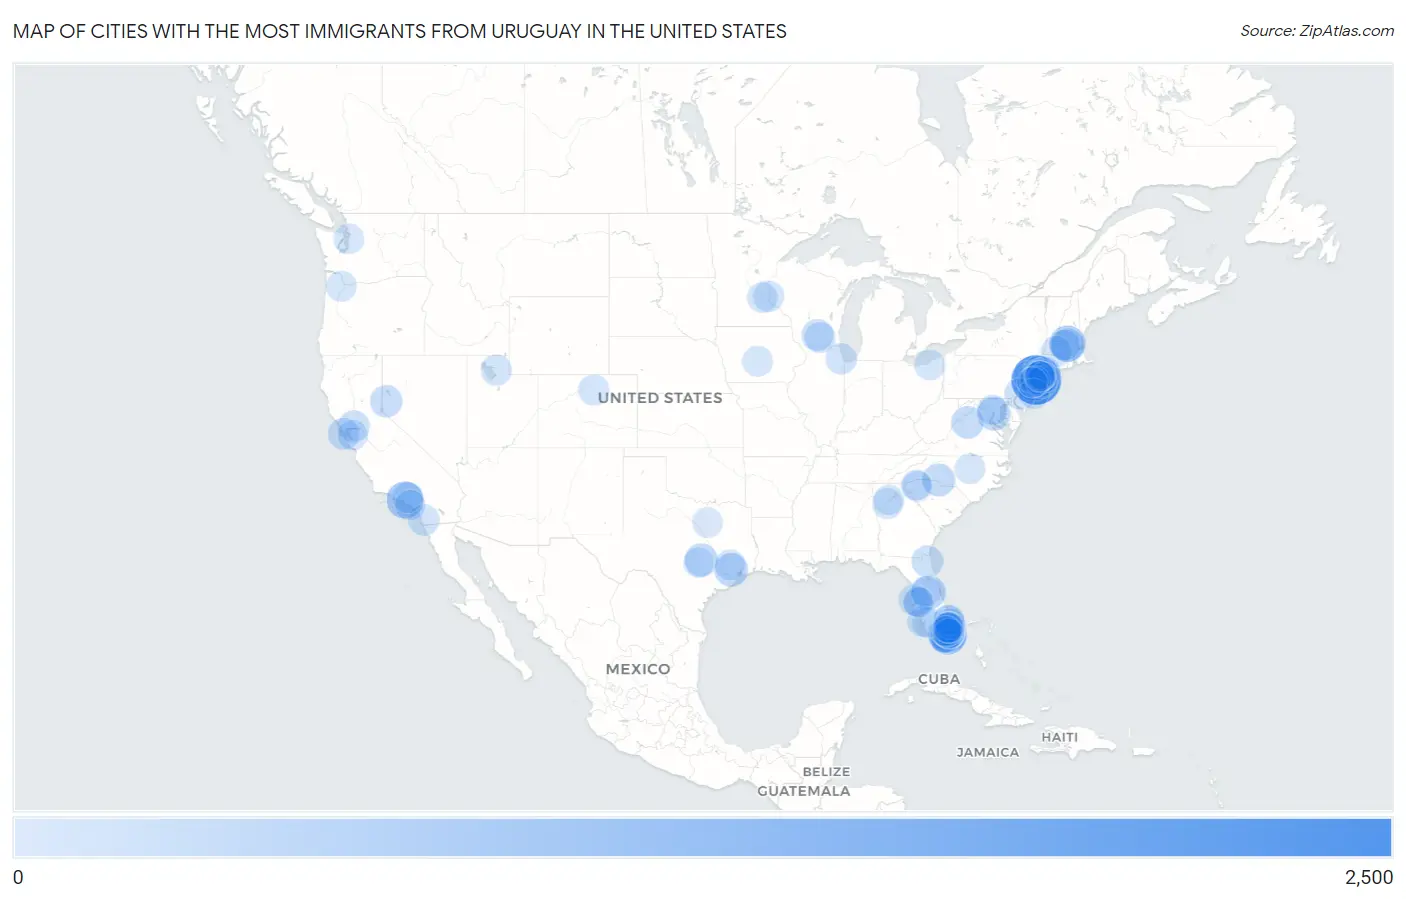
Map of Cities with the Most Immigrants from Uruguay in the United States
0
2,500
Cities with the Most Immigrants from Uruguay in the United States
| City | Uruguay | vs State | vs National | |
| 1. | New York | 2,402 | 5,566(43.15%)#1 | 51,485(4.67%)#1 |
| 2. | Elizabeth | 1,140 | 6,972(16.35%)#1 | 51,485(2.21%)#2 |
| 3. | Miami | 1,104 | 14,809(7.45%)#1 | 51,485(2.14%)#3 |
| 4. | Los Angeles | 860 | 3,811(22.57%)#1 | 51,485(1.67%)#4 |
| 5. | Fitchburg | 773 | 2,282(33.87%)#1 | 51,485(1.50%)#5 |
| 6. | Miami Beach | 644 | 14,809(4.35%)#2 | 51,485(1.25%)#6 |
| 7. | Newark | 620 | 6,972(8.89%)#2 | 51,485(1.20%)#7 |
| 8. | Hollywood | 569 | 14,809(3.84%)#3 | 51,485(1.11%)#8 |
| 9. | Horizon West | 503 | 14,809(3.40%)#4 | 51,485(0.98%)#9 |
| 10. | Houston | 465 | 2,774(16.76%)#1 | 51,485(0.90%)#10 |
| 11. | Washington | 454 | 454(100.00%)#1 | 51,485(0.88%)#11 |
| 12. | Leominster | 440 | 2,282(19.28%)#2 | 51,485(0.85%)#12 |
| 13. | Pflugerville | 412 | 2,774(14.85%)#2 | 51,485(0.80%)#13 |
| 14. | Charlotte | 384 | 998(38.48%)#1 | 51,485(0.75%)#14 |
| 15. | Kearny | 359 | 6,972(5.15%)#3 | 51,485(0.70%)#15 |
| 16. | Harrisonburg | 347 | 1,223(28.37%)#1 | 51,485(0.67%)#16 |
| 17. | Sparks | 307 | 599(51.25%)#1 | 51,485(0.60%)#17 |
| 18. | Hallandale Beach | 276 | 14,809(1.86%)#5 | 51,485(0.54%)#18 |
| 19. | North Miami Beach | 270 | 14,809(1.82%)#6 | 51,485(0.52%)#19 |
| 20. | Kendall West | 258 | 14,809(1.74%)#7 | 51,485(0.50%)#20 |
| 21. | Jacksonville | 255 | 14,809(1.72%)#8 | 51,485(0.50%)#21 |
| 22. | Fairfield | 251 | 3,811(6.59%)#2 | 51,485(0.49%)#22 |
| 23. | San Francisco | 250 | 3,811(6.56%)#3 | 51,485(0.49%)#23 |
| 24. | Tamiami | 246 | 14,809(1.66%)#9 | 51,485(0.48%)#24 |
| 25. | Madison | 244 | 551(44.28%)#1 | 51,485(0.47%)#25 |
| 26. | Long Beach | 242 | 5,566(4.35%)#2 | 51,485(0.47%)#26 |
| 27. | Hialeah | 234 | 14,809(1.58%)#10 | 51,485(0.45%)#27 |
| 28. | Doral | 223 | 14,809(1.51%)#11 | 51,485(0.43%)#28 |
| 29. | Pembroke Pines | 217 | 14,809(1.47%)#12 | 51,485(0.42%)#29 |
| 30. | Stamford | 213 | 1,076(19.80%)#1 | 51,485(0.41%)#30 |
| 31. | Philadelphia | 208 | 1,061(19.60%)#1 | 51,485(0.40%)#31 |
| 32. | Palmetto Estates | 206 | 14,809(1.39%)#13 | 51,485(0.40%)#32 |
| 33. | San Diego | 202 | 3,811(5.30%)#4 | 51,485(0.39%)#33 |
| 34. | Greenacres | 202 | 14,809(1.36%)#14 | 51,485(0.39%)#34 |
| 35. | Sunny Isles Beach | 199 | 14,809(1.34%)#15 | 51,485(0.39%)#35 |
| 36. | Chicago | 194 | 589(32.94%)#1 | 51,485(0.38%)#36 |
| 37. | Norwalk | 191 | 1,076(17.75%)#2 | 51,485(0.37%)#37 |
| 38. | Tamarac | 190 | 14,809(1.28%)#16 | 51,485(0.37%)#38 |
| 39. | New Milford Borough | 190 | 6,972(2.73%)#4 | 51,485(0.37%)#39 |
| 40. | Yonkers | 184 | 5,566(3.31%)#3 | 51,485(0.36%)#40 |
| 41. | Dover | 175 | 6,972(2.51%)#5 | 51,485(0.34%)#41 |
| 42. | Stillwater | 173 | 552(31.34%)#1 | 51,485(0.34%)#42 |
| 43. | Ojus | 173 | 14,809(1.17%)#17 | 51,485(0.34%)#43 |
| 44. | Union City | 170 | 6,972(2.44%)#6 | 51,485(0.33%)#44 |
| 45. | Aventura | 168 | 14,809(1.13%)#18 | 51,485(0.33%)#45 |
| 46. | Town N Country | 167 | 14,809(1.13%)#19 | 51,485(0.32%)#46 |
| 47. | Weston | 161 | 14,809(1.09%)#20 | 51,485(0.31%)#47 |
| 48. | Holyoke | 161 | 2,282(7.06%)#3 | 51,485(0.31%)#48 |
| 49. | Glendale | 158 | 3,811(4.15%)#5 | 51,485(0.31%)#49 |
| 50. | Cape Coral | 154 | 14,809(1.04%)#21 | 51,485(0.30%)#50 |
| 51. | Ogden | 154 | 642(23.99%)#1 | 51,485(0.30%)#51 |
| 52. | The Hammocks | 154 | 14,809(1.04%)#22 | 51,485(0.30%)#52 |
| 53. | Fort Lauderdale | 147 | 14,809(0.99%)#23 | 51,485(0.29%)#53 |
| 54. | Lehigh Acres | 147 | 14,809(0.99%)#24 | 51,485(0.29%)#54 |
| 55. | Ossining | 146 | 5,566(2.62%)#4 | 51,485(0.28%)#55 |
| 56. | Longmont | 143 | 379(37.73%)#1 | 51,485(0.28%)#56 |
| 57. | Lighthouse Point | 142 | 14,809(0.96%)#25 | 51,485(0.28%)#57 |
| 58. | Stoughton | 141 | 551(25.59%)#2 | 51,485(0.27%)#58 |
| 59. | Lynbrook | 140 | 5,566(2.52%)#5 | 51,485(0.27%)#59 |
| 60. | Davie | 139 | 14,809(0.94%)#26 | 51,485(0.27%)#60 |
| 61. | Huntington Beach | 138 | 3,811(3.62%)#6 | 51,485(0.27%)#61 |
| 62. | Wharton Borough | 138 | 6,972(1.98%)#7 | 51,485(0.27%)#62 |
| 63. | West Palm Beach | 135 | 14,809(0.91%)#27 | 51,485(0.26%)#63 |
| 64. | Aloha | 133 | 302(44.04%)#1 | 51,485(0.26%)#64 |
| 65. | Ankeny | 131 | 180(72.78%)#1 | 51,485(0.25%)#65 |
| 66. | Deerfield Beach | 129 | 14,809(0.87%)#28 | 51,485(0.25%)#66 |
| 67. | Gardner | 125 | 2,282(5.48%)#4 | 51,485(0.24%)#67 |
| 68. | The Woodlands | 123 | 2,774(4.43%)#3 | 51,485(0.24%)#68 |
| 69. | Aspen Hill | 123 | 667(18.44%)#1 | 51,485(0.24%)#69 |
| 70. | Boynton Beach | 122 | 14,809(0.82%)#29 | 51,485(0.24%)#70 |
| 71. | White Plains | 122 | 5,566(2.19%)#6 | 51,485(0.24%)#71 |
| 72. | Port Chester | 120 | 5,566(2.16%)#7 | 51,485(0.23%)#72 |
| 73. | Clermont | 119 | 14,809(0.80%)#30 | 51,485(0.23%)#73 |
| 74. | Palm River Clair Mel | 119 | 14,809(0.80%)#31 | 51,485(0.23%)#74 |
| 75. | Coral Springs | 117 | 14,809(0.79%)#32 | 51,485(0.23%)#75 |
| 76. | Pompano Beach | 117 | 14,809(0.79%)#33 | 51,485(0.23%)#76 |
| 77. | Mayfield Heights | 117 | 362(32.32%)#1 | 51,485(0.23%)#77 |
| 78. | Minneapolis | 113 | 552(20.47%)#2 | 51,485(0.22%)#78 |
| 79. | Syosset | 109 | 5,566(1.96%)#8 | 51,485(0.21%)#79 |
| 80. | Staples | 109 | 1,076(10.13%)#3 | 51,485(0.21%)#80 |
| 81. | North Miami | 108 | 14,809(0.73%)#34 | 51,485(0.21%)#81 |
| 82. | Cooper City | 108 | 14,809(0.73%)#35 | 51,485(0.21%)#82 |
| 83. | Edmonds | 107 | 396(27.02%)#1 | 51,485(0.21%)#83 |
| 84. | Waynesboro Borough | 106 | 1,061(9.99%)#2 | 51,485(0.21%)#84 |
| 85. | Castro Valley | 105 | 3,811(2.76%)#7 | 51,485(0.20%)#85 |
| 86. | Atlanta | 104 | 2,804(3.71%)#1 | 51,485(0.20%)#86 |
| 87. | Raleigh | 104 | 998(10.42%)#2 | 51,485(0.20%)#87 |
| 88. | Greenville | 104 | 561(18.54%)#1 | 51,485(0.20%)#88 |
| 89. | Mamaroneck | 102 | 5,566(1.83%)#9 | 51,485(0.20%)#89 |
| 90. | Kenilworth Borough | 101 | 6,972(1.45%)#8 | 51,485(0.20%)#90 |
| 91. | Riverview | 99 | 14,809(0.67%)#36 | 51,485(0.19%)#91 |
| 92. | Toms River | 98 | 6,972(1.41%)#9 | 51,485(0.19%)#92 |
| 93. | Bayonne | 98 | 6,972(1.41%)#10 | 51,485(0.19%)#93 |
| 94. | Arlington | 97 | 2,774(3.50%)#4 | 51,485(0.19%)#94 |
| 95. | Berea | 96 | 561(17.11%)#2 | 51,485(0.19%)#95 |
| 96. | New Rochelle | 94 | 5,566(1.69%)#10 | 51,485(0.18%)#96 |
| 97. | Lincoln Park Borough | 94 | 6,972(1.35%)#11 | 51,485(0.18%)#97 |
| 98. | Roswell | 93 | 2,804(3.32%)#2 | 51,485(0.18%)#98 |
| 99. | Rahway | 92 | 6,972(1.32%)#12 | 51,485(0.18%)#99 |
| 100. | Austin | 91 | 2,774(3.28%)#5 | 51,485(0.18%)#100 |
Common Questions
What are the Top 10 Cities with the Most Immigrants from Uruguay in the United States?
Top 10 Cities with the Most Immigrants from Uruguay in the United States are:
What city has the Most Immigrants from Uruguay in the United States?
New York has the Most Immigrants from Uruguay in the United States with 2,402.
What is the Total Immigrants from Uruguay in the United States?
Total Immigrants from Uruguay in the United States is 51,485.