Simpsonville, SC Map & Demographics
Simpsonville Map
Simpsonville Overview
$38,582
PER CAPITA INCOME
$96,633
AVG FAMILY INCOME
$79,937
AVG HOUSEHOLD INCOME
27.6%
WAGE / INCOME GAP [ % ]
72.4¢/ $1
WAGE / INCOME GAP [ $ ]
0.39
INEQUALITY / GINI INDEX
24,133
TOTAL POPULATION
12,221
MALE POPULATION
11,912
FEMALE POPULATION
102.59
MALES / 100 FEMALES
97.47
FEMALES / 100 MALES
37.8
MEDIAN AGE
3.1
AVG FAMILY SIZE
2.6
AVG HOUSEHOLD SIZE
13,169
LABOR FORCE [ PEOPLE ]
70.3%
PERCENT IN LABOR FORCE
2.8%
UNEMPLOYMENT RATE
Simpsonville Area Codes
Income in Simpsonville
Income Overview in Simpsonville
Per Capita Income in Simpsonville is $38,582, while median incomes of families and households are $96,633 and $79,937 respectively.
| Characteristic | Number | Measure |
| Per Capita Income | 24,133 | $38,582 |
| Median Family Income | 6,402 | $96,633 |
| Mean Family Income | 6,402 | $113,551 |
| Median Household Income | 9,257 | $79,937 |
| Mean Household Income | 9,257 | $98,595 |
| Income Deficit | 6,402 | $0 |
| Wage / Income Gap (%) | 24,133 | 27.62% |
| Wage / Income Gap ($) | 24,133 | 72.38¢ per $1 |
| Gini / Inequality Index | 24,133 | 0.39 |
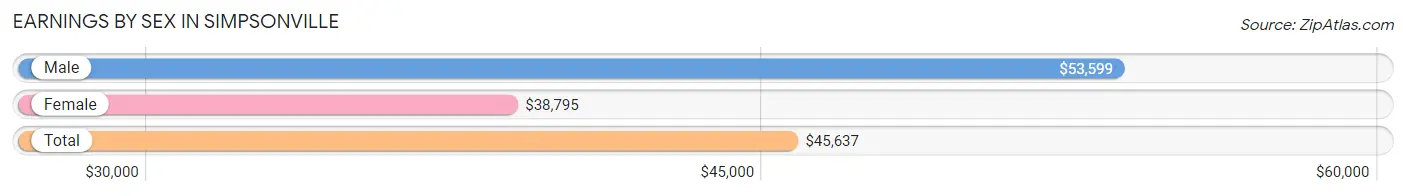
Earnings by Sex in Simpsonville
Average Earnings in Simpsonville are $45,637, $53,599 for men and $38,795 for women, a difference of 27.6%.
| Sex | Number | Average Earnings |
| Male | 7,148 (51.7%) | $53,599 |
| Female | 6,664 (48.2%) | $38,795 |
| Total | 13,812 (100.0%) | $45,637 |
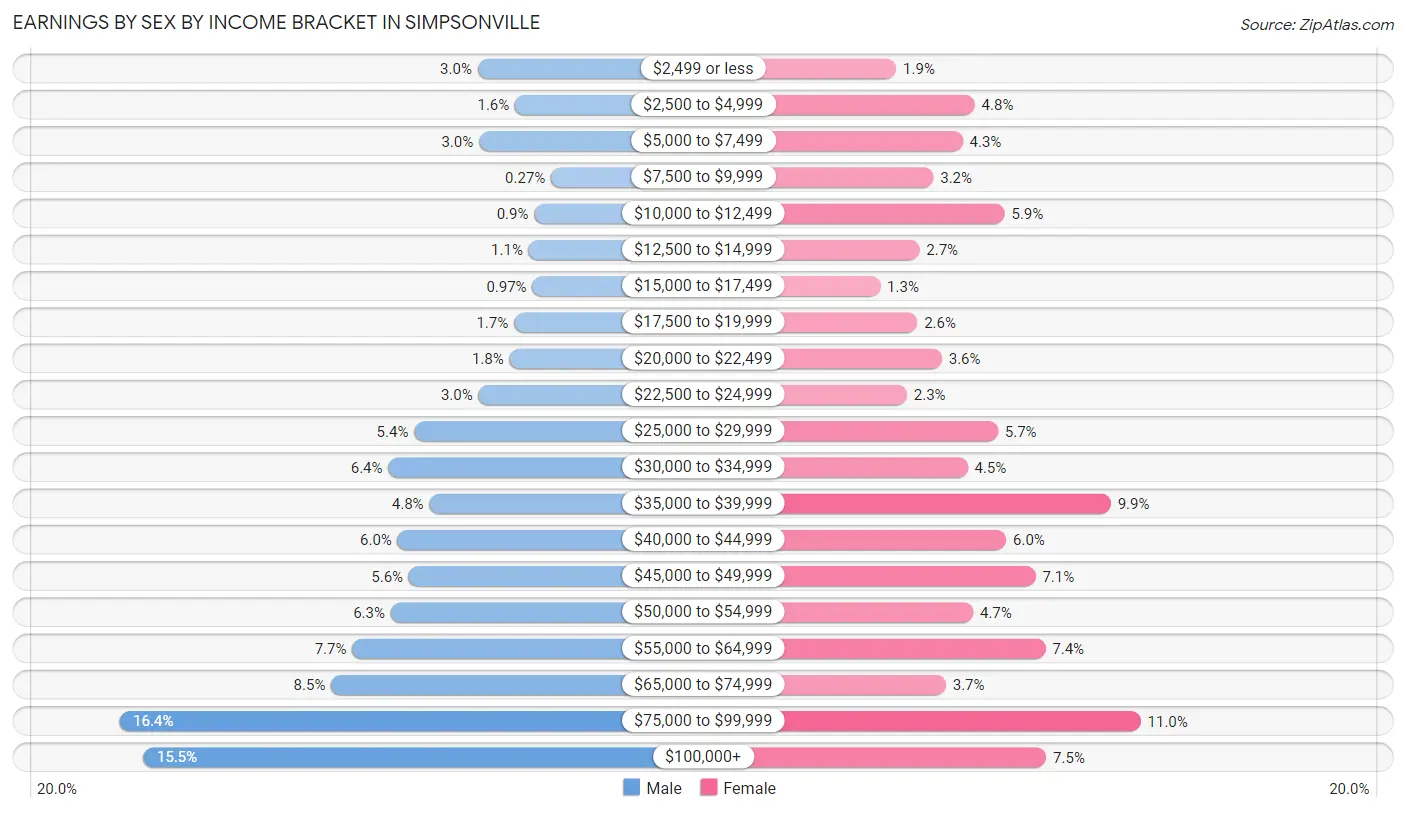
Earnings by Sex by Income Bracket in Simpsonville
The most common earnings brackets in Simpsonville are $75,000 to $99,999 for men (1,174 | 16.4%) and $75,000 to $99,999 for women (734 | 11.0%).
| Income | Male | Female |
| $2,499 or less | 216 (3.0%) | 123 (1.8%) |
| $2,500 to $4,999 | 116 (1.6%) | 319 (4.8%) |
| $5,000 to $7,499 | 212 (3.0%) | 289 (4.3%) |
| $7,500 to $9,999 | 19 (0.3%) | 216 (3.2%) |
| $10,000 to $12,499 | 64 (0.9%) | 394 (5.9%) |
| $12,500 to $14,999 | 79 (1.1%) | 181 (2.7%) |
| $15,000 to $17,499 | 69 (1.0%) | 83 (1.3%) |
| $17,500 to $19,999 | 119 (1.7%) | 176 (2.6%) |
| $20,000 to $22,499 | 131 (1.8%) | 237 (3.6%) |
| $22,500 to $24,999 | 214 (3.0%) | 150 (2.2%) |
| $25,000 to $29,999 | 386 (5.4%) | 377 (5.7%) |
| $30,000 to $34,999 | 455 (6.4%) | 301 (4.5%) |
| $35,000 to $39,999 | 345 (4.8%) | 659 (9.9%) |
| $40,000 to $44,999 | 430 (6.0%) | 398 (6.0%) |
| $45,000 to $49,999 | 400 (5.6%) | 471 (7.1%) |
| $50,000 to $54,999 | 449 (6.3%) | 315 (4.7%) |
| $55,000 to $64,999 | 552 (7.7%) | 496 (7.4%) |
| $65,000 to $74,999 | 608 (8.5%) | 247 (3.7%) |
| $75,000 to $99,999 | 1,174 (16.4%) | 734 (11.0%) |
| $100,000+ | 1,110 (15.5%) | 498 (7.5%) |
| Total | 7,148 (100.0%) | 6,664 (100.0%) |
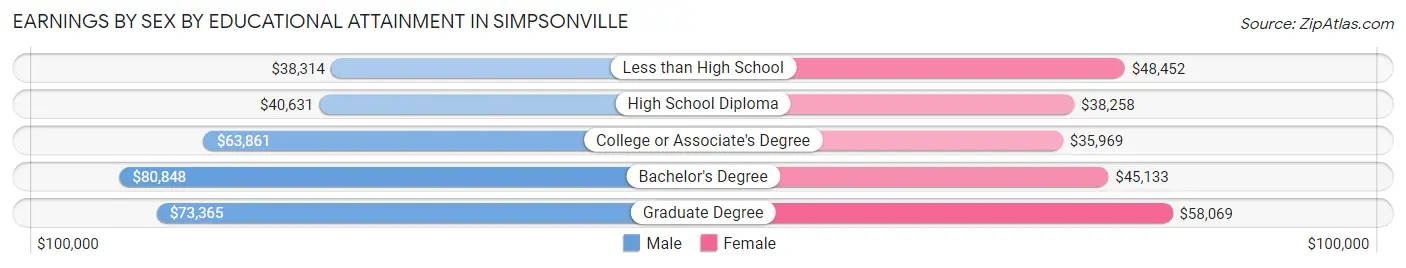
Earnings by Sex by Educational Attainment in Simpsonville
Average earnings in Simpsonville are $61,694 for men and $42,199 for women, a difference of 31.6%. Men with an educational attainment of bachelor's degree enjoy the highest average annual earnings of $80,848, while those with less than high school education earn the least with $38,314. Women with an educational attainment of graduate degree earn the most with the average annual earnings of $58,069, while those with college or associate's degree education have the smallest earnings of $35,969.
| Educational Attainment | Male Income | Female Income |
| Less than High School | $38,314 | $48,452 |
| High School Diploma | $40,631 | $38,258 |
| College or Associate's Degree | $63,861 | $35,969 |
| Bachelor's Degree | $80,848 | $45,133 |
| Graduate Degree | $73,365 | $58,069 |
| Total | $61,694 | $42,199 |
Family Income in Simpsonville
Family Income Brackets in Simpsonville
According to the Simpsonville family income data, there are 1,402 families falling into the $100,000 to $149,999 income range, which is the most common income bracket and makes up 21.9% of all families. Conversely, the $10,000 to $14,999 income bracket is the least frequent group with only 32 families (0.5%) belonging to this category.
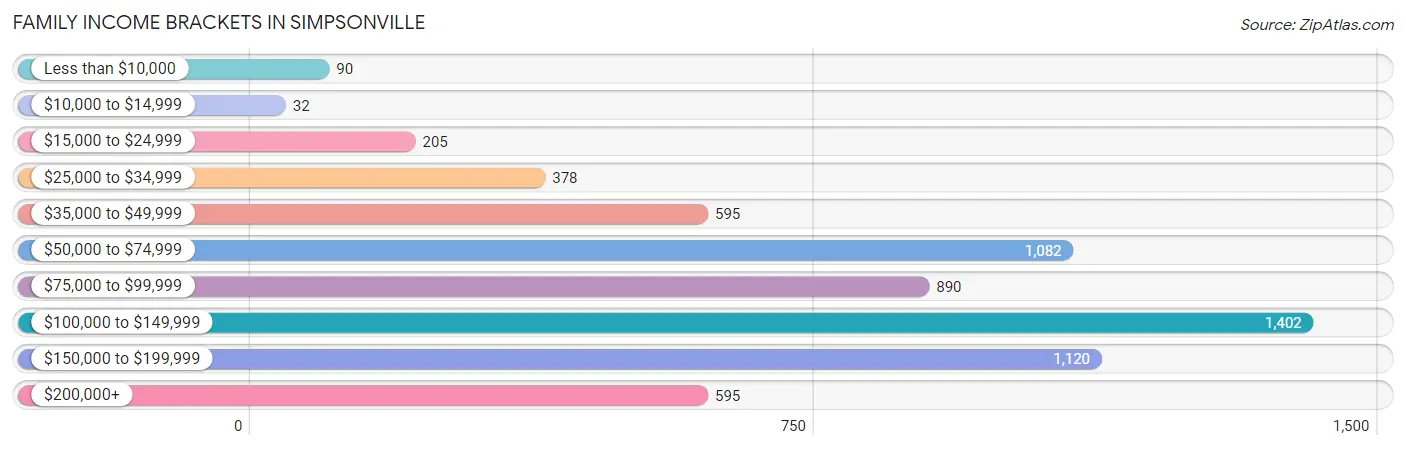
| Income Bracket | # Families | % Families |
| Less than $10,000 | 90 | 1.4% |
| $10,000 to $14,999 | 32 | 0.5% |
| $15,000 to $24,999 | 205 | 3.2% |
| $25,000 to $34,999 | 378 | 5.9% |
| $35,000 to $49,999 | 595 | 9.3% |
| $50,000 to $74,999 | 1,082 | 16.9% |
| $75,000 to $99,999 | 890 | 13.9% |
| $100,000 to $149,999 | 1,402 | 21.9% |
| $150,000 to $199,999 | 1,120 | 17.5% |
| $200,000+ | 595 | 9.3% |
Family Income by Famaliy Size in Simpsonville
7+ person families (99 | 1.5%) account for the highest median family income in Simpsonville with $171,037 per family, while 3-person families (1,455 | 22.7%) have the highest median income of $39,807 per family member.
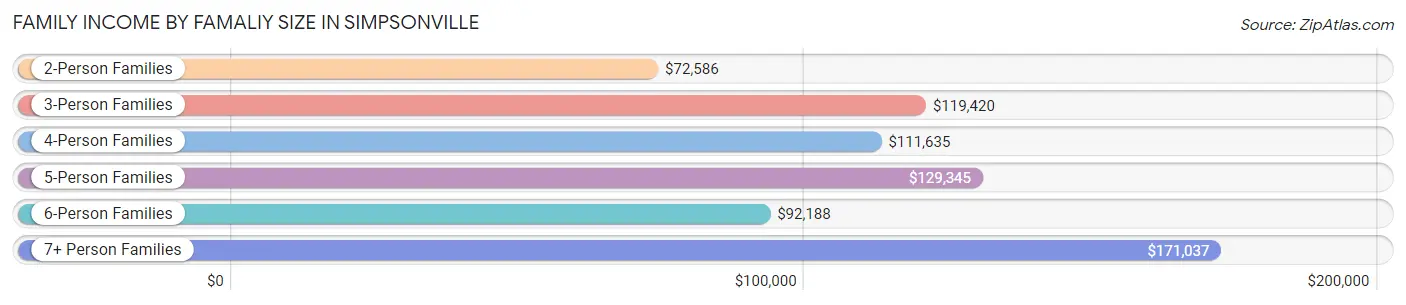
| Income Bracket | # Families | Median Income |
| 2-Person Families | 2,857 (44.6%) | $72,586 |
| 3-Person Families | 1,455 (22.7%) | $119,420 |
| 4-Person Families | 1,107 (17.3%) | $111,635 |
| 5-Person Families | 835 (13.0%) | $129,345 |
| 6-Person Families | 49 (0.8%) | $92,188 |
| 7+ Person Families | 99 (1.5%) | $171,037 |
| Total | 6,402 (100.0%) | $96,633 |
Family Income by Number of Earners in Simpsonville
The median family income in Simpsonville is $96,633, with families comprising 3+ earners (745) having the highest median family income of $156,953, while families with no earners (572) have the lowest median family income of $50,595, accounting for 11.6% and 8.9% of families, respectively.
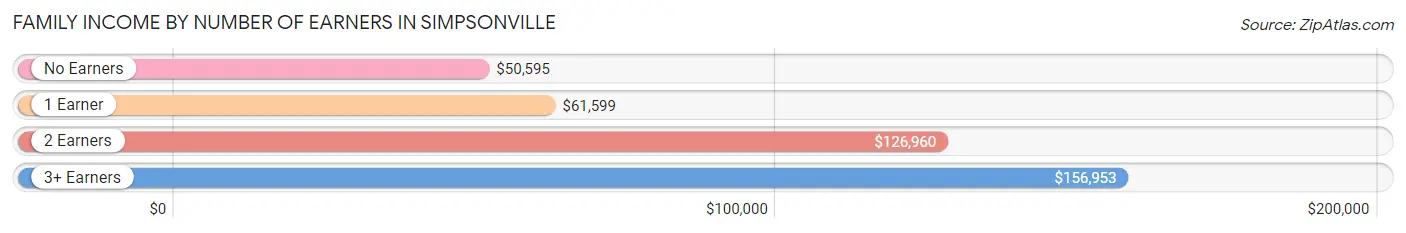
| Number of Earners | # Families | Median Income |
| No Earners | 572 (8.9%) | $50,595 |
| 1 Earner | 1,962 (30.6%) | $61,599 |
| 2 Earners | 3,123 (48.8%) | $126,960 |
| 3+ Earners | 745 (11.6%) | $156,953 |
| Total | 6,402 (100.0%) | $96,633 |
Household Income in Simpsonville
Household Income Brackets in Simpsonville
With 1,842 households falling in the category, the $100,000 to $149,999 income range is the most frequent in Simpsonville, accounting for 19.9% of all households. In contrast, only 102 households (1.1%) fall into the $10,000 to $14,999 income bracket, making it the least populous group.
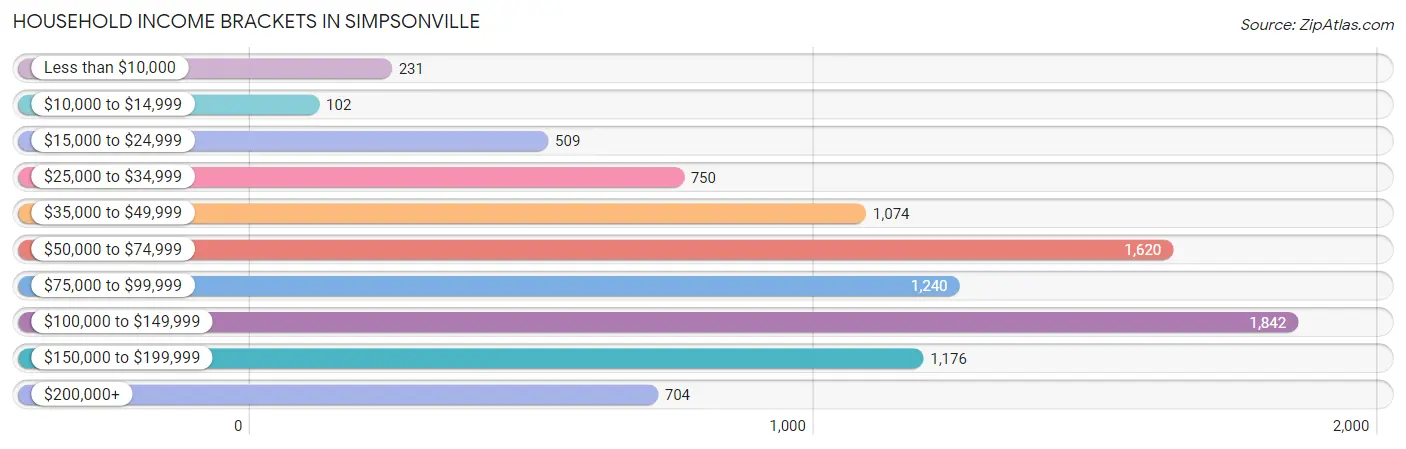
| Income Bracket | # Households | % Households |
| Less than $10,000 | 231 | 2.5% |
| $10,000 to $14,999 | 102 | 1.1% |
| $15,000 to $24,999 | 509 | 5.5% |
| $25,000 to $34,999 | 750 | 8.1% |
| $35,000 to $49,999 | 1,074 | 11.6% |
| $50,000 to $74,999 | 1,620 | 17.5% |
| $75,000 to $99,999 | 1,240 | 13.4% |
| $100,000 to $149,999 | 1,842 | 19.9% |
| $150,000 to $199,999 | 1,176 | 12.7% |
| $200,000+ | 704 | 7.6% |
Household Income by Householder Age in Simpsonville
The median household income in Simpsonville is $79,937, with the highest median household income of $95,397 found in the 25 to 44 years age bracket for the primary householder. A total of 3,592 households (38.8%) fall into this category. Meanwhile, the 65+ years age bracket for the primary householder has the lowest median household income of $55,526, with 2,070 households (22.4%) in this group.
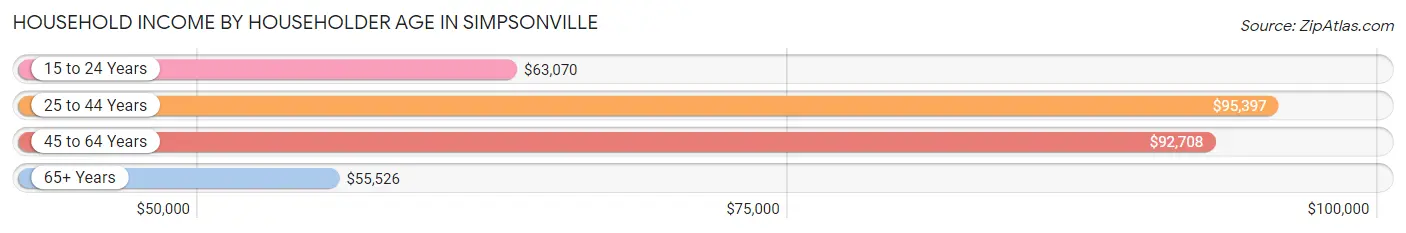
| Income Bracket | # Households | Median Income |
| 15 to 24 Years | 255 (2.8%) | $63,070 |
| 25 to 44 Years | 3,592 (38.8%) | $95,397 |
| 45 to 64 Years | 3,340 (36.1%) | $92,708 |
| 65+ Years | 2,070 (22.4%) | $55,526 |
| Total | 9,257 (100.0%) | $79,937 |
Poverty in Simpsonville
Income Below Poverty by Sex and Age in Simpsonville
With 5.3% poverty level for males and 7.5% for females among the residents of Simpsonville, 75 year old and over males and 75 year old and over females are the most vulnerable to poverty, with 123 males (25.8%) and 189 females (24.3%) in their respective age groups living below the poverty level.
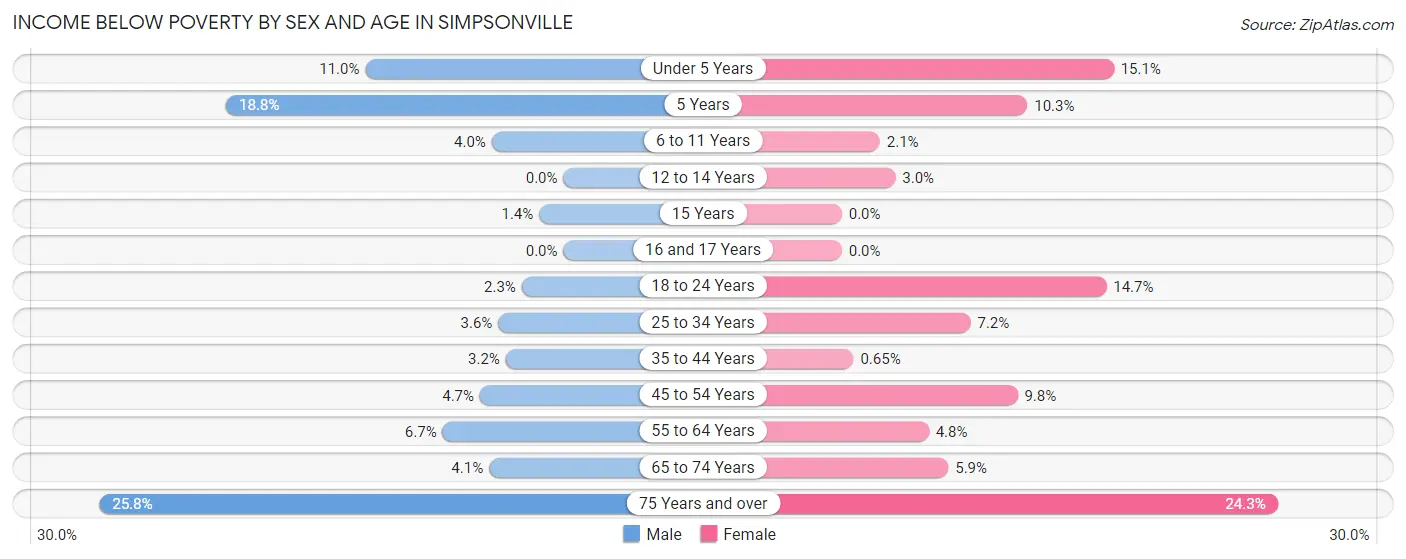
| Age Bracket | Male | Female |
| Under 5 Years | 78 (11.0%) | 96 (15.1%) |
| 5 Years | 40 (18.8%) | 19 (10.3%) |
| 6 to 11 Years | 55 (4.0%) | 25 (2.1%) |
| 12 to 14 Years | 0 (0.0%) | 9 (3.0%) |
| 15 Years | 1 (1.3%) | 0 (0.0%) |
| 16 and 17 Years | 0 (0.0%) | 0 (0.0%) |
| 18 to 24 Years | 23 (2.3%) | 148 (14.7%) |
| 25 to 34 Years | 65 (3.6%) | 121 (7.2%) |
| 35 to 44 Years | 61 (3.2%) | 12 (0.6%) |
| 45 to 54 Years | 61 (4.6%) | 132 (9.8%) |
| 55 to 64 Years | 98 (6.7%) | 69 (4.8%) |
| 65 to 74 Years | 42 (4.1%) | 63 (5.9%) |
| 75 Years and over | 123 (25.8%) | 189 (24.3%) |
| Total | 647 (5.3%) | 883 (7.5%) |
Income Above Poverty by Sex and Age in Simpsonville
According to the poverty statistics in Simpsonville, males aged 12 to 14 years and females aged 15 years are the age groups that are most secure financially, with 100.0% of males and 100.0% of females in these age groups living above the poverty line.
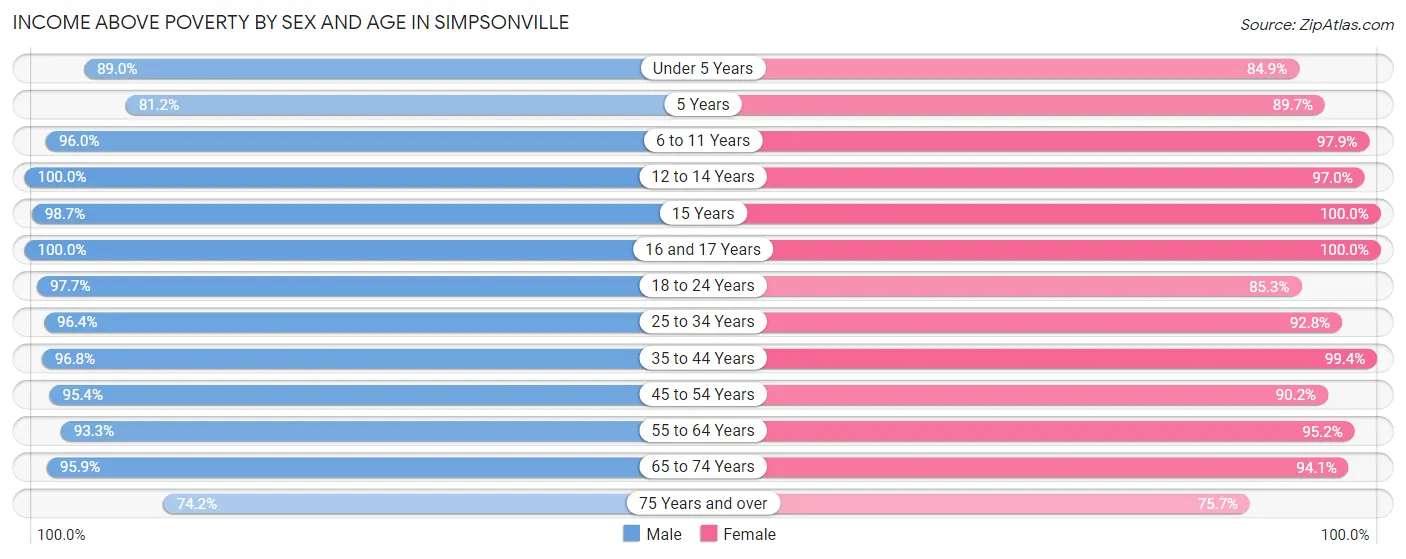
| Age Bracket | Male | Female |
| Under 5 Years | 629 (89.0%) | 538 (84.9%) |
| 5 Years | 173 (81.2%) | 165 (89.7%) |
| 6 to 11 Years | 1,324 (96.0%) | 1,152 (97.9%) |
| 12 to 14 Years | 599 (100.0%) | 293 (97.0%) |
| 15 Years | 73 (98.7%) | 73 (100.0%) |
| 16 and 17 Years | 206 (100.0%) | 222 (100.0%) |
| 18 to 24 Years | 970 (97.7%) | 857 (85.3%) |
| 25 to 34 Years | 1,727 (96.4%) | 1,566 (92.8%) |
| 35 to 44 Years | 1,838 (96.8%) | 1,834 (99.4%) |
| 45 to 54 Years | 1,252 (95.4%) | 1,218 (90.2%) |
| 55 to 64 Years | 1,359 (93.3%) | 1,358 (95.2%) |
| 65 to 74 Years | 973 (95.9%) | 999 (94.1%) |
| 75 Years and over | 353 (74.2%) | 590 (75.7%) |
| Total | 11,476 (94.7%) | 10,865 (92.5%) |
Income Below Poverty Among Married-Couple Families in Simpsonville
The poverty statistics for married-couple families in Simpsonville show that 2.4% or 119 of the total 4,923 families live below the poverty line. Families with 3 or 4 children have the highest poverty rate of 8.4%, comprising of 58 families. On the other hand, families with 5 or more children have the lowest poverty rate of 0.0%, which includes 0 families.
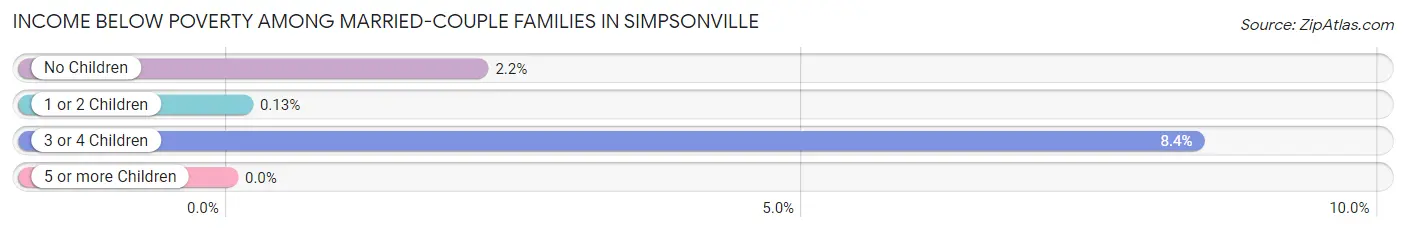
| Children | Above Poverty | Below Poverty |
| No Children | 2,653 (97.8%) | 59 (2.2%) |
| 1 or 2 Children | 1,500 (99.9%) | 2 (0.1%) |
| 3 or 4 Children | 632 (91.6%) | 58 (8.4%) |
| 5 or more Children | 19 (100.0%) | 0 (0.0%) |
| Total | 4,804 (97.6%) | 119 (2.4%) |
Income Below Poverty Among Single-Parent Households in Simpsonville
According to the poverty data in Simpsonville, 5.7% or 35 single-father households and 18.8% or 162 single-mother households are living below the poverty line. Among single-father households, those with 1 or 2 children have the highest poverty rate, with 35 households (11.6%) experiencing poverty. Likewise, among single-mother households, those with 1 or 2 children have the highest poverty rate, with 119 households (25.8%) falling below the poverty line.
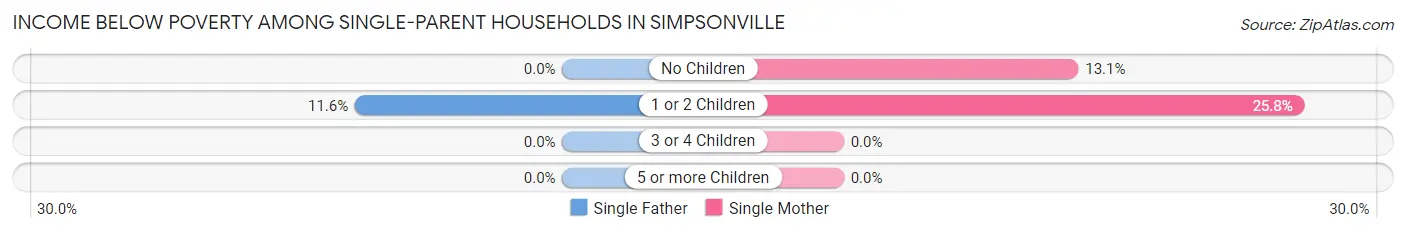
| Children | Single Father | Single Mother |
| No Children | 0 (0.0%) | 43 (13.1%) |
| 1 or 2 Children | 35 (11.6%) | 119 (25.8%) |
| 3 or 4 Children | 0 (0.0%) | 0 (0.0%) |
| 5 or more Children | 0 (0.0%) | 0 (0.0%) |
| Total | 35 (5.7%) | 162 (18.8%) |
Income Below Poverty Among Married-Couple vs Single-Parent Households in Simpsonville
The poverty data for Simpsonville shows that 119 of the married-couple family households (2.4%) and 197 of the single-parent households (13.3%) are living below the poverty level. Within the married-couple family households, those with 3 or 4 children have the highest poverty rate, with 58 households (8.4%) falling below the poverty line. Among the single-parent households, those with 1 or 2 children have the highest poverty rate, with 154 household (20.2%) living below poverty.
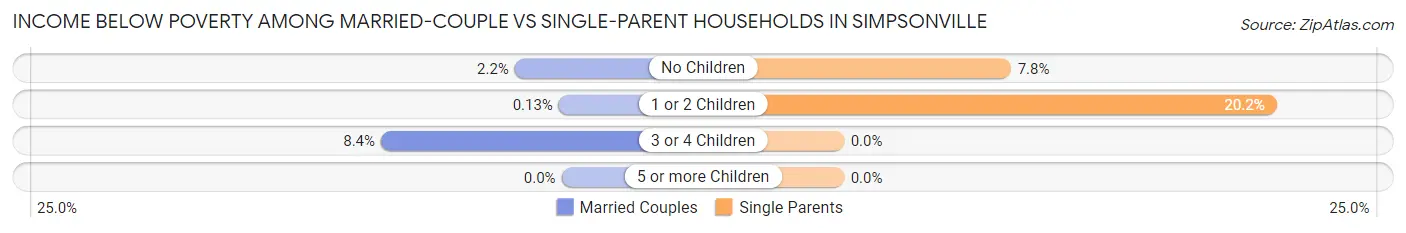
| Children | Married-Couple Families | Single-Parent Households |
| No Children | 59 (2.2%) | 43 (7.8%) |
| 1 or 2 Children | 2 (0.1%) | 154 (20.2%) |
| 3 or 4 Children | 58 (8.4%) | 0 (0.0%) |
| 5 or more Children | 0 (0.0%) | 0 (0.0%) |
| Total | 119 (2.4%) | 197 (13.3%) |
Race in Simpsonville
The most populous races in Simpsonville are White / Caucasian (16,142 | 66.9%), Black / African American (5,515 | 22.9%), and Hispanic or Latino (1,931 | 8.0%).
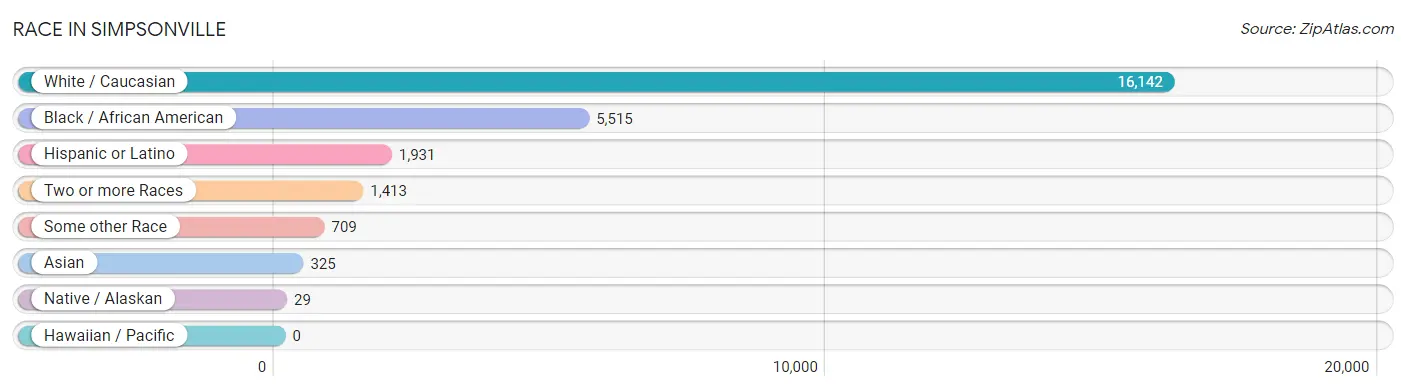
| Race | # Population | % Population |
| Asian | 325 | 1.3% |
| Black / African American | 5,515 | 22.9% |
| Hawaiian / Pacific | 0 | 0.0% |
| Hispanic or Latino | 1,931 | 8.0% |
| Native / Alaskan | 29 | 0.1% |
| White / Caucasian | 16,142 | 66.9% |
| Two or more Races | 1,413 | 5.9% |
| Some other Race | 709 | 2.9% |
| Total | 24,133 | 100.0% |
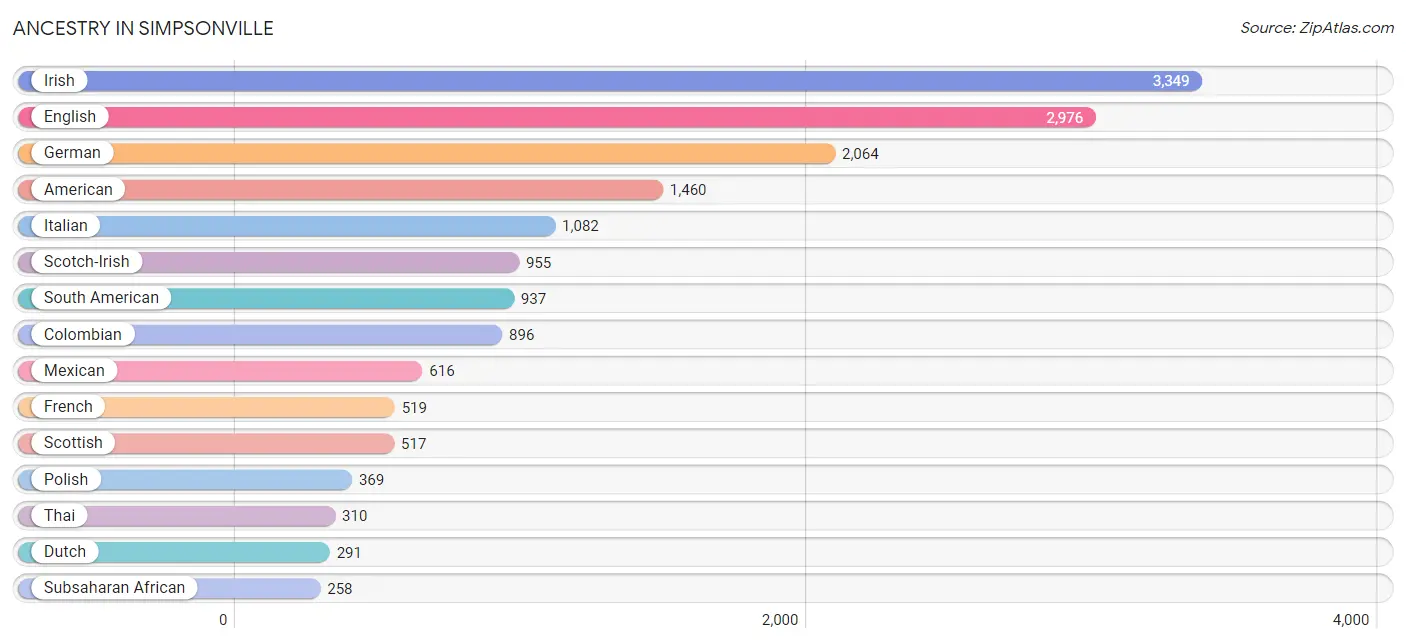
Ancestry in Simpsonville
The most populous ancestries reported in Simpsonville are Irish (3,349 | 13.9%), English (2,976 | 12.3%), German (2,064 | 8.6%), American (1,460 | 6.0%), and Italian (1,082 | 4.5%), together accounting for 45.3% of all Simpsonville residents.
| Ancestry | # Population | % Population |
| African | 158 | 0.6% |
| Albanian | 20 | 0.1% |
| American | 1,460 | 6.0% |
| Arab | 98 | 0.4% |
| Argentinean | 15 | 0.1% |
| Armenian | 5 | 0.0% |
| Austrian | 50 | 0.2% |
| Bhutanese | 15 | 0.1% |
| Brazilian | 85 | 0.4% |
| British | 76 | 0.3% |
| Bulgarian | 52 | 0.2% |
| Burmese | 24 | 0.1% |
| Central American | 82 | 0.3% |
| Cherokee | 56 | 0.2% |
| Chilean | 1 | 0.0% |
| Colombian | 896 | 3.7% |
| Costa Rican | 51 | 0.2% |
| Cuban | 110 | 0.5% |
| Czech | 10 | 0.0% |
| Czechoslovakian | 24 | 0.1% |
| Dutch | 291 | 1.2% |
| Eastern European | 45 | 0.2% |
| Ecuadorian | 13 | 0.1% |
| Egyptian | 86 | 0.4% |
| English | 2,976 | 12.3% |
| European | 251 | 1.0% |
| French | 519 | 2.1% |
| French Canadian | 161 | 0.7% |
| German | 2,064 | 8.6% |
| Greek | 37 | 0.2% |
| Haitian | 160 | 0.7% |
| Honduran | 6 | 0.0% |
| Hungarian | 31 | 0.1% |
| Indian (Asian) | 58 | 0.2% |
| Iranian | 35 | 0.2% |
| Irish | 3,349 | 13.9% |
| Italian | 1,082 | 4.5% |
| Jamaican | 26 | 0.1% |
| Japanese | 14 | 0.1% |
| Korean | 34 | 0.1% |
| Liberian | 44 | 0.2% |
| Lithuanian | 9 | 0.0% |
| Mexican | 616 | 2.5% |
| Mexican American Indian | 20 | 0.1% |
| Nicaraguan | 11 | 0.1% |
| Nigerian | 17 | 0.1% |
| Northern European | 13 | 0.1% |
| Norwegian | 230 | 0.9% |
| Pakistani | 18 | 0.1% |
| Panamanian | 10 | 0.0% |
| Pennsylvania German | 40 | 0.2% |
| Polish | 369 | 1.5% |
| Portuguese | 37 | 0.2% |
| Puerto Rican | 178 | 0.7% |
| Romanian | 23 | 0.1% |
| Russian | 63 | 0.3% |
| Salvadoran | 4 | 0.0% |
| Samoan | 12 | 0.1% |
| Scandinavian | 14 | 0.1% |
| Scotch-Irish | 955 | 4.0% |
| Scottish | 517 | 2.1% |
| Slavic | 22 | 0.1% |
| Slovak | 36 | 0.2% |
| South African | 39 | 0.2% |
| South American | 937 | 3.9% |
| Spanish | 8 | 0.0% |
| Subsaharan African | 258 | 1.1% |
| Swedish | 98 | 0.4% |
| Swiss | 18 | 0.1% |
| Thai | 310 | 1.3% |
| Ukrainian | 30 | 0.1% |
| Uruguayan | 12 | 0.1% |
| Welsh | 198 | 0.8% | View All 73 Rows |
Immigrants in Simpsonville
The most numerous immigrant groups reported in Simpsonville came from Latin America (1,207 | 5.0%), South America (746 | 3.1%), Colombia (581 | 2.4%), Asia (306 | 1.3%), and Central America (264 | 1.1%), together accounting for 12.9% of all Simpsonville residents.
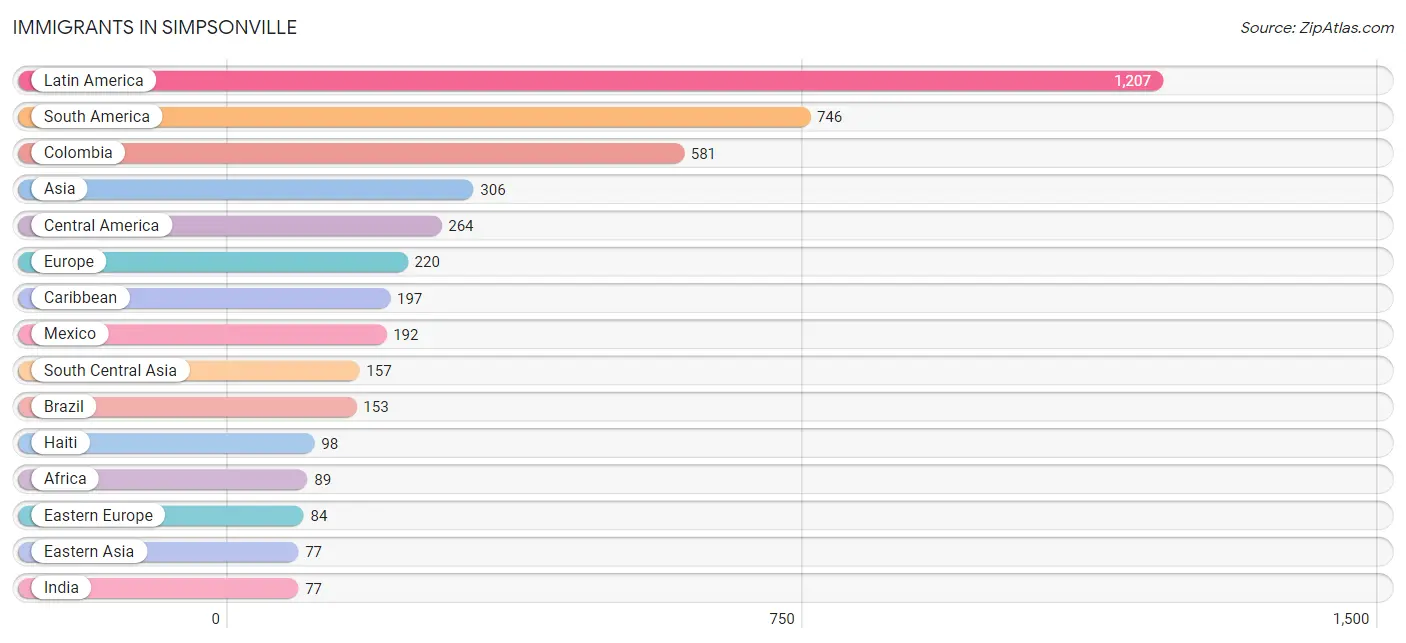
| Immigration Origin | # Population | % Population |
| Africa | 89 | 0.4% |
| Asia | 306 | 1.3% |
| Brazil | 153 | 0.6% |
| Canada | 50 | 0.2% |
| Caribbean | 197 | 0.8% |
| Central America | 264 | 1.1% |
| China | 58 | 0.2% |
| Colombia | 581 | 2.4% |
| Costa Rica | 26 | 0.1% |
| Cuba | 73 | 0.3% |
| Eastern Asia | 77 | 0.3% |
| Eastern Europe | 84 | 0.4% |
| Egypt | 50 | 0.2% |
| El Salvador | 29 | 0.1% |
| England | 5 | 0.0% |
| Europe | 220 | 0.9% |
| France | 40 | 0.2% |
| Germany | 13 | 0.1% |
| Haiti | 98 | 0.4% |
| Honduras | 6 | 0.0% |
| India | 77 | 0.3% |
| Iran | 35 | 0.2% |
| Ireland | 43 | 0.2% |
| Italy | 22 | 0.1% |
| Jamaica | 26 | 0.1% |
| Japan | 6 | 0.0% |
| Kazakhstan | 45 | 0.2% |
| Korea | 13 | 0.1% |
| Latin America | 1,207 | 5.0% |
| Mexico | 192 | 0.8% |
| Nicaragua | 11 | 0.1% |
| Northern Africa | 50 | 0.2% |
| Northern Europe | 61 | 0.3% |
| Philippines | 21 | 0.1% |
| Poland | 27 | 0.1% |
| Romania | 23 | 0.1% |
| Russia | 34 | 0.1% |
| Scotland | 13 | 0.1% |
| South Africa | 39 | 0.2% |
| South America | 746 | 3.1% |
| South Central Asia | 157 | 0.6% |
| South Eastern Asia | 39 | 0.2% |
| Southern Europe | 22 | 0.1% |
| Thailand | 18 | 0.1% |
| Uruguay | 12 | 0.1% |
| Western Asia | 33 | 0.1% |
| Western Europe | 53 | 0.2% | View All 47 Rows |
Sex and Age in Simpsonville
Sex and Age in Simpsonville
The most populous age groups in Simpsonville are 10 to 14 Years (1,243 | 10.2%) for men and 5 to 9 Years (1,111 | 9.3%) for women.
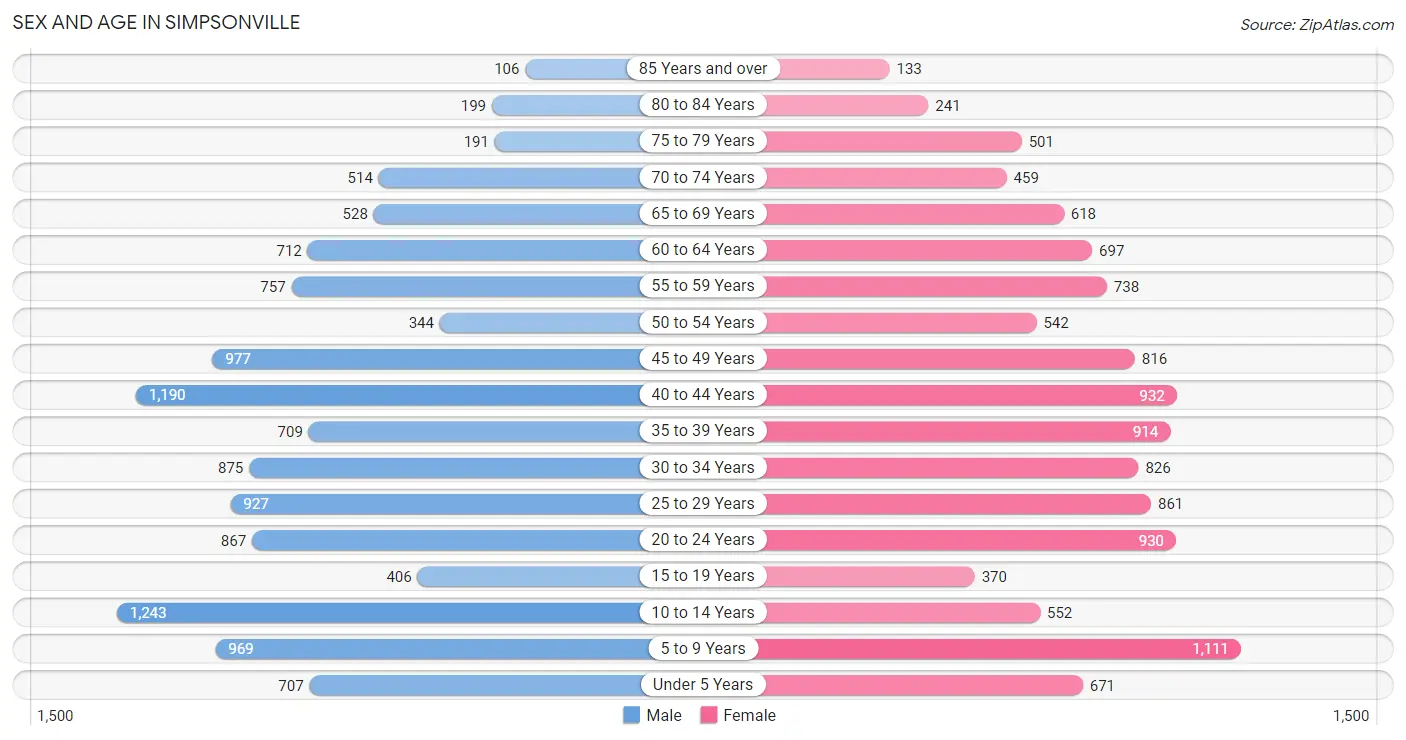
| Age Bracket | Male | Female |
| Under 5 Years | 707 (5.8%) | 671 (5.6%) |
| 5 to 9 Years | 969 (7.9%) | 1,111 (9.3%) |
| 10 to 14 Years | 1,243 (10.2%) | 552 (4.6%) |
| 15 to 19 Years | 406 (3.3%) | 370 (3.1%) |
| 20 to 24 Years | 867 (7.1%) | 930 (7.8%) |
| 25 to 29 Years | 927 (7.6%) | 861 (7.2%) |
| 30 to 34 Years | 875 (7.2%) | 826 (6.9%) |
| 35 to 39 Years | 709 (5.8%) | 914 (7.7%) |
| 40 to 44 Years | 1,190 (9.7%) | 932 (7.8%) |
| 45 to 49 Years | 977 (8.0%) | 816 (6.9%) |
| 50 to 54 Years | 344 (2.8%) | 542 (4.5%) |
| 55 to 59 Years | 757 (6.2%) | 738 (6.2%) |
| 60 to 64 Years | 712 (5.8%) | 697 (5.9%) |
| 65 to 69 Years | 528 (4.3%) | 618 (5.2%) |
| 70 to 74 Years | 514 (4.2%) | 459 (3.8%) |
| 75 to 79 Years | 191 (1.6%) | 501 (4.2%) |
| 80 to 84 Years | 199 (1.6%) | 241 (2.0%) |
| 85 Years and over | 106 (0.9%) | 133 (1.1%) |
| Total | 12,221 (100.0%) | 11,912 (100.0%) |
Families and Households in Simpsonville
Median Family Size in Simpsonville
The median family size in Simpsonville is 3.15 persons per family, with married-couple families (4,923 | 76.9%) accounting for the largest median family size of 3.24 persons per family. On the other hand, single male/father families (617 | 9.6%) represent the smallest median family size with 2.74 persons per family.
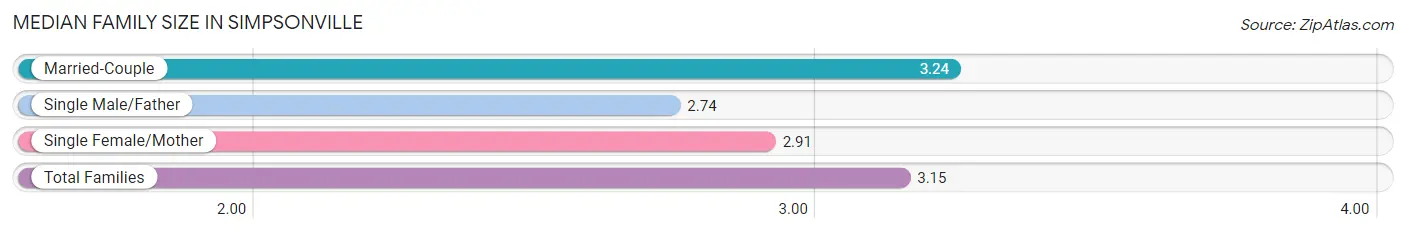
| Family Type | # Families | Family Size |
| Married-Couple | 4,923 (76.9%) | 3.24 |
| Single Male/Father | 617 (9.6%) | 2.74 |
| Single Female/Mother | 862 (13.5%) | 2.91 |
| Total Families | 6,402 (100.0%) | 3.15 |
Median Household Size in Simpsonville
The median household size in Simpsonville is 2.58 persons per household, with married-couple households (4,923 | 53.2%) accounting for the largest median household size of 3.26 persons per household. non-family households (2,855 | 30.8%) represent the smallest median household size with 1.20 persons per household.
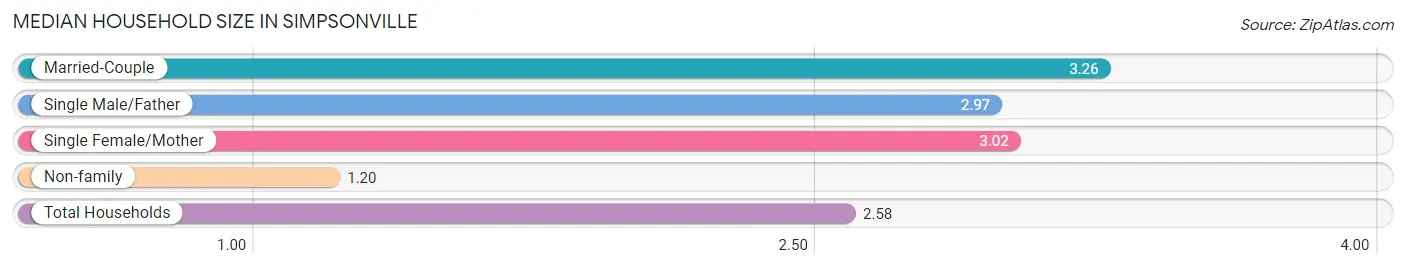
| Household Type | # Households | Household Size |
| Married-Couple | 4,923 (53.2%) | 3.26 |
| Single Male/Father | 617 (6.7%) | 2.97 |
| Single Female/Mother | 862 (9.3%) | 3.02 |
| Non-family | 2,855 (30.8%) | 1.20 |
| Total Households | 9,257 (100.0%) | 2.58 |
Household Size by Marriage Status in Simpsonville
Out of a total of 9,257 households in Simpsonville, 6,402 (69.2%) are family households, while 2,855 (30.8%) are nonfamily households. The most numerous type of family households are 2-person households, comprising 2,731, and the most common type of nonfamily households are 1-person households, comprising 2,472.
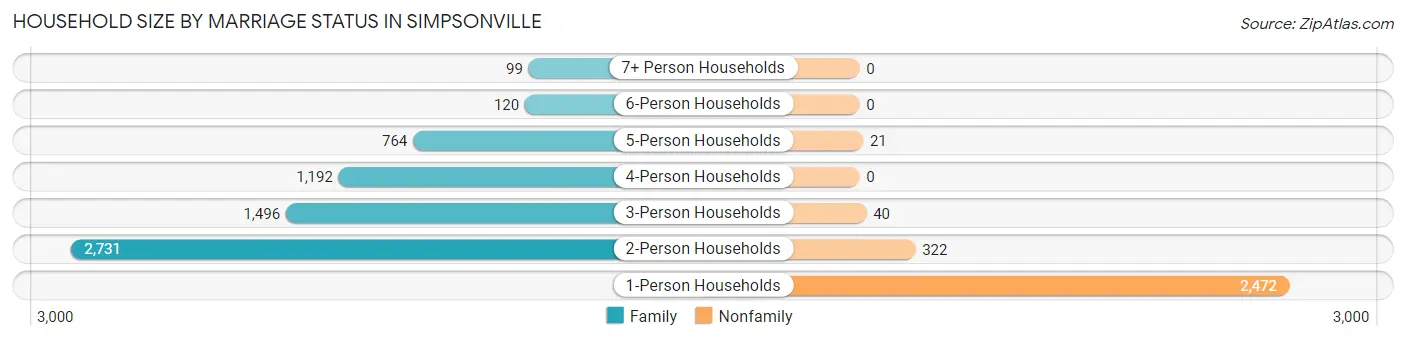
| Household Size | Family Households | Nonfamily Households |
| 1-Person Households | - | 2,472 (26.7%) |
| 2-Person Households | 2,731 (29.5%) | 322 (3.5%) |
| 3-Person Households | 1,496 (16.2%) | 40 (0.4%) |
| 4-Person Households | 1,192 (12.9%) | 0 (0.0%) |
| 5-Person Households | 764 (8.3%) | 21 (0.2%) |
| 6-Person Households | 120 (1.3%) | 0 (0.0%) |
| 7+ Person Households | 99 (1.1%) | 0 (0.0%) |
| Total | 6,402 (69.2%) | 2,855 (30.8%) |
Female Fertility in Simpsonville
Fertility by Age in Simpsonville
Average fertility rate in Simpsonville is 56.0 births per 1,000 women. Women in the age bracket of 20 to 34 years have the highest fertility rate with 94.0 births per 1,000 women. Women in the age bracket of 20 to 34 years acount for 76.9% of all women with births.
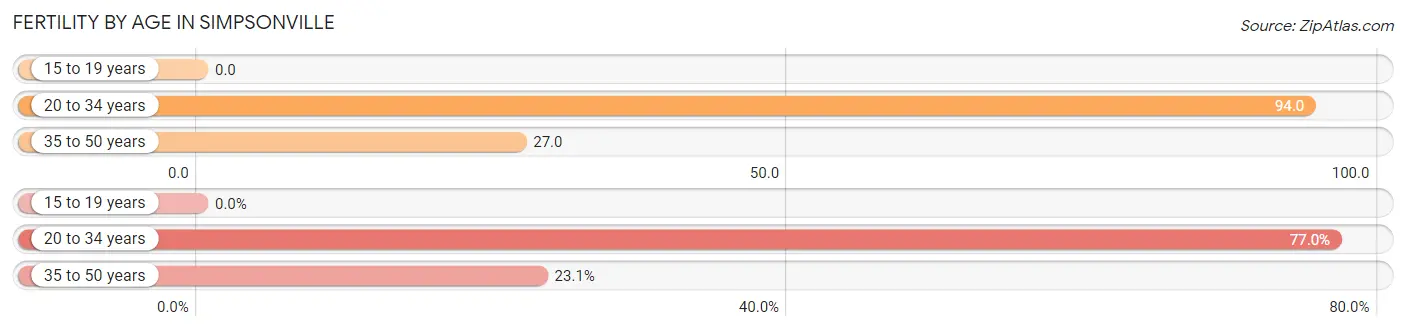
| Age Bracket | Women with Births | Births / 1,000 Women |
| 15 to 19 years | 0 (0.0%) | 0.0 |
| 20 to 34 years | 247 (76.9%) | 94.0 |
| 35 to 50 years | 74 (23.1%) | 27.0 |
| Total | 321 (100.0%) | 56.0 |
Fertility by Age by Marriage Status in Simpsonville
63.9% of women with births (321) in Simpsonville are married. The highest percentage of unmarried women with births falls into 20 to 34 years age bracket with 47.0% of them unmarried at the time of birth, while the lowest percentage of unmarried women with births belong to 35 to 50 years age bracket with 0.0% of them unmarried.
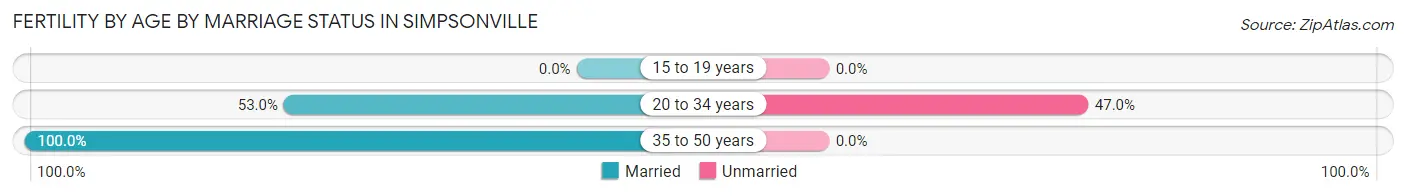
| Age Bracket | Married | Unmarried |
| 15 to 19 years | 0 (0.0%) | 0 (0.0%) |
| 20 to 34 years | 131 (53.0%) | 116 (47.0%) |
| 35 to 50 years | 74 (100.0%) | 0 (0.0%) |
| Total | 205 (63.9%) | 116 (36.1%) |
Fertility by Education in Simpsonville
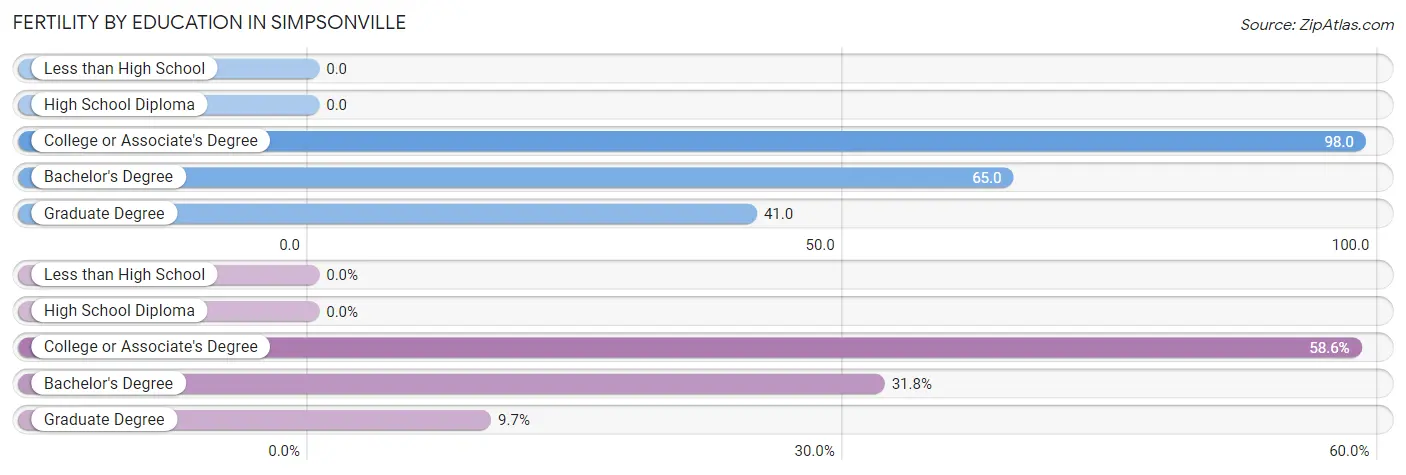
| Educational Attainment | Women with Births | Births / 1,000 Women |
| Less than High School | 0 (0.0%) | 0.0 |
| High School Diploma | 0 (0.0%) | 0.0 |
| College or Associate's Degree | 188 (58.6%) | 98.0 |
| Bachelor's Degree | 102 (31.8%) | 65.0 |
| Graduate Degree | 31 (9.7%) | 41.0 |
| Total | 321 (100.0%) | 56.0 |
Fertility by Education by Marriage Status in Simpsonville
36.1% of women with births in Simpsonville are unmarried. Women with the educational attainment of bachelor's degree are most likely to be married with 100.0% of them married at childbirth, while women with the educational attainment of college or associate's degree are least likely to be married with 61.7% of them unmarried at childbirth.
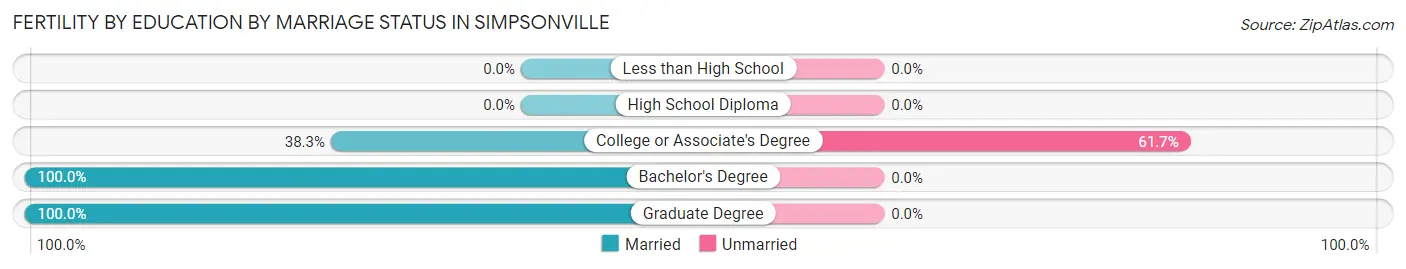
| Educational Attainment | Married | Unmarried |
| Less than High School | 0 (0.0%) | 0 (0.0%) |
| High School Diploma | 0 (0.0%) | 0 (0.0%) |
| College or Associate's Degree | 72 (38.3%) | 116 (61.7%) |
| Bachelor's Degree | 102 (100.0%) | 0 (0.0%) |
| Graduate Degree | 31 (100.0%) | 0 (0.0%) |
| Total | 205 (63.9%) | 116 (36.1%) |
Employment Characteristics in Simpsonville
Employment by Class of Employer in Simpsonville
Among the 12,638 employed individuals in Simpsonville, private company employees (9,916 | 78.5%), self-employed (not incorporated) (800 | 6.3%), and local government employees (641 | 5.1%) make up the most common classes of employment.
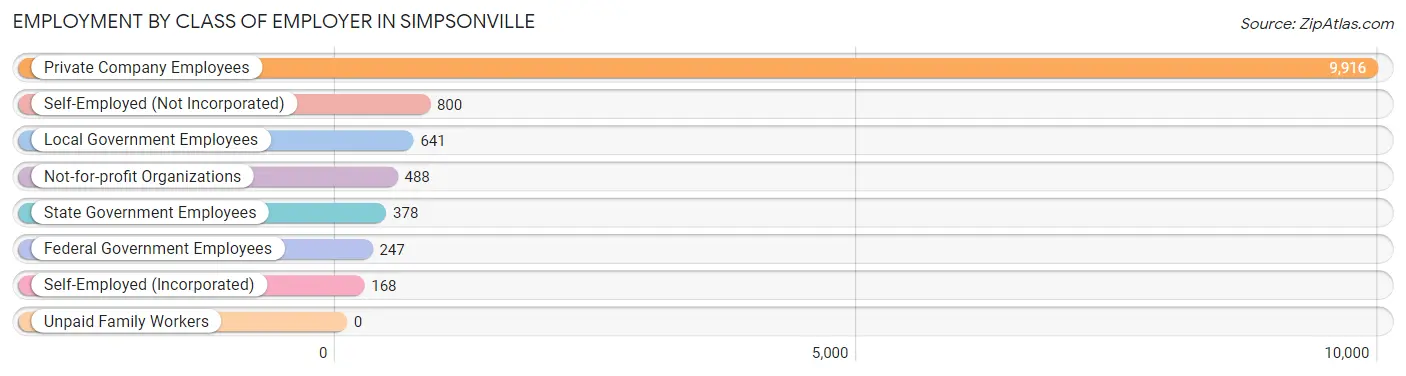
| Employer Class | # Employees | % Employees |
| Private Company Employees | 9,916 | 78.5% |
| Self-Employed (Incorporated) | 168 | 1.3% |
| Self-Employed (Not Incorporated) | 800 | 6.3% |
| Not-for-profit Organizations | 488 | 3.9% |
| Local Government Employees | 641 | 5.1% |
| State Government Employees | 378 | 3.0% |
| Federal Government Employees | 247 | 1.9% |
| Unpaid Family Workers | 0 | 0.0% |
| Total | 12,638 | 100.0% |
Employment Status by Age in Simpsonville
According to the labor force statistics for Simpsonville, out of the total population over 16 years of age (18,733), 70.3% or 13,169 individuals are in the labor force, with 2.8% or 369 of them unemployed. The age group with the highest labor force participation rate is 30 to 34 years, with 90.0% or 1,531 individuals in the labor force. Within the labor force, the 60 to 64 years age range has the highest percentage of unemployed individuals, with 10.4% or 92 of them being unemployed.
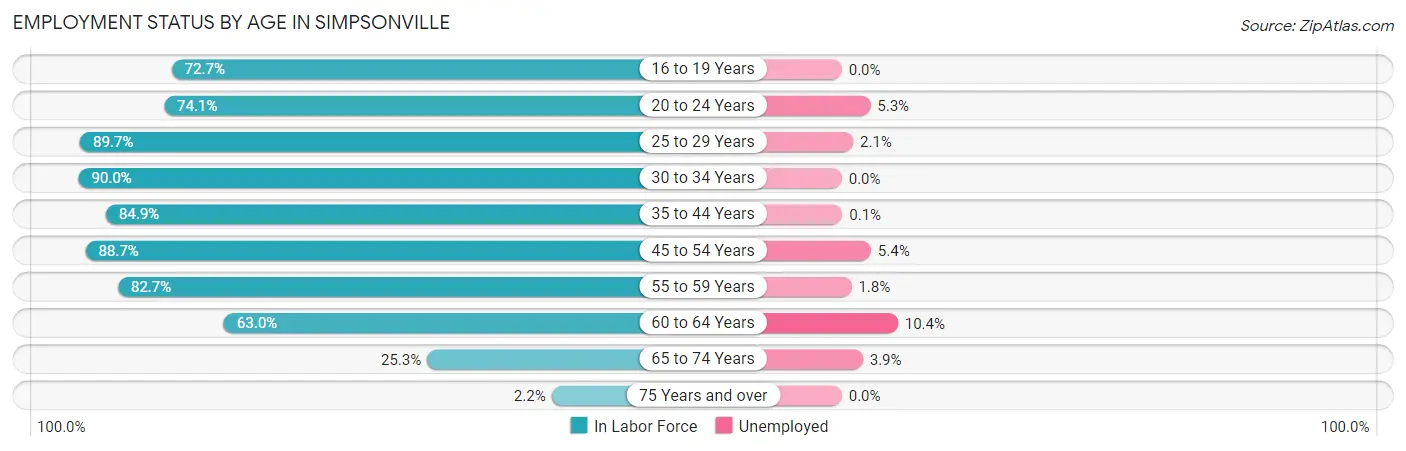
| Age Bracket | In Labor Force | Unemployed |
| 16 to 19 Years | 457 (72.7%) | 0 (0.0%) |
| 20 to 24 Years | 1,332 (74.1%) | 71 (5.3%) |
| 25 to 29 Years | 1,604 (89.7%) | 34 (2.1%) |
| 30 to 34 Years | 1,531 (90.0%) | 0 (0.0%) |
| 35 to 44 Years | 3,180 (84.9%) | 3 (0.1%) |
| 45 to 54 Years | 2,376 (88.7%) | 128 (5.4%) |
| 55 to 59 Years | 1,236 (82.7%) | 22 (1.8%) |
| 60 to 64 Years | 888 (63.0%) | 92 (10.4%) |
| 65 to 74 Years | 536 (25.3%) | 21 (3.9%) |
| 75 Years and over | 30 (2.2%) | 0 (0.0%) |
| Total | 13,169 (70.3%) | 369 (2.8%) |
Employment Status by Educational Attainment in Simpsonville
According to labor force statistics for Simpsonville, 84.4% of individuals (10,818) out of the total population between 25 and 64 years of age (12,817) are in the labor force, with 2.6% or 281 of them being unemployed. The group with the highest labor force participation rate are those with the educational attainment of bachelor's degree or higher, with 90.2% or 4,324 individuals in the labor force. Within the labor force, individuals with less than high school education have the highest percentage of unemployment, with 17.0% or 75 of them being unemployed.
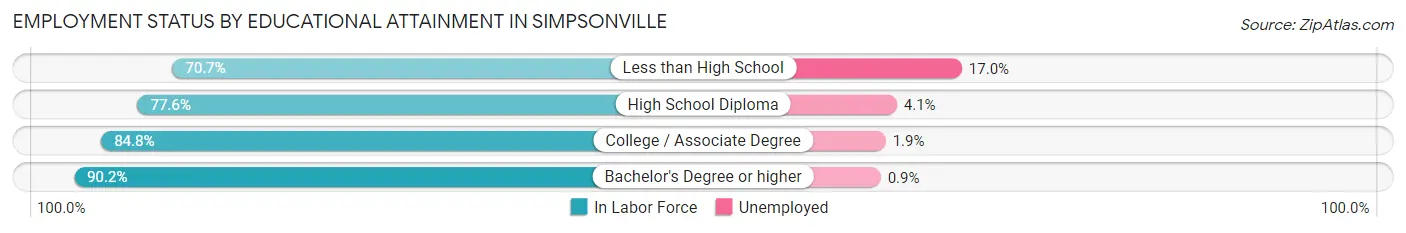
| Educational Attainment | In Labor Force | Unemployed |
| Less than High School | 441 (70.7%) | 106 (17.0%) |
| High School Diploma | 2,447 (77.6%) | 129 (4.1%) |
| College / Associate Degree | 3,601 (84.8%) | 81 (1.9%) |
| Bachelor's Degree or higher | 4,324 (90.2%) | 43 (0.9%) |
| Total | 10,818 (84.4%) | 333 (2.6%) |
Employment Occupations by Sex in Simpsonville
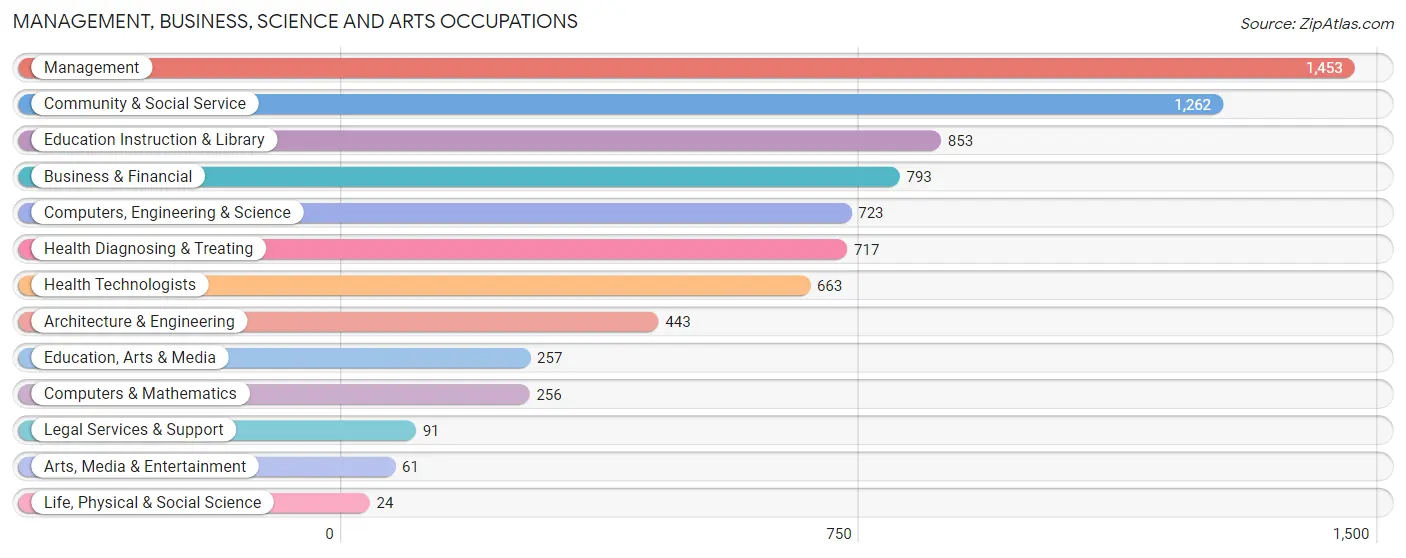
Management, Business, Science and Arts Occupations
The most common Management, Business, Science and Arts occupations in Simpsonville are Management (1,453 | 11.4%), Community & Social Service (1,262 | 9.9%), Education Instruction & Library (853 | 6.7%), Business & Financial (793 | 6.2%), and Computers, Engineering & Science (723 | 5.7%).
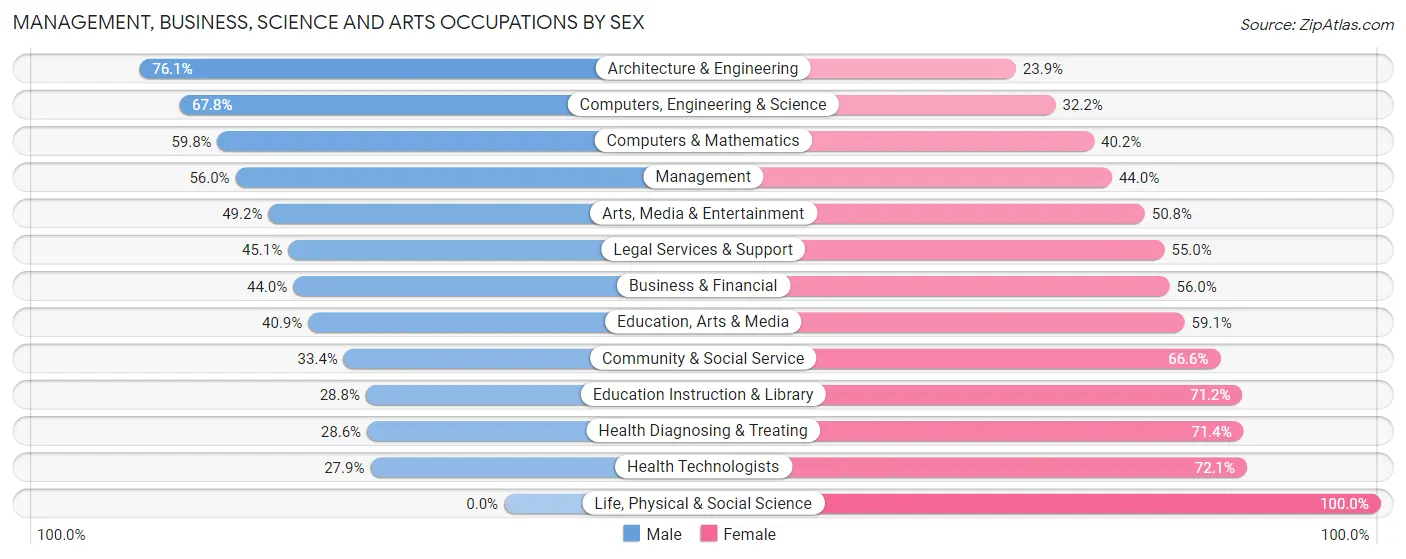
Management, Business, Science and Arts Occupations by Sex
Within the Management, Business, Science and Arts occupations in Simpsonville, the most male-oriented occupations are Architecture & Engineering (76.1%), Computers, Engineering & Science (67.8%), and Computers & Mathematics (59.8%), while the most female-oriented occupations are Life, Physical & Social Science (100.0%), Health Technologists (72.1%), and Health Diagnosing & Treating (71.4%).
| Occupation | Male | Female |
| Management | 814 (56.0%) | 639 (44.0%) |
| Business & Financial | 349 (44.0%) | 444 (56.0%) |
| Computers, Engineering & Science | 490 (67.8%) | 233 (32.2%) |
| Computers & Mathematics | 153 (59.8%) | 103 (40.2%) |
| Architecture & Engineering | 337 (76.1%) | 106 (23.9%) |
| Life, Physical & Social Science | 0 (0.0%) | 24 (100.0%) |
| Community & Social Service | 422 (33.4%) | 840 (66.6%) |
| Education, Arts & Media | 105 (40.9%) | 152 (59.1%) |
| Legal Services & Support | 41 (45.1%) | 50 (54.9%) |
| Education Instruction & Library | 246 (28.8%) | 607 (71.2%) |
| Arts, Media & Entertainment | 30 (49.2%) | 31 (50.8%) |
| Health Diagnosing & Treating | 205 (28.6%) | 512 (71.4%) |
| Health Technologists | 185 (27.9%) | 478 (72.1%) |
| Total (Category) | 2,280 (46.1%) | 2,668 (53.9%) |
| Total (Overall) | 6,730 (52.6%) | 6,067 (47.4%) |
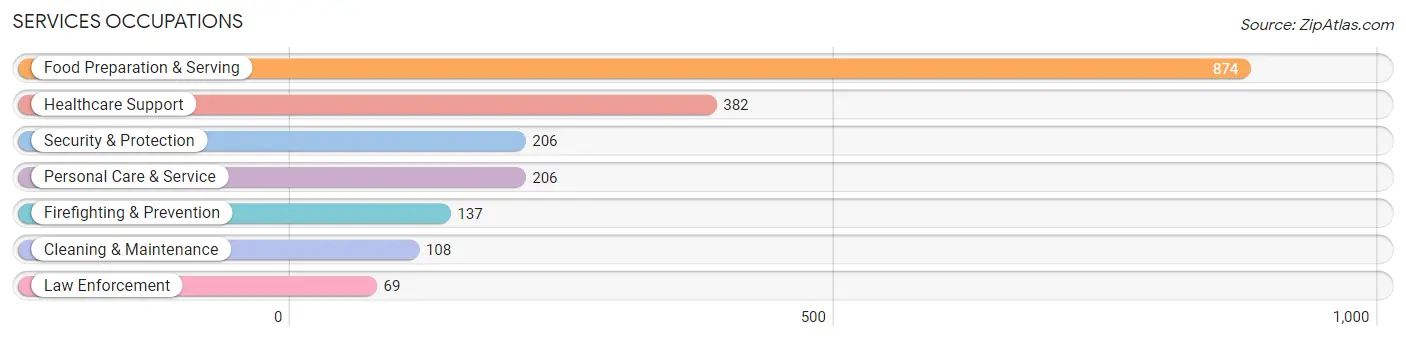
Services Occupations
The most common Services occupations in Simpsonville are Food Preparation & Serving (874 | 6.8%), Healthcare Support (382 | 3.0%), Security & Protection (206 | 1.6%), Personal Care & Service (206 | 1.6%), and Firefighting & Prevention (137 | 1.1%).
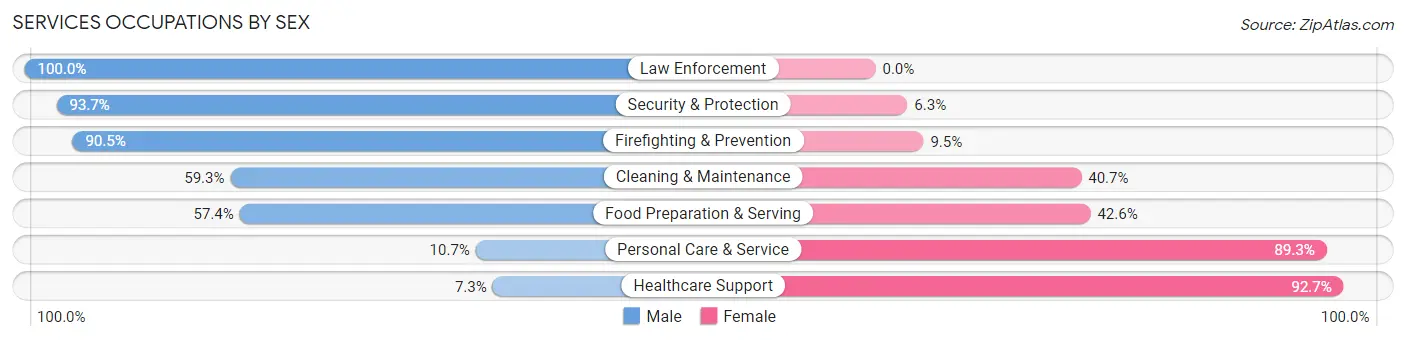
Services Occupations by Sex
Within the Services occupations in Simpsonville, the most male-oriented occupations are Law Enforcement (100.0%), Security & Protection (93.7%), and Firefighting & Prevention (90.5%), while the most female-oriented occupations are Healthcare Support (92.7%), Personal Care & Service (89.3%), and Food Preparation & Serving (42.6%).
| Occupation | Male | Female |
| Healthcare Support | 28 (7.3%) | 354 (92.7%) |
| Security & Protection | 193 (93.7%) | 13 (6.3%) |
| Firefighting & Prevention | 124 (90.5%) | 13 (9.5%) |
| Law Enforcement | 69 (100.0%) | 0 (0.0%) |
| Food Preparation & Serving | 502 (57.4%) | 372 (42.6%) |
| Cleaning & Maintenance | 64 (59.3%) | 44 (40.7%) |
| Personal Care & Service | 22 (10.7%) | 184 (89.3%) |
| Total (Category) | 809 (45.6%) | 967 (54.4%) |
| Total (Overall) | 6,730 (52.6%) | 6,067 (47.4%) |
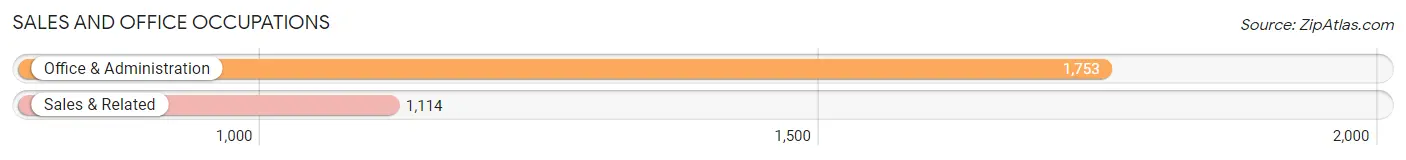
Sales and Office Occupations
The most common Sales and Office occupations in Simpsonville are Office & Administration (1,753 | 13.7%), and Sales & Related (1,114 | 8.7%).
Sales and Office Occupations by Sex
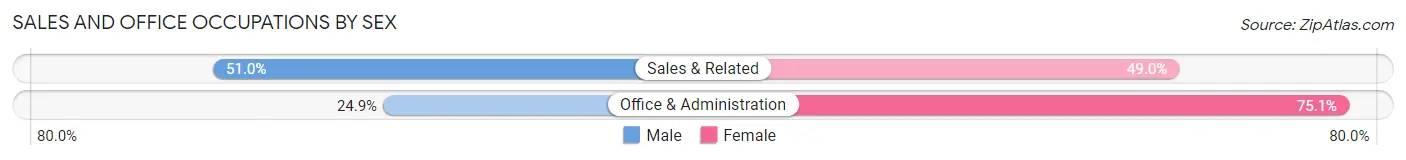
| Occupation | Male | Female |
| Sales & Related | 568 (51.0%) | 546 (49.0%) |
| Office & Administration | 436 (24.9%) | 1,317 (75.1%) |
| Total (Category) | 1,004 (35.0%) | 1,863 (65.0%) |
| Total (Overall) | 6,730 (52.6%) | 6,067 (47.4%) |
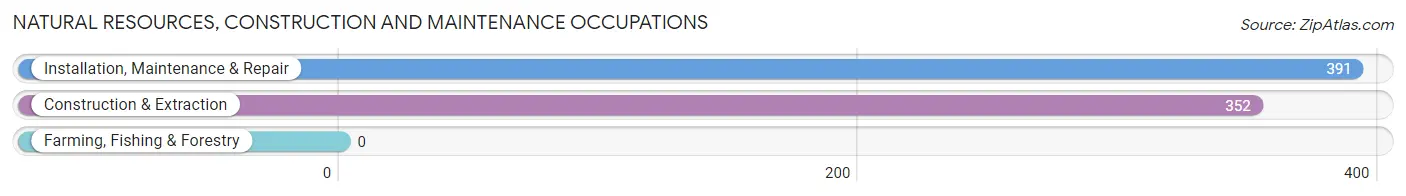
Natural Resources, Construction and Maintenance Occupations
The most common Natural Resources, Construction and Maintenance occupations in Simpsonville are Installation, Maintenance & Repair (391 | 3.1%), and Construction & Extraction (352 | 2.8%).
Natural Resources, Construction and Maintenance Occupations by Sex
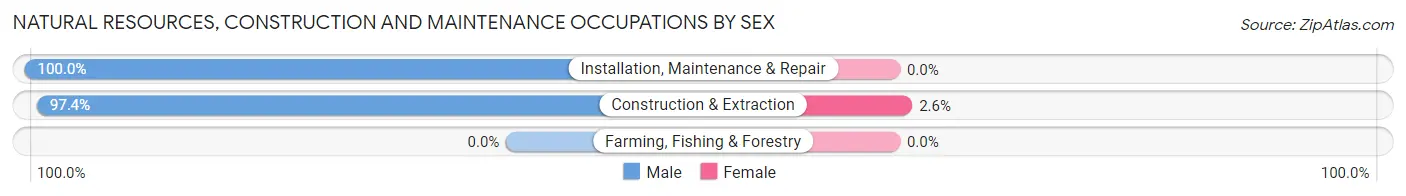
| Occupation | Male | Female |
| Farming, Fishing & Forestry | 0 (0.0%) | 0 (0.0%) |
| Construction & Extraction | 343 (97.4%) | 9 (2.6%) |
| Installation, Maintenance & Repair | 391 (100.0%) | 0 (0.0%) |
| Total (Category) | 734 (98.8%) | 9 (1.2%) |
| Total (Overall) | 6,730 (52.6%) | 6,067 (47.4%) |
Production, Transportation and Moving Occupations
The most common Production, Transportation and Moving occupations in Simpsonville are Production (1,427 | 11.2%), Material Moving (716 | 5.6%), and Transportation (320 | 2.5%).
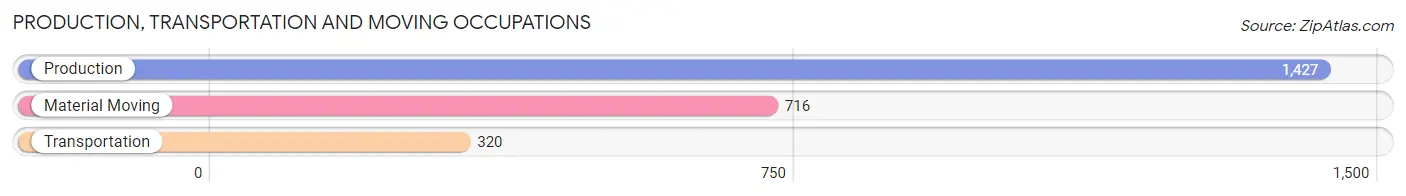
Production, Transportation and Moving Occupations by Sex
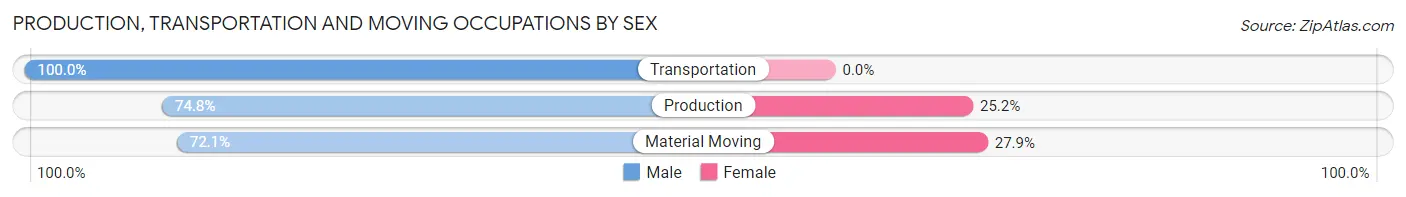
| Occupation | Male | Female |
| Production | 1,067 (74.8%) | 360 (25.2%) |
| Transportation | 320 (100.0%) | 0 (0.0%) |
| Material Moving | 516 (72.1%) | 200 (27.9%) |
| Total (Category) | 1,903 (77.3%) | 560 (22.7%) |
| Total (Overall) | 6,730 (52.6%) | 6,067 (47.4%) |
Employment Industries by Sex in Simpsonville
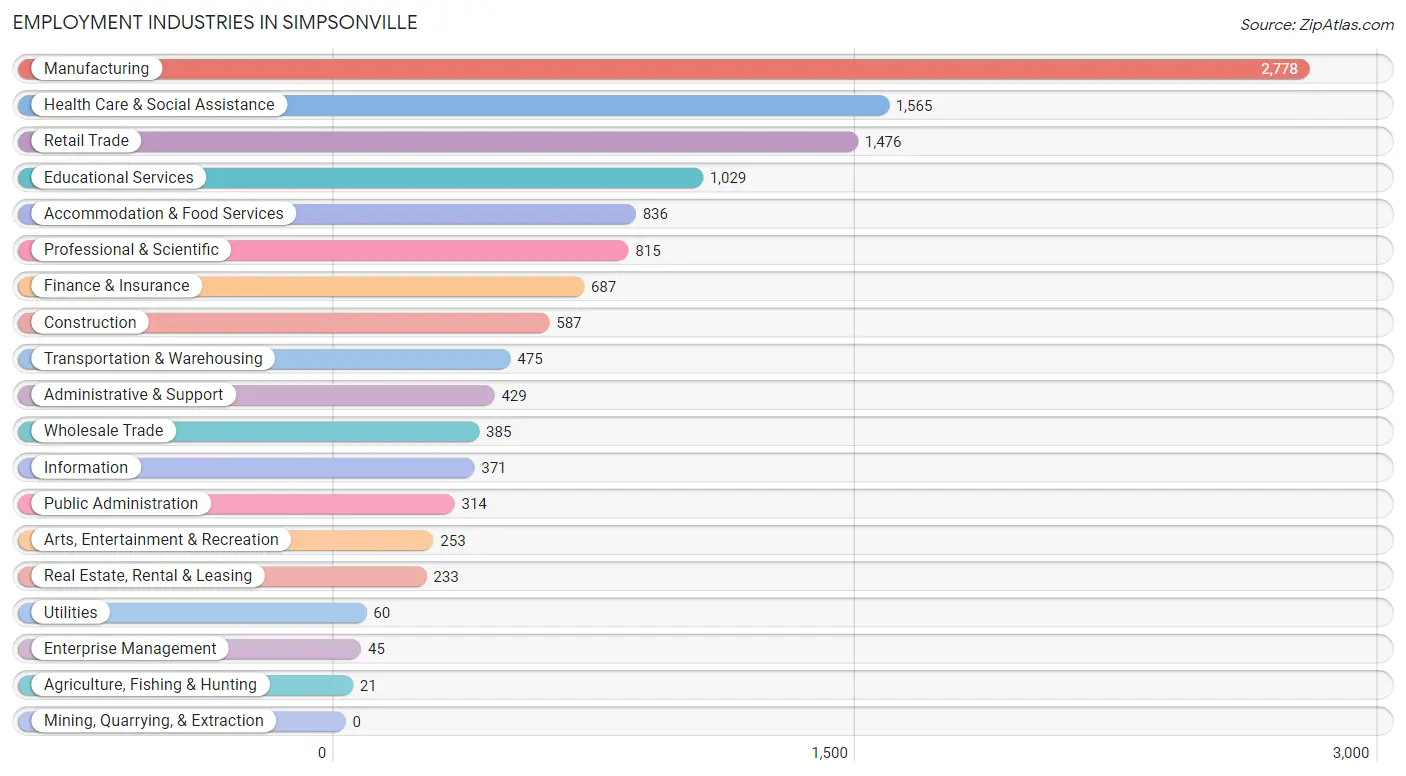
Employment Industries in Simpsonville
The major employment industries in Simpsonville include Manufacturing (2,778 | 21.7%), Health Care & Social Assistance (1,565 | 12.2%), Retail Trade (1,476 | 11.5%), Educational Services (1,029 | 8.0%), and Accommodation & Food Services (836 | 6.5%).
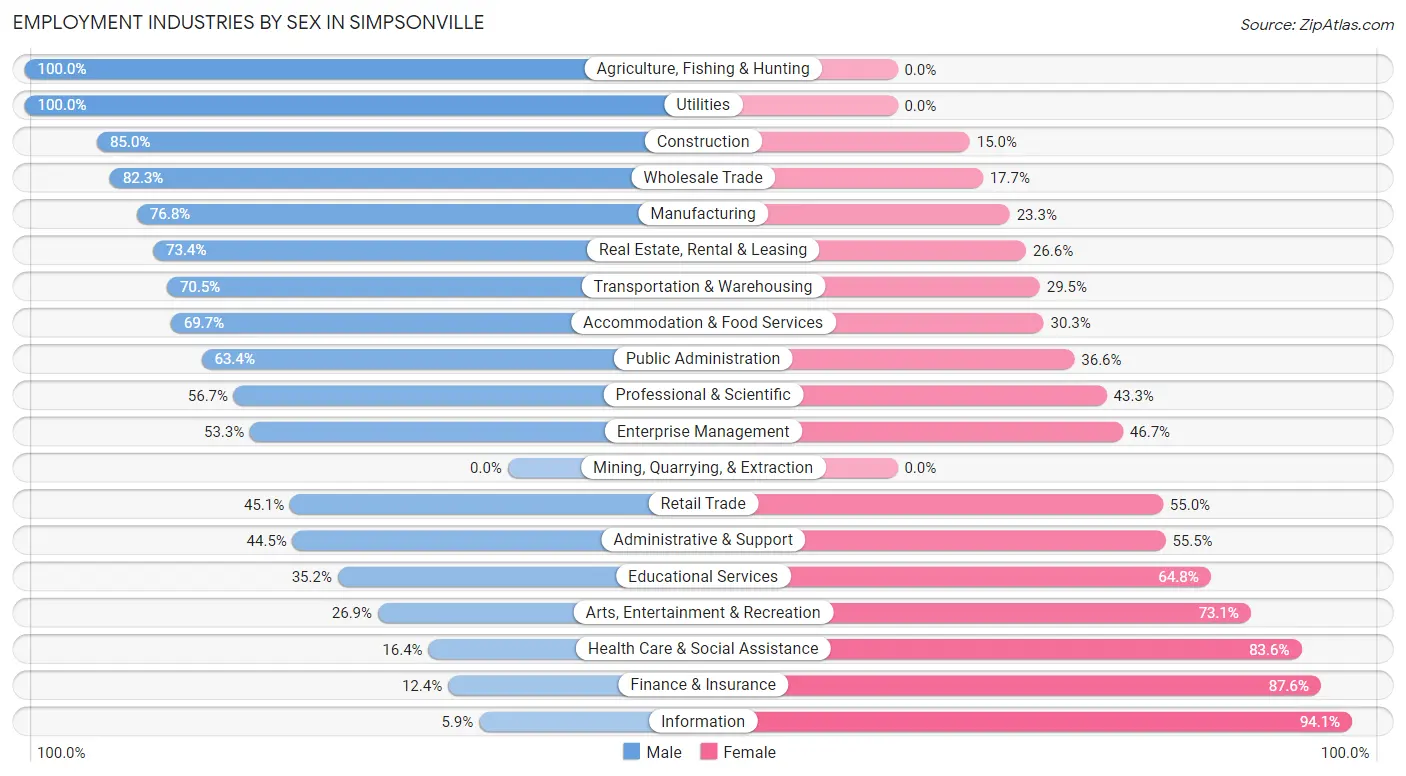
Employment Industries by Sex in Simpsonville
The Simpsonville industries that see more men than women are Agriculture, Fishing & Hunting (100.0%), Utilities (100.0%), and Construction (85.0%), whereas the industries that tend to have a higher number of women are Information (94.1%), Finance & Insurance (87.6%), and Health Care & Social Assistance (83.6%).
| Industry | Male | Female |
| Agriculture, Fishing & Hunting | 21 (100.0%) | 0 (0.0%) |
| Mining, Quarrying, & Extraction | 0 (0.0%) | 0 (0.0%) |
| Construction | 499 (85.0%) | 88 (15.0%) |
| Manufacturing | 2,132 (76.7%) | 646 (23.3%) |
| Wholesale Trade | 317 (82.3%) | 68 (17.7%) |
| Retail Trade | 665 (45.1%) | 811 (54.9%) |
| Transportation & Warehousing | 335 (70.5%) | 140 (29.5%) |
| Utilities | 60 (100.0%) | 0 (0.0%) |
| Information | 22 (5.9%) | 349 (94.1%) |
| Finance & Insurance | 85 (12.4%) | 602 (87.6%) |
| Real Estate, Rental & Leasing | 171 (73.4%) | 62 (26.6%) |
| Professional & Scientific | 462 (56.7%) | 353 (43.3%) |
| Enterprise Management | 24 (53.3%) | 21 (46.7%) |
| Administrative & Support | 191 (44.5%) | 238 (55.5%) |
| Educational Services | 362 (35.2%) | 667 (64.8%) |
| Health Care & Social Assistance | 257 (16.4%) | 1,308 (83.6%) |
| Arts, Entertainment & Recreation | 68 (26.9%) | 185 (73.1%) |
| Accommodation & Food Services | 583 (69.7%) | 253 (30.3%) |
| Public Administration | 199 (63.4%) | 115 (36.6%) |
| Total | 6,730 (52.6%) | 6,067 (47.4%) |
Education in Simpsonville
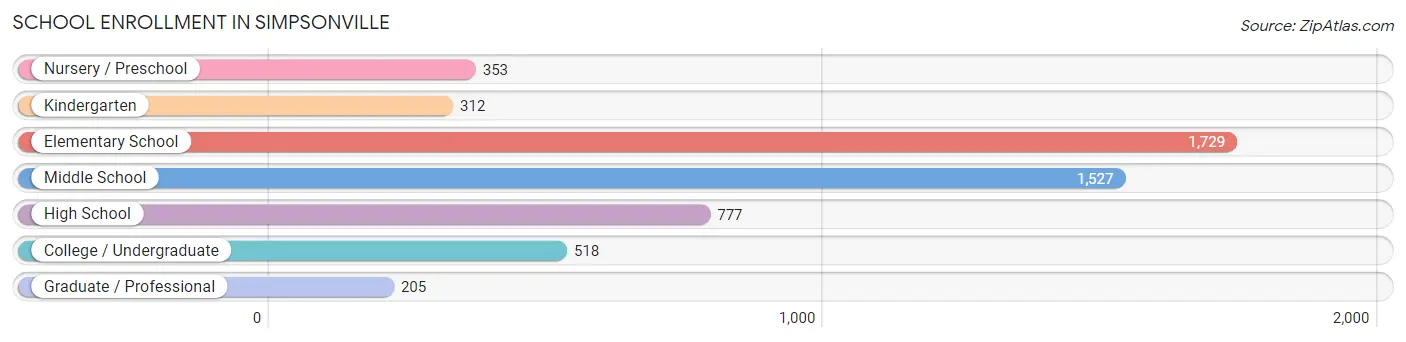
School Enrollment in Simpsonville
The most common levels of schooling among the 5,421 students in Simpsonville are elementary school (1,729 | 31.9%), middle school (1,527 | 28.2%), and high school (777 | 14.3%).
| School Level | # Students | % Students |
| Nursery / Preschool | 353 | 6.5% |
| Kindergarten | 312 | 5.8% |
| Elementary School | 1,729 | 31.9% |
| Middle School | 1,527 | 28.2% |
| High School | 777 | 14.3% |
| College / Undergraduate | 518 | 9.6% |
| Graduate / Professional | 205 | 3.8% |
| Total | 5,421 | 100.0% |
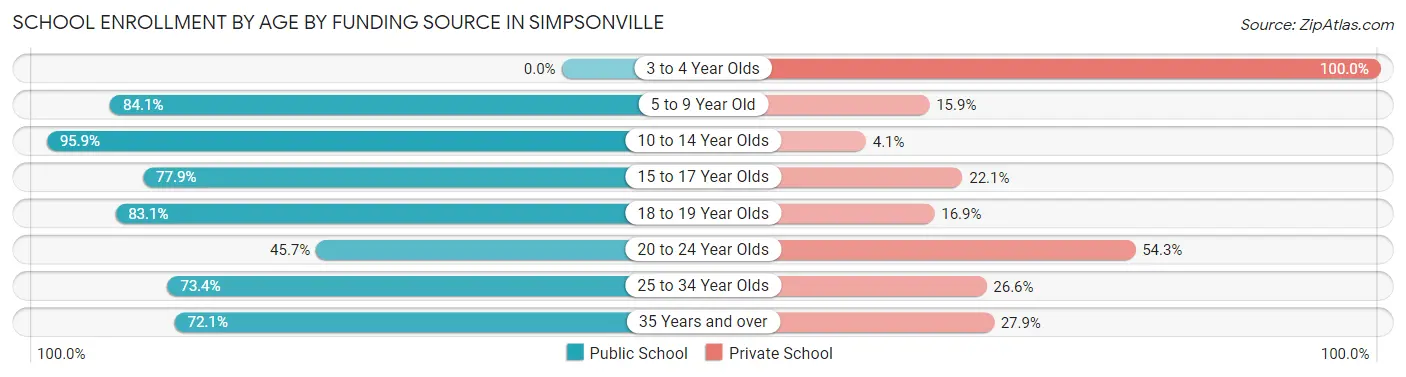
School Enrollment by Age by Funding Source in Simpsonville
Out of a total of 5,421 students who are enrolled in schools in Simpsonville, 1,019 (18.8%) attend a private institution, while the remaining 4,402 (81.2%) are enrolled in public schools. The age group of 3 to 4 year olds has the highest likelihood of being enrolled in private schools, with 165 (100.0% in the age bracket) enrolled. Conversely, the age group of 10 to 14 year olds has the lowest likelihood of being enrolled in a private school, with 1,721 (95.9% in the age bracket) attending a public institution.
| Age Bracket | Public School | Private School |
| 3 to 4 Year Olds | 0 (0.0%) | 165 (100.0%) |
| 5 to 9 Year Old | 1,698 (84.1%) | 322 (15.9%) |
| 10 to 14 Year Olds | 1,721 (95.9%) | 74 (4.1%) |
| 15 to 17 Year Olds | 448 (77.9%) | 127 (22.1%) |
| 18 to 19 Year Olds | 128 (83.1%) | 26 (16.9%) |
| 20 to 24 Year Olds | 186 (45.7%) | 221 (54.3%) |
| 25 to 34 Year Olds | 174 (73.4%) | 63 (26.6%) |
| 35 Years and over | 49 (72.1%) | 19 (27.9%) |
| Total | 4,402 (81.2%) | 1,019 (18.8%) |
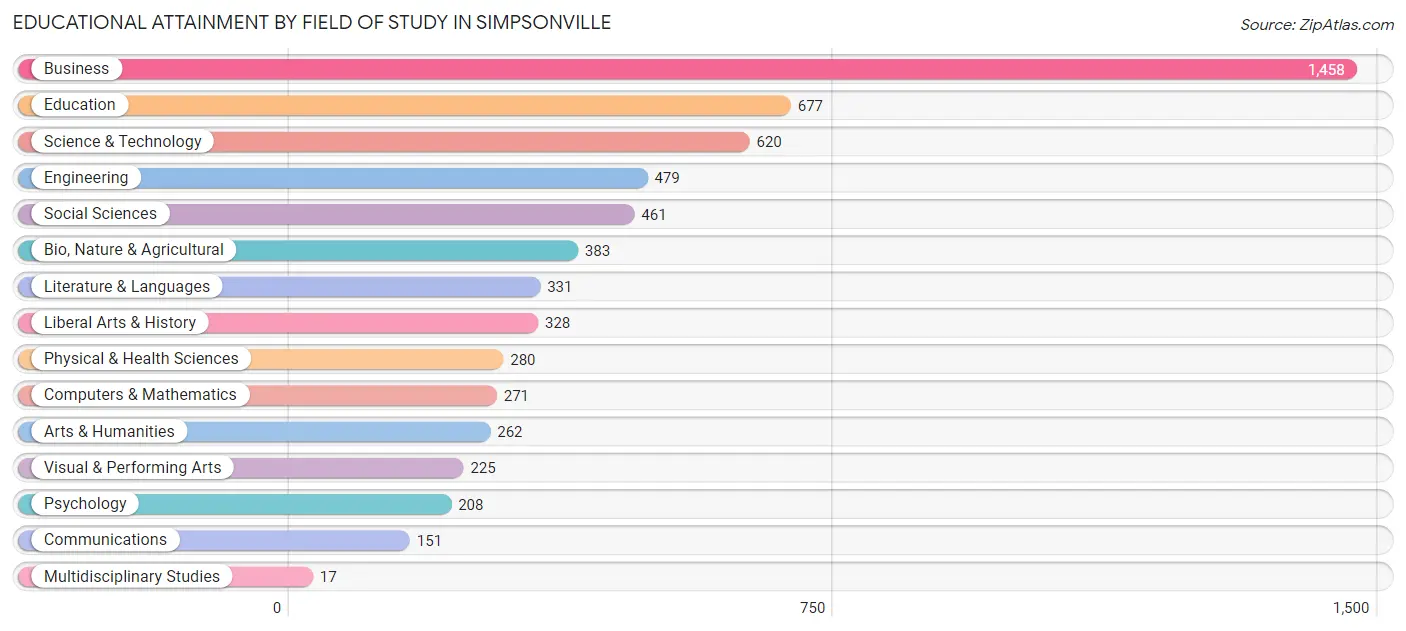
Educational Attainment by Field of Study in Simpsonville
Business (1,458 | 23.7%), education (677 | 11.0%), science & technology (620 | 10.1%), engineering (479 | 7.8%), and social sciences (461 | 7.5%) are the most common fields of study among 6,151 individuals in Simpsonville who have obtained a bachelor's degree or higher.
| Field of Study | # Graduates | % Graduates |
| Computers & Mathematics | 271 | 4.4% |
| Bio, Nature & Agricultural | 383 | 6.2% |
| Physical & Health Sciences | 280 | 4.5% |
| Psychology | 208 | 3.4% |
| Social Sciences | 461 | 7.5% |
| Engineering | 479 | 7.8% |
| Multidisciplinary Studies | 17 | 0.3% |
| Science & Technology | 620 | 10.1% |
| Business | 1,458 | 23.7% |
| Education | 677 | 11.0% |
| Literature & Languages | 331 | 5.4% |
| Liberal Arts & History | 328 | 5.3% |
| Visual & Performing Arts | 225 | 3.7% |
| Communications | 151 | 2.5% |
| Arts & Humanities | 262 | 4.3% |
| Total | 6,151 | 100.0% |
Transportation & Commute in Simpsonville
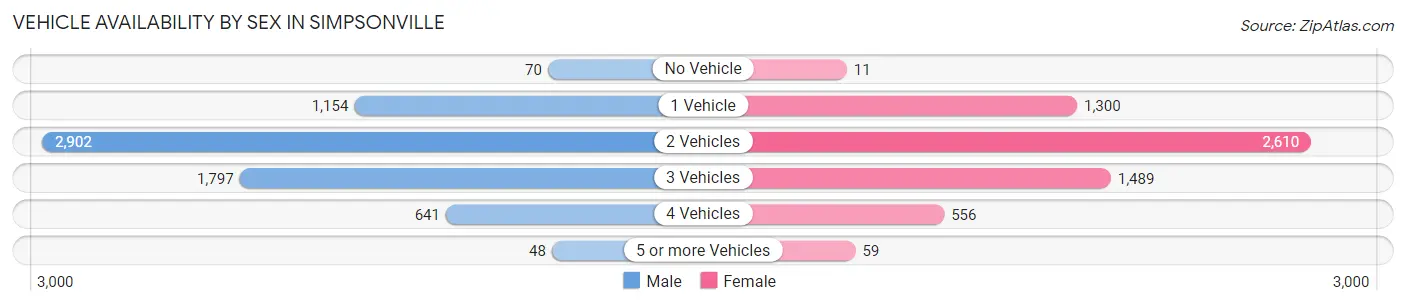
Vehicle Availability by Sex in Simpsonville
The most prevalent vehicle ownership categories in Simpsonville are males with 2 vehicles (2,902, accounting for 43.9%) and females with 2 vehicles (2,610, making up 48.2%).
| Vehicles Available | Male | Female |
| No Vehicle | 70 (1.1%) | 11 (0.2%) |
| 1 Vehicle | 1,154 (17.4%) | 1,300 (21.6%) |
| 2 Vehicles | 2,902 (43.9%) | 2,610 (43.3%) |
| 3 Vehicles | 1,797 (27.2%) | 1,489 (24.7%) |
| 4 Vehicles | 641 (9.7%) | 556 (9.2%) |
| 5 or more Vehicles | 48 (0.7%) | 59 (1.0%) |
| Total | 6,612 (100.0%) | 6,025 (100.0%) |
Commute Time in Simpsonville
The most frequently occuring commute durations in Simpsonville are 20 to 24 minutes (2,084 commuters, 18.9%), 15 to 19 minutes (1,986 commuters, 18.0%), and 30 to 34 minutes (1,713 commuters, 15.5%).
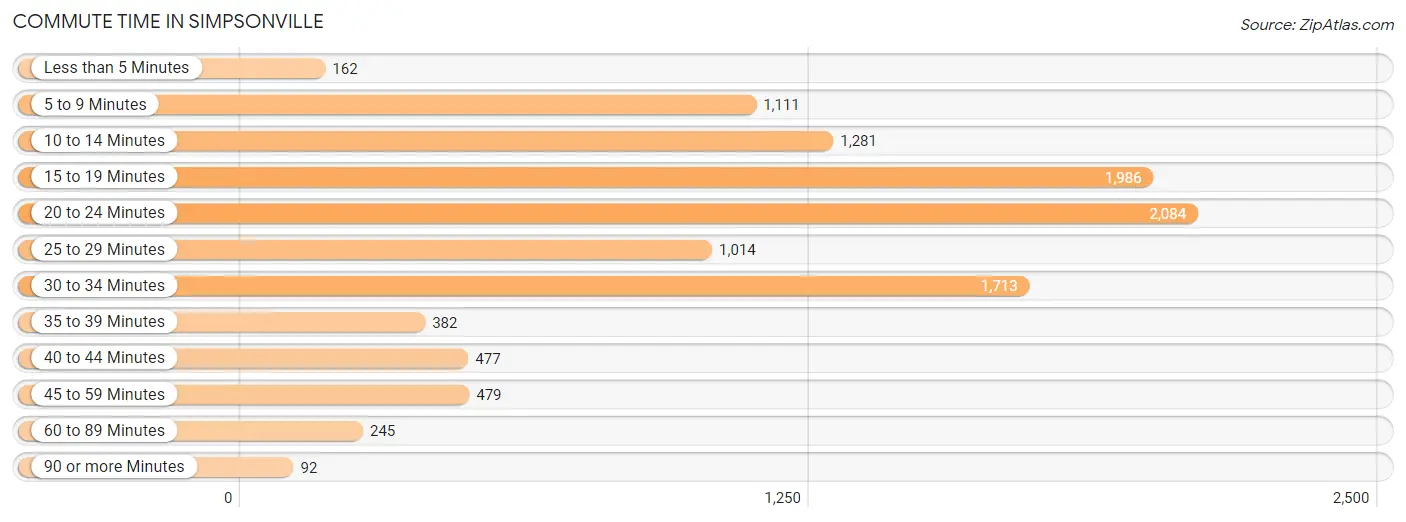
| Commute Time | # Commuters | % Commuters |
| Less than 5 Minutes | 162 | 1.5% |
| 5 to 9 Minutes | 1,111 | 10.1% |
| 10 to 14 Minutes | 1,281 | 11.6% |
| 15 to 19 Minutes | 1,986 | 18.0% |
| 20 to 24 Minutes | 2,084 | 18.9% |
| 25 to 29 Minutes | 1,014 | 9.2% |
| 30 to 34 Minutes | 1,713 | 15.5% |
| 35 to 39 Minutes | 382 | 3.5% |
| 40 to 44 Minutes | 477 | 4.3% |
| 45 to 59 Minutes | 479 | 4.3% |
| 60 to 89 Minutes | 245 | 2.2% |
| 90 or more Minutes | 92 | 0.8% |
Commute Time by Sex in Simpsonville
The most common commute times in Simpsonville are 20 to 24 minutes (1,139 commuters, 19.4%) for males and 15 to 19 minutes (1,192 commuters, 23.2%) for females.
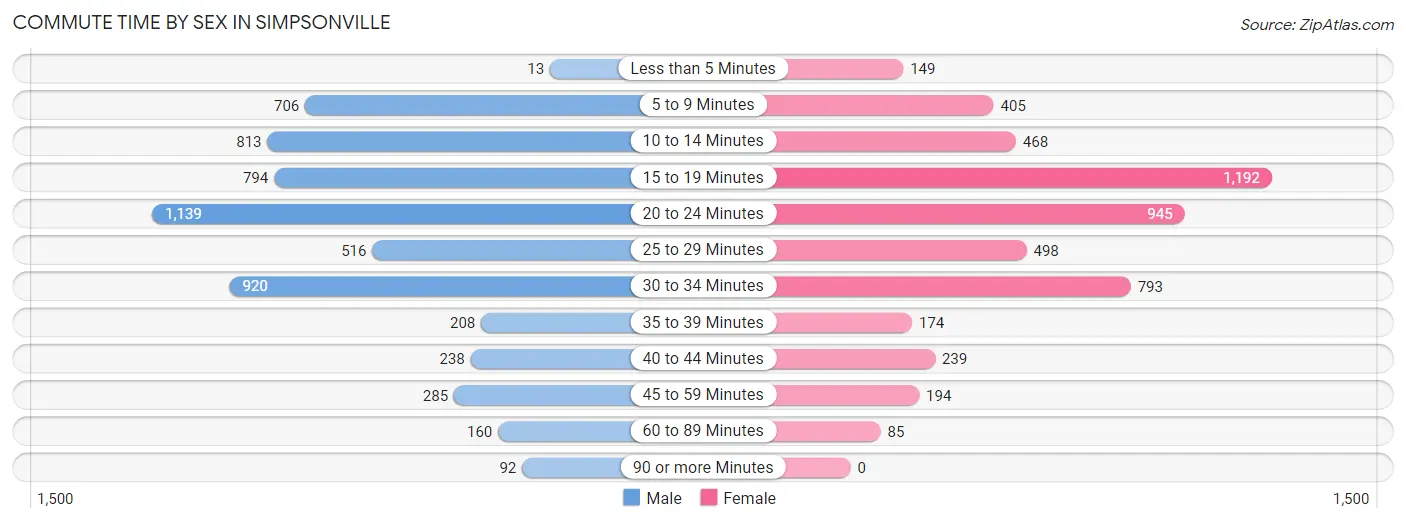
| Commute Time | Male | Female |
| Less than 5 Minutes | 13 (0.2%) | 149 (2.9%) |
| 5 to 9 Minutes | 706 (12.0%) | 405 (7.9%) |
| 10 to 14 Minutes | 813 (13.8%) | 468 (9.1%) |
| 15 to 19 Minutes | 794 (13.5%) | 1,192 (23.2%) |
| 20 to 24 Minutes | 1,139 (19.4%) | 945 (18.4%) |
| 25 to 29 Minutes | 516 (8.8%) | 498 (9.7%) |
| 30 to 34 Minutes | 920 (15.6%) | 793 (15.4%) |
| 35 to 39 Minutes | 208 (3.5%) | 174 (3.4%) |
| 40 to 44 Minutes | 238 (4.0%) | 239 (4.6%) |
| 45 to 59 Minutes | 285 (4.8%) | 194 (3.8%) |
| 60 to 89 Minutes | 160 (2.7%) | 85 (1.7%) |
| 90 or more Minutes | 92 (1.6%) | 0 (0.0%) |
Time of Departure to Work by Sex in Simpsonville
The most frequent times of departure to work in Simpsonville are 12:00 PM to 3:59 PM (753, 12.8%) for males and 7:30 AM to 7:59 AM (931, 18.1%) for females.
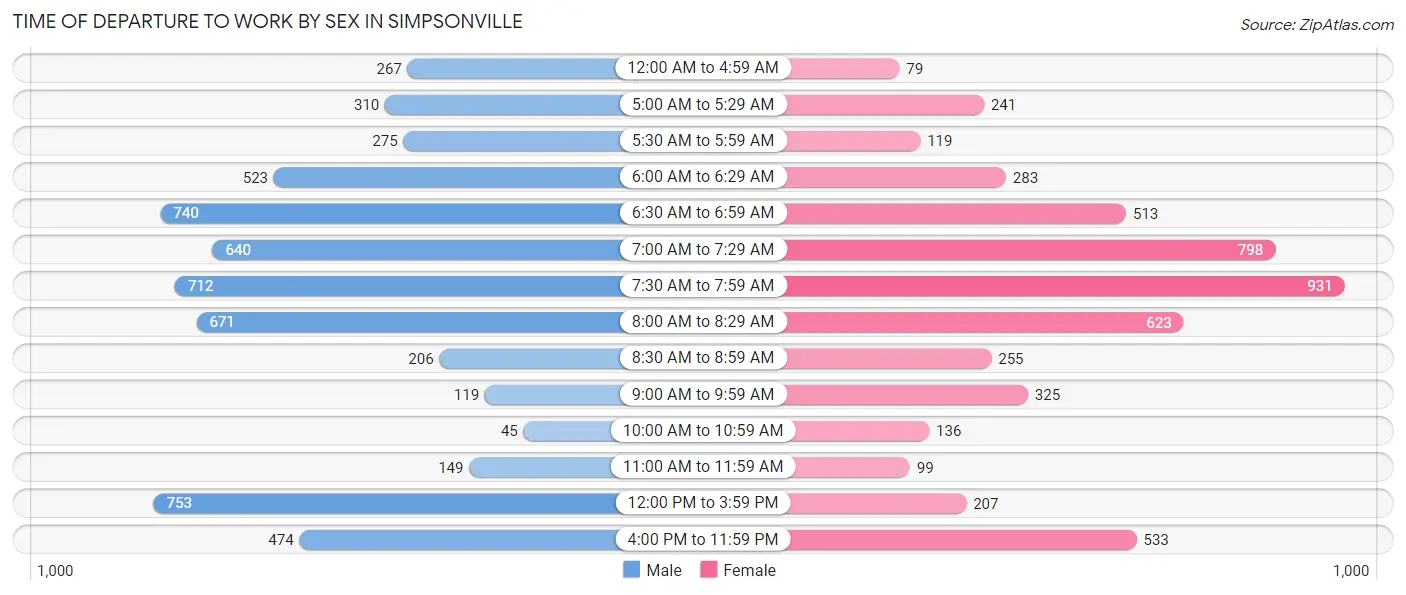
| Time of Departure | Male | Female |
| 12:00 AM to 4:59 AM | 267 (4.5%) | 79 (1.5%) |
| 5:00 AM to 5:29 AM | 310 (5.3%) | 241 (4.7%) |
| 5:30 AM to 5:59 AM | 275 (4.7%) | 119 (2.3%) |
| 6:00 AM to 6:29 AM | 523 (8.9%) | 283 (5.5%) |
| 6:30 AM to 6:59 AM | 740 (12.6%) | 513 (10.0%) |
| 7:00 AM to 7:29 AM | 640 (10.9%) | 798 (15.5%) |
| 7:30 AM to 7:59 AM | 712 (12.1%) | 931 (18.1%) |
| 8:00 AM to 8:29 AM | 671 (11.4%) | 623 (12.1%) |
| 8:30 AM to 8:59 AM | 206 (3.5%) | 255 (5.0%) |
| 9:00 AM to 9:59 AM | 119 (2.0%) | 325 (6.3%) |
| 10:00 AM to 10:59 AM | 45 (0.8%) | 136 (2.6%) |
| 11:00 AM to 11:59 AM | 149 (2.5%) | 99 (1.9%) |
| 12:00 PM to 3:59 PM | 753 (12.8%) | 207 (4.0%) |
| 4:00 PM to 11:59 PM | 474 (8.1%) | 533 (10.4%) |
| Total | 5,884 (100.0%) | 5,142 (100.0%) |
Housing Occupancy in Simpsonville
Occupancy by Ownership in Simpsonville
Of the total 9,257 dwellings in Simpsonville, owner-occupied units account for 6,473 (69.9%), while renter-occupied units make up 2,784 (30.1%).
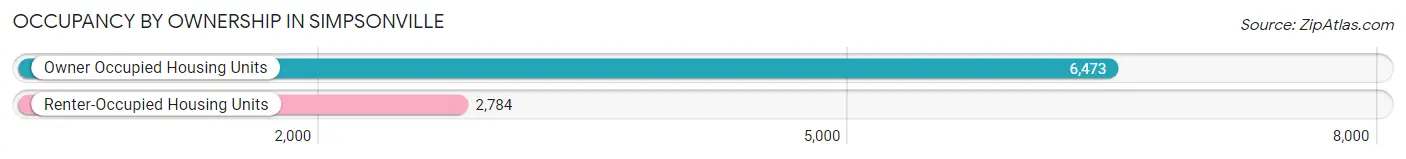
| Occupancy | # Housing Units | % Housing Units |
| Owner Occupied Housing Units | 6,473 | 69.9% |
| Renter-Occupied Housing Units | 2,784 | 30.1% |
| Total Occupied Housing Units | 9,257 | 100.0% |
Occupancy by Household Size in Simpsonville
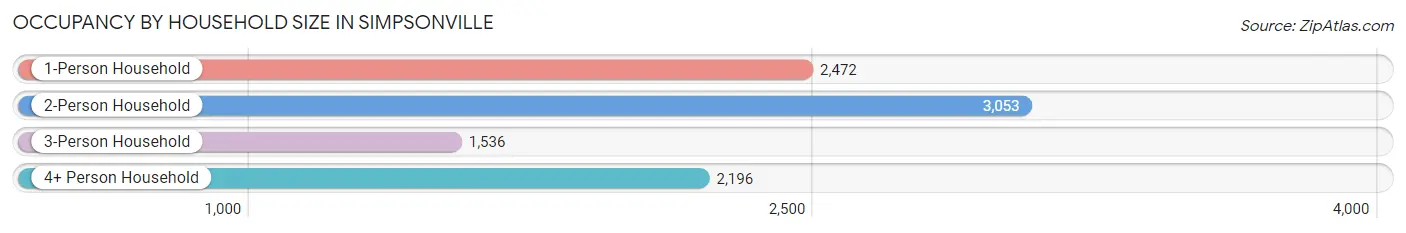
| Household Size | # Housing Units | % Housing Units |
| 1-Person Household | 2,472 | 26.7% |
| 2-Person Household | 3,053 | 33.0% |
| 3-Person Household | 1,536 | 16.6% |
| 4+ Person Household | 2,196 | 23.7% |
| Total Housing Units | 9,257 | 100.0% |
Occupancy by Ownership by Household Size in Simpsonville
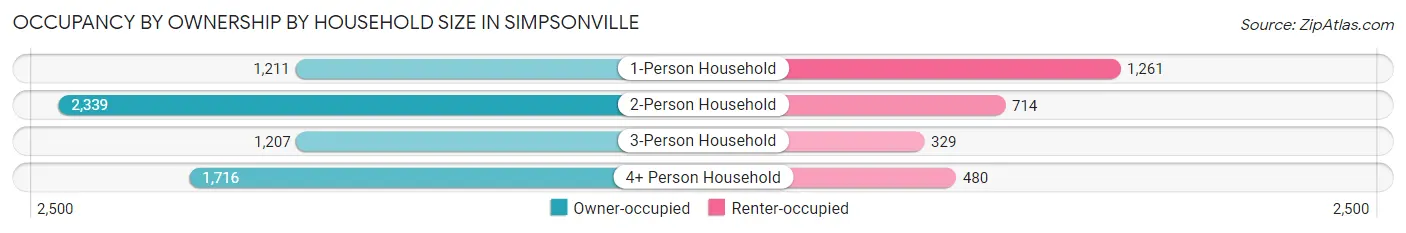
| Household Size | Owner-occupied | Renter-occupied |
| 1-Person Household | 1,211 (49.0%) | 1,261 (51.0%) |
| 2-Person Household | 2,339 (76.6%) | 714 (23.4%) |
| 3-Person Household | 1,207 (78.6%) | 329 (21.4%) |
| 4+ Person Household | 1,716 (78.1%) | 480 (21.9%) |
| Total Housing Units | 6,473 (69.9%) | 2,784 (30.1%) |
Occupancy by Educational Attainment in Simpsonville
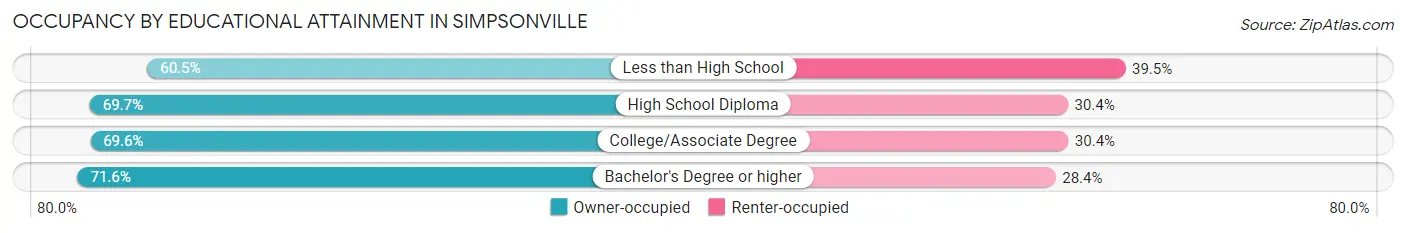
| Household Size | Owner-occupied | Renter-occupied |
| Less than High School | 250 (60.5%) | 163 (39.5%) |
| High School Diploma | 1,457 (69.7%) | 635 (30.3%) |
| College/Associate Degree | 2,357 (69.6%) | 1,030 (30.4%) |
| Bachelor's Degree or higher | 2,409 (71.6%) | 956 (28.4%) |
Occupancy by Age of Householder in Simpsonville
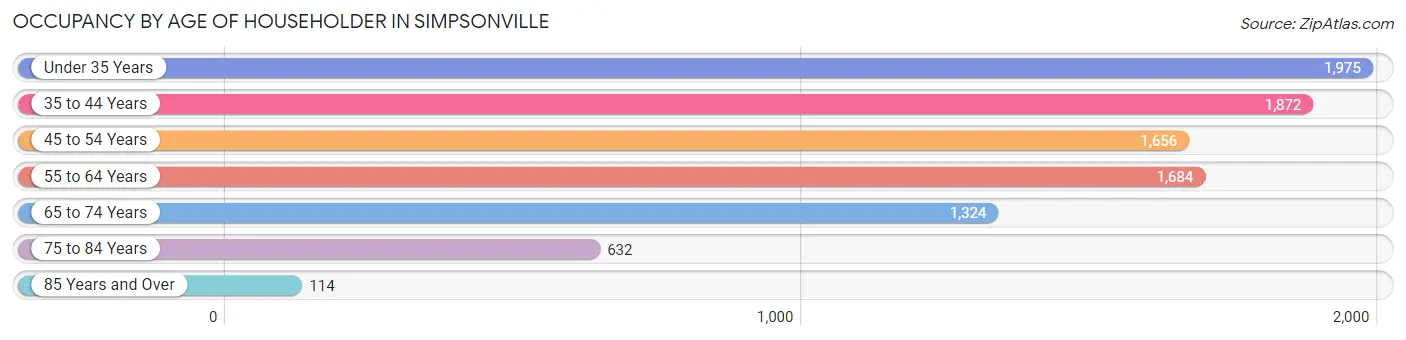
| Age Bracket | # Households | % Households |
| Under 35 Years | 1,975 | 21.3% |
| 35 to 44 Years | 1,872 | 20.2% |
| 45 to 54 Years | 1,656 | 17.9% |
| 55 to 64 Years | 1,684 | 18.2% |
| 65 to 74 Years | 1,324 | 14.3% |
| 75 to 84 Years | 632 | 6.8% |
| 85 Years and Over | 114 | 1.2% |
| Total | 9,257 | 100.0% |
Housing Finances in Simpsonville
Median Income by Occupancy in Simpsonville
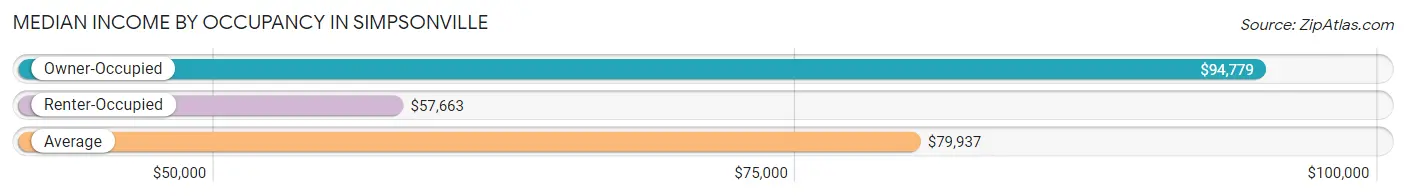
| Occupancy Type | # Households | Median Income |
| Owner-Occupied | 6,473 (69.9%) | $94,779 |
| Renter-Occupied | 2,784 (30.1%) | $57,663 |
| Average | 9,257 (100.0%) | $79,937 |
Occupancy by Householder Income Bracket in Simpsonville
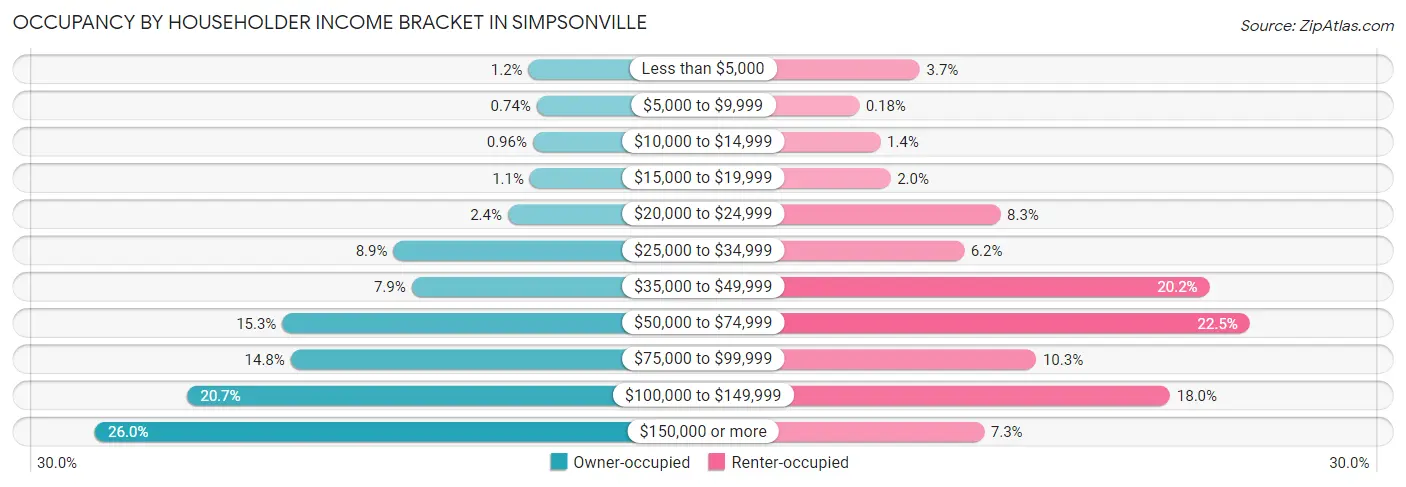
| Income Bracket | Owner-occupied | Renter-occupied |
| Less than $5,000 | 78 (1.2%) | 102 (3.7%) |
| $5,000 to $9,999 | 48 (0.7%) | 5 (0.2%) |
| $10,000 to $14,999 | 62 (1.0%) | 39 (1.4%) |
| $15,000 to $19,999 | 73 (1.1%) | 55 (2.0%) |
| $20,000 to $24,999 | 155 (2.4%) | 230 (8.3%) |
| $25,000 to $34,999 | 578 (8.9%) | 172 (6.2%) |
| $35,000 to $49,999 | 511 (7.9%) | 563 (20.2%) |
| $50,000 to $74,999 | 989 (15.3%) | 627 (22.5%) |
| $75,000 to $99,999 | 958 (14.8%) | 287 (10.3%) |
| $100,000 to $149,999 | 1,340 (20.7%) | 500 (18.0%) |
| $150,000 or more | 1,681 (26.0%) | 204 (7.3%) |
| Total | 6,473 (100.0%) | 2,784 (100.0%) |
Monthly Housing Cost Tiers in Simpsonville
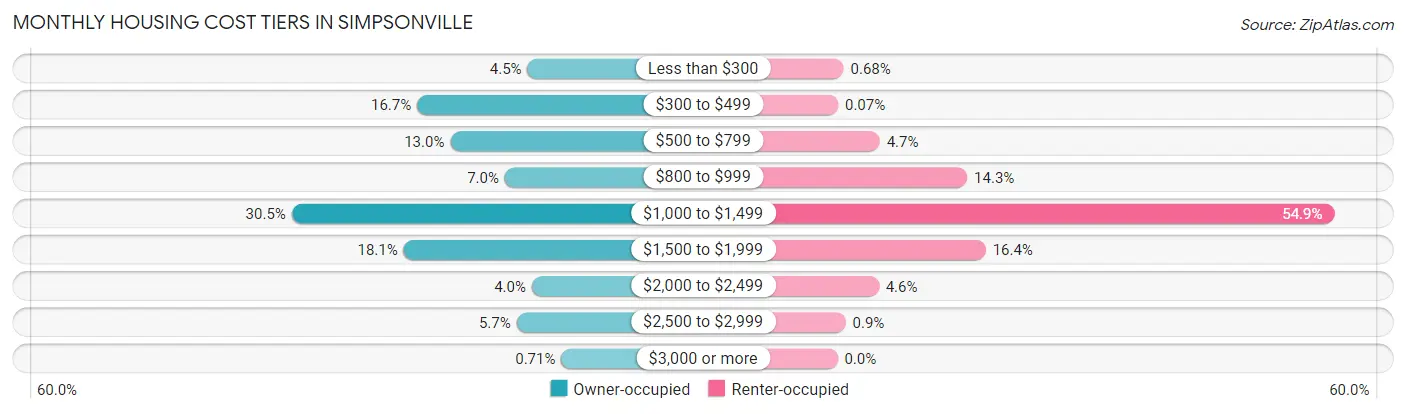
| Monthly Cost | Owner-occupied | Renter-occupied |
| Less than $300 | 288 (4.4%) | 19 (0.7%) |
| $300 to $499 | 1,078 (16.7%) | 2 (0.1%) |
| $500 to $799 | 840 (13.0%) | 130 (4.7%) |
| $800 to $999 | 450 (7.0%) | 399 (14.3%) |
| $1,000 to $1,499 | 1,974 (30.5%) | 1,528 (54.9%) |
| $1,500 to $1,999 | 1,174 (18.1%) | 456 (16.4%) |
| $2,000 to $2,499 | 257 (4.0%) | 127 (4.6%) |
| $2,500 to $2,999 | 366 (5.7%) | 25 (0.9%) |
| $3,000 or more | 46 (0.7%) | 0 (0.0%) |
| Total | 6,473 (100.0%) | 2,784 (100.0%) |
Physical Housing Characteristics in Simpsonville
Housing Structures in Simpsonville
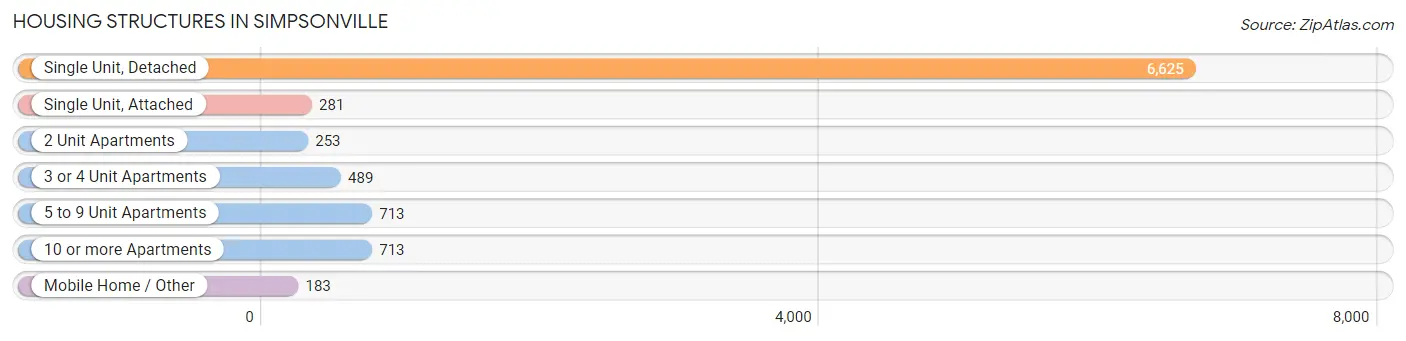
| Structure Type | # Housing Units | % Housing Units |
| Single Unit, Detached | 6,625 | 71.6% |
| Single Unit, Attached | 281 | 3.0% |
| 2 Unit Apartments | 253 | 2.7% |
| 3 or 4 Unit Apartments | 489 | 5.3% |
| 5 to 9 Unit Apartments | 713 | 7.7% |
| 10 or more Apartments | 713 | 7.7% |
| Mobile Home / Other | 183 | 2.0% |
| Total | 9,257 | 100.0% |
Housing Structures by Occupancy in Simpsonville
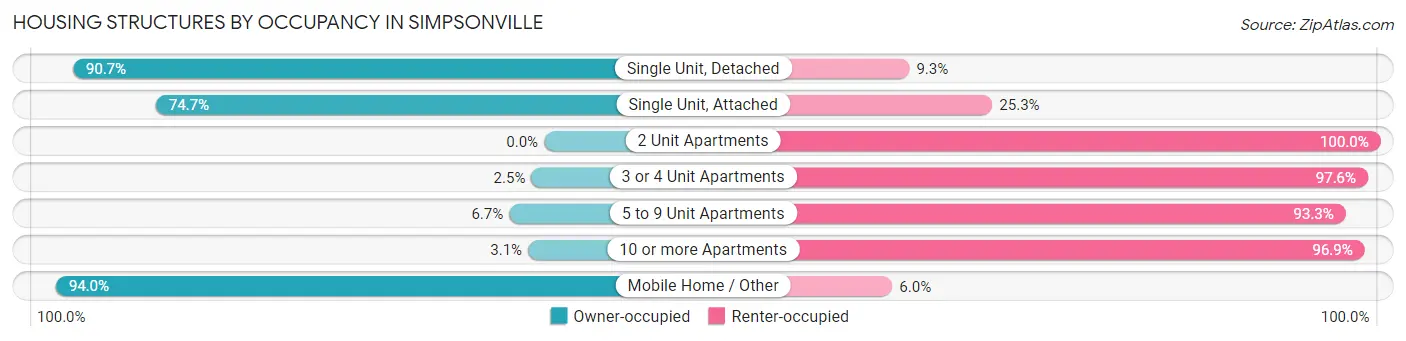
| Structure Type | Owner-occupied | Renter-occupied |
| Single Unit, Detached | 6,009 (90.7%) | 616 (9.3%) |
| Single Unit, Attached | 210 (74.7%) | 71 (25.3%) |
| 2 Unit Apartments | 0 (0.0%) | 253 (100.0%) |
| 3 or 4 Unit Apartments | 12 (2.5%) | 477 (97.6%) |
| 5 to 9 Unit Apartments | 48 (6.7%) | 665 (93.3%) |
| 10 or more Apartments | 22 (3.1%) | 691 (96.9%) |
| Mobile Home / Other | 172 (94.0%) | 11 (6.0%) |
| Total | 6,473 (69.9%) | 2,784 (30.1%) |
Housing Structures by Number of Rooms in Simpsonville
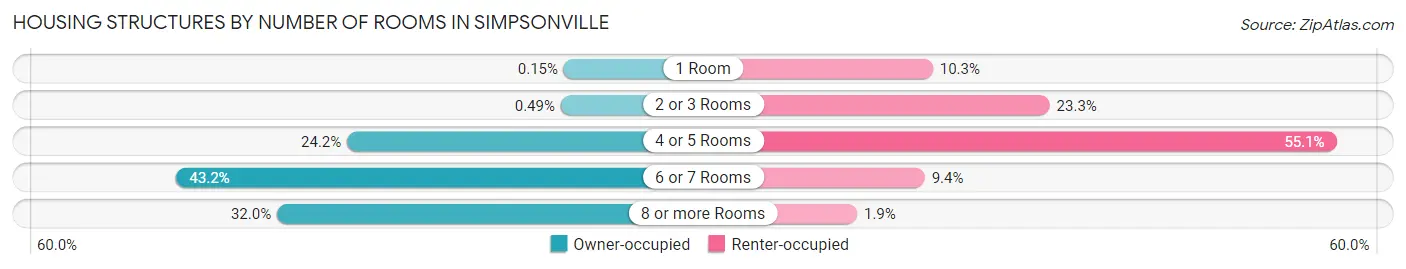
| Number of Rooms | Owner-occupied | Renter-occupied |
| 1 Room | 10 (0.2%) | 287 (10.3%) |
| 2 or 3 Rooms | 32 (0.5%) | 648 (23.3%) |
| 4 or 5 Rooms | 1,567 (24.2%) | 1,534 (55.1%) |
| 6 or 7 Rooms | 2,793 (43.1%) | 262 (9.4%) |
| 8 or more Rooms | 2,071 (32.0%) | 53 (1.9%) |
| Total | 6,473 (100.0%) | 2,784 (100.0%) |
Housing Structure by Heating Type in Simpsonville
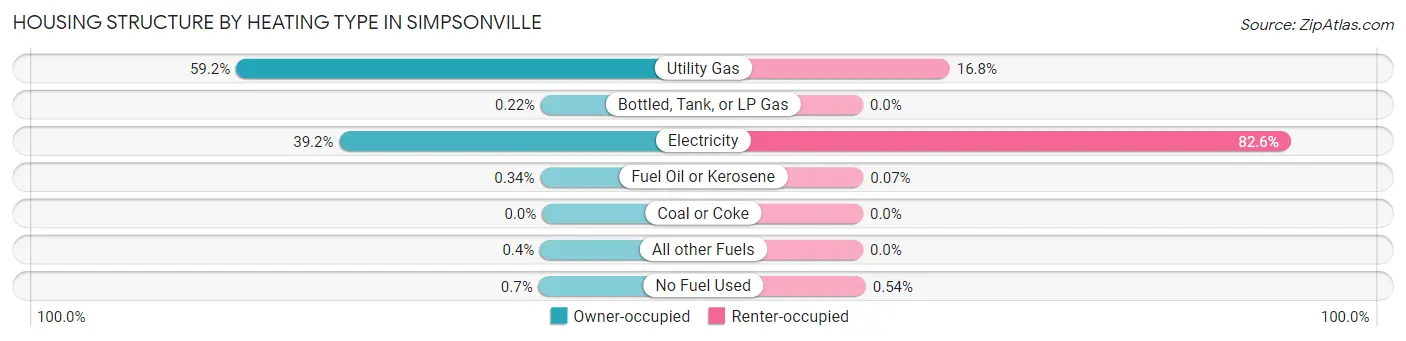
| Heating Type | Owner-occupied | Renter-occupied |
| Utility Gas | 3,829 (59.2%) | 467 (16.8%) |
| Bottled, Tank, or LP Gas | 14 (0.2%) | 0 (0.0%) |
| Electricity | 2,537 (39.2%) | 2,300 (82.6%) |
| Fuel Oil or Kerosene | 22 (0.3%) | 2 (0.1%) |
| Coal or Coke | 0 (0.0%) | 0 (0.0%) |
| All other Fuels | 26 (0.4%) | 0 (0.0%) |
| No Fuel Used | 45 (0.7%) | 15 (0.5%) |
| Total | 6,473 (100.0%) | 2,784 (100.0%) |
Household Vehicle Usage in Simpsonville
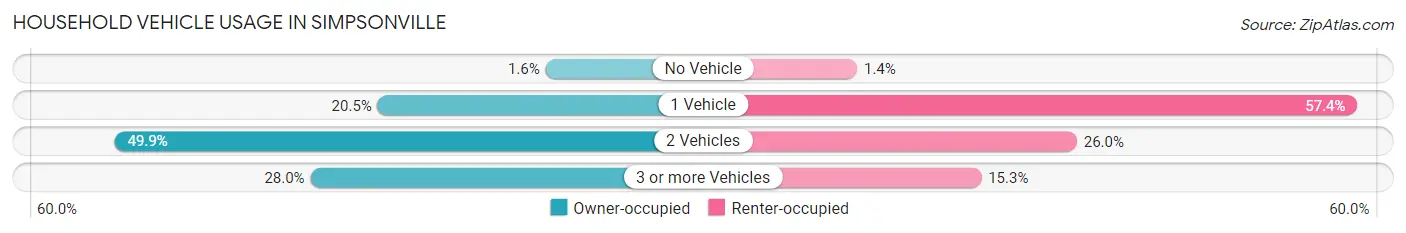
| Vehicles per Household | Owner-occupied | Renter-occupied |
| No Vehicle | 106 (1.6%) | 38 (1.4%) |
| 1 Vehicle | 1,324 (20.4%) | 1,598 (57.4%) |
| 2 Vehicles | 3,232 (49.9%) | 723 (26.0%) |
| 3 or more Vehicles | 1,811 (28.0%) | 425 (15.3%) |
| Total | 6,473 (100.0%) | 2,784 (100.0%) |
Real Estate & Mortgages in Simpsonville
Real Estate and Mortgage Overview in Simpsonville
| Characteristic | Without Mortgage | With Mortgage |
| Housing Units | 1,964 | 4,509 |
| Median Property Value | $201,200 | $253,700 |
| Median Household Income | $74,085 | $1,327 |
| Monthly Housing Costs | $429 | $46 |
| Real Estate Taxes | $1,179 | $97 |
Property Value by Mortgage Status in Simpsonville
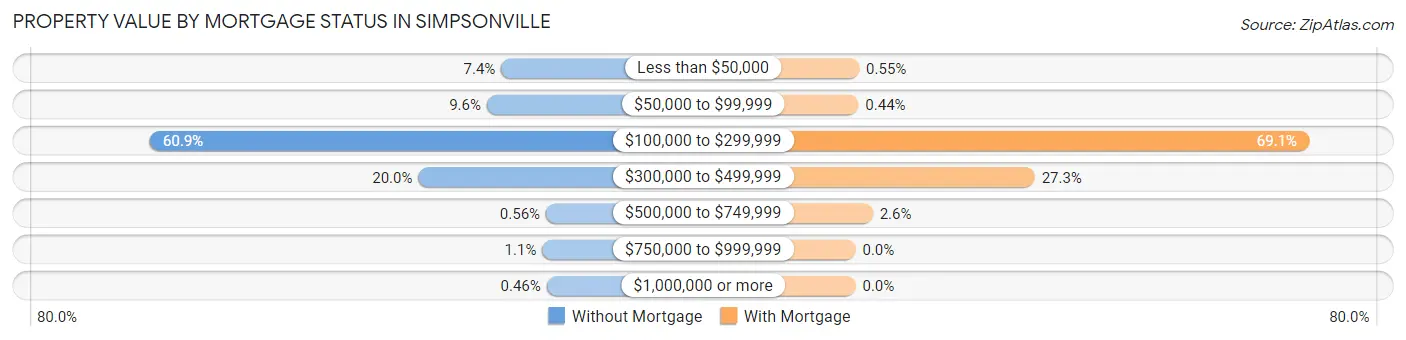
| Property Value | Without Mortgage | With Mortgage |
| Less than $50,000 | 145 (7.4%) | 25 (0.5%) |
| $50,000 to $99,999 | 188 (9.6%) | 20 (0.4%) |
| $100,000 to $299,999 | 1,196 (60.9%) | 3,115 (69.1%) |
| $300,000 to $499,999 | 393 (20.0%) | 1,231 (27.3%) |
| $500,000 to $749,999 | 11 (0.6%) | 118 (2.6%) |
| $750,000 to $999,999 | 22 (1.1%) | 0 (0.0%) |
| $1,000,000 or more | 9 (0.5%) | 0 (0.0%) |
| Total | 1,964 (100.0%) | 4,509 (100.0%) |
Household Income by Mortgage Status in Simpsonville
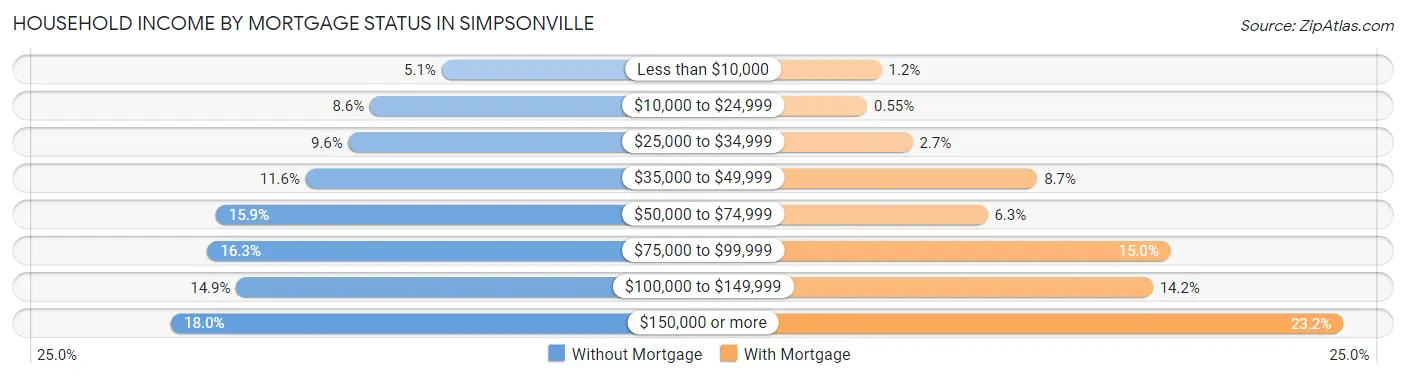
| Household Income | Without Mortgage | With Mortgage |
| Less than $10,000 | 101 (5.1%) | 56 (1.2%) |
| $10,000 to $24,999 | 168 (8.6%) | 25 (0.5%) |
| $25,000 to $34,999 | 188 (9.6%) | 122 (2.7%) |
| $35,000 to $49,999 | 228 (11.6%) | 390 (8.6%) |
| $50,000 to $74,999 | 312 (15.9%) | 283 (6.3%) |
| $75,000 to $99,999 | 320 (16.3%) | 677 (15.0%) |
| $100,000 to $149,999 | 293 (14.9%) | 638 (14.1%) |
| $150,000 or more | 354 (18.0%) | 1,047 (23.2%) |
| Total | 1,964 (100.0%) | 4,509 (100.0%) |
Property Value to Household Income Ratio in Simpsonville
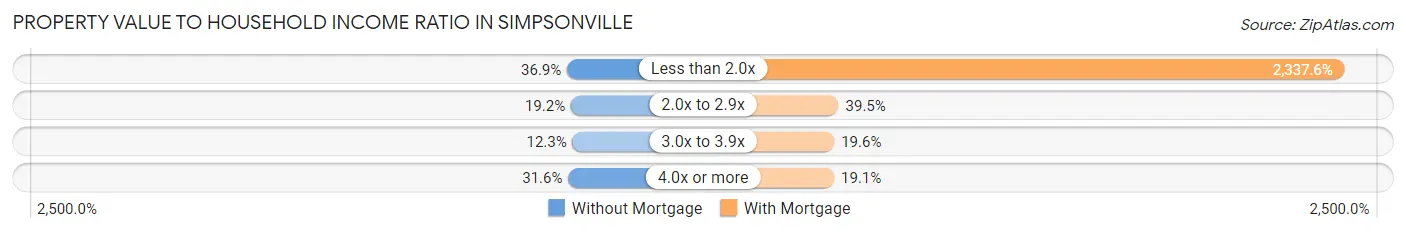
| Value-to-Income Ratio | Without Mortgage | With Mortgage |
| Less than 2.0x | 725 (36.9%) | 105,402 (2,337.6%) |
| 2.0x to 2.9x | 377 (19.2%) | 1,779 (39.5%) |
| 3.0x to 3.9x | 242 (12.3%) | 885 (19.6%) |
| 4.0x or more | 620 (31.6%) | 863 (19.1%) |
| Total | 1,964 (100.0%) | 4,509 (100.0%) |
Real Estate Taxes by Mortgage Status in Simpsonville
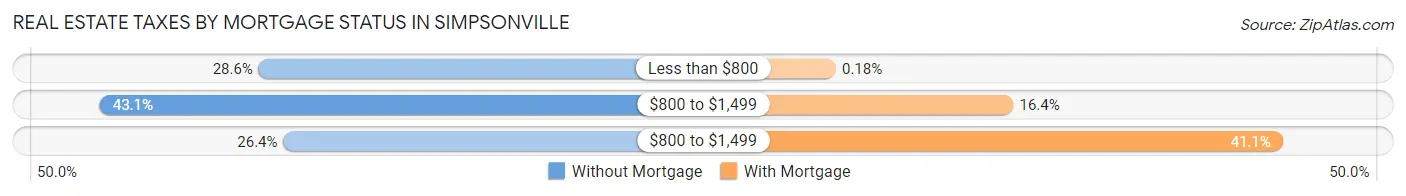
| Property Taxes | Without Mortgage | With Mortgage |
| Less than $800 | 562 (28.6%) | 8 (0.2%) |
| $800 to $1,499 | 847 (43.1%) | 739 (16.4%) |
| $800 to $1,499 | 518 (26.4%) | 1,852 (41.1%) |
| Total | 1,964 (100.0%) | 4,509 (100.0%) |
Health & Disability in Simpsonville
Health Insurance Coverage by Age in Simpsonville
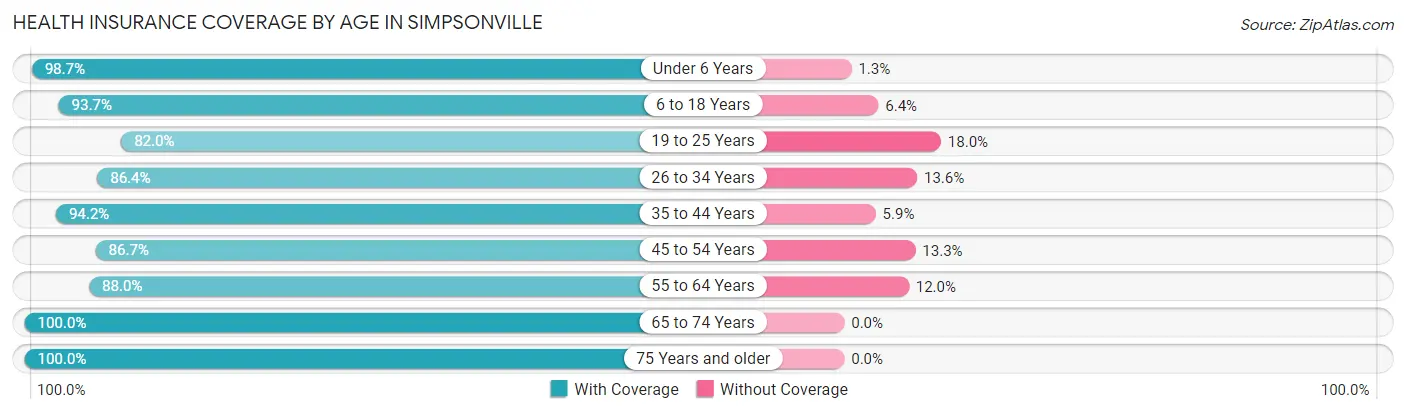
| Age Bracket | With Coverage | Without Coverage |
| Under 6 Years | 1,772 (98.7%) | 24 (1.3%) |
| 6 to 18 Years | 3,862 (93.6%) | 262 (6.4%) |
| 19 to 25 Years | 1,956 (82.0%) | 430 (18.0%) |
| 26 to 34 Years | 2,592 (86.4%) | 407 (13.6%) |
| 35 to 44 Years | 3,526 (94.2%) | 219 (5.9%) |
| 45 to 54 Years | 2,310 (86.7%) | 353 (13.3%) |
| 55 to 64 Years | 2,537 (88.0%) | 347 (12.0%) |
| 65 to 74 Years | 2,077 (100.0%) | 0 (0.0%) |
| 75 Years and older | 1,255 (100.0%) | 0 (0.0%) |
| Total | 21,887 (91.5%) | 2,042 (8.5%) |
Health Insurance Coverage by Citizenship Status in Simpsonville
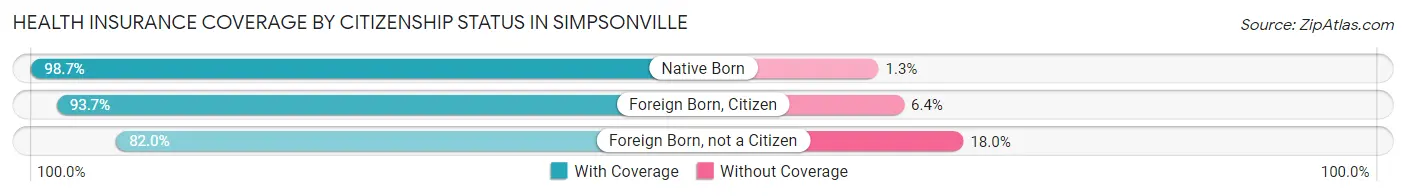
| Citizenship Status | With Coverage | Without Coverage |
| Native Born | 1,772 (98.7%) | 24 (1.3%) |
| Foreign Born, Citizen | 3,862 (93.6%) | 262 (6.4%) |
| Foreign Born, not a Citizen | 1,956 (82.0%) | 430 (18.0%) |
Health Insurance Coverage by Household Income in Simpsonville
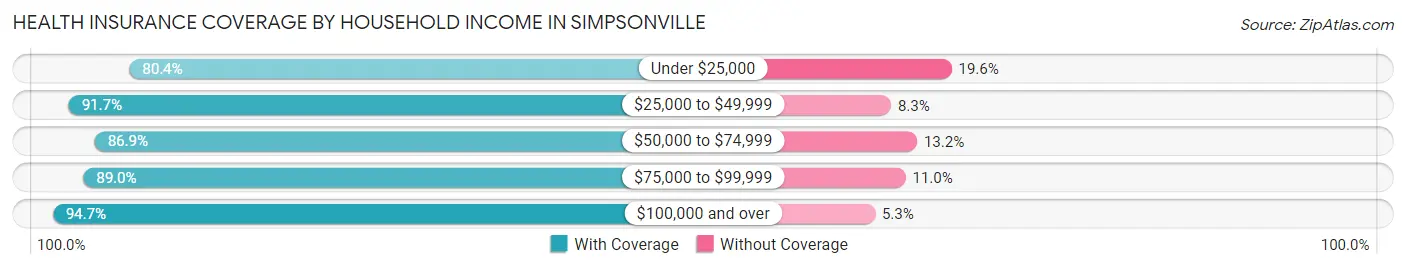
| Household Income | With Coverage | Without Coverage |
| Under $25,000 | 1,036 (80.4%) | 253 (19.6%) |
| $25,000 to $49,999 | 3,356 (91.7%) | 303 (8.3%) |
| $50,000 to $74,999 | 3,196 (86.9%) | 484 (13.2%) |
| $75,000 to $99,999 | 3,017 (89.0%) | 373 (11.0%) |
| $100,000 and over | 11,273 (94.7%) | 629 (5.3%) |
Public vs Private Health Insurance Coverage by Age in Simpsonville
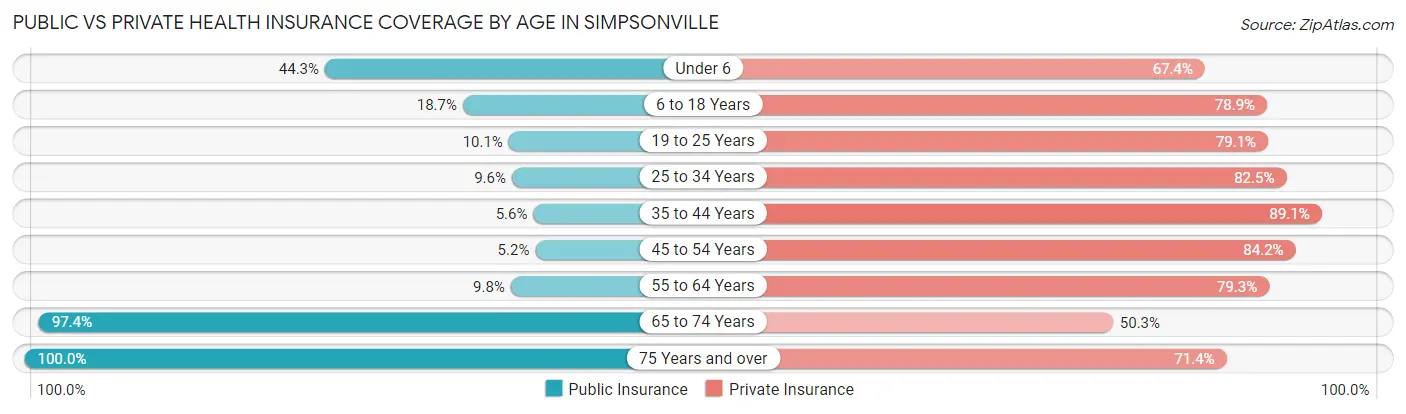
| Age Bracket | Public Insurance | Private Insurance |
| Under 6 | 795 (44.3%) | 1,210 (67.4%) |
| 6 to 18 Years | 770 (18.7%) | 3,254 (78.9%) |
| 19 to 25 Years | 242 (10.1%) | 1,887 (79.1%) |
| 25 to 34 Years | 287 (9.6%) | 2,474 (82.5%) |
| 35 to 44 Years | 209 (5.6%) | 3,335 (89.0%) |
| 45 to 54 Years | 139 (5.2%) | 2,242 (84.2%) |
| 55 to 64 Years | 282 (9.8%) | 2,287 (79.3%) |
| 65 to 74 Years | 2,022 (97.4%) | 1,045 (50.3%) |
| 75 Years and over | 1,255 (100.0%) | 896 (71.4%) |
| Total | 6,001 (25.1%) | 18,630 (77.9%) |
Disability Status by Sex by Age in Simpsonville
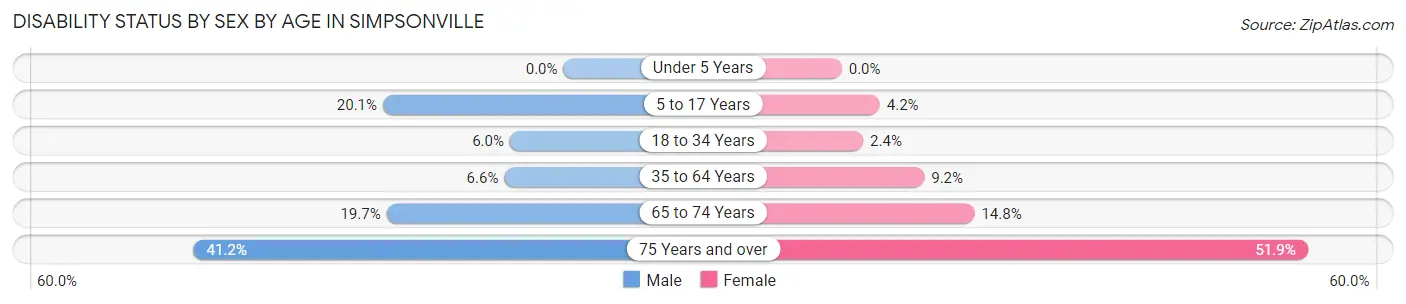
| Age Bracket | Male | Female |
| Under 5 Years | 0 (0.0%) | 0 (0.0%) |
| 5 to 17 Years | 501 (20.1%) | 83 (4.2%) |
| 18 to 34 Years | 166 (6.0%) | 64 (2.4%) |
| 35 to 64 Years | 307 (6.6%) | 425 (9.2%) |
| 65 to 74 Years | 200 (19.7%) | 157 (14.8%) |
| 75 Years and over | 196 (41.2%) | 404 (51.9%) |
Disability Class by Sex by Age in Simpsonville
Disability Class: Hearing Difficulty
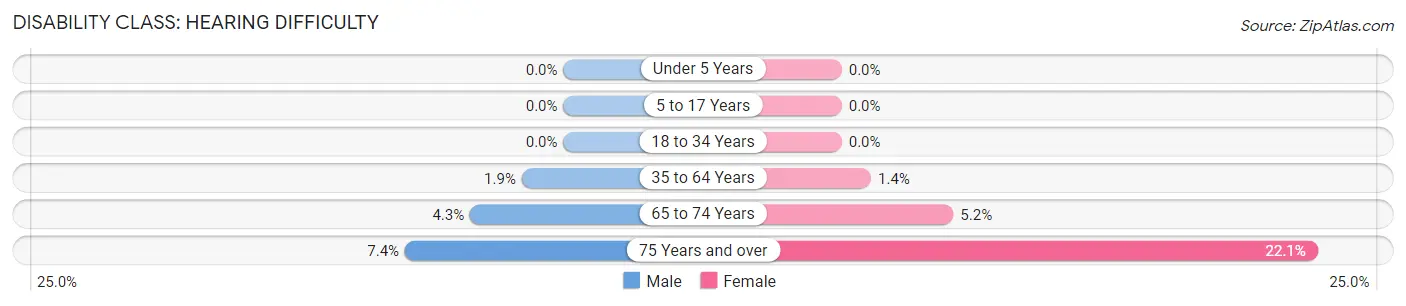
| Age Bracket | Male | Female |
| Under 5 Years | 0 (0.0%) | 0 (0.0%) |
| 5 to 17 Years | 0 (0.0%) | 0 (0.0%) |
| 18 to 34 Years | 0 (0.0%) | 0 (0.0%) |
| 35 to 64 Years | 90 (1.9%) | 63 (1.4%) |
| 65 to 74 Years | 44 (4.3%) | 55 (5.2%) |
| 75 Years and over | 35 (7.3%) | 172 (22.1%) |
Disability Class: Vision Difficulty
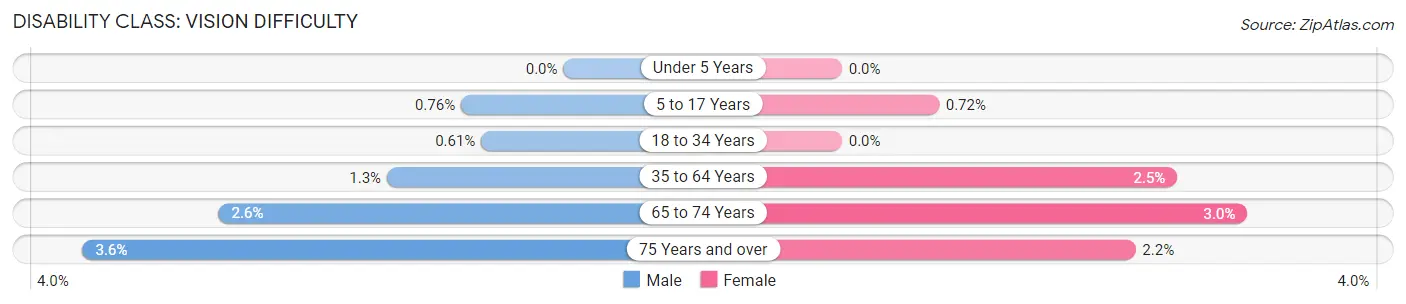
| Age Bracket | Male | Female |
| Under 5 Years | 0 (0.0%) | 0 (0.0%) |
| 5 to 17 Years | 19 (0.8%) | 14 (0.7%) |
| 18 to 34 Years | 17 (0.6%) | 0 (0.0%) |
| 35 to 64 Years | 61 (1.3%) | 115 (2.5%) |
| 65 to 74 Years | 26 (2.6%) | 32 (3.0%) |
| 75 Years and over | 17 (3.6%) | 17 (2.2%) |
Disability Class: Cognitive Difficulty
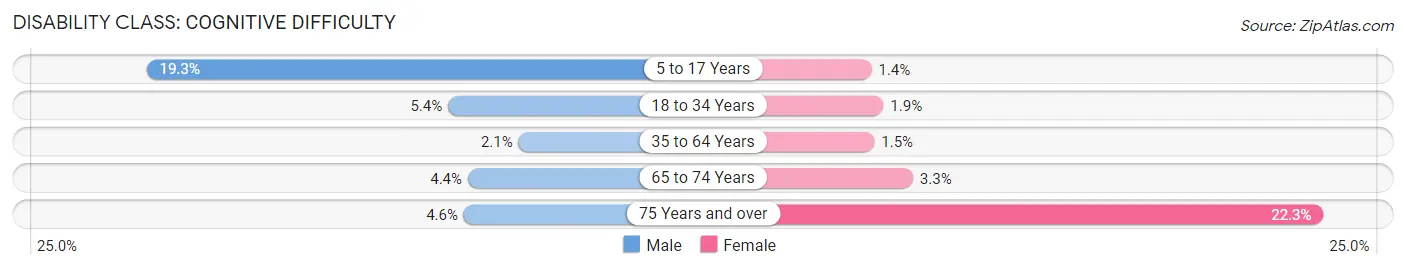
| Age Bracket | Male | Female |
| 5 to 17 Years | 482 (19.3%) | 27 (1.4%) |
| 18 to 34 Years | 149 (5.3%) | 52 (1.9%) |
| 35 to 64 Years | 97 (2.1%) | 70 (1.5%) |
| 65 to 74 Years | 45 (4.4%) | 35 (3.3%) |
| 75 Years and over | 22 (4.6%) | 174 (22.3%) |
Disability Class: Ambulatory Difficulty
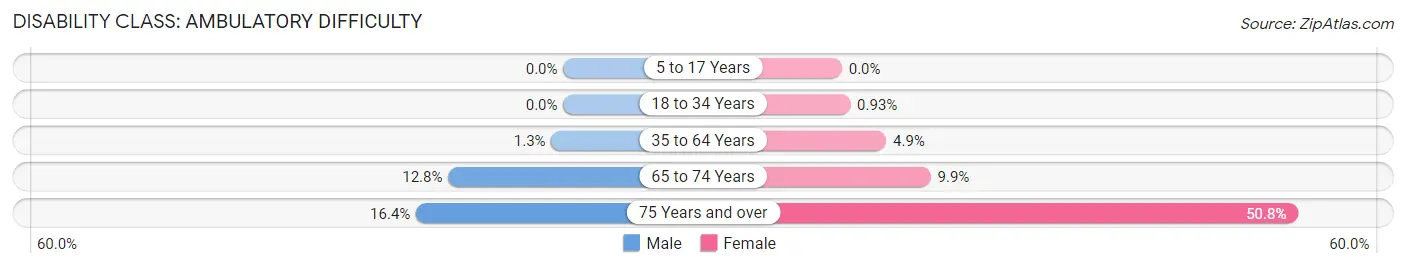
| Age Bracket | Male | Female |
| 5 to 17 Years | 0 (0.0%) | 0 (0.0%) |
| 18 to 34 Years | 0 (0.0%) | 25 (0.9%) |
| 35 to 64 Years | 62 (1.3%) | 228 (4.9%) |
| 65 to 74 Years | 130 (12.8%) | 105 (9.9%) |
| 75 Years and over | 78 (16.4%) | 396 (50.8%) |
Disability Class: Self-Care Difficulty
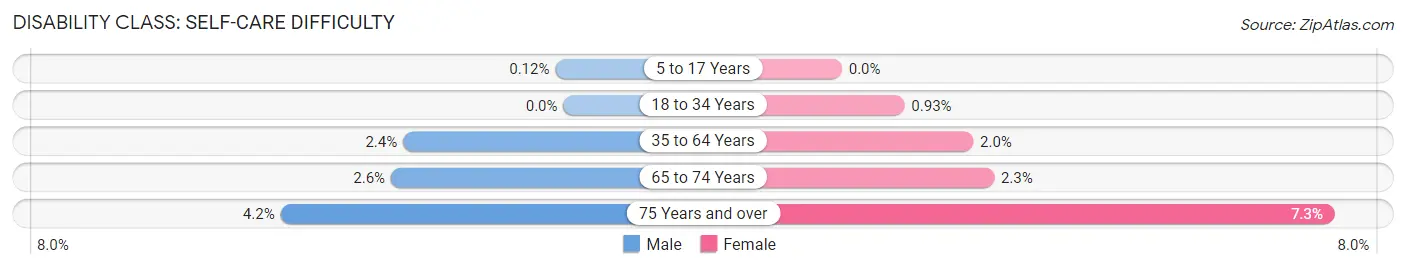
| Age Bracket | Male | Female |
| 5 to 17 Years | 3 (0.1%) | 0 (0.0%) |
| 18 to 34 Years | 0 (0.0%) | 25 (0.9%) |
| 35 to 64 Years | 111 (2.4%) | 90 (1.9%) |
| 65 to 74 Years | 26 (2.6%) | 24 (2.3%) |
| 75 Years and over | 20 (4.2%) | 57 (7.3%) |
Technology Access in Simpsonville
Computing Device Access in Simpsonville
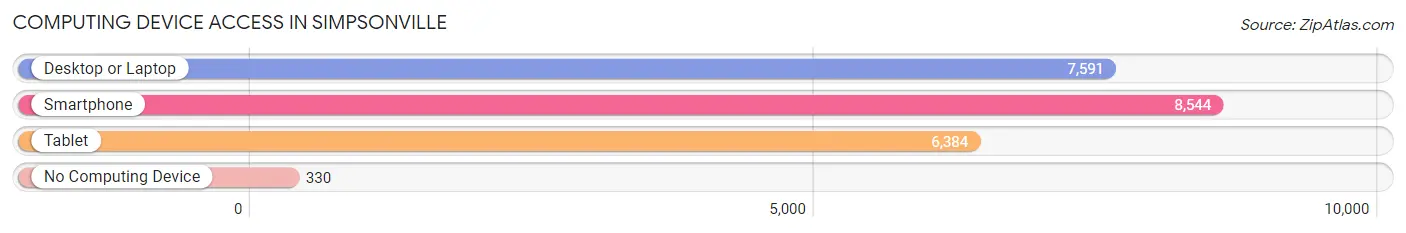
| Device Type | # Households | % Households |
| Desktop or Laptop | 7,591 | 82.0% |
| Smartphone | 8,544 | 92.3% |
| Tablet | 6,384 | 69.0% |
| No Computing Device | 330 | 3.6% |
| Total | 9,257 | 100.0% |
Internet Access in Simpsonville
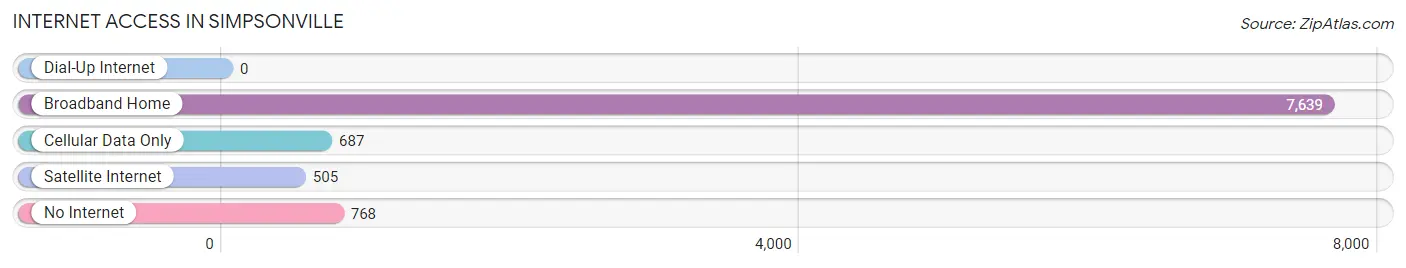
| Internet Type | # Households | % Households |
| Dial-Up Internet | 0 | 0.0% |
| Broadband Home | 7,639 | 82.5% |
| Cellular Data Only | 687 | 7.4% |
| Satellite Internet | 505 | 5.5% |
| No Internet | 768 | 8.3% |
| Total | 9,257 | 100.0% |
Simpsonville Summary
Simpsonville, South Carolina is a small city located in the Upstate region of the state. It is situated in Greenville County, approximately 20 miles south of downtown Greenville. The city is home to a population of approximately 19,000 people, making it the second-largest city in the county.
History
Simpsonville was founded in 1851 by William Simpson, a local farmer and businessman. He purchased the land from the local Cherokee tribe and named the area after himself. The city was incorporated in 1868 and has since grown to become a thriving community.
The city was originally a farming community, but in the late 19th century, the textile industry began to take hold. The city was home to several cotton mills, which provided employment for many of the city’s residents. The city also had a thriving railroad industry, which connected it to other parts of the state.
In the early 20th century, the city began to experience a period of growth and development. The city was home to several new businesses, including a movie theater, a bank, and a hotel. The city also had a thriving downtown area, which included several stores and restaurants.
Geography
Simpsonville is located in the Upstate region of South Carolina. It is situated in Greenville County, approximately 20 miles south of downtown Greenville. The city is located in the foothills of the Blue Ridge Mountains and is surrounded by several small towns and villages.
The city has a total area of 8.3 square miles, of which 8.2 square miles is land and 0.1 square miles is water. The city is located at an elevation of 890 feet above sea level.
Economy
Simpsonville’s economy is largely based on the service industry. The city is home to several large employers, including the Greenville County School District, the Greenville Health System, and the Greenville County Sheriff’s Office. The city also has a thriving retail sector, with several large shopping centers and malls.
The city is also home to several manufacturing companies, including the Simpsonville Manufacturing Company, which produces automotive parts. The city is also home to several small businesses, including restaurants, bars, and retail stores.
Demographics
As of the 2010 census, the population of Simpsonville was 19,228. The racial makeup of the city was 79.2% White, 15.2% African American, 0.3% Native American, 1.7% Asian, 0.1% Pacific Islander, 1.7% from other races, and 1.8% from two or more races. Hispanic or Latino of any race were 4.2% of the population.
The median income for a household in the city was $50,945, and the median income for a family was $60,945. The per capita income for the city was $25,945. About 8.2% of families and 10.2% of the population were below the poverty line, including 14.2% of those under age 18 and 8.2% of those age 65 or over.
Simpsonville is a small city with a rich history and a vibrant economy. The city is home to a diverse population and is a great place to live, work, and play.
Common Questions
What is Per Capita Income in Simpsonville?
Per Capita income in Simpsonville is $38,582.
What is the Median Family Income in Simpsonville?
Median Family Income in Simpsonville is $96,633.
What is the Median Household income in Simpsonville?
Median Household Income in Simpsonville is $79,937.
What is Income or Wage Gap in Simpsonville?
Income or Wage Gap in Simpsonville is 27.6%.
Women in Simpsonville earn 72.4 cents for every dollar earned by a man.
What is Inequality or Gini Index in Simpsonville?
Inequality or Gini Index in Simpsonville is 0.39.
What is the Total Population of Simpsonville?
Total Population of Simpsonville is 24,133.
What is the Total Male Population of Simpsonville?
Total Male Population of Simpsonville is 12,221.
What is the Total Female Population of Simpsonville?
Total Female Population of Simpsonville is 11,912.
What is the Ratio of Males per 100 Females in Simpsonville?
There are 102.59 Males per 100 Females in Simpsonville.
What is the Ratio of Females per 100 Males in Simpsonville?
There are 97.47 Females per 100 Males in Simpsonville.
What is the Median Population Age in Simpsonville?
Median Population Age in Simpsonville is 37.8 Years.
What is the Average Family Size in Simpsonville
Average Family Size in Simpsonville is 3.1 People.
What is the Average Household Size in Simpsonville
Average Household Size in Simpsonville is 2.6 People.
How Large is the Labor Force in Simpsonville?
There are 13,169 People in the Labor Forcein in Simpsonville.
What is the Percentage of People in the Labor Force in Simpsonville?
70.3% of People are in the Labor Force in Simpsonville.
What is the Unemployment Rate in Simpsonville?
Unemployment Rate in Simpsonville is 2.8%.