Cities with the Highest Percentage of Households with Income Above $100,000 in the United States
RELATED REPORTS & OPTIONS
Household Income | $100k+
United States
Compare Cities
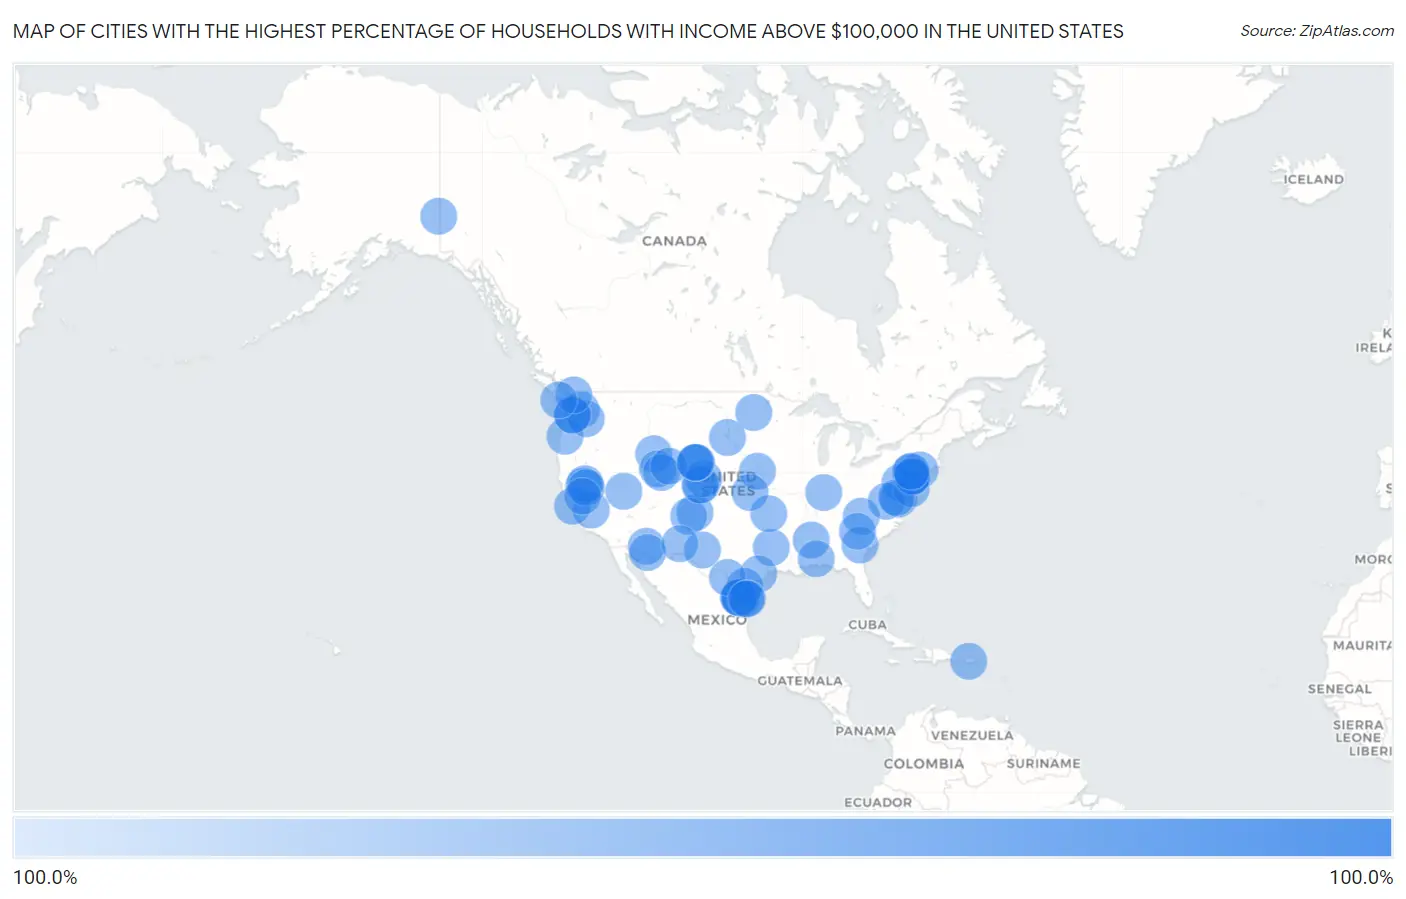
Map of Cities with the Highest Percentage of Households with Income Above $100,000 in the United States
0.0%
100.0%
Cities with the Highest Percentage of Households with Income Above $100,000 in the United States
| City | Households with Income > $100k | vs State | vs National | |
| 1. | Bolton | 100.0% | 36.0%(+64.0)#1 | 37.3%(+62.7)#1 |
| 2. | Mississippi State | 100.0% | 23.5%(+76.5)#1 | 37.3%(+62.7)#2 |
| 3. | Berry College | 100.0% | 34.7%(+65.3)#1 | 37.3%(+62.7)#3 |
| 4. | St. John's University | 100.0% | 41.9%(+58.1)#1 | 37.3%(+62.7)#4 |
| 5. | Bard College | 100.0% | 41.7%(+58.3)#1 | 37.3%(+62.7)#5 |
| 6. | Refton | 100.0% | 35.9%(+64.1)#1 | 37.3%(+62.7)#6 |
| 7. | Cannondale | 100.0% | 45.6%(+54.4)#1 | 37.3%(+62.7)#7 |
| 8. | Comanche Creek | 100.0% | 43.9%(+56.1)#1 | 37.3%(+62.7)#8 |
| 9. | Harlingen | 100.0% | 48.7%(+51.3)#1 | 37.3%(+62.7)#9 |
| 10. | Glacier Colony | 100.0% | 30.1%(+69.9)#1 | 37.3%(+62.7)#10 |
| 11. | Pablo Pena | 100.0% | 36.2%(+63.8)#1 | 37.3%(+62.7)#11 |
| 12. | Norene | 100.0% | 29.7%(+70.3)#1 | 37.3%(+62.7)#12 |
| 13. | Harrison Lake | 100.0% | 30.7%(+69.3)#1 | 37.3%(+62.7)#13 |
| 14. | Ronald | 100.0% | 45.2%(+54.8)#1 | 37.3%(+62.7)#14 |
| 15. | Bedford | 100.0% | 34.6%(+65.4)#1 | 37.3%(+62.7)#15 |
| 16. | Shelbyville | 100.0% | 36.2%(+63.8)#2 | 37.3%(+62.7)#16 |
| 17. | Goldsmith | 100.0% | 30.7%(+69.3)#2 | 37.3%(+62.7)#18 |
| 18. | La Grande | 100.0% | 45.2%(+54.8)#2 | 37.3%(+62.7)#19 |
| 19. | Nesbitt | 100.0% | 36.2%(+63.8)#3 | 37.3%(+62.7)#20 |
| 20. | Schaefer Lake | 100.0% | 30.7%(+69.3)#3 | 37.3%(+62.7)#21 |
| 21. | Lamington | 100.0% | 48.7%(+51.3)#2 | 37.3%(+62.7)#22 |
| 22. | St George Island | 100.0% | 49.3%(+50.7)#1 | 37.3%(+62.7)#23 |
| 23. | Roots | 100.0% | 35.9%(+64.1)#2 | 37.3%(+62.7)#24 |
| 24. | Preston | 100.0% | 34.4%(+65.6)#1 | 37.3%(+62.7)#25 |
| 25. | La Rosita | 100.0% | 36.2%(+63.8)#4 | 37.3%(+62.7)#26 |
| 26. | Fairford | 100.0% | 27.9%(+72.1)#1 | 37.3%(+62.7)#27 |
| 27. | Malaga | 100.0% | 27.3%(+72.7)#1 | 37.3%(+62.7)#28 |
| 28. | Alcan Border | 100.0% | 43.0%(+57.0)#1 | 37.3%(+62.7)#29 |
| 29. | Brookfield Center | 100.0% | 45.6%(+54.4)#2 | 37.3%(+62.7)#30 |
| 30. | Fort Bridger | 100.0% | 34.6%(+65.4)#2 | 37.3%(+62.7)#31 |
| 31. | Trout | 100.0% | 28.2%(+71.8)#1 | 37.3%(+62.7)#32 |
| 32. | Fort Washington | 100.0% | 46.4%(+53.6)#1 | 37.3%(+62.7)#33 |
| 33. | Stone Bluff | 100.0% | 30.7%(+69.3)#4 | 37.3%(+62.7)#34 |
| 34. | Brooktree Park | 100.0% | 35.6%(+64.4)#1 | 37.3%(+62.7)#35 |
| 35. | Hawleyville | 100.0% | 45.6%(+54.4)#3 | 37.3%(+62.7)#36 |
| 36. | Kings Valley | 100.0% | 37.6%(+62.4)#1 | 37.3%(+62.7)#37 |
| 37. | Candlewood Lake Club | 100.0% | 45.6%(+54.4)#4 | 37.3%(+62.7)#38 |
| 38. | Vaiva Vo | 100.0% | 34.8%(+65.2)#1 | 37.3%(+62.7)#39 |
| 39. | Airport Heights | 100.0% | 36.2%(+63.8)#5 | 37.3%(+62.7)#40 |
| 40. | Los Ebanos Cdp Starr County | 100.0% | 36.2%(+63.8)#6 | 37.3%(+62.7)#41 |
| 41. | Valle Crucis | 100.0% | 31.6%(+68.4)#1 | 37.3%(+62.7)#42 |
| 42. | Martinsburg | 100.0% | 30.7%(+69.3)#5 | 37.3%(+62.7)#43 |
| 43. | Hungerford | 100.0% | 36.2%(+63.8)#7 | 37.3%(+62.7)#44 |
| 44. | Crook | 100.0% | 31.5%(+68.5)#1 | 37.3%(+62.7)#45 |
| 45. | Donald | 100.0% | 45.2%(+54.8)#3 | 37.3%(+62.7)#46 |
| 46. | Palmyra | 100.0% | 44.1%(+55.9)#1 | 37.3%(+62.7)#47 |
| 47. | Alder | 100.0% | 45.2%(+54.8)#4 | 37.3%(+62.7)#48 |
| 48. | Strathmere | 100.0% | 48.7%(+51.3)#3 | 37.3%(+62.7)#49 |
| 49. | Dorseyville | 100.0% | 28.2%(+71.8)#2 | 37.3%(+62.7)#50 |
| 50. | Owl Ranch | 100.0% | 36.2%(+63.8)#8 | 37.3%(+62.7)#51 |
| 51. | Acme | 100.0% | 45.2%(+54.8)#5 | 37.3%(+62.7)#52 |
| 52. | Loma Mar | 100.0% | 46.4%(+53.6)#2 | 37.3%(+62.7)#53 |
| 53. | Blawenburg | 100.0% | 48.7%(+51.3)#4 | 37.3%(+62.7)#54 |
| 54. | Ponca | 100.0% | 24.9%(+75.1)#1 | 37.3%(+62.7)#55 |
| 55. | Mcgregor | 100.0% | 35.6%(+64.4)#2 | 37.3%(+62.7)#56 |
| 56. | Benjamin Perez | 100.0% | 36.2%(+63.8)#9 | 37.3%(+62.7)#57 |
| 57. | Ovett | 100.0% | 23.5%(+76.5)#2 | 37.3%(+62.7)#58 |
| 58. | Old River | 100.0% | 46.4%(+53.6)#3 | 37.3%(+62.7)#59 |
| 59. | Downieville | 100.0% | 46.4%(+53.6)#4 | 37.3%(+62.7)#60 |
| 60. | Ute Park | 100.0% | 27.3%(+72.7)#2 | 37.3%(+62.7)#61 |
| 61. | Allamuchy | 100.0% | 48.7%(+51.3)#5 | 37.3%(+62.7)#62 |
| 62. | Brush Creek | 100.0% | 27.9%(+72.1)#1 | 37.3%(+62.7)#63 |
| 63. | Perkins | 100.0% | 34.7%(+65.3)#2 | 37.3%(+62.7)#64 |
| 64. | Bloomfield | 100.0% | 39.1%(+60.9)#1 | 37.3%(+62.7)#65 |
| 65. | Blue Sky | 100.0% | 43.9%(+56.1)#2 | 37.3%(+62.7)#66 |
| 66. | Gold Mountain | 100.0% | 46.4%(+53.6)#5 | 37.3%(+62.7)#67 |
| 67. | Raglesville | 100.0% | 30.7%(+69.3)#6 | 37.3%(+62.7)#68 |
| 68. | Lyden | 100.0% | 27.3%(+72.7)#3 | 37.3%(+62.7)#69 |
| 69. | Wann | 100.0% | 34.0%(+66.0)#1 | 37.3%(+62.7)#70 |
| 70. | Corral Viejo | 100.0% | 6.5%(+93.5)#1 | 37.3%(+62.7)#71 |
| 71. | Quemado | 100.0% | 36.2%(+63.8)#10 | 37.3%(+62.7)#72 |
| 72. | Canehill | 100.0% | 24.9%(+75.1)#2 | 37.3%(+62.7)#73 |
| 73. | Brick Center | 100.0% | 43.9%(+56.1)#3 | 37.3%(+62.7)#74 |
| 74. | Kipp | 100.0% | 33.0%(+67.0)#1 | 37.3%(+62.7)#75 |
| 75. | Lakeview North | 100.0% | 34.6%(+65.4)#4 | 37.3%(+62.7)#76 |
| 76. | Chugcreek | 100.0% | 34.6%(+65.4)#5 | 37.3%(+62.7)#77 |
| 77. | Kingvale | 100.0% | 46.4%(+53.6)#6 | 37.3%(+62.7)#78 |
| 78. | Rock Point | 100.0% | 49.3%(+50.7)#2 | 37.3%(+62.7)#79 |
| 79. | Lyons | 100.0% | 31.5%(+68.5)#2 | 37.3%(+62.7)#80 |
| 80. | Alleene | 100.0% | 24.9%(+75.1)#3 | 37.3%(+62.7)#81 |
| 81. | Lasana | 100.0% | 36.2%(+63.8)#11 | 37.3%(+62.7)#82 |
| 82. | Princeton | 100.0% | 29.7%(+70.3)#1 | 37.3%(+62.7)#83 |
| 83. | Leeds Point | 100.0% | 48.7%(+51.3)#6 | 37.3%(+62.7)#84 |
| 84. | Mckinnon | 100.0% | 34.6%(+65.4)#6 | 37.3%(+62.7)#85 |
| 85. | Zarephath | 100.0% | 48.7%(+51.3)#7 | 37.3%(+62.7)#86 |
| 86. | Cow Creek | 100.0% | 31.5%(+68.5)#3 | 37.3%(+62.7)#87 |
| 87. | Ali Chukson | 100.0% | 34.8%(+65.2)#2 | 37.3%(+62.7)#88 |
| 88. | Caballo | 100.0% | 27.3%(+72.7)#4 | 37.3%(+62.7)#89 |
| 89. | Point Of Rocks | 100.0% | 34.6%(+65.4)#7 | 37.3%(+62.7)#90 |
| 90. | Ross Corner | 100.0% | 48.7%(+51.3)#8 | 37.3%(+62.7)#91 |
| 91. | Tierra Bonita | 100.0% | 36.2%(+63.8)#12 | 37.3%(+62.7)#92 |
| 92. | Lisbon | 100.0% | 49.3%(+50.7)#3 | 37.3%(+62.7)#94 |
| 93. | Peach Creek | 100.0% | 24.4%(+75.6)#1 | 37.3%(+62.7)#95 |
| 94. | Westview Circle | 100.0% | 34.6%(+65.4)#8 | 37.3%(+62.7)#96 |
| 95. | Drytown | 100.0% | 46.4%(+53.6)#7 | 37.3%(+62.7)#97 |
| 96. | El Morro Valley | 100.0% | 27.3%(+72.7)#5 | 37.3%(+62.7)#98 |
| 97. | Buckskin | 100.0% | 30.7%(+69.3)#7 | 37.3%(+62.7)#99 |
| 98. | Vanderwagen | 100.0% | 27.3%(+72.7)#6 | 37.3%(+62.7)#100 |
| 99. | Underhill Center | 100.0% | 36.0%(+64.0)#2 | 37.3%(+62.7)#101 |
| 100. | Sekiu | 100.0% | 45.2%(+54.8)#6 | 37.3%(+62.7)#102 |
Common Questions
What are the Top 10 Cities with the Highest Percentage of Households with Income Above $100,000 in the United States?
Top 10 Cities with the Highest Percentage of Households with Income Above $100,000 in the United States are:
#1
100.0%
#2
100.0%
#3
100.0%
#4
100.0%
#5
100.0%
#6
100.0%
#7
100.0%
#8
100.0%
#9
100.0%
#10
100.0%
What city has the Highest Percentage of Households with Income Above $100,000 in the United States?
Mississippi State has the Highest Percentage of Households with Income Above $100,000 in the United States with 100.0%.
What is the Percentage of Households with Income Above $100,000 in the United States?
Percentage of Households with Income Above $100,000 in the United States is 37.3%.