Charleston County, SC Map & Demographics
Charleston County Map
Charleston County Overview
$51,480
PER CAPITA INCOME
$104,928
AVG FAMILY INCOME
$78,795
AVG HOUSEHOLD INCOME
24.3%
WAGE / INCOME GAP [ % ]
75.7¢/ $1
WAGE / INCOME GAP [ $ ]
$10,911
FAMILY INCOME DEFICIT
0.51
INEQUALITY / GINI INDEX
409,840
TOTAL POPULATION
199,049
MALE POPULATION
210,791
FEMALE POPULATION
94.43
MALES / 100 FEMALES
105.90
FEMALES / 100 MALES
38.9
MEDIAN AGE
3.0
AVG FAMILY SIZE
2.3
AVG HOUSEHOLD SIZE
222,758
LABOR FORCE [ PEOPLE ]
65.8%
PERCENT IN LABOR FORCE
3.7%
UNEMPLOYMENT RATE
Charleston County Area Codes
Income in Charleston County
Income Overview in Charleston County
Per Capita Income in Charleston County is $51,480, while median incomes of families and households are $104,928 and $78,795 respectively.
| Characteristic | Number | Measure |
| Per Capita Income | 409,840 | $51,480 |
| Median Family Income | 98,987 | $104,928 |
| Mean Family Income | 98,987 | $146,318 |
| Median Household Income | 171,795 | $78,795 |
| Mean Household Income | 171,795 | $119,687 |
| Income Deficit | 98,987 | $10,911 |
| Wage / Income Gap (%) | 409,840 | 24.29% |
| Wage / Income Gap ($) | 409,840 | 75.71¢ per $1 |
| Gini / Inequality Index | 409,840 | 0.51 |
Earnings by Sex in Charleston County
Average Earnings in Charleston County are $46,526, $53,413 for men and $40,440 for women, a difference of 24.3%.
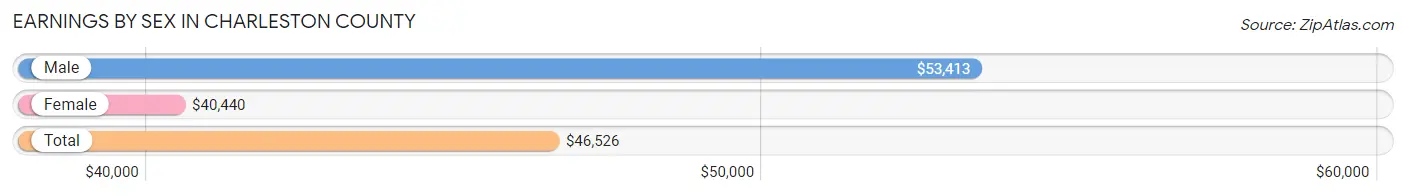
| Sex | Number | Average Earnings |
| Male | 119,621 (51.6%) | $53,413 |
| Female | 111,973 (48.3%) | $40,440 |
| Total | 231,594 (100.0%) | $46,526 |
Earnings by Sex by Income Bracket in Charleston County
The most common earnings brackets in Charleston County are $100,000+ for men (28,897 | 24.2%) and $100,000+ for women (13,035 | 11.6%).
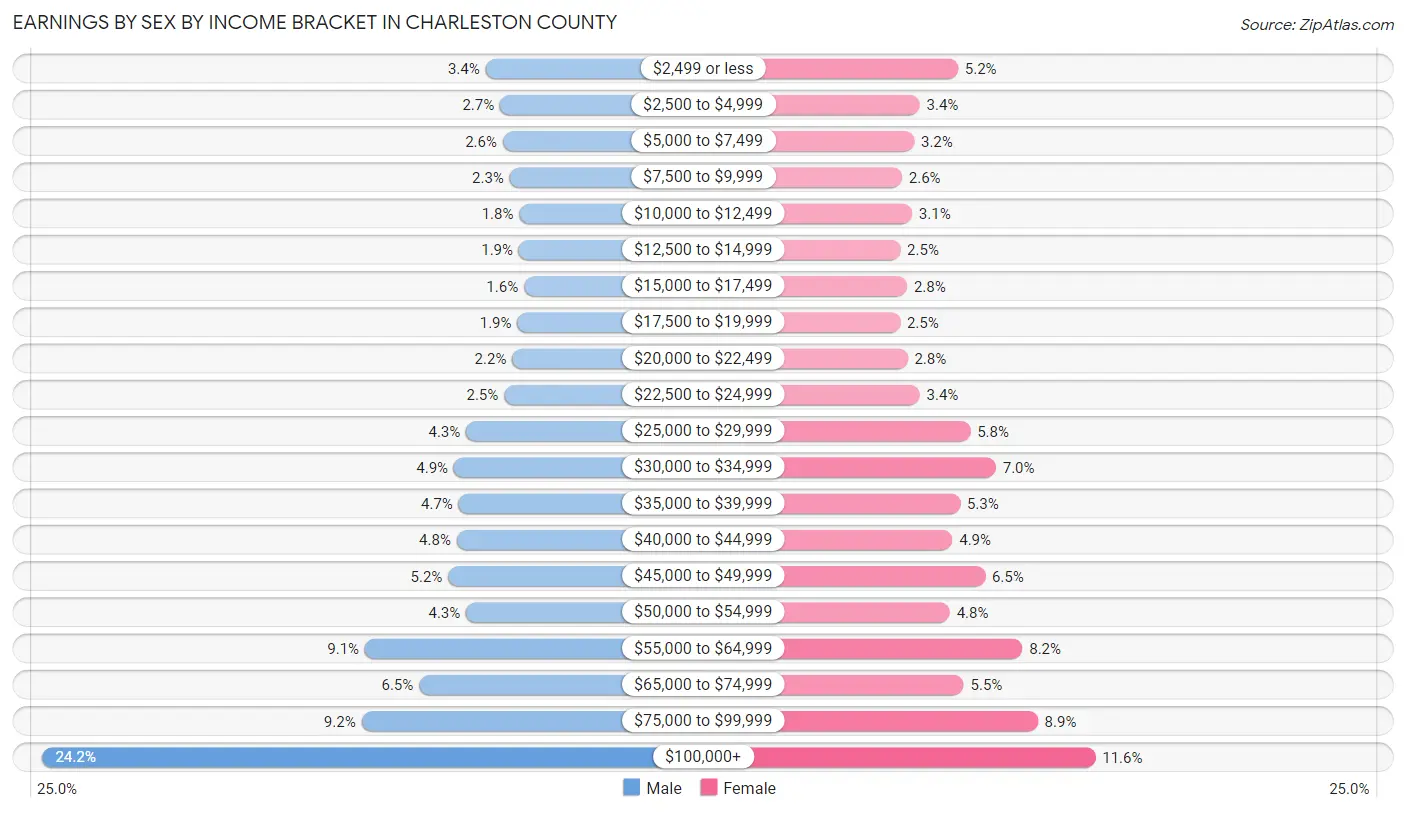
| Income | Male | Female |
| $2,499 or less | 4,080 (3.4%) | 5,825 (5.2%) |
| $2,500 to $4,999 | 3,264 (2.7%) | 3,813 (3.4%) |
| $5,000 to $7,499 | 3,106 (2.6%) | 3,527 (3.2%) |
| $7,500 to $9,999 | 2,724 (2.3%) | 2,885 (2.6%) |
| $10,000 to $12,499 | 2,190 (1.8%) | 3,413 (3.0%) |
| $12,500 to $14,999 | 2,213 (1.8%) | 2,794 (2.5%) |
| $15,000 to $17,499 | 1,927 (1.6%) | 3,160 (2.8%) |
| $17,500 to $19,999 | 2,296 (1.9%) | 2,787 (2.5%) |
| $20,000 to $22,499 | 2,585 (2.2%) | 3,175 (2.8%) |
| $22,500 to $24,999 | 3,036 (2.5%) | 3,814 (3.4%) |
| $25,000 to $29,999 | 5,164 (4.3%) | 6,471 (5.8%) |
| $30,000 to $34,999 | 5,854 (4.9%) | 7,821 (7.0%) |
| $35,000 to $39,999 | 5,592 (4.7%) | 5,937 (5.3%) |
| $40,000 to $44,999 | 5,693 (4.8%) | 5,528 (4.9%) |
| $45,000 to $49,999 | 6,172 (5.2%) | 7,248 (6.5%) |
| $50,000 to $54,999 | 5,166 (4.3%) | 5,400 (4.8%) |
| $55,000 to $64,999 | 10,838 (9.1%) | 9,200 (8.2%) |
| $65,000 to $74,999 | 7,799 (6.5%) | 6,129 (5.5%) |
| $75,000 to $99,999 | 11,025 (9.2%) | 10,011 (8.9%) |
| $100,000+ | 28,897 (24.2%) | 13,035 (11.6%) |
| Total | 119,621 (100.0%) | 111,973 (100.0%) |
Earnings by Sex by Educational Attainment in Charleston County
Average earnings in Charleston County are $59,139 for men and $45,446 for women, a difference of 23.2%. Men with an educational attainment of graduate degree enjoy the highest average annual earnings of $102,833, while those with less than high school education earn the least with $31,100. Women with an educational attainment of graduate degree earn the most with the average annual earnings of $63,849, while those with less than high school education have the smallest earnings of $21,421.
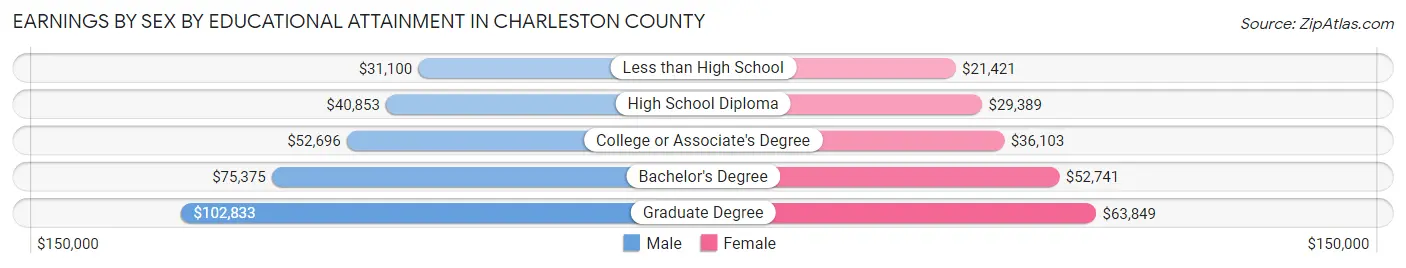
| Educational Attainment | Male Income | Female Income |
| Less than High School | $31,100 | $21,421 |
| High School Diploma | $40,853 | $29,389 |
| College or Associate's Degree | $52,696 | $36,103 |
| Bachelor's Degree | $75,375 | $52,741 |
| Graduate Degree | $102,833 | $63,849 |
| Total | $59,139 | $45,446 |
Family Income in Charleston County
Family Income Brackets in Charleston County
According to the Charleston County family income data, there are 19,995 families falling into the $100,000 to $149,999 income range, which is the most common income bracket and makes up 20.2% of all families. Conversely, the $10,000 to $14,999 income bracket is the least frequent group with only 990 families (1.0%) belonging to this category.
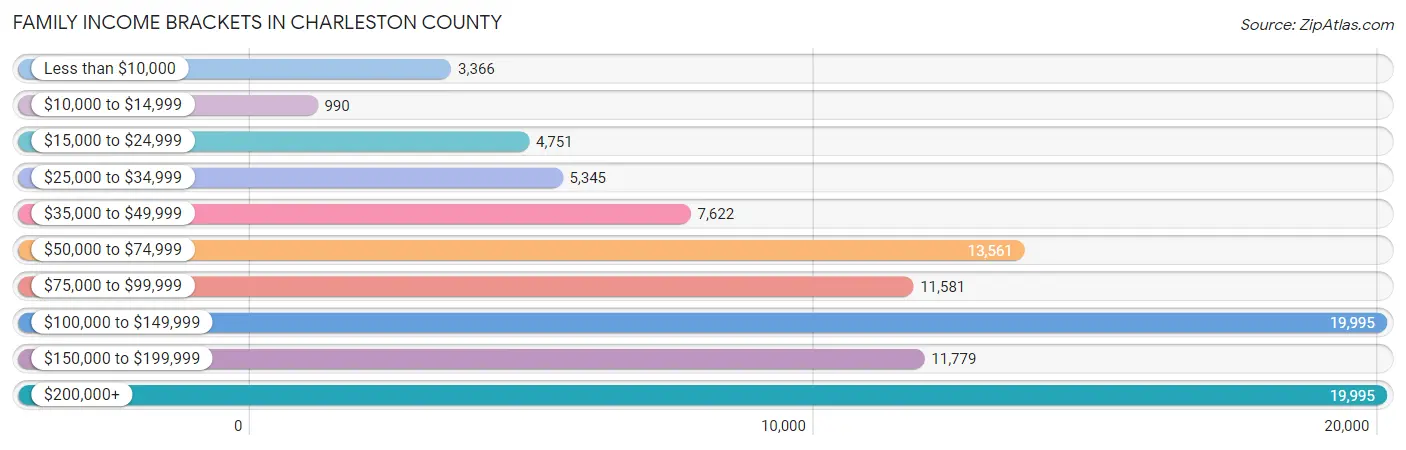
| Income Bracket | # Families | % Families |
| Less than $10,000 | 3,366 | 3.4% |
| $10,000 to $14,999 | 990 | 1.0% |
| $15,000 to $24,999 | 4,751 | 4.8% |
| $25,000 to $34,999 | 5,345 | 5.4% |
| $35,000 to $49,999 | 7,622 | 7.7% |
| $50,000 to $74,999 | 13,561 | 13.7% |
| $75,000 to $99,999 | 11,581 | 11.7% |
| $100,000 to $149,999 | 19,995 | 20.2% |
| $150,000 to $199,999 | 11,779 | 11.9% |
| $200,000+ | 19,995 | 20.2% |
Family Income by Famaliy Size in Charleston County
5-person families (5,887 | 5.9%) account for the highest median family income in Charleston County with $131,167 per family, while 2-person families (52,508 | 53.0%) have the highest median income of $47,781 per family member.
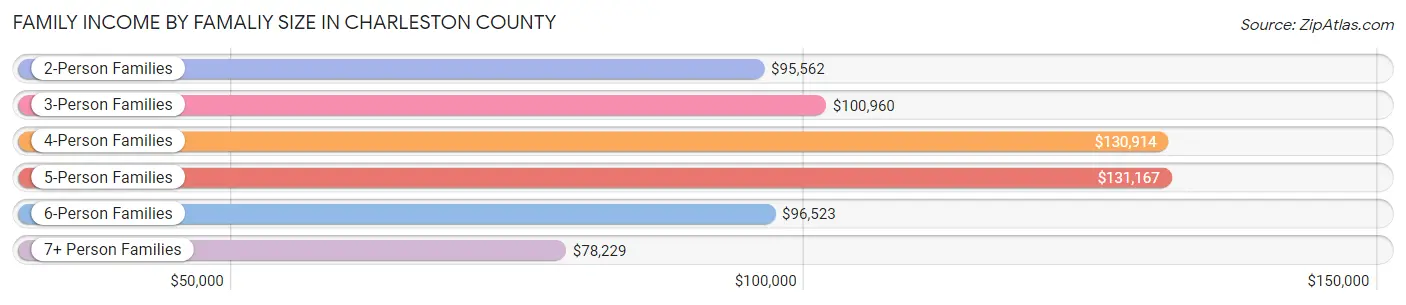
| Income Bracket | # Families | Median Income |
| 2-Person Families | 52,508 (53.0%) | $95,562 |
| 3-Person Families | 22,444 (22.7%) | $100,960 |
| 4-Person Families | 15,786 (16.0%) | $130,914 |
| 5-Person Families | 5,887 (5.9%) | $131,167 |
| 6-Person Families | 1,747 (1.8%) | $96,523 |
| 7+ Person Families | 615 (0.6%) | $78,229 |
| Total | 98,987 (100.0%) | $104,928 |
Family Income by Number of Earners in Charleston County
The median family income in Charleston County is $104,928, with families comprising 3+ earners (7,487) having the highest median family income of $157,717, while families with no earners (16,202) have the lowest median family income of $54,391, accounting for 7.6% and 16.4% of families, respectively.
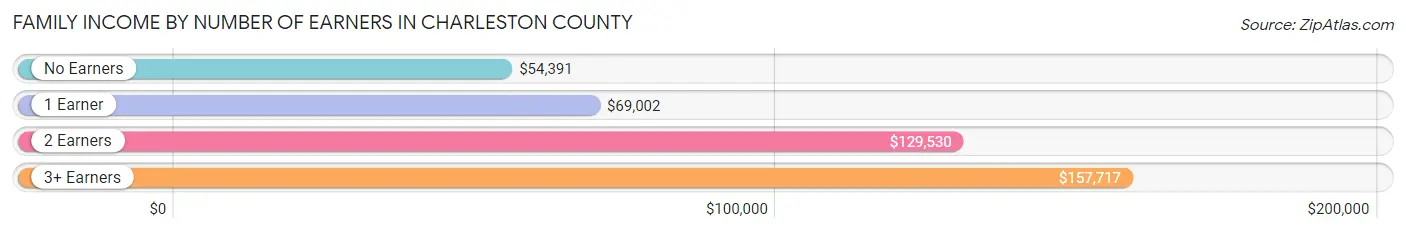
| Number of Earners | # Families | Median Income |
| No Earners | 16,202 (16.4%) | $54,391 |
| 1 Earner | 31,181 (31.5%) | $69,002 |
| 2 Earners | 44,117 (44.6%) | $129,530 |
| 3+ Earners | 7,487 (7.6%) | $157,717 |
| Total | 98,987 (100.0%) | $104,928 |
Household Income in Charleston County
Household Income Brackets in Charleston County
With 29,377 households falling in the category, the $100,000 to $149,999 income range is the most frequent in Charleston County, accounting for 17.1% of all households. In contrast, only 4,295 households (2.5%) fall into the $10,000 to $14,999 income bracket, making it the least populous group.
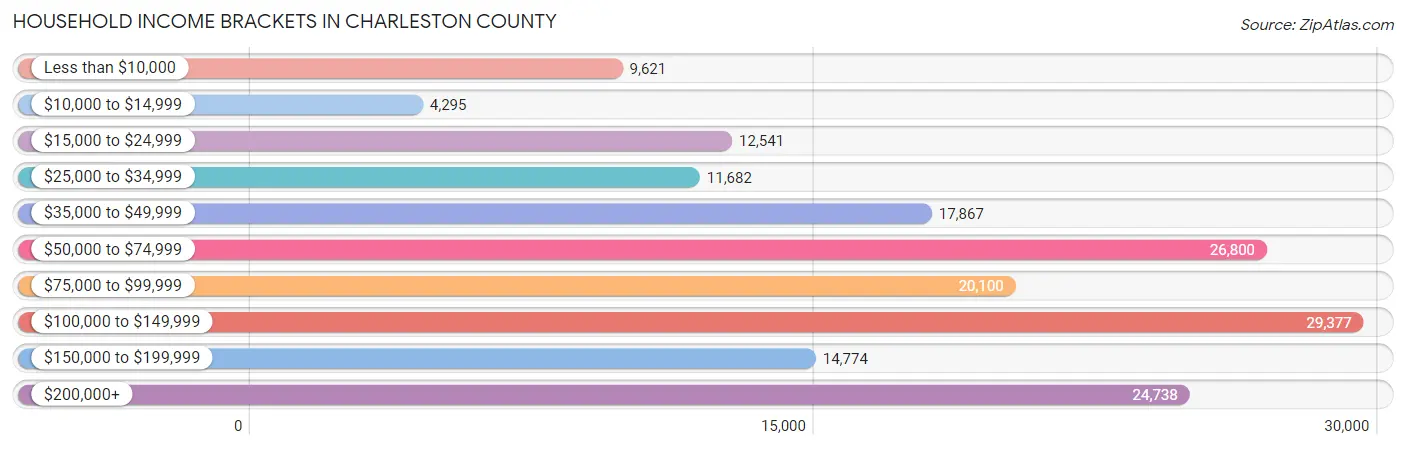
| Income Bracket | # Households | % Households |
| Less than $10,000 | 9,621 | 5.6% |
| $10,000 to $14,999 | 4,295 | 2.5% |
| $15,000 to $24,999 | 12,541 | 7.3% |
| $25,000 to $34,999 | 11,682 | 6.8% |
| $35,000 to $49,999 | 17,867 | 10.4% |
| $50,000 to $74,999 | 26,800 | 15.6% |
| $75,000 to $99,999 | 20,100 | 11.7% |
| $100,000 to $149,999 | 29,377 | 17.1% |
| $150,000 to $199,999 | 14,774 | 8.6% |
| $200,000+ | 24,738 | 14.4% |
Household Income by Householder Age in Charleston County
The median household income in Charleston County is $78,795, with the highest median household income of $91,847 found in the 45 to 64 years age bracket for the primary householder. A total of 58,253 households (33.9%) fall into this category. Meanwhile, the 15 to 24 years age bracket for the primary householder has the lowest median household income of $34,900, with 6,717 households (3.9%) in this group.
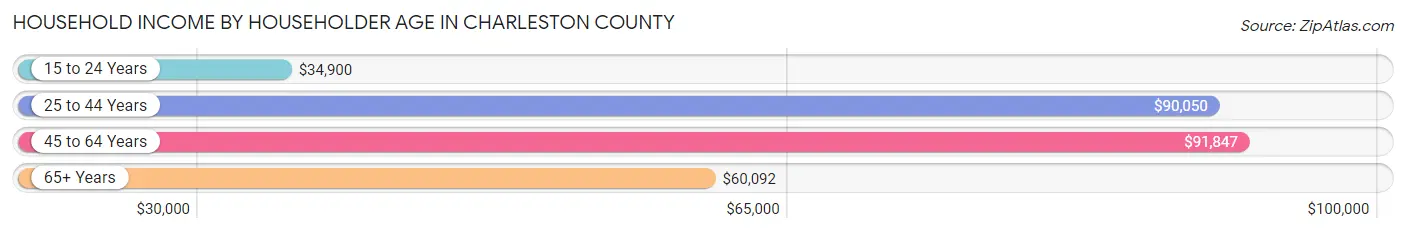
| Income Bracket | # Households | Median Income |
| 15 to 24 Years | 6,717 (3.9%) | $34,900 |
| 25 to 44 Years | 61,885 (36.0%) | $90,050 |
| 45 to 64 Years | 58,253 (33.9%) | $91,847 |
| 65+ Years | 44,940 (26.2%) | $60,092 |
| Total | 171,795 (100.0%) | $78,795 |
Poverty in Charleston County
Income Below Poverty by Sex and Age in Charleston County
With 10.9% poverty level for males and 13.6% for females among the residents of Charleston County, 12 to 14 year old males and 18 to 24 year old females are the most vulnerable to poverty, with 1,395 males (23.6%) and 4,642 females (31.9%) in their respective age groups living below the poverty level.
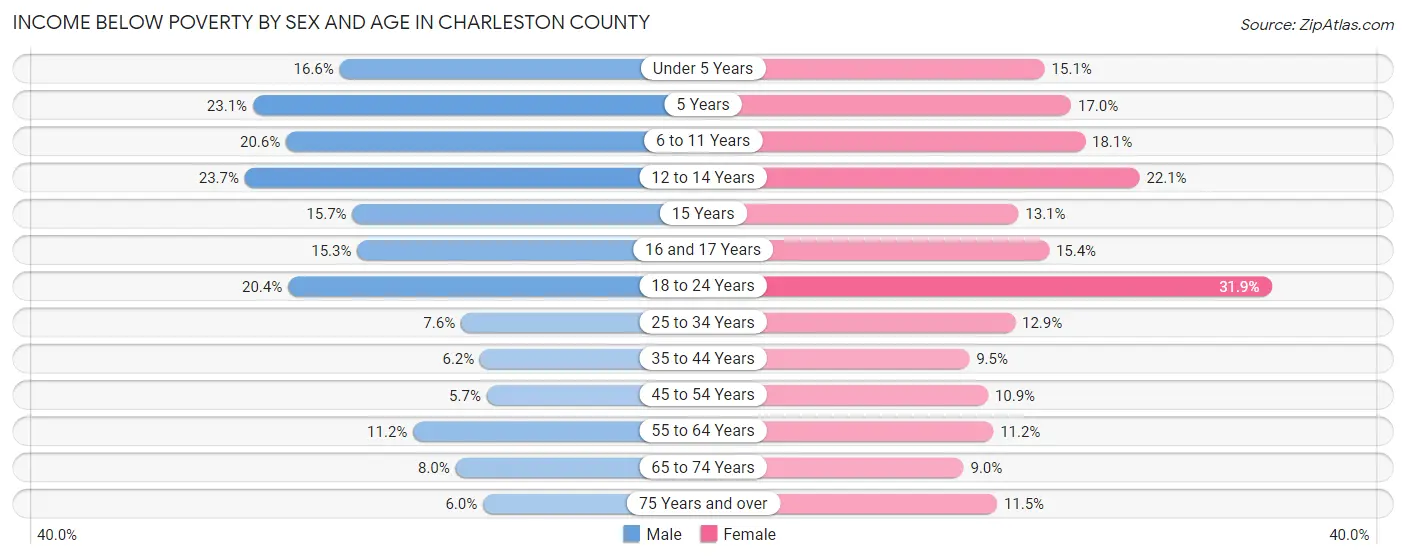
| Age Bracket | Male | Female |
| Under 5 Years | 1,960 (16.6%) | 1,674 (15.1%) |
| 5 Years | 544 (23.1%) | 314 (17.0%) |
| 6 to 11 Years | 2,804 (20.6%) | 2,196 (18.1%) |
| 12 to 14 Years | 1,395 (23.6%) | 1,613 (22.1%) |
| 15 Years | 367 (15.7%) | 260 (13.1%) |
| 16 and 17 Years | 596 (15.3%) | 654 (15.4%) |
| 18 to 24 Years | 2,697 (20.4%) | 4,642 (31.9%) |
| 25 to 34 Years | 2,398 (7.6%) | 4,316 (12.9%) |
| 35 to 44 Years | 1,726 (6.2%) | 2,691 (9.5%) |
| 45 to 54 Years | 1,346 (5.7%) | 2,635 (10.8%) |
| 55 to 64 Years | 2,775 (11.2%) | 3,205 (11.2%) |
| 65 to 74 Years | 1,605 (8.0%) | 2,122 (9.0%) |
| 75 Years and over | 650 (6.0%) | 1,767 (11.5%) |
| Total | 20,863 (10.9%) | 28,089 (13.6%) |
Income Above Poverty by Sex and Age in Charleston County
According to the poverty statistics in Charleston County, males aged 45 to 54 years and females aged 65 to 74 years are the age groups that are most secure financially, with 94.3% of males and 91.0% of females in these age groups living above the poverty line.
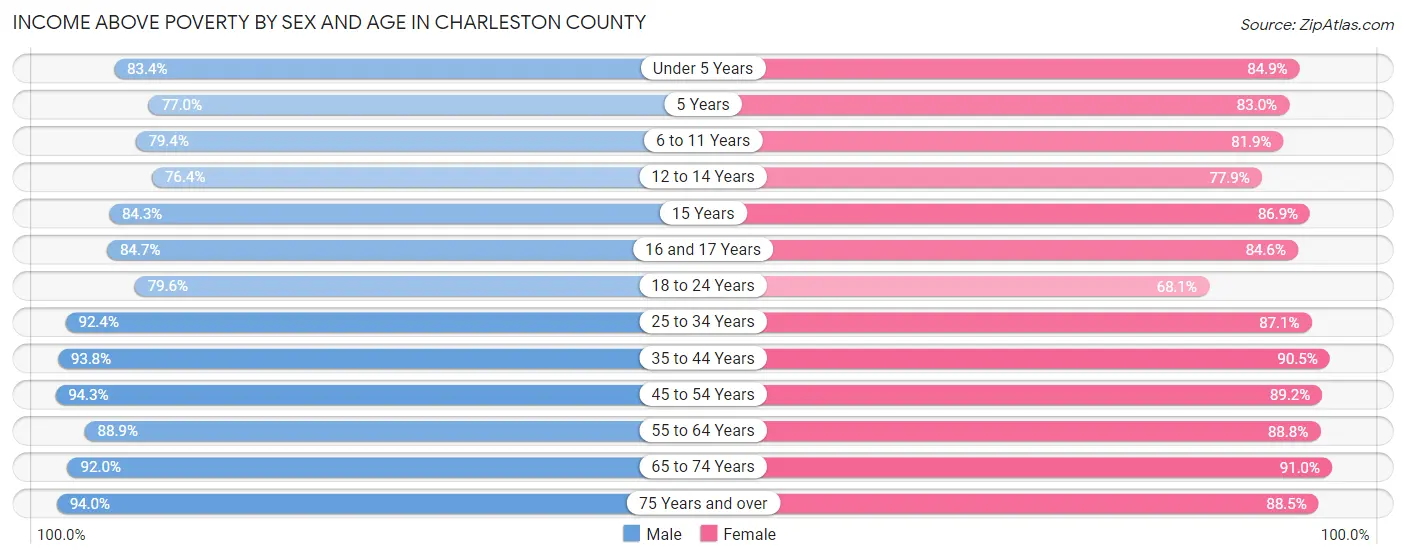
| Age Bracket | Male | Female |
| Under 5 Years | 9,842 (83.4%) | 9,442 (84.9%) |
| 5 Years | 1,816 (76.9%) | 1,531 (83.0%) |
| 6 to 11 Years | 10,816 (79.4%) | 9,965 (81.9%) |
| 12 to 14 Years | 4,503 (76.3%) | 5,684 (77.9%) |
| 15 Years | 1,977 (84.3%) | 1,723 (86.9%) |
| 16 and 17 Years | 3,299 (84.7%) | 3,597 (84.6%) |
| 18 to 24 Years | 10,498 (79.6%) | 9,920 (68.1%) |
| 25 to 34 Years | 29,134 (92.4%) | 29,250 (87.1%) |
| 35 to 44 Years | 26,201 (93.8%) | 25,747 (90.5%) |
| 45 to 54 Years | 22,291 (94.3%) | 21,656 (89.1%) |
| 55 to 64 Years | 22,124 (88.8%) | 25,319 (88.8%) |
| 65 to 74 Years | 18,464 (92.0%) | 21,339 (91.0%) |
| 75 Years and over | 10,254 (94.0%) | 13,574 (88.5%) |
| Total | 171,219 (89.1%) | 178,747 (86.4%) |
Income Below Poverty Among Married-Couple Families in Charleston County
The poverty statistics for married-couple families in Charleston County show that 4.1% or 3,056 of the total 74,360 families live below the poverty line. Families with 3 or 4 children have the highest poverty rate of 10.0%, comprising of 492 families. On the other hand, families with no children have the lowest poverty rate of 3.4%, which includes 1,584 families.
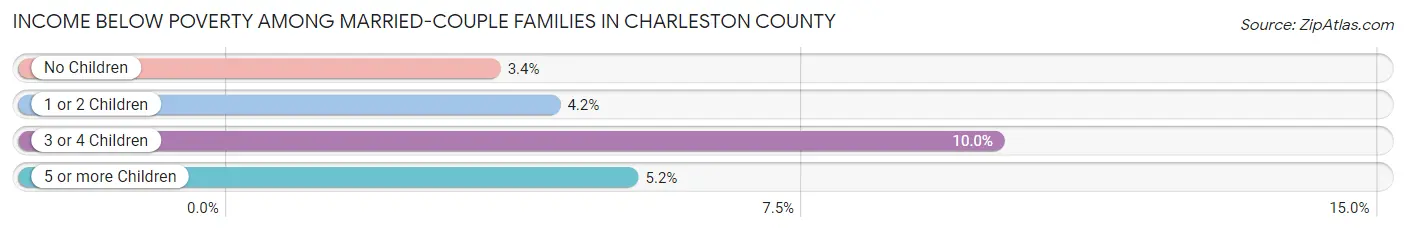
| Children | Above Poverty | Below Poverty |
| No Children | 44,637 (96.6%) | 1,584 (3.4%) |
| 1 or 2 Children | 22,082 (95.8%) | 971 (4.2%) |
| 3 or 4 Children | 4,422 (90.0%) | 492 (10.0%) |
| 5 or more Children | 163 (94.8%) | 9 (5.2%) |
| Total | 71,304 (95.9%) | 3,056 (4.1%) |
Income Below Poverty Among Single-Parent Households in Charleston County
According to the poverty data in Charleston County, 11.8% or 807 single-father households and 23.4% or 4,176 single-mother households are living below the poverty line. Among single-father households, those with 3 or 4 children have the highest poverty rate, with 159 households (41.2%) experiencing poverty. Likewise, among single-mother households, those with 5 or more children have the highest poverty rate, with 158 households (91.9%) falling below the poverty line.
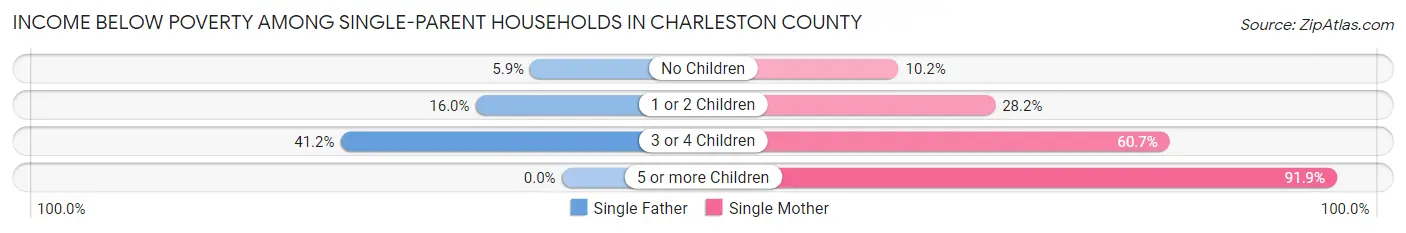
| Children | Single Father | Single Mother |
| No Children | 221 (5.9%) | 776 (10.2%) |
| 1 or 2 Children | 427 (16.0%) | 2,484 (28.2%) |
| 3 or 4 Children | 159 (41.2%) | 758 (60.7%) |
| 5 or more Children | 0 (0.0%) | 158 (91.9%) |
| Total | 807 (11.8%) | 4,176 (23.4%) |
Income Below Poverty Among Married-Couple vs Single-Parent Households in Charleston County
The poverty data for Charleston County shows that 3,056 of the married-couple family households (4.1%) and 4,983 of the single-parent households (20.2%) are living below the poverty level. Within the married-couple family households, those with 3 or 4 children have the highest poverty rate, with 492 households (10.0%) falling below the poverty line. Among the single-parent households, those with 5 or more children have the highest poverty rate, with 158 household (85.9%) living below poverty.
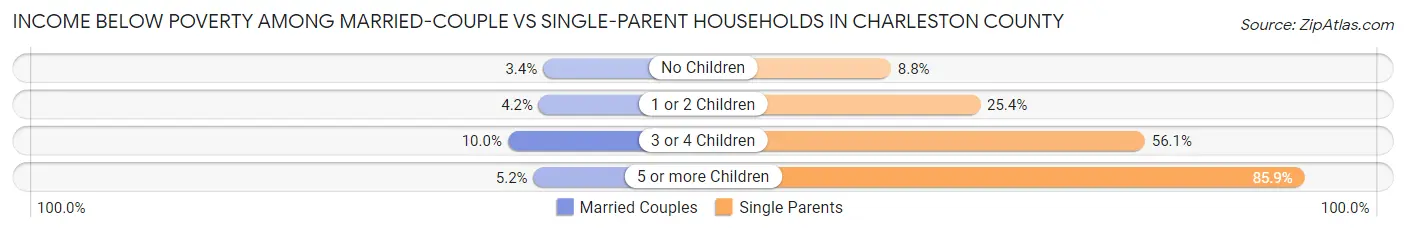
| Children | Married-Couple Families | Single-Parent Households |
| No Children | 1,584 (3.4%) | 997 (8.8%) |
| 1 or 2 Children | 971 (4.2%) | 2,911 (25.4%) |
| 3 or 4 Children | 492 (10.0%) | 917 (56.1%) |
| 5 or more Children | 9 (5.2%) | 158 (85.9%) |
| Total | 3,056 (4.1%) | 4,983 (20.2%) |
Race in Charleston County
The most populous races in Charleston County are White / Caucasian (274,328 | 66.9%), Black / African American (101,583 | 24.8%), and Hispanic or Latino (22,152 | 5.4%).
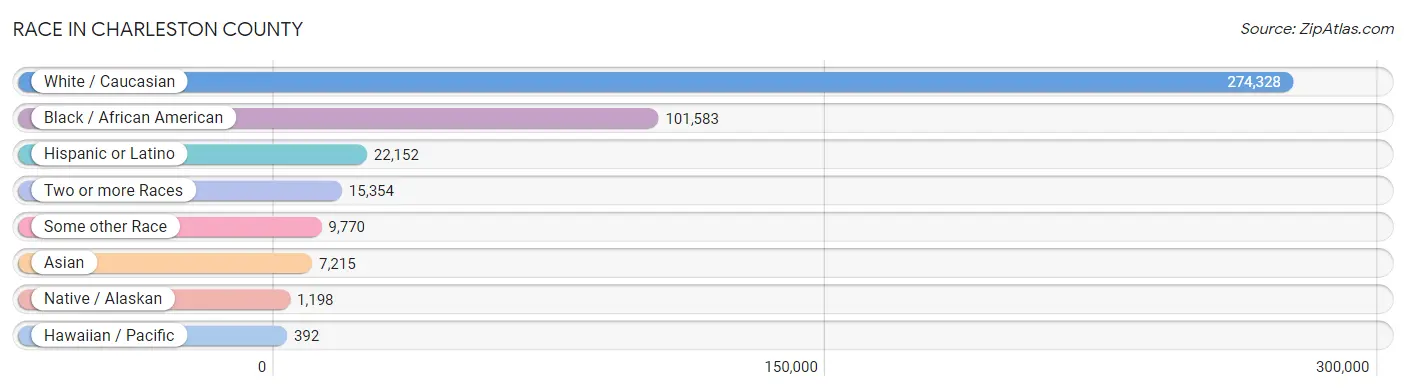
| Race | # Population | % Population |
| Asian | 7,215 | 1.8% |
| Black / African American | 101,583 | 24.8% |
| Hawaiian / Pacific | 392 | 0.1% |
| Hispanic or Latino | 22,152 | 5.4% |
| Native / Alaskan | 1,198 | 0.3% |
| White / Caucasian | 274,328 | 66.9% |
| Two or more Races | 15,354 | 3.7% |
| Some other Race | 9,770 | 2.4% |
| Total | 409,840 | 100.0% |
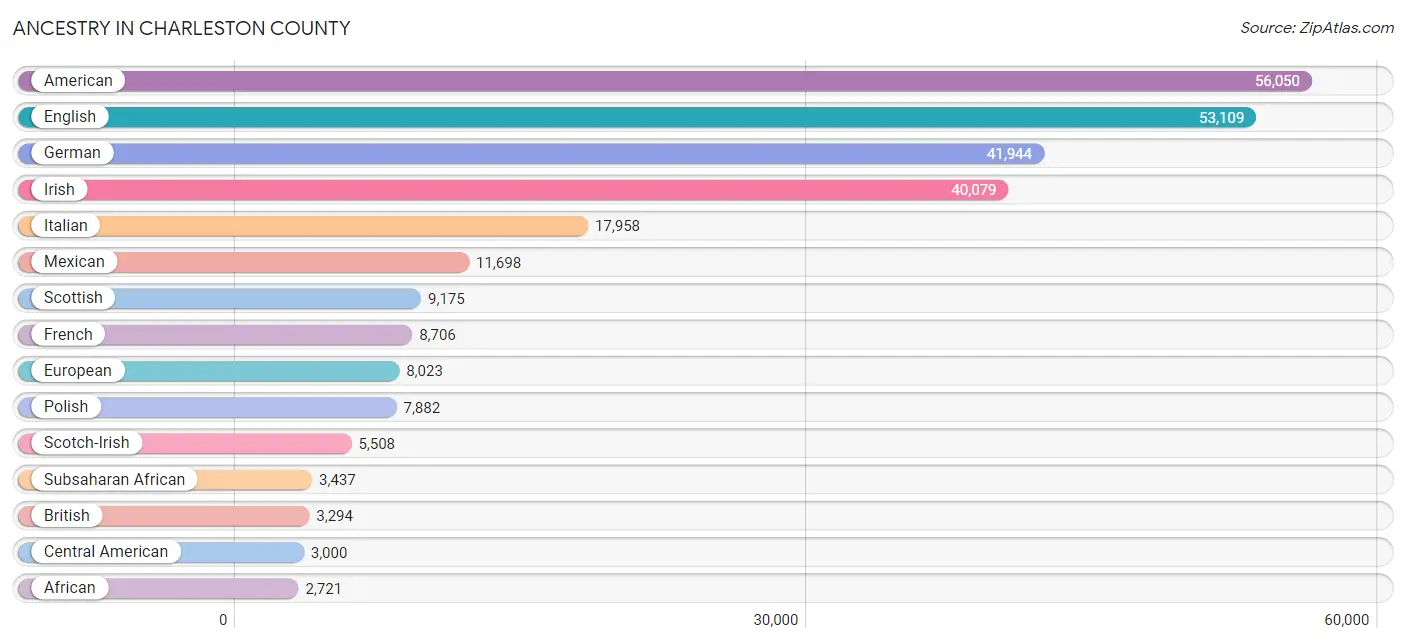
Ancestry in Charleston County
The most populous ancestries reported in Charleston County are American (56,050 | 13.7%), English (53,109 | 13.0%), German (41,944 | 10.2%), Irish (40,079 | 9.8%), and Italian (17,958 | 4.4%), together accounting for 51.0% of all Charleston County residents.
| Ancestry | # Population | % Population |
| Afghan | 70 | 0.0% |
| African | 2,721 | 0.7% |
| Alaskan Athabascan | 2 | 0.0% |
| Albanian | 41 | 0.0% |
| Alsatian | 19 | 0.0% |
| American | 56,050 | 13.7% |
| Arab | 2,077 | 0.5% |
| Argentinean | 340 | 0.1% |
| Armenian | 391 | 0.1% |
| Australian | 89 | 0.0% |
| Austrian | 937 | 0.2% |
| Bahamian | 30 | 0.0% |
| Bangladeshi | 53 | 0.0% |
| Barbadian | 31 | 0.0% |
| Basque | 8 | 0.0% |
| Belgian | 271 | 0.1% |
| Belizean | 4 | 0.0% |
| Bermudan | 5 | 0.0% |
| Bhutanese | 684 | 0.2% |
| Blackfeet | 79 | 0.0% |
| Bolivian | 50 | 0.0% |
| Brazilian | 465 | 0.1% |
| British | 3,294 | 0.8% |
| British West Indian | 90 | 0.0% |
| Burmese | 815 | 0.2% |
| Cajun | 26 | 0.0% |
| Canadian | 340 | 0.1% |
| Celtic | 39 | 0.0% |
| Central American | 3,000 | 0.7% |
| Central American Indian | 744 | 0.2% |
| Cherokee | 1,653 | 0.4% |
| Cheyenne | 1 | 0.0% |
| Chickasaw | 11 | 0.0% |
| Chilean | 118 | 0.0% |
| Chippewa | 50 | 0.0% |
| Choctaw | 45 | 0.0% |
| Colombian | 638 | 0.2% |
| Comanche | 19 | 0.0% |
| Costa Rican | 56 | 0.0% |
| Creek | 12 | 0.0% |
| Croatian | 496 | 0.1% |
| Cuban | 413 | 0.1% |
| Czech | 1,077 | 0.3% |
| Czechoslovakian | 177 | 0.0% |
| Danish | 605 | 0.2% |
| Dominican | 424 | 0.1% |
| Dutch | 2,595 | 0.6% |
| Eastern European | 1,131 | 0.3% |
| Ecuadorian | 626 | 0.2% |
| Egyptian | 306 | 0.1% |
| English | 53,109 | 13.0% |
| Estonian | 20 | 0.0% |
| Ethiopian | 37 | 0.0% |
| European | 8,023 | 2.0% |
| Filipino | 140 | 0.0% |
| Finnish | 551 | 0.1% |
| French | 8,706 | 2.1% |
| French Canadian | 1,865 | 0.5% |
| German | 41,944 | 10.2% |
| Ghanaian | 44 | 0.0% |
| Greek | 1,814 | 0.4% |
| Guamanian / Chamorro | 101 | 0.0% |
| Guatemalan | 1,239 | 0.3% |
| Guyanese | 11 | 0.0% |
| Haitian | 58 | 0.0% |
| Honduran | 987 | 0.2% |
| Houma | 10 | 0.0% |
| Hungarian | 1,372 | 0.3% |
| Icelander | 14 | 0.0% |
| Indian (Asian) | 2,349 | 0.6% |
| Indonesian | 114 | 0.0% |
| Inupiat | 7 | 0.0% |
| Iranian | 128 | 0.0% |
| Iraqi | 29 | 0.0% |
| Irish | 40,079 | 9.8% |
| Iroquois | 26 | 0.0% |
| Israeli | 52 | 0.0% |
| Italian | 17,958 | 4.4% |
| Jamaican | 1,119 | 0.3% |
| Jordanian | 25 | 0.0% |
| Kenyan | 180 | 0.0% |
| Korean | 2,015 | 0.5% |
| Laotian | 84 | 0.0% |
| Latvian | 85 | 0.0% |
| Lebanese | 931 | 0.2% |
| Lithuanian | 445 | 0.1% |
| Lumbee | 9 | 0.0% |
| Luxembourger | 18 | 0.0% |
| Macedonian | 5 | 0.0% |
| Malaysian | 71 | 0.0% |
| Maltese | 17 | 0.0% |
| Mexican | 11,698 | 2.9% |
| Mexican American Indian | 64 | 0.0% |
| Moroccan | 8 | 0.0% |
| Native Hawaiian | 137 | 0.0% |
| Navajo | 20 | 0.0% |
| Nicaraguan | 113 | 0.0% |
| Nigerian | 80 | 0.0% |
| Northern European | 671 | 0.2% |
| Norwegian | 2,312 | 0.6% |
| Osage | 5 | 0.0% |
| Pakistani | 293 | 0.1% |
| Palestinian | 392 | 0.1% |
| Panamanian | 239 | 0.1% |
| Pennsylvania German | 59 | 0.0% |
| Peruvian | 149 | 0.0% |
| Pima | 7 | 0.0% |
| Polish | 7,882 | 1.9% |
| Portuguese | 1,042 | 0.3% |
| Puerto Rican | 2,044 | 0.5% |
| Puget Sound Salish | 5 | 0.0% |
| Romanian | 388 | 0.1% |
| Russian | 2,351 | 0.6% |
| Salvadoran | 366 | 0.1% |
| Samoan | 58 | 0.0% |
| Scandinavian | 1,180 | 0.3% |
| Scotch-Irish | 5,508 | 1.3% |
| Scottish | 9,175 | 2.2% |
| Serbian | 148 | 0.0% |
| Sioux | 63 | 0.0% |
| Slavic | 170 | 0.0% |
| Slovak | 507 | 0.1% |
| Slovene | 167 | 0.0% |
| South African | 235 | 0.1% |
| South American | 2,338 | 0.6% |
| South American Indian | 5 | 0.0% |
| Spaniard | 751 | 0.2% |
| Spanish | 427 | 0.1% |
| Spanish American Indian | 1 | 0.0% |
| Sri Lankan | 1,076 | 0.3% |
| Subsaharan African | 3,437 | 0.8% |
| Swedish | 2,608 | 0.6% |
| Swiss | 741 | 0.2% |
| Syrian | 168 | 0.0% |
| Thai | 2,062 | 0.5% |
| Tlingit-Haida | 3 | 0.0% |
| Trinidadian and Tobagonian | 309 | 0.1% |
| Turkish | 362 | 0.1% |
| Ukrainian | 688 | 0.2% |
| Uruguayan | 11 | 0.0% |
| Venezuelan | 372 | 0.1% |
| Vietnamese | 106 | 0.0% |
| Welsh | 2,438 | 0.6% |
| West Indian | 92 | 0.0% |
| Yugoslavian | 249 | 0.1% |
| Yup'ik | 34 | 0.0% |
| Zimbabwean | 10 | 0.0% | View All 147 Rows |
Immigrants in Charleston County
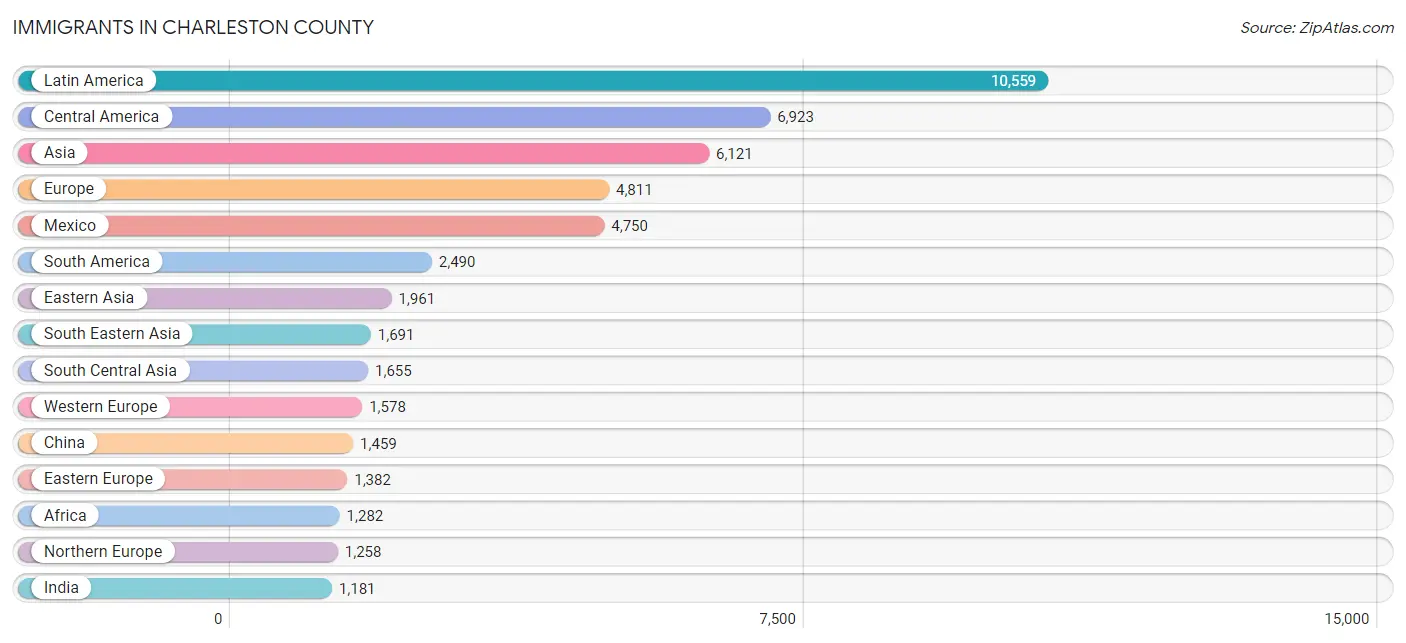
The most numerous immigrant groups reported in Charleston County came from Latin America (10,559 | 2.6%), Central America (6,923 | 1.7%), Asia (6,121 | 1.5%), Europe (4,811 | 1.2%), and Mexico (4,750 | 1.2%), together accounting for 8.1% of all Charleston County residents.
| Immigration Origin | # Population | % Population |
| Afghanistan | 7 | 0.0% |
| Africa | 1,282 | 0.3% |
| Albania | 20 | 0.0% |
| Argentina | 222 | 0.1% |
| Asia | 6,121 | 1.5% |
| Australia | 93 | 0.0% |
| Austria | 73 | 0.0% |
| Bahamas | 36 | 0.0% |
| Bangladesh | 61 | 0.0% |
| Belarus | 19 | 0.0% |
| Belgium | 33 | 0.0% |
| Belize | 4 | 0.0% |
| Bolivia | 50 | 0.0% |
| Bosnia and Herzegovina | 195 | 0.1% |
| Brazil | 941 | 0.2% |
| Canada | 804 | 0.2% |
| Caribbean | 1,146 | 0.3% |
| Central America | 6,923 | 1.7% |
| Chile | 24 | 0.0% |
| China | 1,459 | 0.4% |
| Colombia | 375 | 0.1% |
| Costa Rica | 33 | 0.0% |
| Cuba | 216 | 0.1% |
| Czechoslovakia | 97 | 0.0% |
| Denmark | 28 | 0.0% |
| Dominican Republic | 220 | 0.1% |
| Eastern Africa | 355 | 0.1% |
| Eastern Asia | 1,961 | 0.5% |
| Eastern Europe | 1,382 | 0.3% |
| Ecuador | 337 | 0.1% |
| Egypt | 237 | 0.1% |
| El Salvador | 164 | 0.0% |
| England | 496 | 0.1% |
| Ethiopia | 73 | 0.0% |
| Europe | 4,811 | 1.2% |
| France | 504 | 0.1% |
| Germany | 861 | 0.2% |
| Ghana | 40 | 0.0% |
| Greece | 37 | 0.0% |
| Grenada | 12 | 0.0% |
| Guatemala | 1,064 | 0.3% |
| Guyana | 100 | 0.0% |
| Haiti | 31 | 0.0% |
| Honduras | 708 | 0.2% |
| Hong Kong | 193 | 0.1% |
| Hungary | 37 | 0.0% |
| India | 1,181 | 0.3% |
| Indonesia | 21 | 0.0% |
| Iran | 83 | 0.0% |
| Iraq | 8 | 0.0% |
| Ireland | 138 | 0.0% |
| Israel | 26 | 0.0% |
| Italy | 246 | 0.1% |
| Jamaica | 489 | 0.1% |
| Japan | 175 | 0.0% |
| Jordan | 19 | 0.0% |
| Kazakhstan | 53 | 0.0% |
| Kenya | 251 | 0.1% |
| Korea | 327 | 0.1% |
| Laos | 40 | 0.0% |
| Latin America | 10,559 | 2.6% |
| Latvia | 51 | 0.0% |
| Lebanon | 69 | 0.0% |
| Mexico | 4,750 | 1.2% |
| Micronesia | 171 | 0.0% |
| Nepal | 72 | 0.0% |
| Netherlands | 70 | 0.0% |
| Nicaragua | 91 | 0.0% |
| Nigeria | 29 | 0.0% |
| Northern Africa | 417 | 0.1% |
| Northern Europe | 1,258 | 0.3% |
| Oceania | 277 | 0.1% |
| Pakistan | 46 | 0.0% |
| Panama | 109 | 0.0% |
| Peru | 79 | 0.0% |
| Philippines | 919 | 0.2% |
| Poland | 284 | 0.1% |
| Portugal | 293 | 0.1% |
| Romania | 140 | 0.0% |
| Russia | 376 | 0.1% |
| Saudi Arabia | 57 | 0.0% |
| Scotland | 27 | 0.0% |
| Serbia | 16 | 0.0% |
| South Africa | 303 | 0.1% |
| South America | 2,490 | 0.6% |
| South Central Asia | 1,655 | 0.4% |
| South Eastern Asia | 1,691 | 0.4% |
| Southern Europe | 579 | 0.1% |
| Spain | 3 | 0.0% |
| Sweden | 301 | 0.1% |
| Switzerland | 19 | 0.0% |
| Taiwan | 177 | 0.0% |
| Thailand | 45 | 0.0% |
| Trinidad and Tobago | 124 | 0.0% |
| Turkey | 280 | 0.1% |
| Ukraine | 76 | 0.0% |
| Uzbekistan | 152 | 0.0% |
| Venezuela | 362 | 0.1% |
| Vietnam | 575 | 0.1% |
| West Indies | 18 | 0.0% |
| Western Africa | 69 | 0.0% |
| Western Asia | 478 | 0.1% |
| Western Europe | 1,578 | 0.4% |
| Zimbabwe | 10 | 0.0% | View All 104 Rows |
Sex and Age in Charleston County
Sex and Age in Charleston County
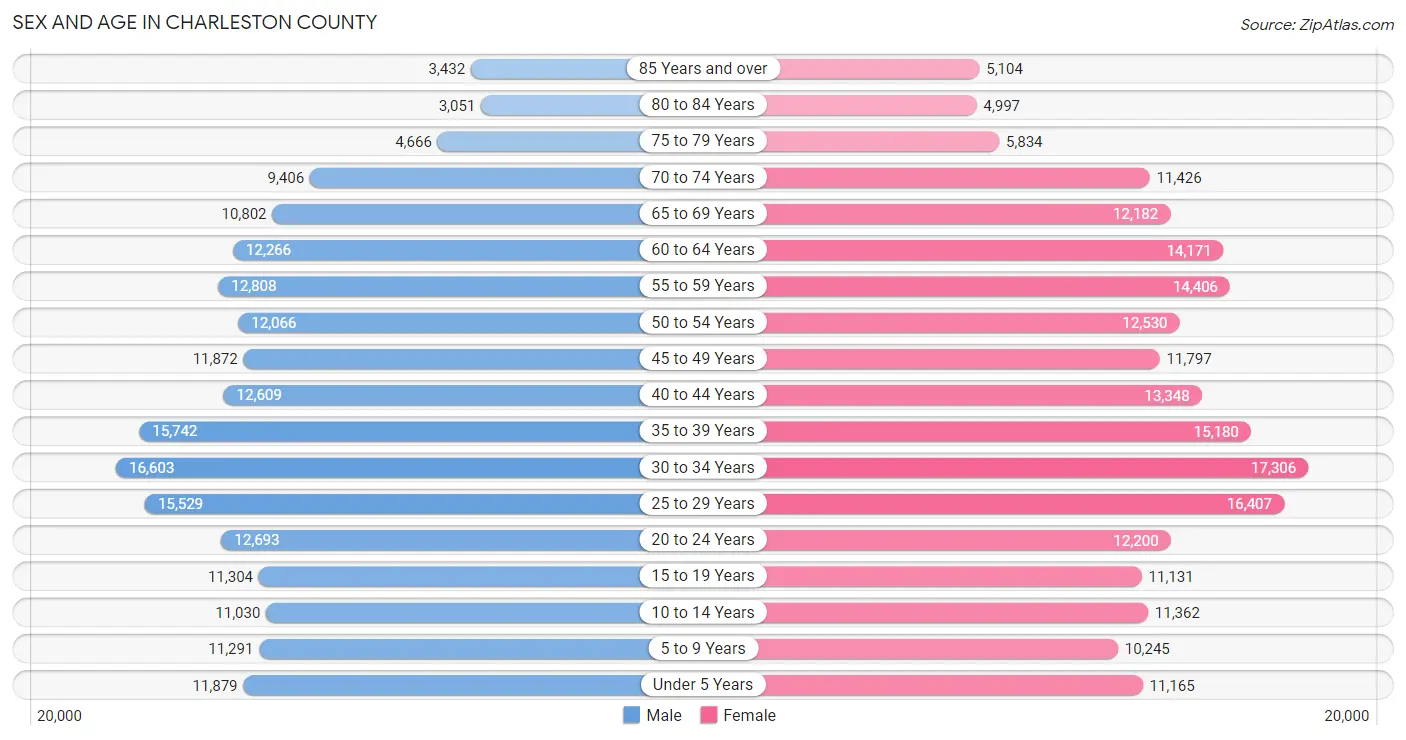
The most populous age groups in Charleston County are 30 to 34 Years (16,603 | 8.3%) for men and 30 to 34 Years (17,306 | 8.2%) for women.
| Age Bracket | Male | Female |
| Under 5 Years | 11,879 (6.0%) | 11,165 (5.3%) |
| 5 to 9 Years | 11,291 (5.7%) | 10,245 (4.9%) |
| 10 to 14 Years | 11,030 (5.5%) | 11,362 (5.4%) |
| 15 to 19 Years | 11,304 (5.7%) | 11,131 (5.3%) |
| 20 to 24 Years | 12,693 (6.4%) | 12,200 (5.8%) |
| 25 to 29 Years | 15,529 (7.8%) | 16,407 (7.8%) |
| 30 to 34 Years | 16,603 (8.3%) | 17,306 (8.2%) |
| 35 to 39 Years | 15,742 (7.9%) | 15,180 (7.2%) |
| 40 to 44 Years | 12,609 (6.3%) | 13,348 (6.3%) |
| 45 to 49 Years | 11,872 (6.0%) | 11,797 (5.6%) |
| 50 to 54 Years | 12,066 (6.1%) | 12,530 (5.9%) |
| 55 to 59 Years | 12,808 (6.4%) | 14,406 (6.8%) |
| 60 to 64 Years | 12,266 (6.2%) | 14,171 (6.7%) |
| 65 to 69 Years | 10,802 (5.4%) | 12,182 (5.8%) |
| 70 to 74 Years | 9,406 (4.7%) | 11,426 (5.4%) |
| 75 to 79 Years | 4,666 (2.3%) | 5,834 (2.8%) |
| 80 to 84 Years | 3,051 (1.5%) | 4,997 (2.4%) |
| 85 Years and over | 3,432 (1.7%) | 5,104 (2.4%) |
| Total | 199,049 (100.0%) | 210,791 (100.0%) |
Families and Households in Charleston County
Median Family Size in Charleston County
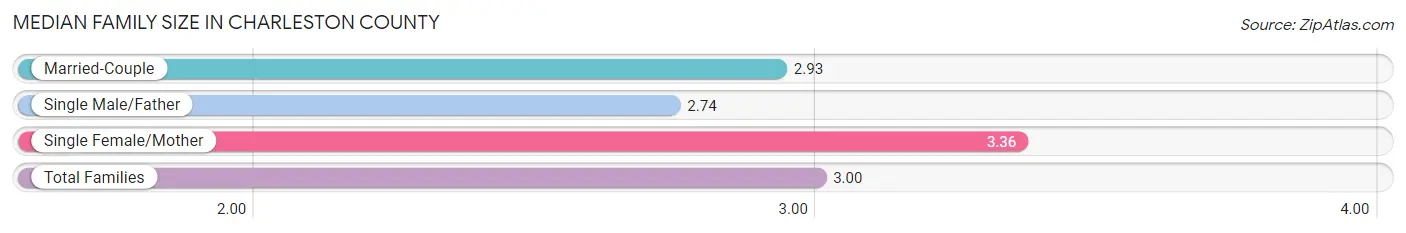
The median family size in Charleston County is 3.00 persons per family, with single female/mother families (17,805 | 18.0%) accounting for the largest median family size of 3.36 persons per family. On the other hand, single male/father families (6,822 | 6.9%) represent the smallest median family size with 2.74 persons per family.
| Family Type | # Families | Family Size |
| Married-Couple | 74,360 (75.1%) | 2.93 |
| Single Male/Father | 6,822 (6.9%) | 2.74 |
| Single Female/Mother | 17,805 (18.0%) | 3.36 |
| Total Families | 98,987 (100.0%) | 3.00 |
Median Household Size in Charleston County
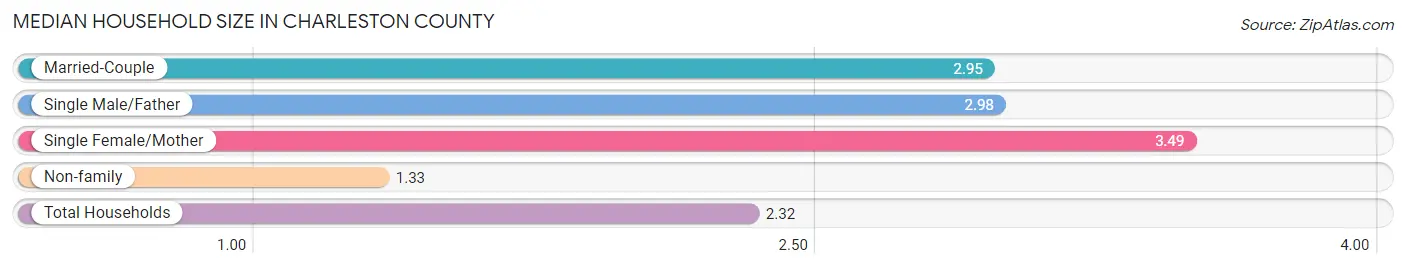
The median household size in Charleston County is 2.32 persons per household, with single female/mother households (17,805 | 10.4%) accounting for the largest median household size of 3.49 persons per household. non-family households (72,808 | 42.4%) represent the smallest median household size with 1.33 persons per household.
| Household Type | # Households | Household Size |
| Married-Couple | 74,360 (43.3%) | 2.95 |
| Single Male/Father | 6,822 (4.0%) | 2.98 |
| Single Female/Mother | 17,805 (10.4%) | 3.49 |
| Non-family | 72,808 (42.4%) | 1.33 |
| Total Households | 171,795 (100.0%) | 2.32 |
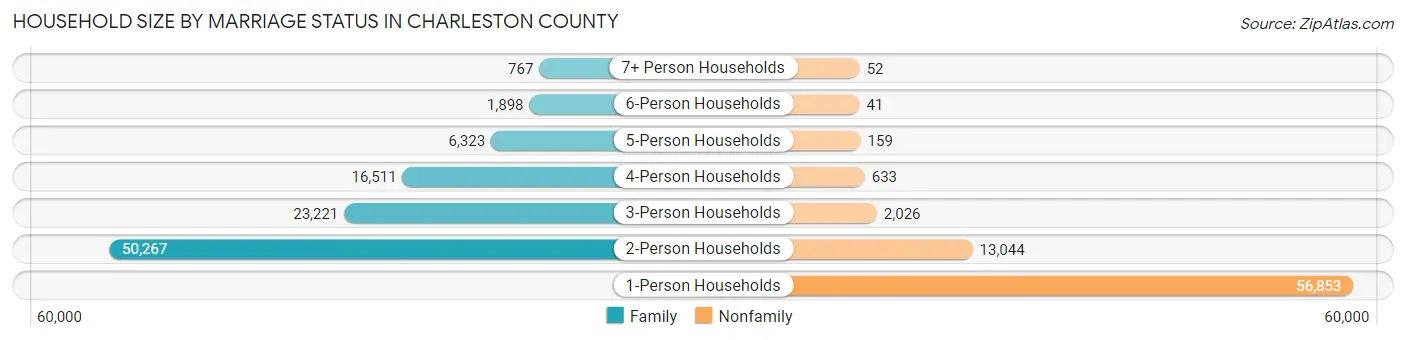
Household Size by Marriage Status in Charleston County
Out of a total of 171,795 households in Charleston County, 98,987 (57.6%) are family households, while 72,808 (42.4%) are nonfamily households. The most numerous type of family households are 2-person households, comprising 50,267, and the most common type of nonfamily households are 1-person households, comprising 56,853.
| Household Size | Family Households | Nonfamily Households |
| 1-Person Households | - | 56,853 (33.1%) |
| 2-Person Households | 50,267 (29.3%) | 13,044 (7.6%) |
| 3-Person Households | 23,221 (13.5%) | 2,026 (1.2%) |
| 4-Person Households | 16,511 (9.6%) | 633 (0.4%) |
| 5-Person Households | 6,323 (3.7%) | 159 (0.1%) |
| 6-Person Households | 1,898 (1.1%) | 41 (0.0%) |
| 7+ Person Households | 767 (0.4%) | 52 (0.0%) |
| Total | 98,987 (57.6%) | 72,808 (42.4%) |
Female Fertility in Charleston County
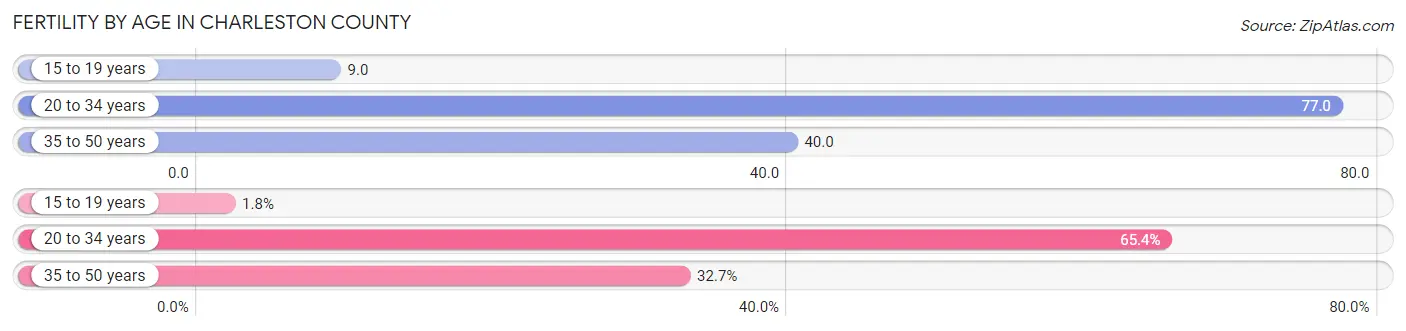
Fertility by Age in Charleston County
Average fertility rate in Charleston County is 53.0 births per 1,000 women. Women in the age bracket of 20 to 34 years have the highest fertility rate with 77.0 births per 1,000 women. Women in the age bracket of 20 to 34 years acount for 65.4% of all women with births.
| Age Bracket | Women with Births | Births / 1,000 Women |
| 15 to 19 years | 99 (1.8%) | 9.0 |
| 20 to 34 years | 3,524 (65.4%) | 77.0 |
| 35 to 50 years | 1,762 (32.7%) | 40.0 |
| Total | 5,385 (100.0%) | 53.0 |
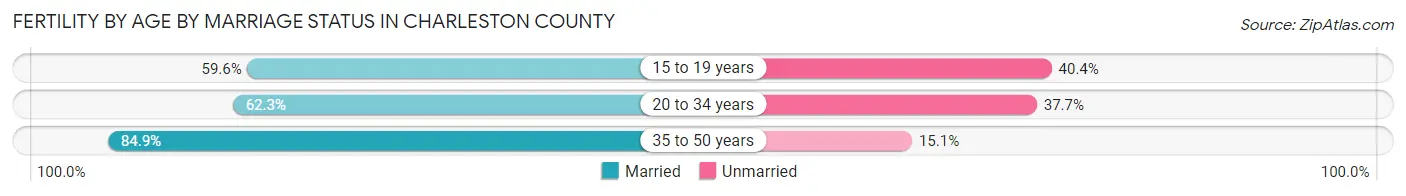
Fertility by Age by Marriage Status in Charleston County
69.6% of women with births (5,385) in Charleston County are married. The highest percentage of unmarried women with births falls into 15 to 19 years age bracket with 40.4% of them unmarried at the time of birth, while the lowest percentage of unmarried women with births belong to 35 to 50 years age bracket with 15.1% of them unmarried.
| Age Bracket | Married | Unmarried |
| 15 to 19 years | 59 (59.6%) | 40 (40.4%) |
| 20 to 34 years | 2,195 (62.3%) | 1,329 (37.7%) |
| 35 to 50 years | 1,496 (84.9%) | 266 (15.1%) |
| Total | 3,748 (69.6%) | 1,637 (30.4%) |
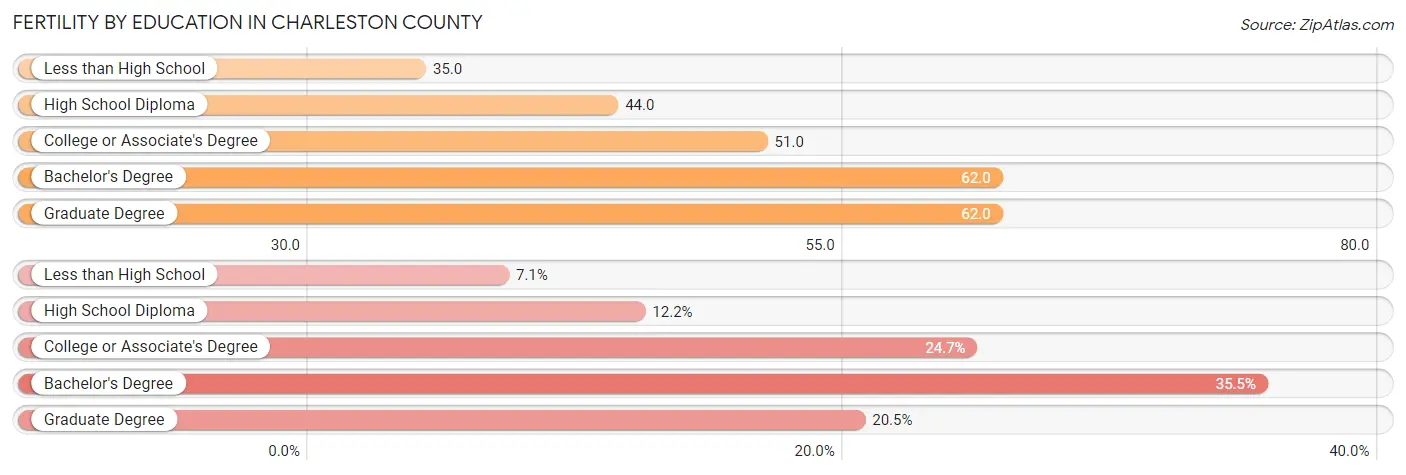
Fertility by Education in Charleston County
Average fertility rate in Charleston County is 53.0 births per 1,000 women. Women with the education attainment of bachelor's degree have the highest fertility rate of 62.0 births per 1,000 women, while women with the education attainment of less than high school have the lowest fertility at 35.0 births per 1,000 women. Women with the education attainment of bachelor's degree represent 35.5% of all women with births.
| Educational Attainment | Women with Births | Births / 1,000 Women |
| Less than High School | 383 (7.1%) | 35.0 |
| High School Diploma | 658 (12.2%) | 44.0 |
| College or Associate's Degree | 1,328 (24.7%) | 51.0 |
| Bachelor's Degree | 1,914 (35.5%) | 62.0 |
| Graduate Degree | 1,102 (20.5%) | 62.0 |
| Total | 5,385 (100.0%) | 53.0 |
Fertility by Education by Marriage Status in Charleston County
30.4% of women with births in Charleston County are unmarried. Women with the educational attainment of graduate degree are most likely to be married with 96.1% of them married at childbirth, while women with the educational attainment of less than high school are least likely to be married with 57.4% of them unmarried at childbirth.
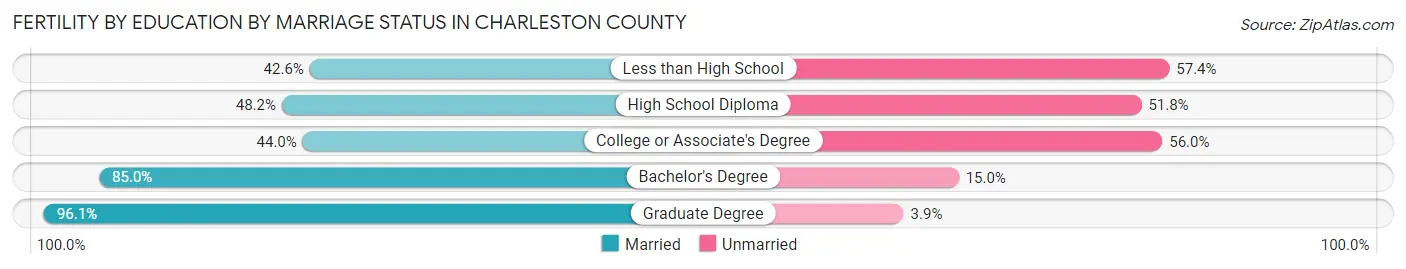
| Educational Attainment | Married | Unmarried |
| Less than High School | 163 (42.6%) | 220 (57.4%) |
| High School Diploma | 317 (48.2%) | 341 (51.8%) |
| College or Associate's Degree | 584 (44.0%) | 744 (56.0%) |
| Bachelor's Degree | 1,627 (85.0%) | 287 (15.0%) |
| Graduate Degree | 1,059 (96.1%) | 43 (3.9%) |
| Total | 3,748 (69.6%) | 1,637 (30.4%) |
Employment Characteristics in Charleston County
Employment by Class of Employer in Charleston County
Among the 210,569 employed individuals in Charleston County, private company employees (134,801 | 64.0%), self-employed (not incorporated) (14,167 | 6.7%), and state government employees (13,458 | 6.4%) make up the most common classes of employment.
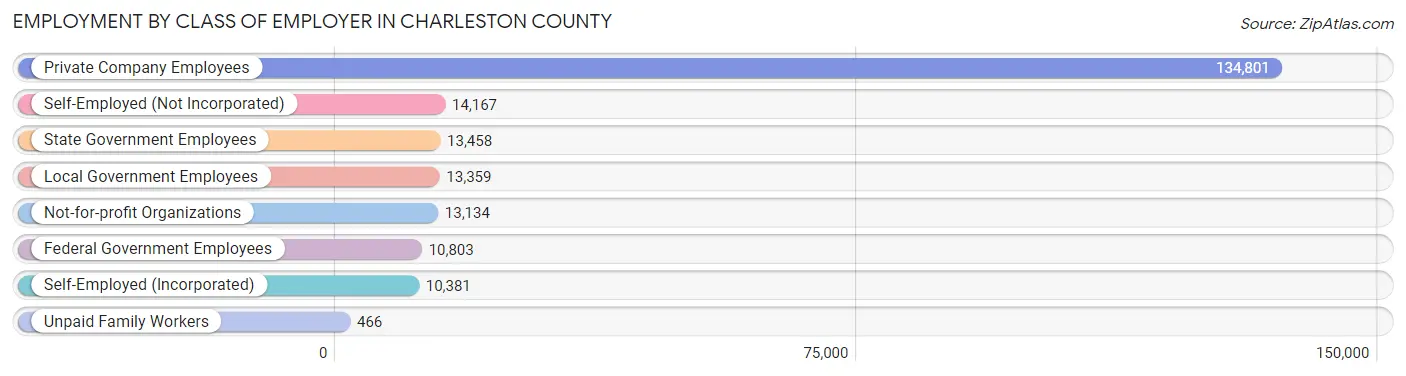
| Employer Class | # Employees | % Employees |
| Private Company Employees | 134,801 | 64.0% |
| Self-Employed (Incorporated) | 10,381 | 4.9% |
| Self-Employed (Not Incorporated) | 14,167 | 6.7% |
| Not-for-profit Organizations | 13,134 | 6.2% |
| Local Government Employees | 13,359 | 6.3% |
| State Government Employees | 13,458 | 6.4% |
| Federal Government Employees | 10,803 | 5.1% |
| Unpaid Family Workers | 466 | 0.2% |
| Total | 210,569 | 100.0% |
Employment Status by Age in Charleston County
According to the labor force statistics for Charleston County, out of the total population over 16 years of age (338,538), 65.8% or 222,758 individuals are in the labor force, with 3.7% or 8,242 of them unemployed. The age group with the highest labor force participation rate is 30 to 34 years, with 89.7% or 30,416 individuals in the labor force. Within the labor force, the 16 to 19 years age range has the highest percentage of unemployed individuals, with 16.7% or 1,055 of them being unemployed.
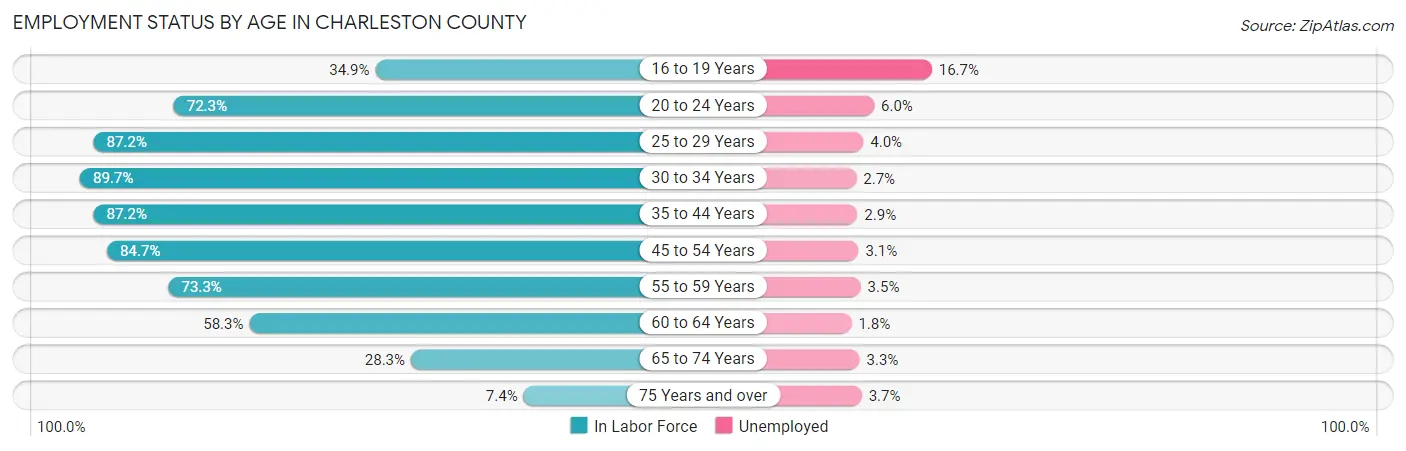
| Age Bracket | In Labor Force | Unemployed |
| 16 to 19 Years | 6,319 (34.9%) | 1,055 (16.7%) |
| 20 to 24 Years | 17,998 (72.3%) | 1,080 (6.0%) |
| 25 to 29 Years | 27,848 (87.2%) | 1,114 (4.0%) |
| 30 to 34 Years | 30,416 (89.7%) | 821 (2.7%) |
| 35 to 44 Years | 49,598 (87.2%) | 1,438 (2.9%) |
| 45 to 54 Years | 40,880 (84.7%) | 1,267 (3.1%) |
| 55 to 59 Years | 19,948 (73.3%) | 698 (3.5%) |
| 60 to 64 Years | 15,413 (58.3%) | 277 (1.8%) |
| 65 to 74 Years | 12,400 (28.3%) | 409 (3.3%) |
| 75 Years and over | 2,004 (7.4%) | 74 (3.7%) |
| Total | 222,758 (65.8%) | 8,242 (3.7%) |
Employment Status by Educational Attainment in Charleston County
According to labor force statistics for Charleston County, 82.0% of individuals (184,205) out of the total population between 25 and 64 years of age (224,640) are in the labor force, with 3.1% or 5,710 of them being unemployed. The group with the highest labor force participation rate are those with the educational attainment of bachelor's degree or higher, with 87.4% or 97,832 individuals in the labor force. Within the labor force, individuals with less than high school education have the highest percentage of unemployment, with 8.2% or 774 of them being unemployed.
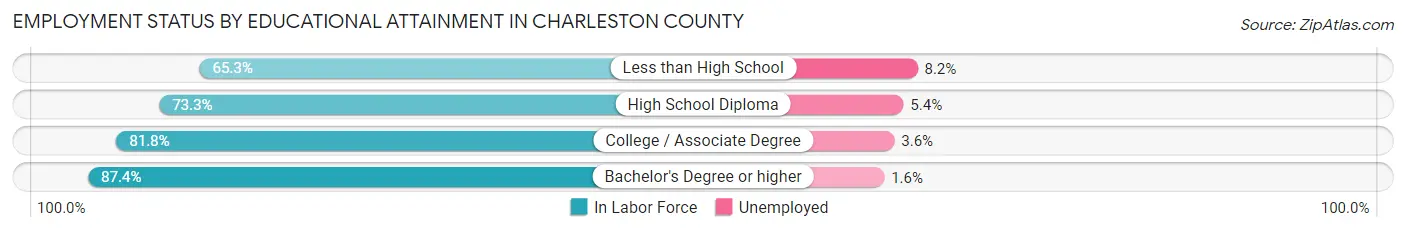
| Educational Attainment | In Labor Force | Unemployed |
| Less than High School | 9,440 (65.3%) | 1,185 (8.2%) |
| High School Diploma | 30,441 (73.3%) | 2,243 (5.4%) |
| College / Associate Degree | 46,395 (81.8%) | 2,042 (3.6%) |
| Bachelor's Degree or higher | 97,832 (87.4%) | 1,791 (1.6%) |
| Total | 184,205 (82.0%) | 6,964 (3.1%) |
Employment Occupations by Sex in Charleston County
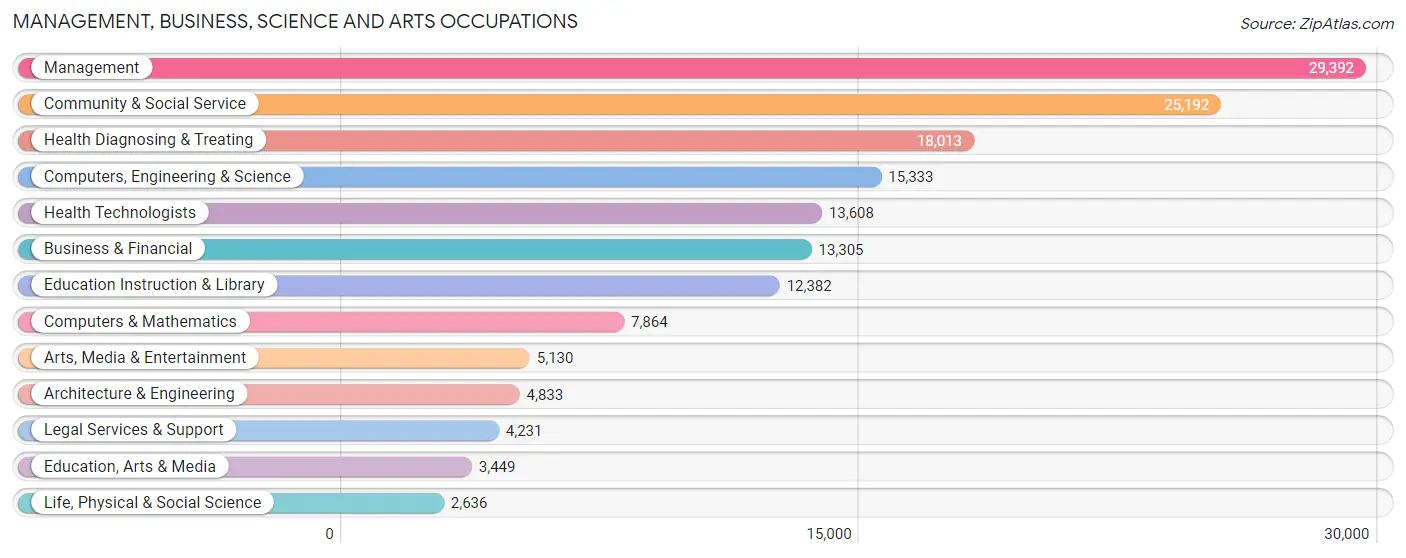
Management, Business, Science and Arts Occupations
The most common Management, Business, Science and Arts occupations in Charleston County are Management (29,392 | 13.9%), Community & Social Service (25,192 | 11.9%), Health Diagnosing & Treating (18,013 | 8.5%), Computers, Engineering & Science (15,333 | 7.3%), and Health Technologists (13,608 | 6.4%).
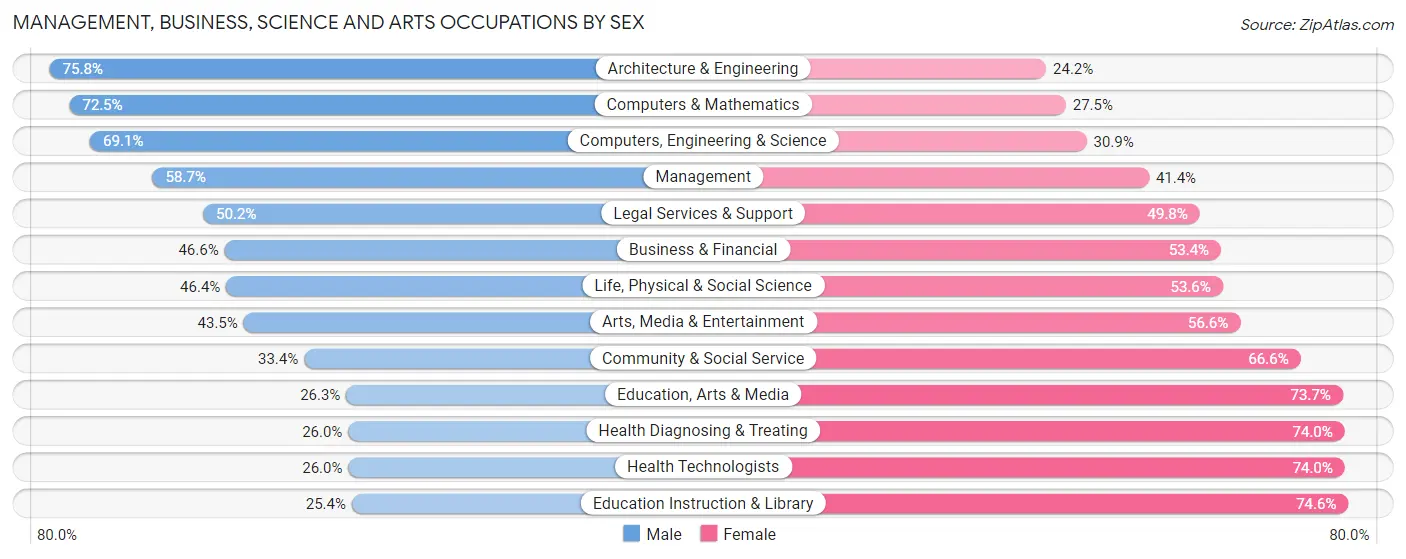
Management, Business, Science and Arts Occupations by Sex
Within the Management, Business, Science and Arts occupations in Charleston County, the most male-oriented occupations are Architecture & Engineering (75.8%), Computers & Mathematics (72.5%), and Computers, Engineering & Science (69.1%), while the most female-oriented occupations are Education Instruction & Library (74.6%), Health Technologists (74.0%), and Health Diagnosing & Treating (74.0%).
| Occupation | Male | Female |
| Management | 17,238 (58.7%) | 12,154 (41.3%) |
| Business & Financial | 6,205 (46.6%) | 7,100 (53.4%) |
| Computers, Engineering & Science | 10,589 (69.1%) | 4,744 (30.9%) |
| Computers & Mathematics | 5,703 (72.5%) | 2,161 (27.5%) |
| Architecture & Engineering | 3,664 (75.8%) | 1,169 (24.2%) |
| Life, Physical & Social Science | 1,222 (46.4%) | 1,414 (53.6%) |
| Community & Social Service | 8,406 (33.4%) | 16,786 (66.6%) |
| Education, Arts & Media | 908 (26.3%) | 2,541 (73.7%) |
| Legal Services & Support | 2,124 (50.2%) | 2,107 (49.8%) |
| Education Instruction & Library | 3,145 (25.4%) | 9,237 (74.6%) |
| Arts, Media & Entertainment | 2,229 (43.4%) | 2,901 (56.6%) |
| Health Diagnosing & Treating | 4,684 (26.0%) | 13,329 (74.0%) |
| Health Technologists | 3,535 (26.0%) | 10,073 (74.0%) |
| Total (Category) | 47,122 (46.6%) | 54,113 (53.4%) |
| Total (Overall) | 108,217 (51.2%) | 102,942 (48.7%) |
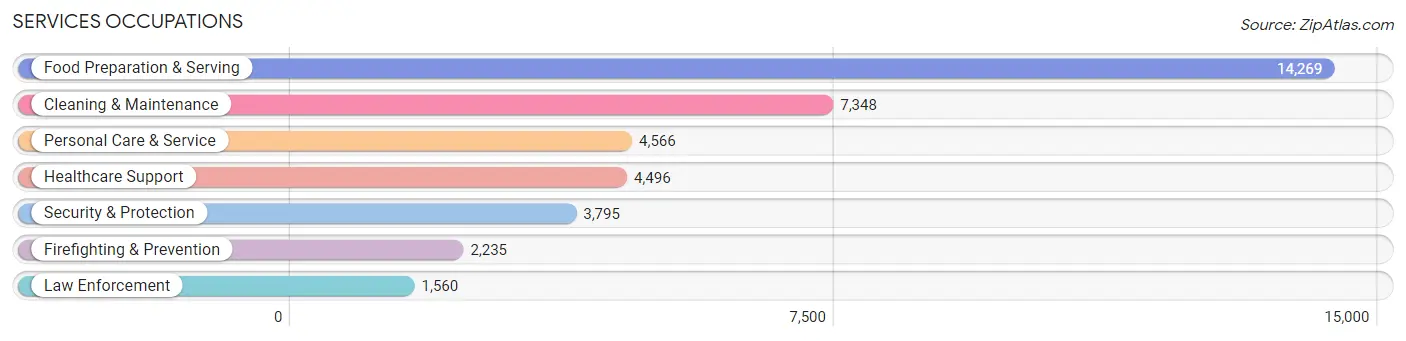
Services Occupations
The most common Services occupations in Charleston County are Food Preparation & Serving (14,269 | 6.8%), Cleaning & Maintenance (7,348 | 3.5%), Personal Care & Service (4,566 | 2.2%), Healthcare Support (4,496 | 2.1%), and Security & Protection (3,795 | 1.8%).
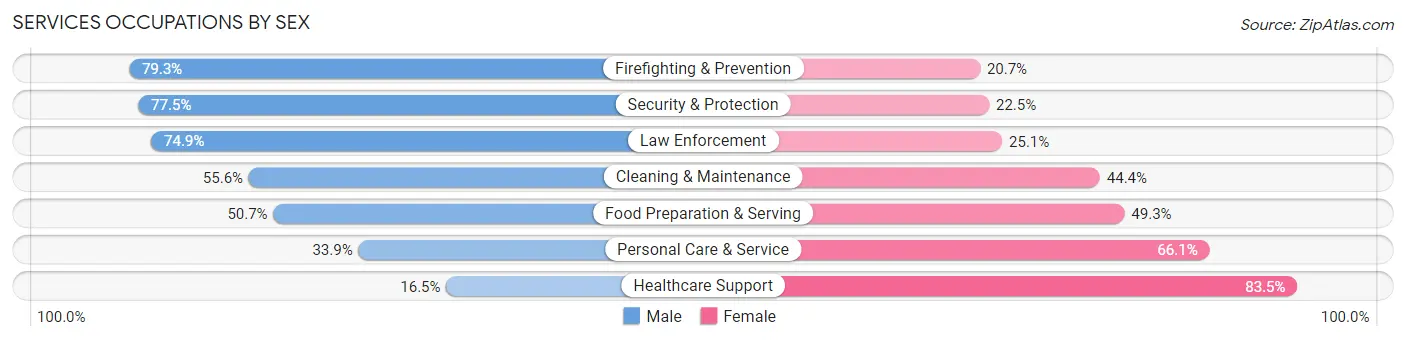
Services Occupations by Sex
Within the Services occupations in Charleston County, the most male-oriented occupations are Firefighting & Prevention (79.3%), Security & Protection (77.5%), and Law Enforcement (74.9%), while the most female-oriented occupations are Healthcare Support (83.5%), Personal Care & Service (66.1%), and Food Preparation & Serving (49.3%).
| Occupation | Male | Female |
| Healthcare Support | 741 (16.5%) | 3,755 (83.5%) |
| Security & Protection | 2,942 (77.5%) | 853 (22.5%) |
| Firefighting & Prevention | 1,773 (79.3%) | 462 (20.7%) |
| Law Enforcement | 1,169 (74.9%) | 391 (25.1%) |
| Food Preparation & Serving | 7,237 (50.7%) | 7,032 (49.3%) |
| Cleaning & Maintenance | 4,084 (55.6%) | 3,264 (44.4%) |
| Personal Care & Service | 1,547 (33.9%) | 3,019 (66.1%) |
| Total (Category) | 16,551 (48.0%) | 17,923 (52.0%) |
| Total (Overall) | 108,217 (51.2%) | 102,942 (48.7%) |
Sales and Office Occupations
The most common Sales and Office occupations in Charleston County are Sales & Related (23,192 | 11.0%), and Office & Administration (17,943 | 8.5%).
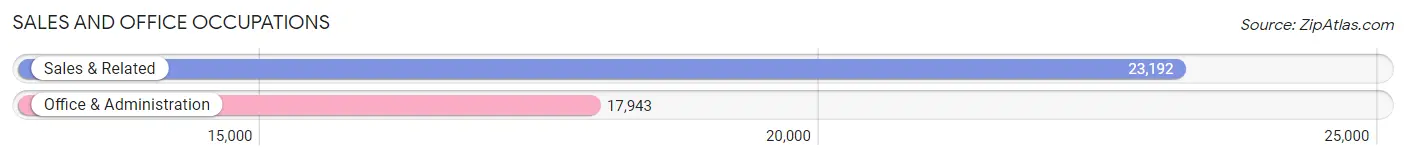
Sales and Office Occupations by Sex
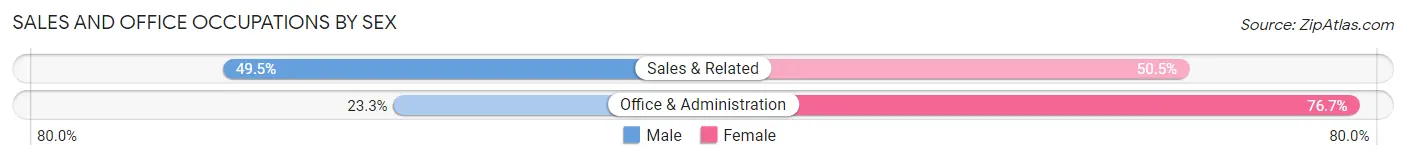
| Occupation | Male | Female |
| Sales & Related | 11,477 (49.5%) | 11,715 (50.5%) |
| Office & Administration | 4,173 (23.3%) | 13,770 (76.7%) |
| Total (Category) | 15,650 (38.1%) | 25,485 (62.0%) |
| Total (Overall) | 108,217 (51.2%) | 102,942 (48.7%) |
Natural Resources, Construction and Maintenance Occupations
The most common Natural Resources, Construction and Maintenance occupations in Charleston County are Construction & Extraction (8,907 | 4.2%), Installation, Maintenance & Repair (6,354 | 3.0%), and Farming, Fishing & Forestry (426 | 0.2%).
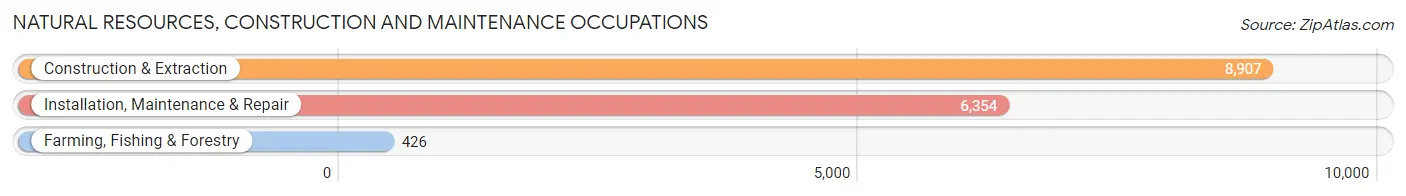
Natural Resources, Construction and Maintenance Occupations by Sex
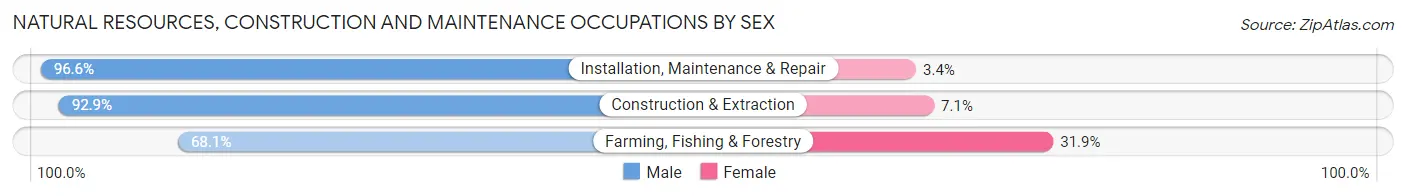
| Occupation | Male | Female |
| Farming, Fishing & Forestry | 290 (68.1%) | 136 (31.9%) |
| Construction & Extraction | 8,273 (92.9%) | 634 (7.1%) |
| Installation, Maintenance & Repair | 6,140 (96.6%) | 214 (3.4%) |
| Total (Category) | 14,703 (93.7%) | 984 (6.3%) |
| Total (Overall) | 108,217 (51.2%) | 102,942 (48.7%) |
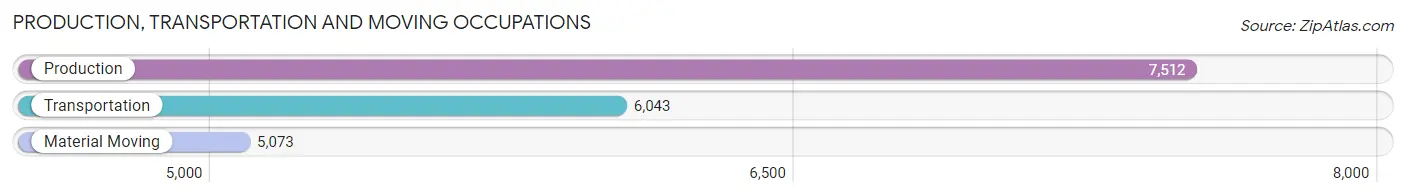
Production, Transportation and Moving Occupations
The most common Production, Transportation and Moving occupations in Charleston County are Production (7,512 | 3.6%), Transportation (6,043 | 2.9%), and Material Moving (5,073 | 2.4%).
Production, Transportation and Moving Occupations by Sex
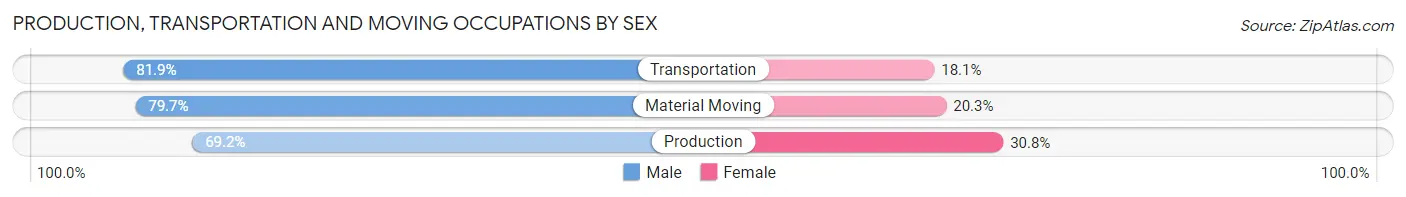
| Occupation | Male | Female |
| Production | 5,201 (69.2%) | 2,311 (30.8%) |
| Transportation | 4,948 (81.9%) | 1,095 (18.1%) |
| Material Moving | 4,042 (79.7%) | 1,031 (20.3%) |
| Total (Category) | 14,191 (76.2%) | 4,437 (23.8%) |
| Total (Overall) | 108,217 (51.2%) | 102,942 (48.7%) |
Employment Industries by Sex in Charleston County
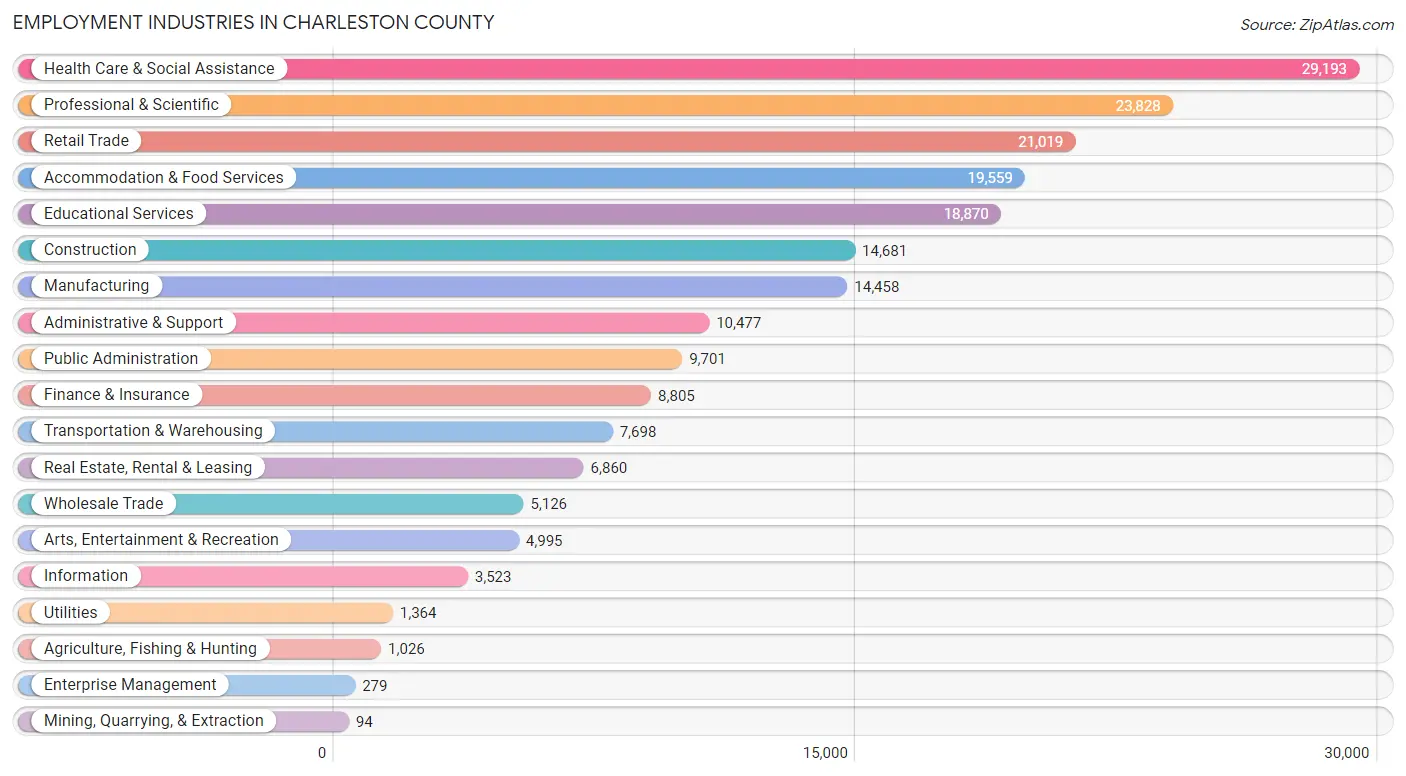
Employment Industries in Charleston County
The major employment industries in Charleston County include Health Care & Social Assistance (29,193 | 13.8%), Professional & Scientific (23,828 | 11.3%), Retail Trade (21,019 | 10.0%), Accommodation & Food Services (19,559 | 9.3%), and Educational Services (18,870 | 8.9%).
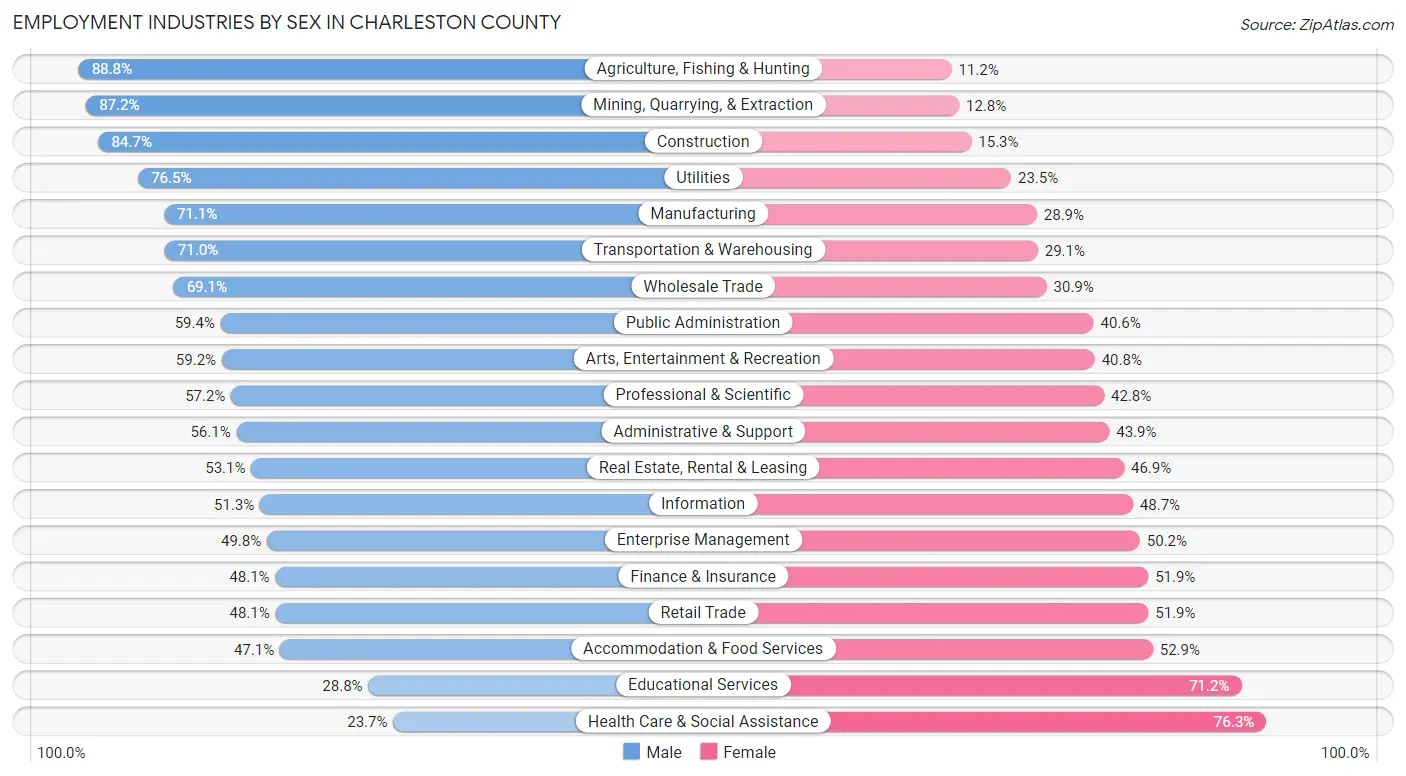
Employment Industries by Sex in Charleston County
The Charleston County industries that see more men than women are Agriculture, Fishing & Hunting (88.8%), Mining, Quarrying, & Extraction (87.2%), and Construction (84.7%), whereas the industries that tend to have a higher number of women are Health Care & Social Assistance (76.3%), Educational Services (71.2%), and Accommodation & Food Services (52.9%).
| Industry | Male | Female |
| Agriculture, Fishing & Hunting | 911 (88.8%) | 115 (11.2%) |
| Mining, Quarrying, & Extraction | 82 (87.2%) | 12 (12.8%) |
| Construction | 12,435 (84.7%) | 2,246 (15.3%) |
| Manufacturing | 10,285 (71.1%) | 4,173 (28.9%) |
| Wholesale Trade | 3,543 (69.1%) | 1,583 (30.9%) |
| Retail Trade | 10,102 (48.1%) | 10,917 (51.9%) |
| Transportation & Warehousing | 5,462 (71.0%) | 2,236 (29.0%) |
| Utilities | 1,043 (76.5%) | 321 (23.5%) |
| Information | 1,806 (51.3%) | 1,717 (48.7%) |
| Finance & Insurance | 4,234 (48.1%) | 4,571 (51.9%) |
| Real Estate, Rental & Leasing | 3,641 (53.1%) | 3,219 (46.9%) |
| Professional & Scientific | 13,639 (57.2%) | 10,189 (42.8%) |
| Enterprise Management | 139 (49.8%) | 140 (50.2%) |
| Administrative & Support | 5,882 (56.1%) | 4,595 (43.9%) |
| Educational Services | 5,442 (28.8%) | 13,428 (71.2%) |
| Health Care & Social Assistance | 6,916 (23.7%) | 22,277 (76.3%) |
| Arts, Entertainment & Recreation | 2,955 (59.2%) | 2,040 (40.8%) |
| Accommodation & Food Services | 9,220 (47.1%) | 10,339 (52.9%) |
| Public Administration | 5,763 (59.4%) | 3,938 (40.6%) |
| Total | 108,217 (51.2%) | 102,942 (48.7%) |
Education in Charleston County
School Enrollment in Charleston County
The most common levels of schooling among the 90,013 students in Charleston County are college / undergraduate (20,082 | 22.3%), middle school (17,179 | 19.1%), and high school (16,909 | 18.8%).
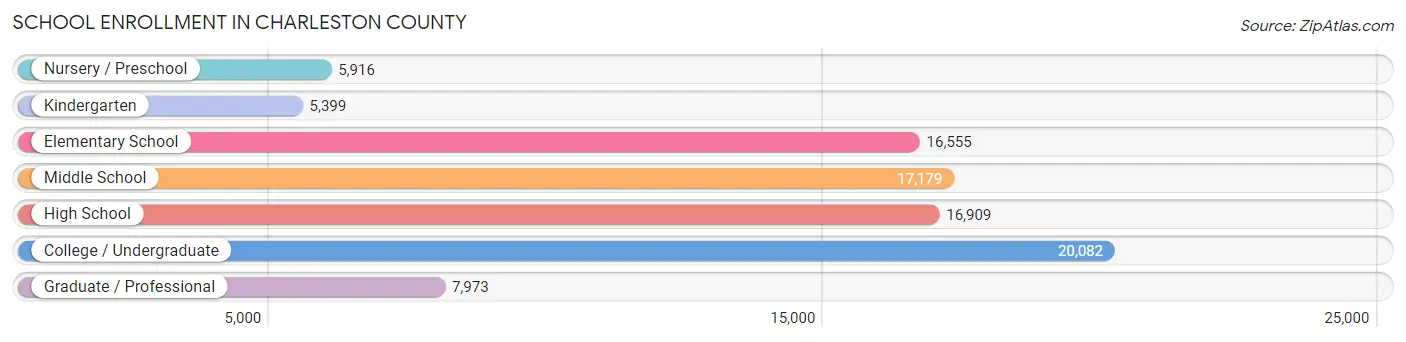
| School Level | # Students | % Students |
| Nursery / Preschool | 5,916 | 6.6% |
| Kindergarten | 5,399 | 6.0% |
| Elementary School | 16,555 | 18.4% |
| Middle School | 17,179 | 19.1% |
| High School | 16,909 | 18.8% |
| College / Undergraduate | 20,082 | 22.3% |
| Graduate / Professional | 7,973 | 8.9% |
| Total | 90,013 | 100.0% |
School Enrollment by Age by Funding Source in Charleston County
Out of a total of 90,013 students who are enrolled in schools in Charleston County, 16,652 (18.5%) attend a private institution, while the remaining 73,361 (81.5%) are enrolled in public schools. The age group of 3 to 4 year olds has the highest likelihood of being enrolled in private schools, with 2,435 (51.4% in the age bracket) enrolled. Conversely, the age group of 18 to 19 year olds has the lowest likelihood of being enrolled in a private school, with 6,265 (86.6% in the age bracket) attending a public institution.
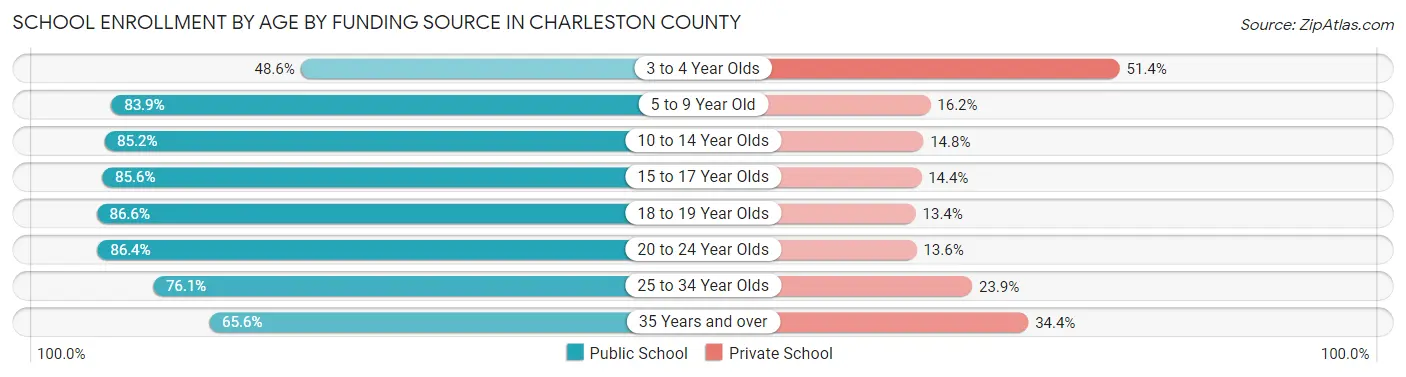
| Age Bracket | Public School | Private School |
| 3 to 4 Year Olds | 2,302 (48.6%) | 2,435 (51.4%) |
| 5 to 9 Year Old | 17,147 (83.9%) | 3,303 (16.2%) |
| 10 to 14 Year Olds | 18,720 (85.2%) | 3,256 (14.8%) |
| 15 to 17 Year Olds | 10,515 (85.6%) | 1,774 (14.4%) |
| 18 to 19 Year Olds | 6,265 (86.6%) | 969 (13.4%) |
| 20 to 24 Year Olds | 9,945 (86.4%) | 1,560 (13.6%) |
| 25 to 34 Year Olds | 5,112 (76.1%) | 1,606 (23.9%) |
| 35 Years and over | 3,350 (65.6%) | 1,754 (34.4%) |
| Total | 73,361 (81.5%) | 16,652 (18.5%) |
Educational Attainment by Field of Study in Charleston County
Business (32,611 | 21.4%), science & technology (15,015 | 9.9%), education (14,721 | 9.7%), bio, nature & agricultural (12,727 | 8.4%), and social sciences (12,664 | 8.3%) are the most common fields of study among 152,287 individuals in Charleston County who have obtained a bachelor's degree or higher.
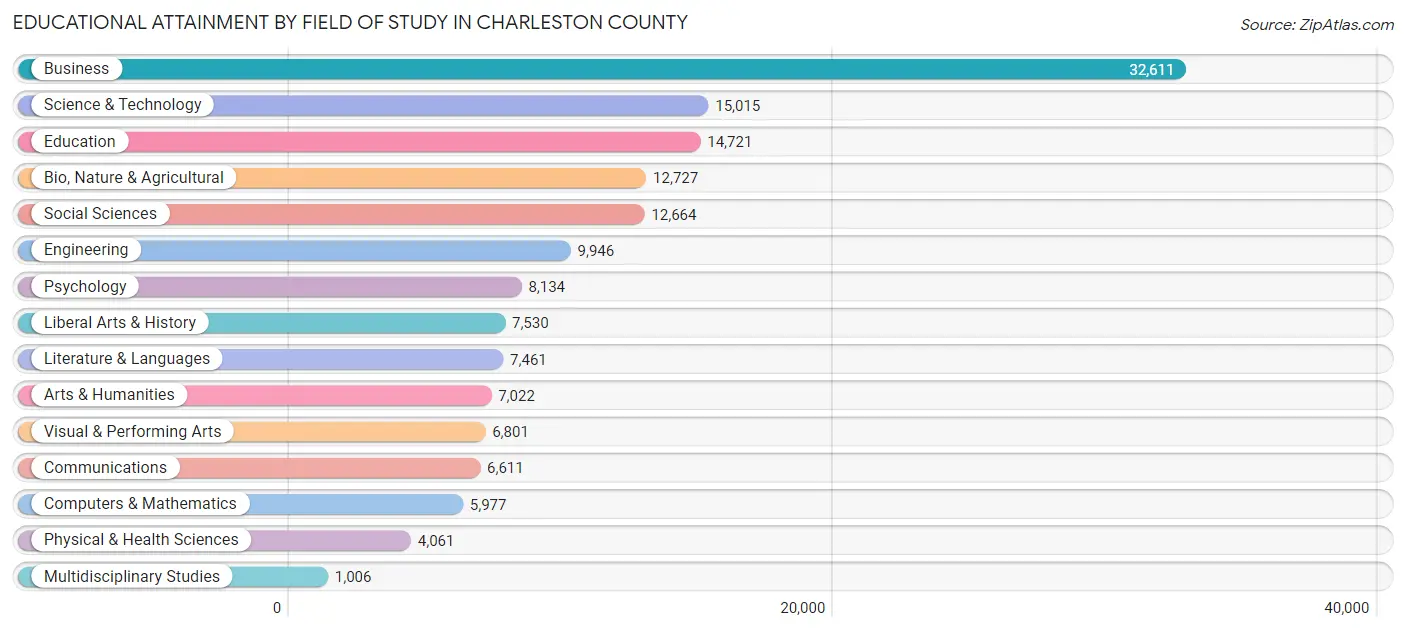
| Field of Study | # Graduates | % Graduates |
| Computers & Mathematics | 5,977 | 3.9% |
| Bio, Nature & Agricultural | 12,727 | 8.4% |
| Physical & Health Sciences | 4,061 | 2.7% |
| Psychology | 8,134 | 5.3% |
| Social Sciences | 12,664 | 8.3% |
| Engineering | 9,946 | 6.5% |
| Multidisciplinary Studies | 1,006 | 0.7% |
| Science & Technology | 15,015 | 9.9% |
| Business | 32,611 | 21.4% |
| Education | 14,721 | 9.7% |
| Literature & Languages | 7,461 | 4.9% |
| Liberal Arts & History | 7,530 | 4.9% |
| Visual & Performing Arts | 6,801 | 4.5% |
| Communications | 6,611 | 4.3% |
| Arts & Humanities | 7,022 | 4.6% |
| Total | 152,287 | 100.0% |
Transportation & Commute in Charleston County
Vehicle Availability by Sex in Charleston County
The most prevalent vehicle ownership categories in Charleston County are males with 2 vehicles (50,772, accounting for 46.9%) and females with 2 vehicles (44,912, making up 50.6%).
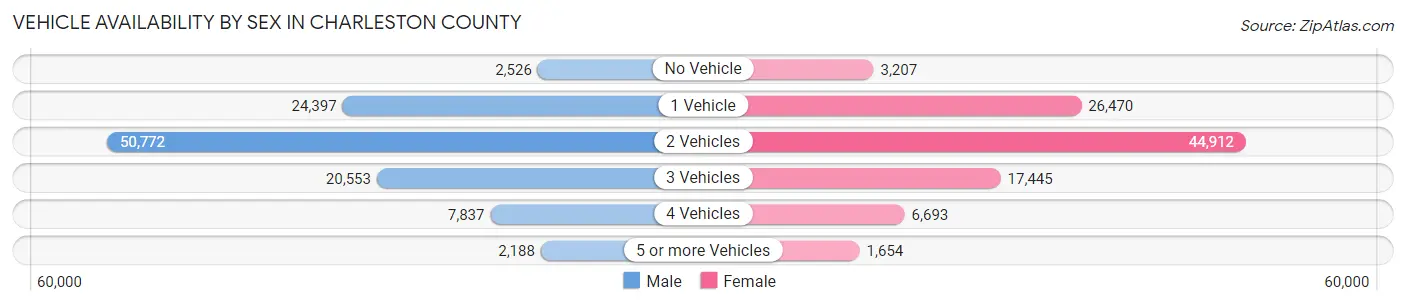
| Vehicles Available | Male | Female |
| No Vehicle | 2,526 (2.3%) | 3,207 (3.2%) |
| 1 Vehicle | 24,397 (22.5%) | 26,470 (26.4%) |
| 2 Vehicles | 50,772 (46.9%) | 44,912 (44.7%) |
| 3 Vehicles | 20,553 (19.0%) | 17,445 (17.4%) |
| 4 Vehicles | 7,837 (7.2%) | 6,693 (6.7%) |
| 5 or more Vehicles | 2,188 (2.0%) | 1,654 (1.7%) |
| Total | 108,273 (100.0%) | 100,381 (100.0%) |
Commute Time in Charleston County
The most frequently occuring commute durations in Charleston County are 20 to 24 minutes (33,123 commuters, 18.1%), 15 to 19 minutes (31,766 commuters, 17.4%), and 30 to 34 minutes (28,587 commuters, 15.6%).
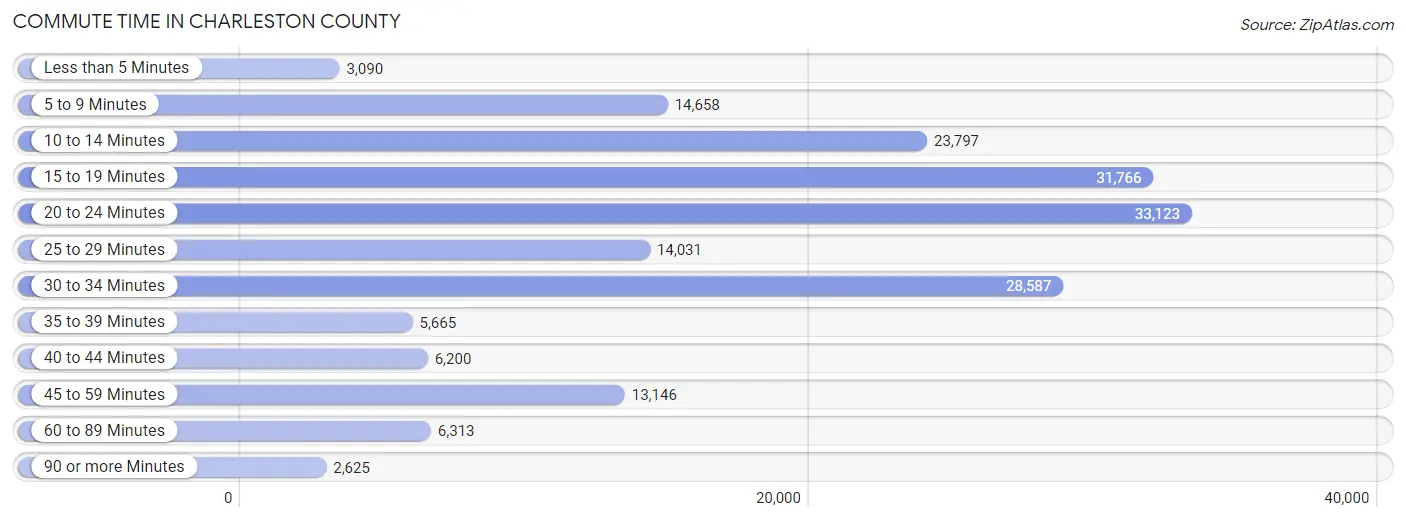
| Commute Time | # Commuters | % Commuters |
| Less than 5 Minutes | 3,090 | 1.7% |
| 5 to 9 Minutes | 14,658 | 8.0% |
| 10 to 14 Minutes | 23,797 | 13.0% |
| 15 to 19 Minutes | 31,766 | 17.4% |
| 20 to 24 Minutes | 33,123 | 18.1% |
| 25 to 29 Minutes | 14,031 | 7.7% |
| 30 to 34 Minutes | 28,587 | 15.6% |
| 35 to 39 Minutes | 5,665 | 3.1% |
| 40 to 44 Minutes | 6,200 | 3.4% |
| 45 to 59 Minutes | 13,146 | 7.2% |
| 60 to 89 Minutes | 6,313 | 3.5% |
| 90 or more Minutes | 2,625 | 1.4% |
Commute Time by Sex in Charleston County
The most common commute times in Charleston County are 20 to 24 minutes (17,555 commuters, 18.4%) for males and 15 to 19 minutes (15,844 commuters, 18.1%) for females.
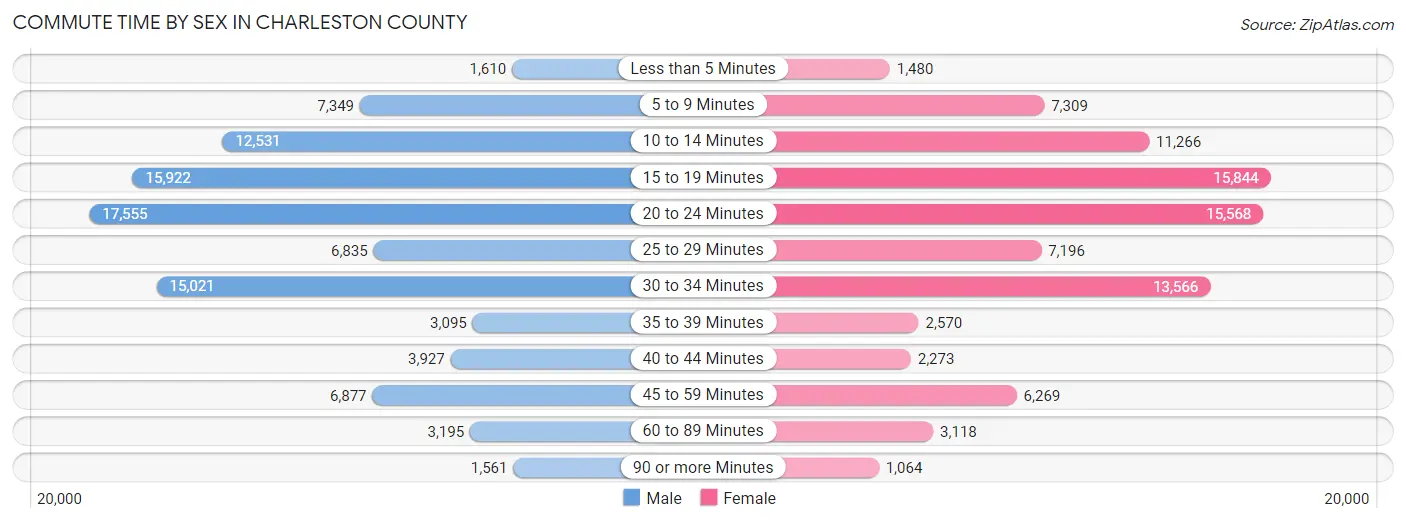
| Commute Time | Male | Female |
| Less than 5 Minutes | 1,610 (1.7%) | 1,480 (1.7%) |
| 5 to 9 Minutes | 7,349 (7.7%) | 7,309 (8.4%) |
| 10 to 14 Minutes | 12,531 (13.1%) | 11,266 (12.9%) |
| 15 to 19 Minutes | 15,922 (16.7%) | 15,844 (18.1%) |
| 20 to 24 Minutes | 17,555 (18.4%) | 15,568 (17.8%) |
| 25 to 29 Minutes | 6,835 (7.2%) | 7,196 (8.2%) |
| 30 to 34 Minutes | 15,021 (15.7%) | 13,566 (15.5%) |
| 35 to 39 Minutes | 3,095 (3.2%) | 2,570 (2.9%) |
| 40 to 44 Minutes | 3,927 (4.1%) | 2,273 (2.6%) |
| 45 to 59 Minutes | 6,877 (7.2%) | 6,269 (7.2%) |
| 60 to 89 Minutes | 3,195 (3.4%) | 3,118 (3.6%) |
| 90 or more Minutes | 1,561 (1.6%) | 1,064 (1.2%) |
Time of Departure to Work by Sex in Charleston County
The most frequent times of departure to work in Charleston County are 7:00 AM to 7:29 AM (16,593, 17.4%) for males and 8:00 AM to 8:29 AM (13,858, 15.8%) for females.
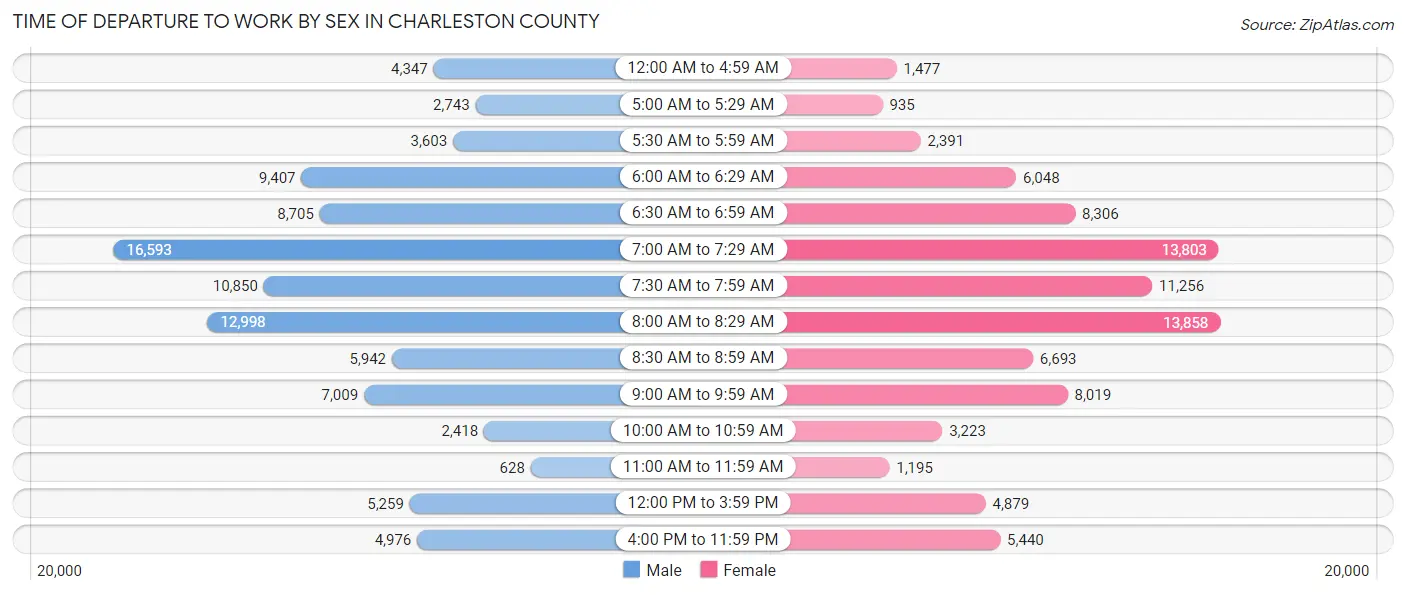
| Time of Departure | Male | Female |
| 12:00 AM to 4:59 AM | 4,347 (4.5%) | 1,477 (1.7%) |
| 5:00 AM to 5:29 AM | 2,743 (2.9%) | 935 (1.1%) |
| 5:30 AM to 5:59 AM | 3,603 (3.8%) | 2,391 (2.7%) |
| 6:00 AM to 6:29 AM | 9,407 (9.9%) | 6,048 (6.9%) |
| 6:30 AM to 6:59 AM | 8,705 (9.1%) | 8,306 (9.5%) |
| 7:00 AM to 7:29 AM | 16,593 (17.4%) | 13,803 (15.8%) |
| 7:30 AM to 7:59 AM | 10,850 (11.4%) | 11,256 (12.9%) |
| 8:00 AM to 8:29 AM | 12,998 (13.6%) | 13,858 (15.8%) |
| 8:30 AM to 8:59 AM | 5,942 (6.2%) | 6,693 (7.6%) |
| 9:00 AM to 9:59 AM | 7,009 (7.3%) | 8,019 (9.2%) |
| 10:00 AM to 10:59 AM | 2,418 (2.5%) | 3,223 (3.7%) |
| 11:00 AM to 11:59 AM | 628 (0.7%) | 1,195 (1.4%) |
| 12:00 PM to 3:59 PM | 5,259 (5.5%) | 4,879 (5.6%) |
| 4:00 PM to 11:59 PM | 4,976 (5.2%) | 5,440 (6.2%) |
| Total | 95,478 (100.0%) | 87,523 (100.0%) |
Housing Occupancy in Charleston County
Occupancy by Ownership in Charleston County
Of the total 171,795 dwellings in Charleston County, owner-occupied units account for 108,650 (63.2%), while renter-occupied units make up 63,145 (36.8%).
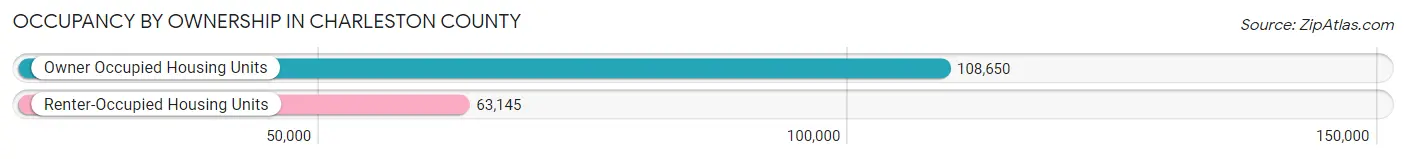
| Occupancy | # Housing Units | % Housing Units |
| Owner Occupied Housing Units | 108,650 | 63.2% |
| Renter-Occupied Housing Units | 63,145 | 36.8% |
| Total Occupied Housing Units | 171,795 | 100.0% |
Occupancy by Household Size in Charleston County
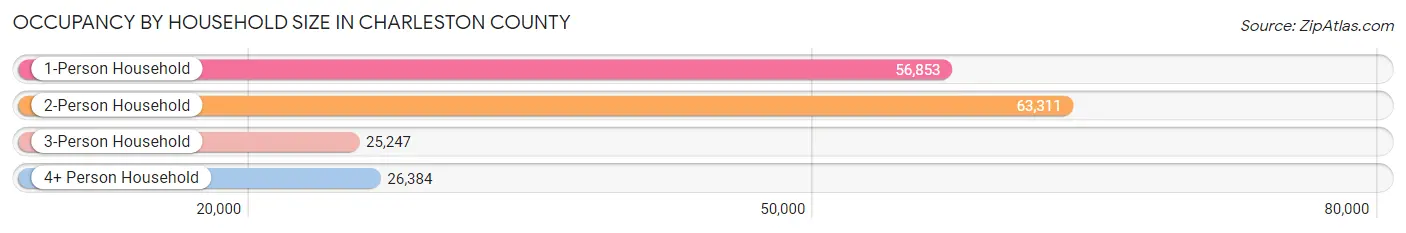
| Household Size | # Housing Units | % Housing Units |
| 1-Person Household | 56,853 | 33.1% |
| 2-Person Household | 63,311 | 36.8% |
| 3-Person Household | 25,247 | 14.7% |
| 4+ Person Household | 26,384 | 15.4% |
| Total Housing Units | 171,795 | 100.0% |
Occupancy by Ownership by Household Size in Charleston County
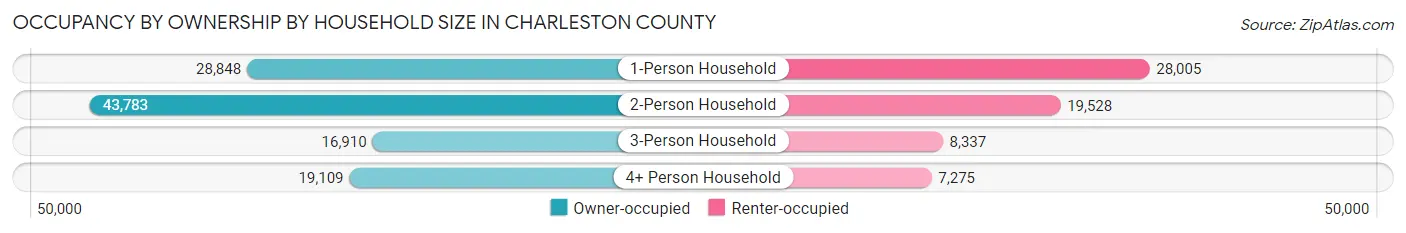
| Household Size | Owner-occupied | Renter-occupied |
| 1-Person Household | 28,848 (50.7%) | 28,005 (49.3%) |
| 2-Person Household | 43,783 (69.2%) | 19,528 (30.8%) |
| 3-Person Household | 16,910 (67.0%) | 8,337 (33.0%) |
| 4+ Person Household | 19,109 (72.4%) | 7,275 (27.6%) |
| Total Housing Units | 108,650 (63.2%) | 63,145 (36.8%) |
Occupancy by Educational Attainment in Charleston County
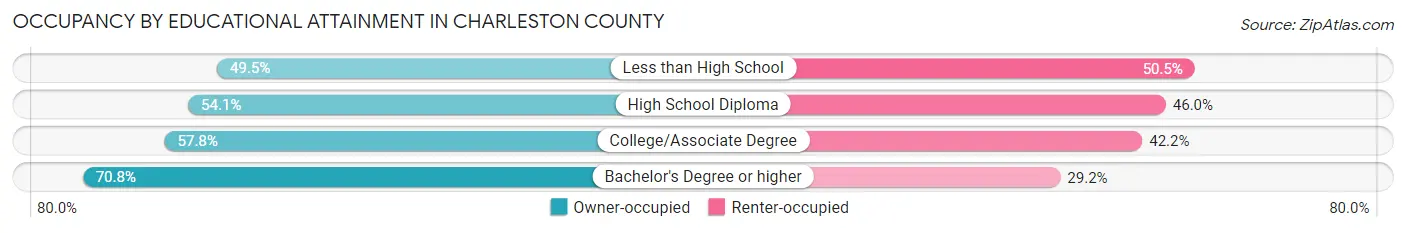
| Household Size | Owner-occupied | Renter-occupied |
| Less than High School | 5,094 (49.5%) | 5,201 (50.5%) |
| High School Diploma | 15,999 (54.0%) | 13,601 (46.0%) |
| College/Associate Degree | 25,802 (57.8%) | 18,845 (42.2%) |
| Bachelor's Degree or higher | 61,755 (70.8%) | 25,498 (29.2%) |
Occupancy by Age of Householder in Charleston County
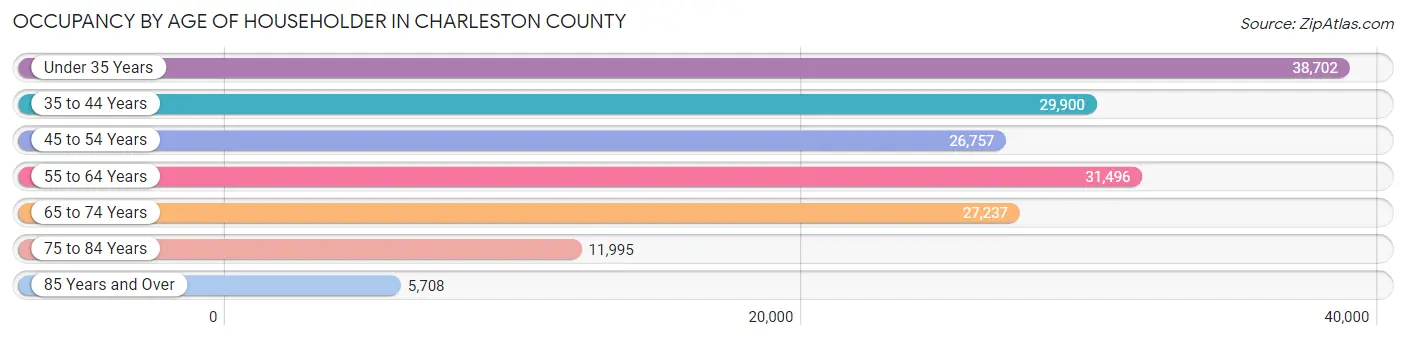
| Age Bracket | # Households | % Households |
| Under 35 Years | 38,702 | 22.5% |
| 35 to 44 Years | 29,900 | 17.4% |
| 45 to 54 Years | 26,757 | 15.6% |
| 55 to 64 Years | 31,496 | 18.3% |
| 65 to 74 Years | 27,237 | 15.9% |
| 75 to 84 Years | 11,995 | 7.0% |
| 85 Years and Over | 5,708 | 3.3% |
| Total | 171,795 | 100.0% |
Housing Finances in Charleston County
Median Income by Occupancy in Charleston County
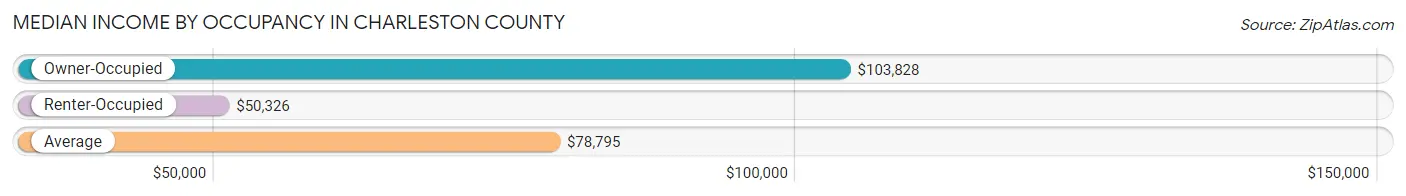
| Occupancy Type | # Households | Median Income |
| Owner-Occupied | 108,650 (63.2%) | $103,828 |
| Renter-Occupied | 63,145 (36.8%) | $50,326 |
| Average | 171,795 (100.0%) | $78,795 |
Occupancy by Householder Income Bracket in Charleston County
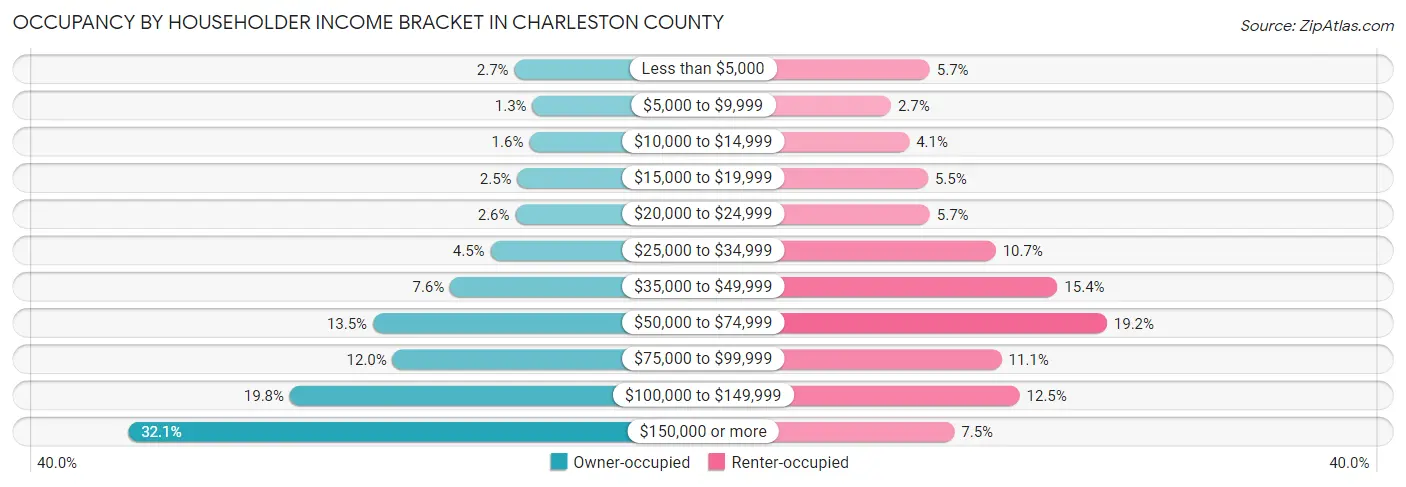
| Income Bracket | Owner-occupied | Renter-occupied |
| Less than $5,000 | 2,909 (2.7%) | 3,572 (5.7%) |
| $5,000 to $9,999 | 1,426 (1.3%) | 1,707 (2.7%) |
| $10,000 to $14,999 | 1,679 (1.5%) | 2,584 (4.1%) |
| $15,000 to $19,999 | 2,661 (2.5%) | 3,488 (5.5%) |
| $20,000 to $24,999 | 2,833 (2.6%) | 3,573 (5.7%) |
| $25,000 to $34,999 | 4,901 (4.5%) | 6,745 (10.7%) |
| $35,000 to $49,999 | 8,237 (7.6%) | 9,712 (15.4%) |
| $50,000 to $74,999 | 14,626 (13.5%) | 12,091 (19.2%) |
| $75,000 to $99,999 | 12,995 (12.0%) | 7,026 (11.1%) |
| $100,000 to $149,999 | 21,507 (19.8%) | 7,895 (12.5%) |
| $150,000 or more | 34,876 (32.1%) | 4,752 (7.5%) |
| Total | 108,650 (100.0%) | 63,145 (100.0%) |
Monthly Housing Cost Tiers in Charleston County
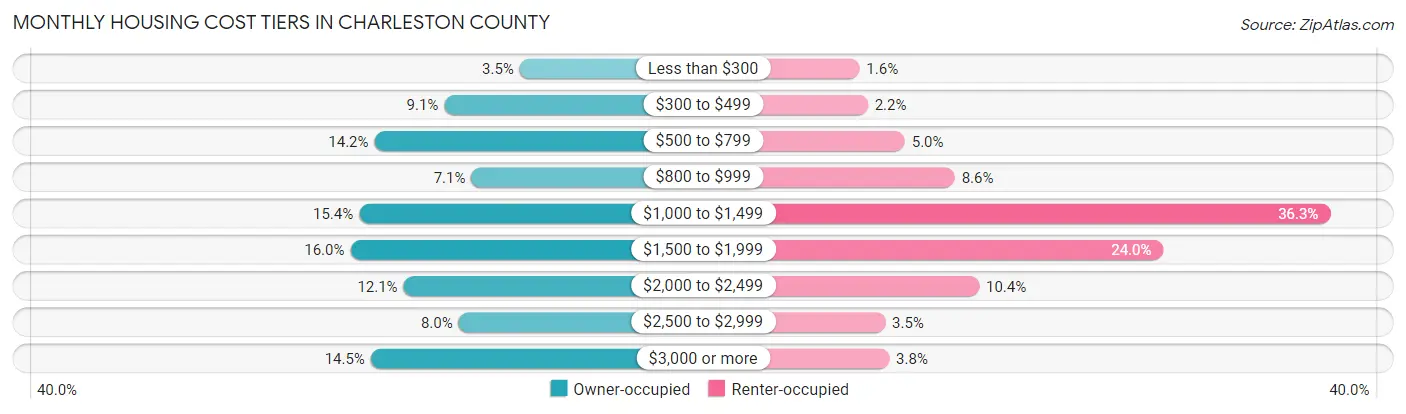
| Monthly Cost | Owner-occupied | Renter-occupied |
| Less than $300 | 3,843 (3.5%) | 1,022 (1.6%) |
| $300 to $499 | 9,888 (9.1%) | 1,408 (2.2%) |
| $500 to $799 | 15,475 (14.2%) | 3,135 (5.0%) |
| $800 to $999 | 7,711 (7.1%) | 5,453 (8.6%) |
| $1,000 to $1,499 | 16,695 (15.4%) | 22,914 (36.3%) |
| $1,500 to $1,999 | 17,392 (16.0%) | 15,155 (24.0%) |
| $2,000 to $2,499 | 13,152 (12.1%) | 6,585 (10.4%) |
| $2,500 to $2,999 | 8,731 (8.0%) | 2,218 (3.5%) |
| $3,000 or more | 15,763 (14.5%) | 2,403 (3.8%) |
| Total | 108,650 (100.0%) | 63,145 (100.0%) |
Physical Housing Characteristics in Charleston County
Housing Structures in Charleston County
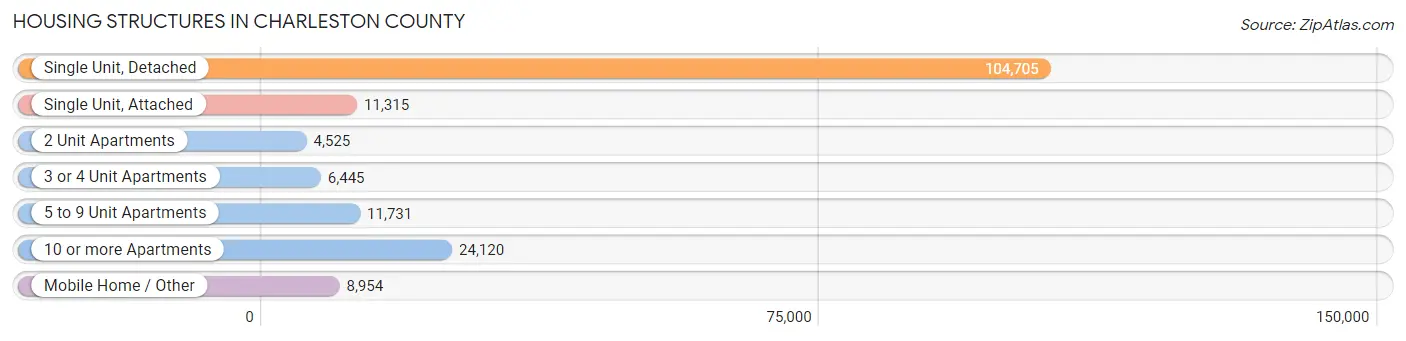
| Structure Type | # Housing Units | % Housing Units |
| Single Unit, Detached | 104,705 | 61.0% |
| Single Unit, Attached | 11,315 | 6.6% |
| 2 Unit Apartments | 4,525 | 2.6% |
| 3 or 4 Unit Apartments | 6,445 | 3.7% |
| 5 to 9 Unit Apartments | 11,731 | 6.8% |
| 10 or more Apartments | 24,120 | 14.0% |
| Mobile Home / Other | 8,954 | 5.2% |
| Total | 171,795 | 100.0% |
Housing Structures by Occupancy in Charleston County
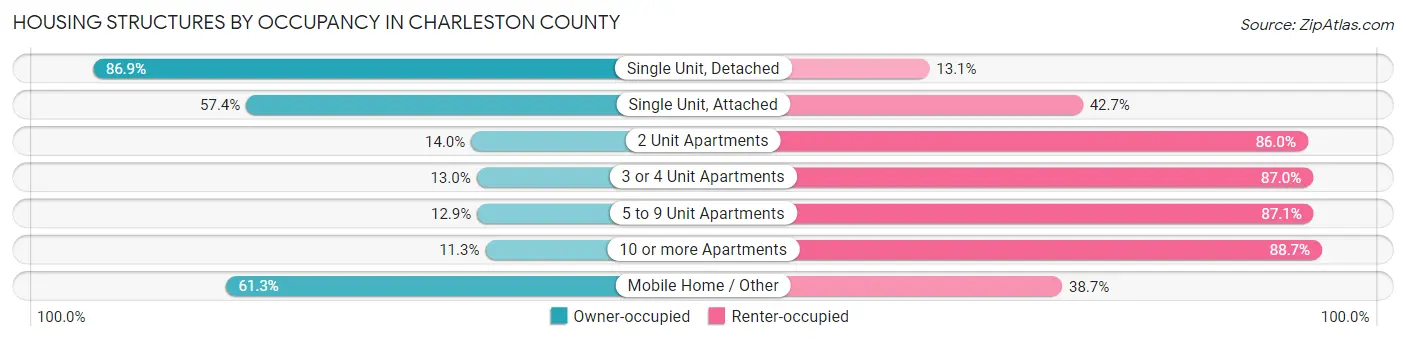
| Structure Type | Owner-occupied | Renter-occupied |
| Single Unit, Detached | 90,957 (86.9%) | 13,748 (13.1%) |
| Single Unit, Attached | 6,489 (57.4%) | 4,826 (42.6%) |
| 2 Unit Apartments | 635 (14.0%) | 3,890 (86.0%) |
| 3 or 4 Unit Apartments | 838 (13.0%) | 5,607 (87.0%) |
| 5 to 9 Unit Apartments | 1,511 (12.9%) | 10,220 (87.1%) |
| 10 or more Apartments | 2,729 (11.3%) | 21,391 (88.7%) |
| Mobile Home / Other | 5,491 (61.3%) | 3,463 (38.7%) |
| Total | 108,650 (63.2%) | 63,145 (36.8%) |
Housing Structures by Number of Rooms in Charleston County
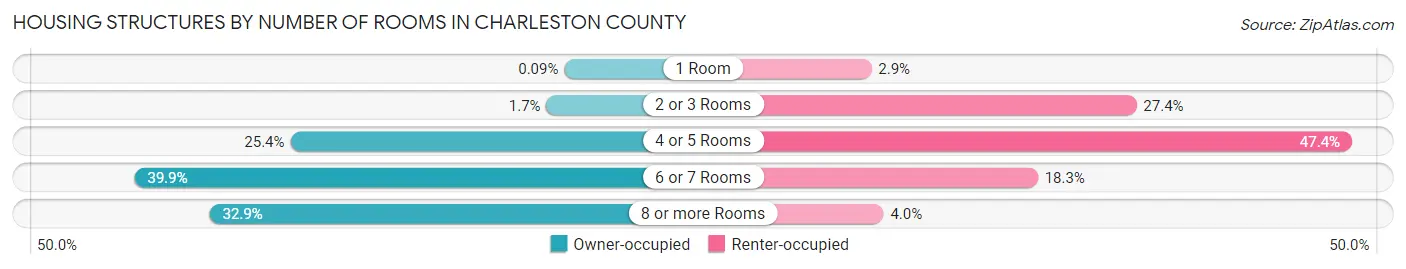
| Number of Rooms | Owner-occupied | Renter-occupied |
| 1 Room | 102 (0.1%) | 1,840 (2.9%) |
| 2 or 3 Rooms | 1,888 (1.7%) | 17,313 (27.4%) |
| 4 or 5 Rooms | 27,616 (25.4%) | 29,898 (47.3%) |
| 6 or 7 Rooms | 43,296 (39.9%) | 11,552 (18.3%) |
| 8 or more Rooms | 35,748 (32.9%) | 2,542 (4.0%) |
| Total | 108,650 (100.0%) | 63,145 (100.0%) |
Housing Structure by Heating Type in Charleston County
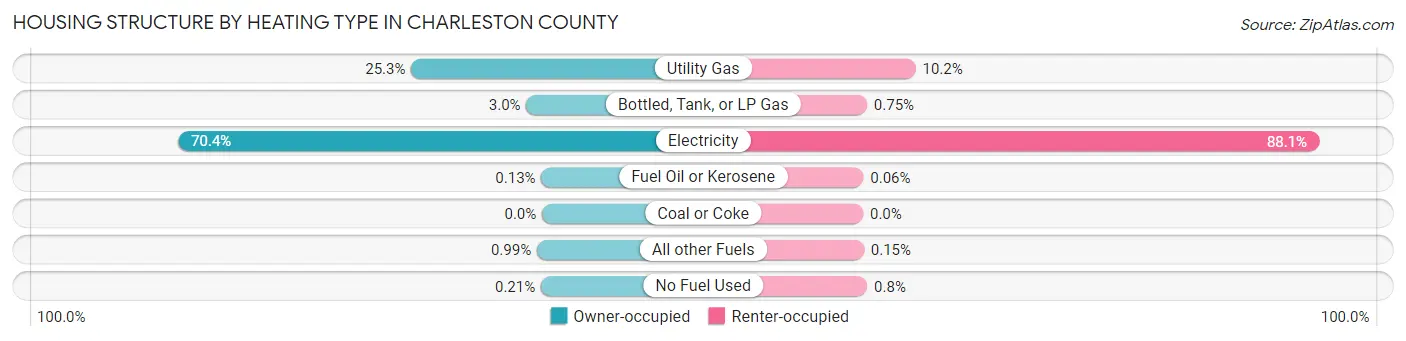
| Heating Type | Owner-occupied | Renter-occupied |
| Utility Gas | 27,468 (25.3%) | 6,407 (10.2%) |
| Bottled, Tank, or LP Gas | 3,297 (3.0%) | 472 (0.7%) |
| Electricity | 76,442 (70.4%) | 55,627 (88.1%) |
| Fuel Oil or Kerosene | 140 (0.1%) | 37 (0.1%) |
| Coal or Coke | 0 (0.0%) | 0 (0.0%) |
| All other Fuels | 1,074 (1.0%) | 94 (0.2%) |
| No Fuel Used | 229 (0.2%) | 508 (0.8%) |
| Total | 108,650 (100.0%) | 63,145 (100.0%) |
Household Vehicle Usage in Charleston County
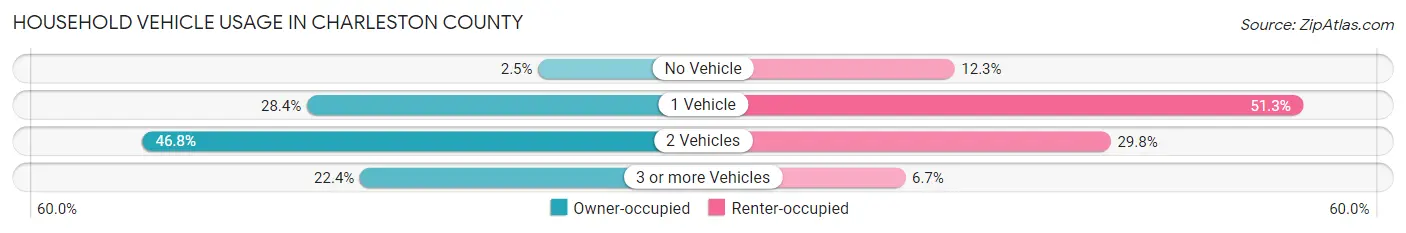
| Vehicles per Household | Owner-occupied | Renter-occupied |
| No Vehicle | 2,667 (2.5%) | 7,741 (12.3%) |
| 1 Vehicle | 30,809 (28.4%) | 32,367 (51.3%) |
| 2 Vehicles | 50,824 (46.8%) | 18,786 (29.7%) |
| 3 or more Vehicles | 24,350 (22.4%) | 4,251 (6.7%) |
| Total | 108,650 (100.0%) | 63,145 (100.0%) |
Real Estate & Mortgages in Charleston County
Real Estate and Mortgage Overview in Charleston County
| Characteristic | Without Mortgage | With Mortgage |
| Housing Units | 37,276 | 71,374 |
| Median Property Value | $362,100 | $436,200 |
| Median Household Income | $72,151 | $27,206 |
| Monthly Housing Costs | $596 | $15,389 |
| Real Estate Taxes | $1,460 | $761 |
Property Value by Mortgage Status in Charleston County
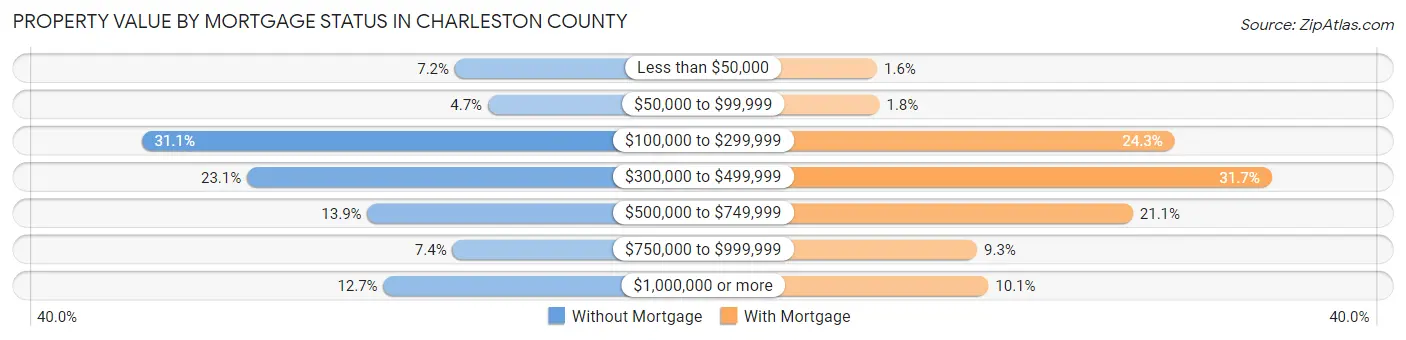
| Property Value | Without Mortgage | With Mortgage |
| Less than $50,000 | 2,691 (7.2%) | 1,173 (1.6%) |
| $50,000 to $99,999 | 1,752 (4.7%) | 1,306 (1.8%) |
| $100,000 to $299,999 | 11,589 (31.1%) | 17,349 (24.3%) |
| $300,000 to $499,999 | 8,591 (23.1%) | 22,629 (31.7%) |
| $500,000 to $749,999 | 5,174 (13.9%) | 15,080 (21.1%) |
| $750,000 to $999,999 | 2,758 (7.4%) | 6,611 (9.3%) |
| $1,000,000 or more | 4,721 (12.7%) | 7,226 (10.1%) |
| Total | 37,276 (100.0%) | 71,374 (100.0%) |
Household Income by Mortgage Status in Charleston County
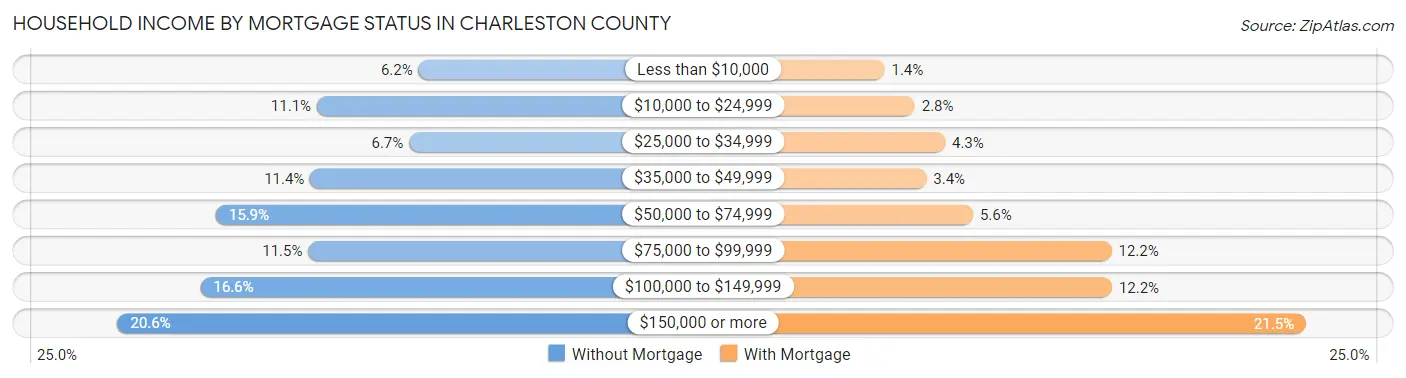
| Household Income | Without Mortgage | With Mortgage |
| Less than $10,000 | 2,325 (6.2%) | 987 (1.4%) |
| $10,000 to $24,999 | 4,132 (11.1%) | 2,010 (2.8%) |
| $25,000 to $34,999 | 2,494 (6.7%) | 3,041 (4.3%) |
| $35,000 to $49,999 | 4,249 (11.4%) | 2,407 (3.4%) |
| $50,000 to $74,999 | 5,923 (15.9%) | 3,988 (5.6%) |
| $75,000 to $99,999 | 4,283 (11.5%) | 8,703 (12.2%) |
| $100,000 to $149,999 | 6,200 (16.6%) | 8,712 (12.2%) |
| $150,000 or more | 7,670 (20.6%) | 15,307 (21.4%) |
| Total | 37,276 (100.0%) | 71,374 (100.0%) |
Property Value to Household Income Ratio in Charleston County
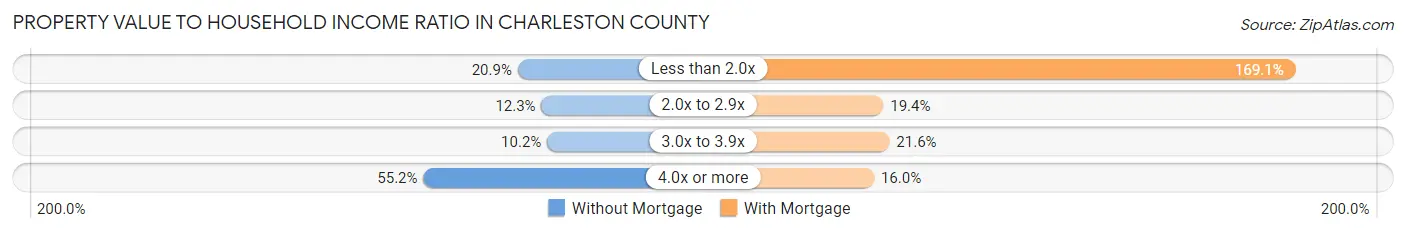
| Value-to-Income Ratio | Without Mortgage | With Mortgage |
| Less than 2.0x | 7,786 (20.9%) | 120,706 (169.1%) |
| 2.0x to 2.9x | 4,573 (12.3%) | 13,832 (19.4%) |
| 3.0x to 3.9x | 3,801 (10.2%) | 15,425 (21.6%) |
| 4.0x or more | 20,565 (55.2%) | 11,420 (16.0%) |
| Total | 37,276 (100.0%) | 71,374 (100.0%) |
Real Estate Taxes by Mortgage Status in Charleston County
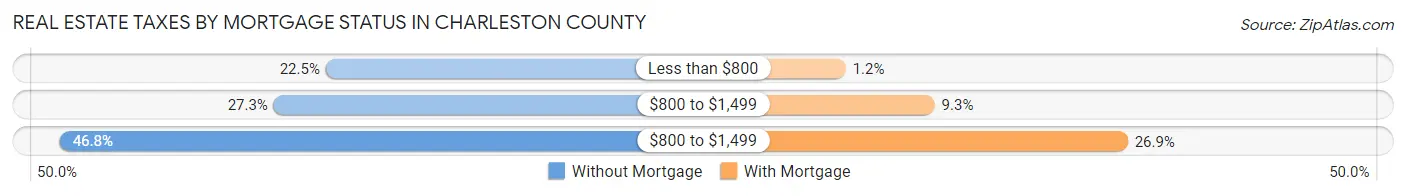
| Property Taxes | Without Mortgage | With Mortgage |
| Less than $800 | 8,387 (22.5%) | 830 (1.2%) |
| $800 to $1,499 | 10,157 (27.3%) | 6,624 (9.3%) |
| $800 to $1,499 | 17,443 (46.8%) | 19,208 (26.9%) |
| Total | 37,276 (100.0%) | 71,374 (100.0%) |
Health & Disability in Charleston County
Health Insurance Coverage by Age in Charleston County
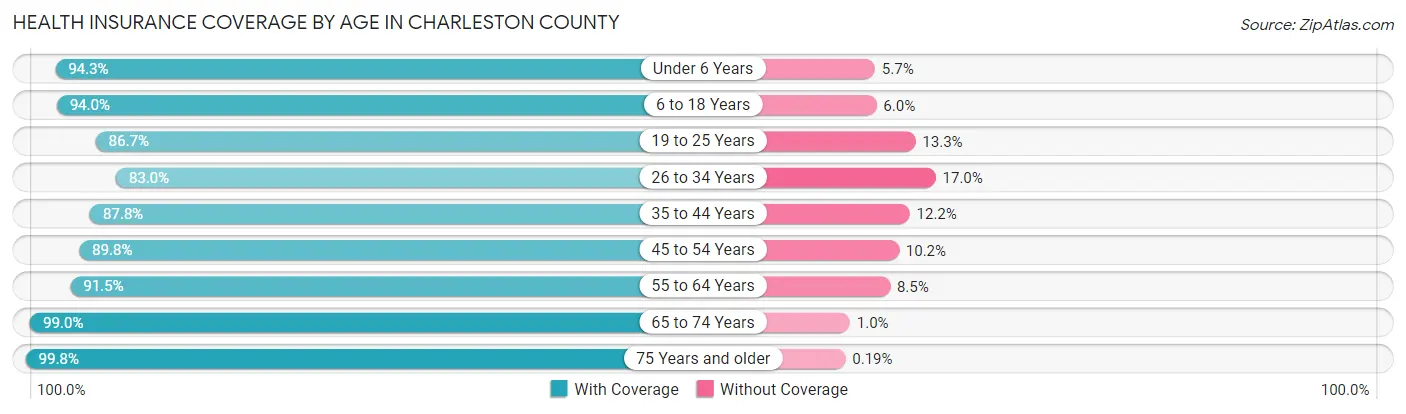
| Age Bracket | With Coverage | Without Coverage |
| Under 6 Years | 25,735 (94.3%) | 1,559 (5.7%) |
| 6 to 18 Years | 53,340 (94.0%) | 3,399 (6.0%) |
| 19 to 25 Years | 29,892 (86.7%) | 4,569 (13.3%) |
| 26 to 34 Years | 47,886 (83.0%) | 9,826 (17.0%) |
| 35 to 44 Years | 49,026 (87.8%) | 6,801 (12.2%) |
| 45 to 54 Years | 42,777 (89.8%) | 4,843 (10.2%) |
| 55 to 64 Years | 48,845 (91.5%) | 4,552 (8.5%) |
| 65 to 74 Years | 43,083 (99.0%) | 447 (1.0%) |
| 75 Years and older | 26,195 (99.8%) | 50 (0.2%) |
| Total | 366,779 (91.0%) | 36,046 (8.9%) |
Health Insurance Coverage by Citizenship Status in Charleston County
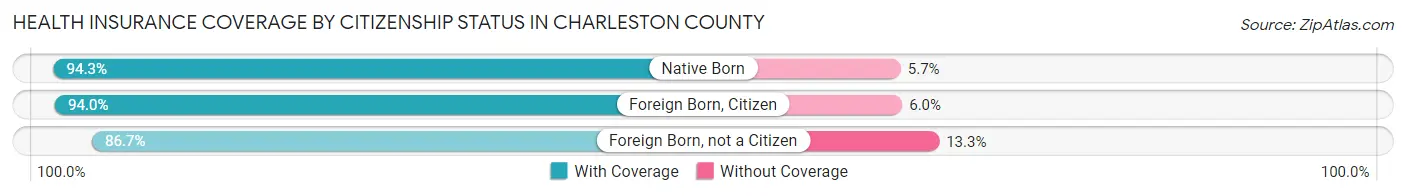
| Citizenship Status | With Coverage | Without Coverage |
| Native Born | 25,735 (94.3%) | 1,559 (5.7%) |
| Foreign Born, Citizen | 53,340 (94.0%) | 3,399 (6.0%) |
| Foreign Born, not a Citizen | 29,892 (86.7%) | 4,569 (13.3%) |
Health Insurance Coverage by Household Income in Charleston County
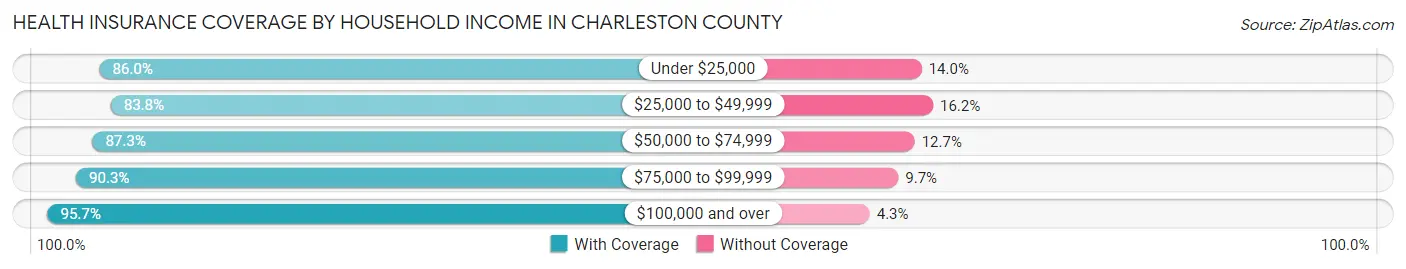
| Household Income | With Coverage | Without Coverage |
| Under $25,000 | 40,570 (86.0%) | 6,627 (14.0%) |
| $25,000 to $49,999 | 48,125 (83.8%) | 9,274 (16.2%) |
| $50,000 to $74,999 | 49,322 (87.3%) | 7,196 (12.7%) |
| $75,000 to $99,999 | 41,605 (90.3%) | 4,451 (9.7%) |
| $100,000 and over | 180,254 (95.7%) | 8,128 (4.3%) |
Public vs Private Health Insurance Coverage by Age in Charleston County
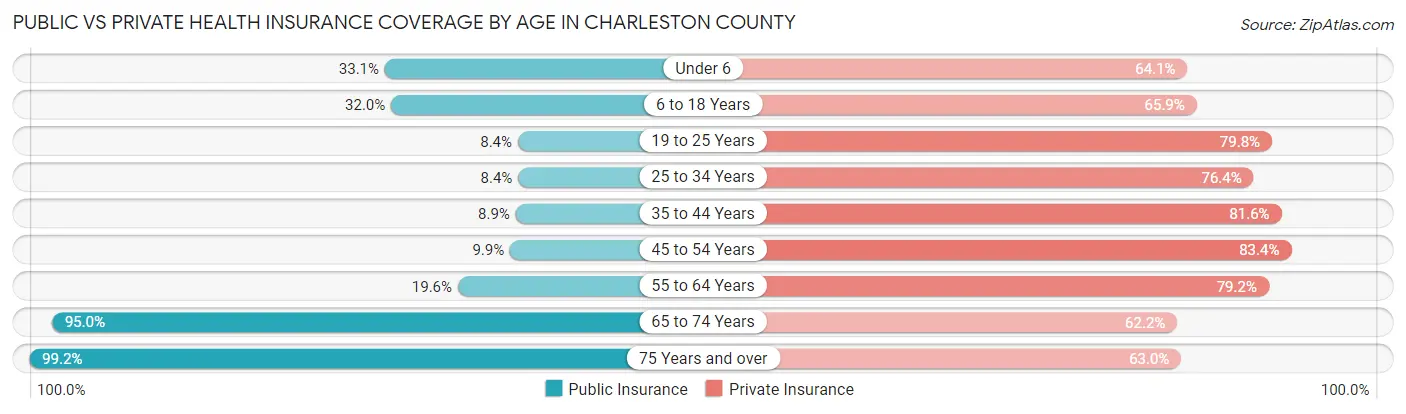
| Age Bracket | Public Insurance | Private Insurance |
| Under 6 | 9,043 (33.1%) | 17,507 (64.1%) |
| 6 to 18 Years | 18,142 (32.0%) | 37,365 (65.8%) |
| 19 to 25 Years | 2,908 (8.4%) | 27,509 (79.8%) |
| 25 to 34 Years | 4,837 (8.4%) | 44,103 (76.4%) |
| 35 to 44 Years | 4,940 (8.8%) | 45,553 (81.6%) |
| 45 to 54 Years | 4,711 (9.9%) | 39,723 (83.4%) |
| 55 to 64 Years | 10,455 (19.6%) | 42,313 (79.2%) |
| 65 to 74 Years | 41,337 (95.0%) | 27,091 (62.2%) |
| 75 Years and over | 26,022 (99.2%) | 16,531 (63.0%) |
| Total | 122,395 (30.4%) | 297,695 (73.9%) |
Disability Status by Sex by Age in Charleston County
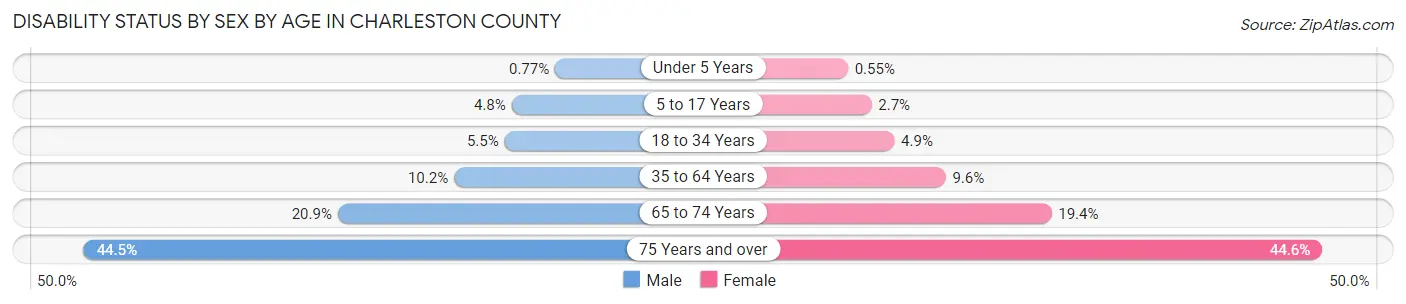
| Age Bracket | Male | Female |
| Under 5 Years | 92 (0.8%) | 61 (0.5%) |
| 5 to 17 Years | 1,372 (4.8%) | 763 (2.7%) |
| 18 to 34 Years | 2,560 (5.5%) | 2,426 (4.9%) |
| 35 to 64 Years | 7,676 (10.2%) | 7,809 (9.6%) |
| 65 to 74 Years | 4,202 (20.9%) | 4,560 (19.4%) |
| 75 Years and over | 4,853 (44.5%) | 6,837 (44.6%) |
Disability Class by Sex by Age in Charleston County
Disability Class: Hearing Difficulty
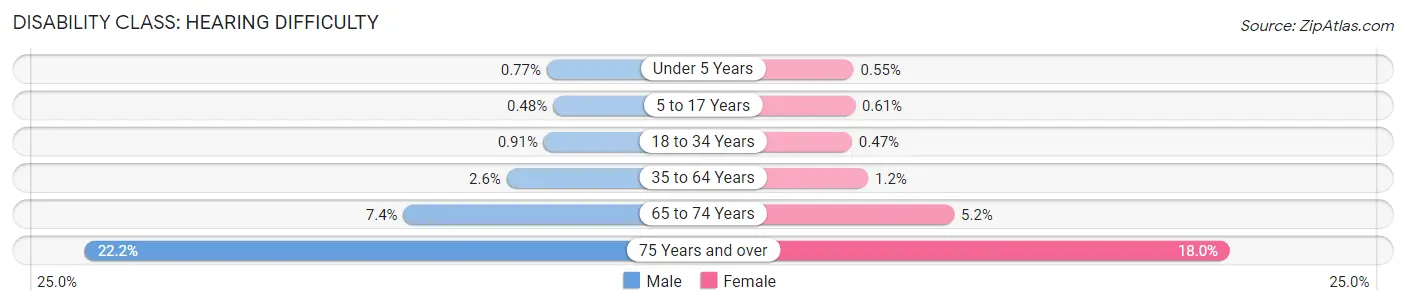
| Age Bracket | Male | Female |
| Under 5 Years | 92 (0.8%) | 61 (0.5%) |
| 5 to 17 Years | 138 (0.5%) | 169 (0.6%) |
| 18 to 34 Years | 425 (0.9%) | 237 (0.5%) |
| 35 to 64 Years | 1,991 (2.6%) | 992 (1.2%) |
| 65 to 74 Years | 1,489 (7.4%) | 1,223 (5.2%) |
| 75 Years and over | 2,422 (22.2%) | 2,763 (18.0%) |
Disability Class: Vision Difficulty
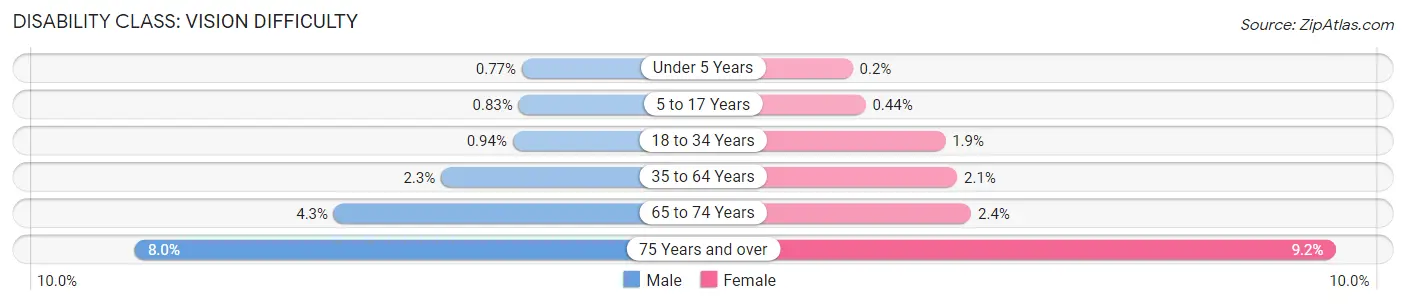
| Age Bracket | Male | Female |
| Under 5 Years | 92 (0.8%) | 22 (0.2%) |
| 5 to 17 Years | 238 (0.8%) | 123 (0.4%) |
| 18 to 34 Years | 439 (0.9%) | 960 (1.9%) |
| 35 to 64 Years | 1,716 (2.3%) | 1,741 (2.1%) |
| 65 to 74 Years | 855 (4.3%) | 562 (2.4%) |
| 75 Years and over | 867 (8.0%) | 1,405 (9.2%) |
Disability Class: Cognitive Difficulty
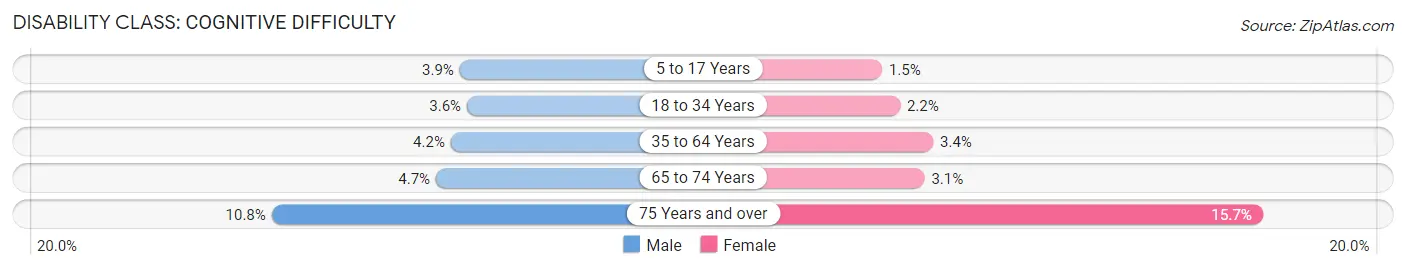
| Age Bracket | Male | Female |
| 5 to 17 Years | 1,098 (3.8%) | 414 (1.5%) |
| 18 to 34 Years | 1,679 (3.6%) | 1,077 (2.2%) |
| 35 to 64 Years | 3,159 (4.2%) | 2,752 (3.4%) |
| 65 to 74 Years | 950 (4.7%) | 721 (3.1%) |
| 75 Years and over | 1,181 (10.8%) | 2,403 (15.7%) |
Disability Class: Ambulatory Difficulty
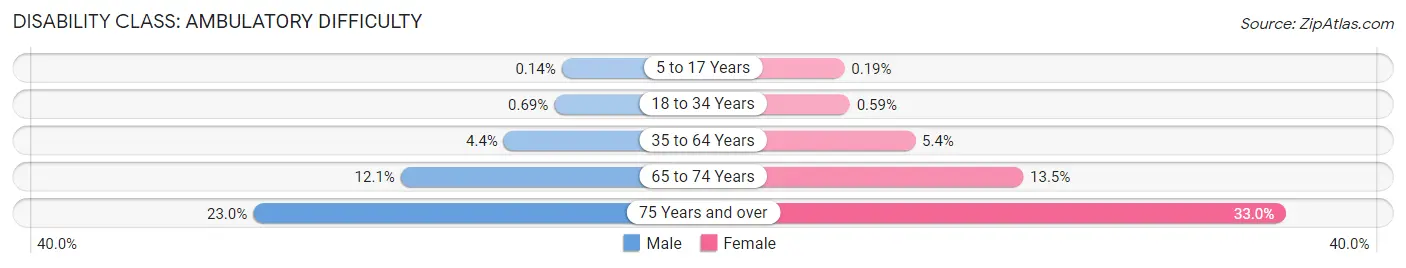
| Age Bracket | Male | Female |
| 5 to 17 Years | 40 (0.1%) | 54 (0.2%) |
| 18 to 34 Years | 323 (0.7%) | 296 (0.6%) |
| 35 to 64 Years | 3,349 (4.4%) | 4,418 (5.4%) |
| 65 to 74 Years | 2,424 (12.1%) | 3,158 (13.5%) |
| 75 Years and over | 2,512 (23.0%) | 5,059 (33.0%) |
Disability Class: Self-Care Difficulty
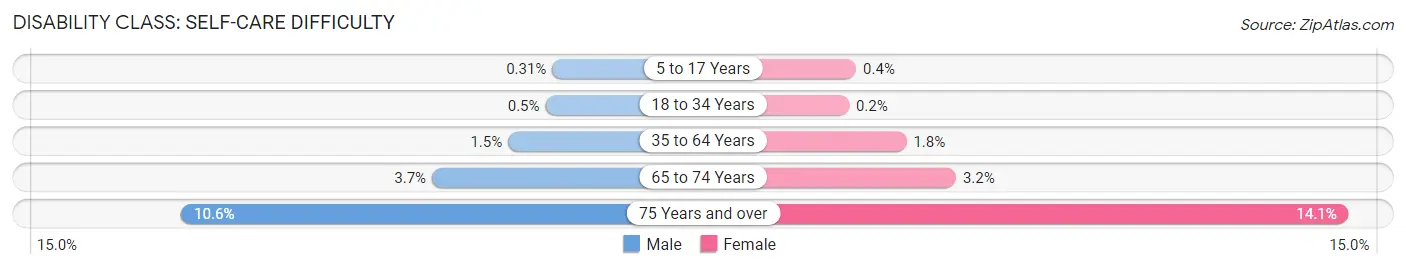
| Age Bracket | Male | Female |
| 5 to 17 Years | 88 (0.3%) | 110 (0.4%) |
| 18 to 34 Years | 236 (0.5%) | 101 (0.2%) |
| 35 to 64 Years | 1,164 (1.5%) | 1,464 (1.8%) |
| 65 to 74 Years | 735 (3.7%) | 746 (3.2%) |
| 75 Years and over | 1,160 (10.6%) | 2,165 (14.1%) |
Technology Access in Charleston County
Computing Device Access in Charleston County
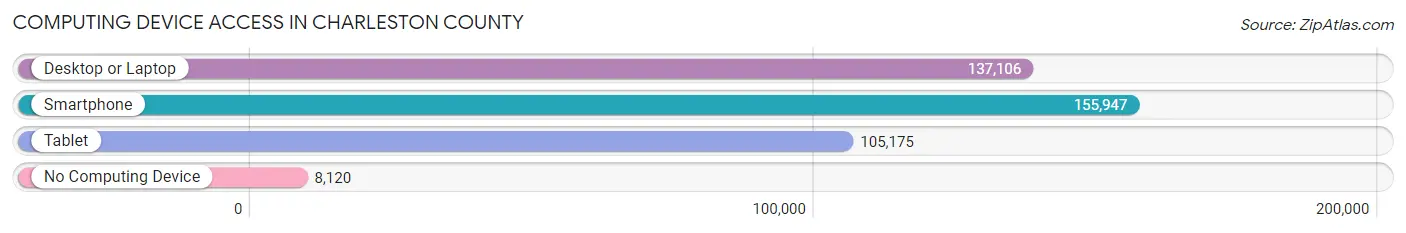
| Device Type | # Households | % Households |
| Desktop or Laptop | 137,106 | 79.8% |
| Smartphone | 155,947 | 90.8% |
| Tablet | 105,175 | 61.2% |
| No Computing Device | 8,120 | 4.7% |
| Total | 171,795 | 100.0% |
Internet Access in Charleston County
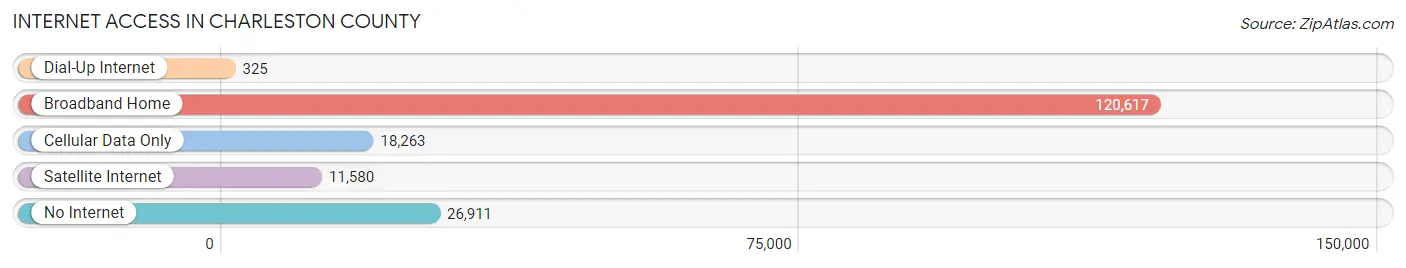
| Internet Type | # Households | % Households |
| Dial-Up Internet | 325 | 0.2% |
| Broadband Home | 120,617 | 70.2% |
| Cellular Data Only | 18,263 | 10.6% |
| Satellite Internet | 11,580 | 6.7% |
| No Internet | 26,911 | 15.7% |
| Total | 171,795 | 100.0% |
Charleston County Summary
Charleston County, South Carolina is located in the Lowcountry region of the state and is the second most populous county in the state. It is bordered by Berkeley, Dorchester, and Colleton Counties. The county seat is Charleston, which is also the largest city in the county. The county is home to a variety of industries, including tourism, manufacturing, and agriculture.
History
Charleston County was established in 1682 as part of the Province of Carolina. It was named after Charles II of England, who had granted the land to eight of his loyal supporters. The county was originally part of Berkeley County, but was split off in 1769. The county was home to many prominent figures in American history, including John Rutledge, who was a signer of the United States Constitution, and Edward Rutledge, who was the youngest signer of the Declaration of Independence.
Geography
Charleston County is located in the Lowcountry region of South Carolina. It is bordered by Berkeley, Dorchester, and Colleton Counties. The county is located on the Atlantic coast and is home to several rivers, including the Ashley, Cooper, and Wando. The county is also home to several islands, including James Island, Johns Island, and Wadmalaw Island. The county has a total area of 1,358 square miles, of which 1,077 square miles is land and 281 square miles is water.
Economy
Charleston County is home to a variety of industries, including tourism, manufacturing, and agriculture. The county is home to several major employers, including Boeing, Joint Base Charleston, and the Medical University of South Carolina. Tourism is a major industry in the county, with the city of Charleston being a popular destination for visitors. The county is also home to several manufacturing companies, including Volvo Cars, Bosch, and Daimler AG. Agriculture is also an important part of the county’s economy, with the county being home to several farms and agricultural businesses.
Demographics
As of the 2010 census, Charleston County had a population of 350,209. The racial makeup of the county was 68.2% White, 27.7% African American, 0.5% Native American, 1.7% Asian, 0.1% Pacific Islander, 0.7% from other races, and 1.8% from two or more races. Hispanic or Latino of any race were 3.2% of the population. The median income for a household in the county was $50,867 and the median income for a family was $62,867. The per capita income for the county was $27,837.
Charleston County is a diverse and vibrant county with a rich history and a strong economy. It is home to a variety of industries, including tourism, manufacturing, and agriculture. The county is also home to several prominent figures in American history, including John Rutledge and Edward Rutledge. The county has a population of 350,209 and a median income of $50,867.
Common Questions
What is Per Capita Income in Charleston County?
Per Capita income in Charleston County is $51,480.
What is the Median Family Income in Charleston County?
Median Family Income in Charleston County is $104,928.
What is the Median Household income in Charleston County?
Median Household Income in Charleston County is $78,795.
What is Income or Wage Gap in Charleston County?
Income or Wage Gap in Charleston County is 24.3%.
Women in Charleston County earn 75.7 cents for every dollar earned by a man.
What is Family Income Deficit in Charleston County?
Family Income Deficit in Charleston County is $10,911.
Families that are below poverty line in Charleston County earn $10,911 less on average than the poverty threshold level.
What is Inequality or Gini Index in Charleston County?
Inequality or Gini Index in Charleston County is 0.51.
What is the Total Population of Charleston County?
Total Population of Charleston County is 409,840.
What is the Total Male Population of Charleston County?
Total Male Population of Charleston County is 199,049.
What is the Total Female Population of Charleston County?
Total Female Population of Charleston County is 210,791.
What is the Ratio of Males per 100 Females in Charleston County?
There are 94.43 Males per 100 Females in Charleston County.
What is the Ratio of Females per 100 Males in Charleston County?
There are 105.90 Females per 100 Males in Charleston County.
What is the Median Population Age in Charleston County?
Median Population Age in Charleston County is 38.9 Years.
What is the Average Family Size in Charleston County
Average Family Size in Charleston County is 3.0 People.
What is the Average Household Size in Charleston County
Average Household Size in Charleston County is 2.3 People.
How Large is the Labor Force in Charleston County?
There are 222,758 People in the Labor Forcein in Charleston County.
What is the Percentage of People in the Labor Force in Charleston County?
65.8% of People are in the Labor Force in Charleston County.
What is the Unemployment Rate in Charleston County?
Unemployment Rate in Charleston County is 3.7%.