Hilton Head Island, SC Map & Demographics
Hilton Head Island Map
Hilton Head Island Overview
$66,506
PER CAPITA INCOME
$120,887
AVG FAMILY INCOME
$93,694
AVG HOUSEHOLD INCOME
28.3%
WAGE / INCOME GAP [ % ]
71.7¢/ $1
WAGE / INCOME GAP [ $ ]
$10,284
FAMILY INCOME DEFICIT
0.50
INEQUALITY / GINI INDEX
37,708
TOTAL POPULATION
18,839
MALE POPULATION
18,869
FEMALE POPULATION
99.84
MALES / 100 FEMALES
100.16
FEMALES / 100 MALES
59.8
MEDIAN AGE
2.7
AVG FAMILY SIZE
2.2
AVG HOUSEHOLD SIZE
16,367
LABOR FORCE [ PEOPLE ]
48.1%
PERCENT IN LABOR FORCE
2.8%
UNEMPLOYMENT RATE
Hilton Head Island Area Codes
Income in Hilton Head Island
Income Overview in Hilton Head Island
Per Capita Income in Hilton Head Island is $66,506, while median incomes of families and households are $120,887 and $93,694 respectively.
| Characteristic | Number | Measure |
| Per Capita Income | 37,708 | $66,506 |
| Median Family Income | 10,954 | $120,887 |
| Mean Family Income | 10,954 | $169,984 |
| Median Household Income | 17,126 | $93,694 |
| Mean Household Income | 17,126 | $141,072 |
| Income Deficit | 10,954 | $10,284 |
| Wage / Income Gap (%) | 37,708 | 28.28% |
| Wage / Income Gap ($) | 37,708 | 71.72¢ per $1 |
| Gini / Inequality Index | 37,708 | 0.50 |
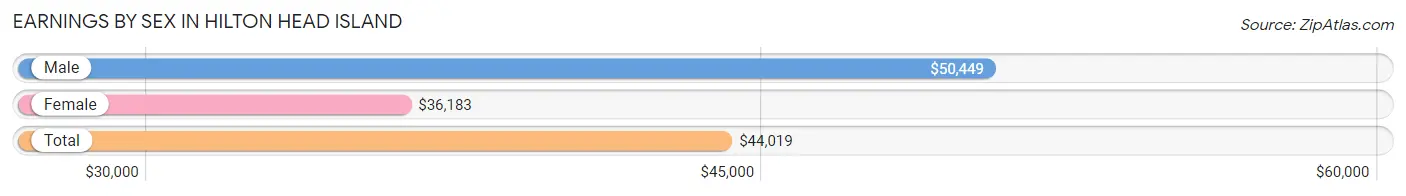
Earnings by Sex in Hilton Head Island
Average Earnings in Hilton Head Island are $44,019, $50,449 for men and $36,183 for women, a difference of 28.3%.
| Sex | Number | Average Earnings |
| Male | 9,509 (53.6%) | $50,449 |
| Female | 8,214 (46.4%) | $36,183 |
| Total | 17,723 (100.0%) | $44,019 |
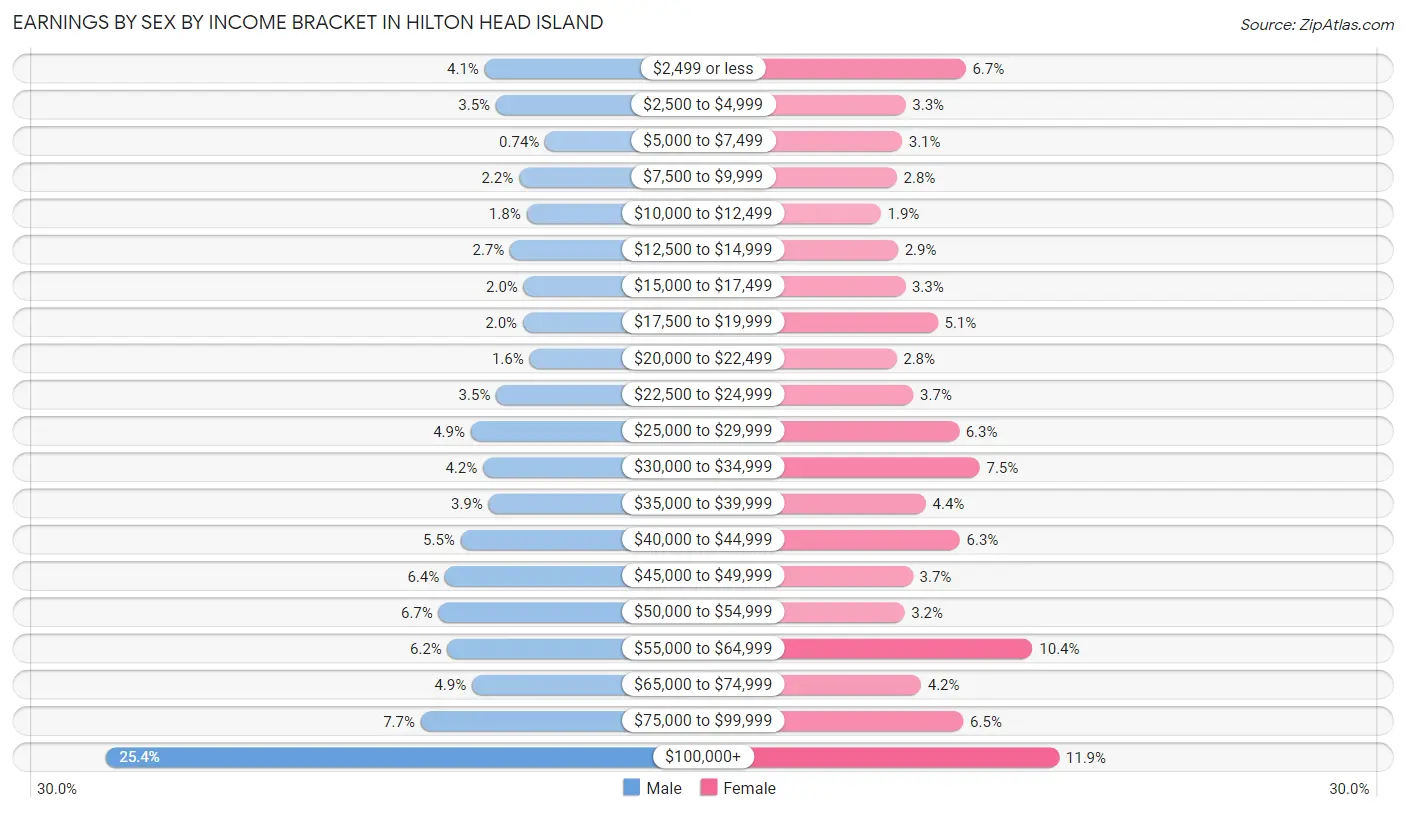
Earnings by Sex by Income Bracket in Hilton Head Island
The most common earnings brackets in Hilton Head Island are $100,000+ for men (2,415 | 25.4%) and $100,000+ for women (979 | 11.9%).
| Income | Male | Female |
| $2,499 or less | 394 (4.1%) | 548 (6.7%) |
| $2,500 to $4,999 | 334 (3.5%) | 270 (3.3%) |
| $5,000 to $7,499 | 70 (0.7%) | 254 (3.1%) |
| $7,500 to $9,999 | 210 (2.2%) | 230 (2.8%) |
| $10,000 to $12,499 | 170 (1.8%) | 156 (1.9%) |
| $12,500 to $14,999 | 258 (2.7%) | 235 (2.9%) |
| $15,000 to $17,499 | 185 (1.9%) | 269 (3.3%) |
| $17,500 to $19,999 | 189 (2.0%) | 419 (5.1%) |
| $20,000 to $22,499 | 154 (1.6%) | 228 (2.8%) |
| $22,500 to $24,999 | 332 (3.5%) | 306 (3.7%) |
| $25,000 to $29,999 | 468 (4.9%) | 517 (6.3%) |
| $30,000 to $34,999 | 402 (4.2%) | 613 (7.5%) |
| $35,000 to $39,999 | 373 (3.9%) | 364 (4.4%) |
| $40,000 to $44,999 | 522 (5.5%) | 521 (6.3%) |
| $45,000 to $49,999 | 606 (6.4%) | 304 (3.7%) |
| $50,000 to $54,999 | 640 (6.7%) | 265 (3.2%) |
| $55,000 to $64,999 | 591 (6.2%) | 857 (10.4%) |
| $65,000 to $74,999 | 461 (4.9%) | 342 (4.2%) |
| $75,000 to $99,999 | 735 (7.7%) | 537 (6.5%) |
| $100,000+ | 2,415 (25.4%) | 979 (11.9%) |
| Total | 9,509 (100.0%) | 8,214 (100.0%) |
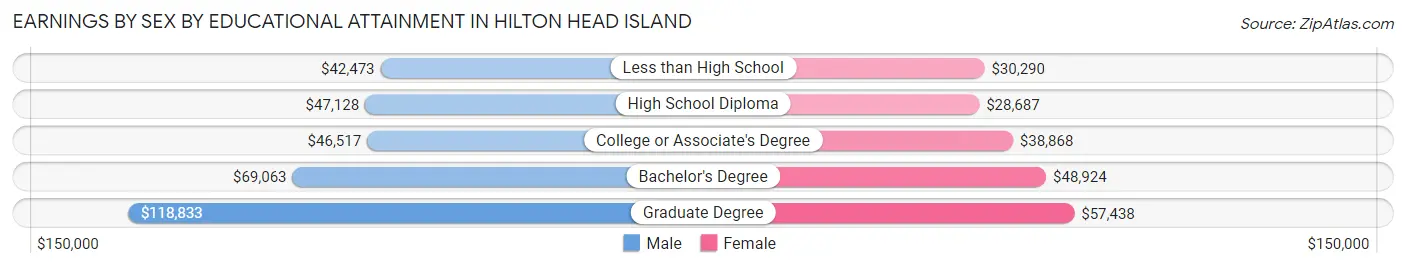
Earnings by Sex by Educational Attainment in Hilton Head Island
Average earnings in Hilton Head Island are $53,194 for men and $40,314 for women, a difference of 24.2%. Men with an educational attainment of graduate degree enjoy the highest average annual earnings of $118,833, while those with less than high school education earn the least with $42,473. Women with an educational attainment of graduate degree earn the most with the average annual earnings of $57,438, while those with high school diploma education have the smallest earnings of $28,687.
| Educational Attainment | Male Income | Female Income |
| Less than High School | $42,473 | $30,290 |
| High School Diploma | $47,128 | $28,687 |
| College or Associate's Degree | $46,517 | $38,868 |
| Bachelor's Degree | $69,063 | $48,924 |
| Graduate Degree | $118,833 | $57,438 |
| Total | $53,194 | $40,314 |
Family Income in Hilton Head Island
Family Income Brackets in Hilton Head Island
According to the Hilton Head Island family income data, there are 2,979 families falling into the $200,000+ income range, which is the most common income bracket and makes up 27.2% of all families. Conversely, the $10,000 to $14,999 income bracket is the least frequent group with only 66 families (0.6%) belonging to this category.
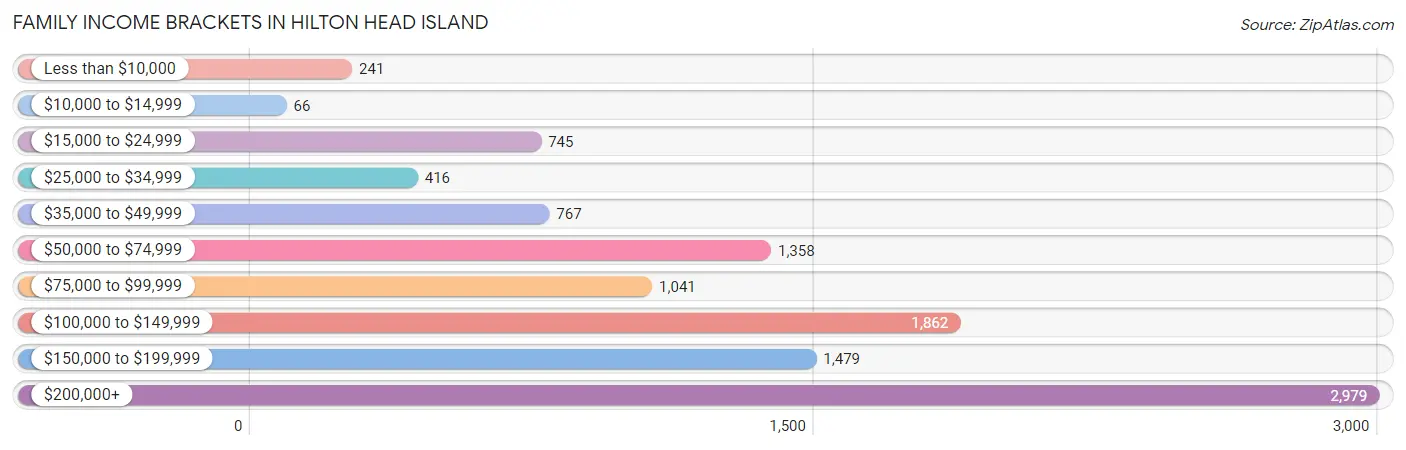
| Income Bracket | # Families | % Families |
| Less than $10,000 | 241 | 2.2% |
| $10,000 to $14,999 | 66 | 0.6% |
| $15,000 to $24,999 | 745 | 6.8% |
| $25,000 to $34,999 | 416 | 3.8% |
| $35,000 to $49,999 | 767 | 7.0% |
| $50,000 to $74,999 | 1,358 | 12.4% |
| $75,000 to $99,999 | 1,041 | 9.5% |
| $100,000 to $149,999 | 1,862 | 17.0% |
| $150,000 to $199,999 | 1,479 | 13.5% |
| $200,000+ | 2,979 | 27.2% |
Family Income by Famaliy Size in Hilton Head Island
7+ person families (136 | 1.2%) account for the highest median family income in Hilton Head Island with $250,001 per family, while 2-person families (7,966 | 72.7%) have the highest median income of $59,067 per family member.
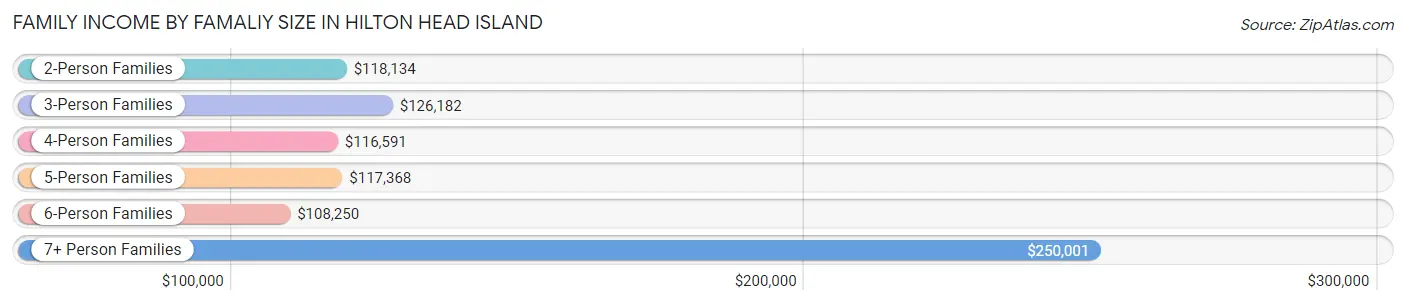
| Income Bracket | # Families | Median Income |
| 2-Person Families | 7,966 (72.7%) | $118,134 |
| 3-Person Families | 1,639 (15.0%) | $126,182 |
| 4-Person Families | 728 (6.7%) | $116,591 |
| 5-Person Families | 400 (3.6%) | $117,368 |
| 6-Person Families | 85 (0.8%) | $108,250 |
| 7+ Person Families | 136 (1.2%) | $250,001 |
| Total | 10,954 (100.0%) | $120,887 |
Family Income by Number of Earners in Hilton Head Island
The median family income in Hilton Head Island is $120,887, with families comprising 3+ earners (750) having the highest median family income of $179,853, while families with no earners (3,888) have the lowest median family income of $88,650, accounting for 6.9% and 35.5% of families, respectively.
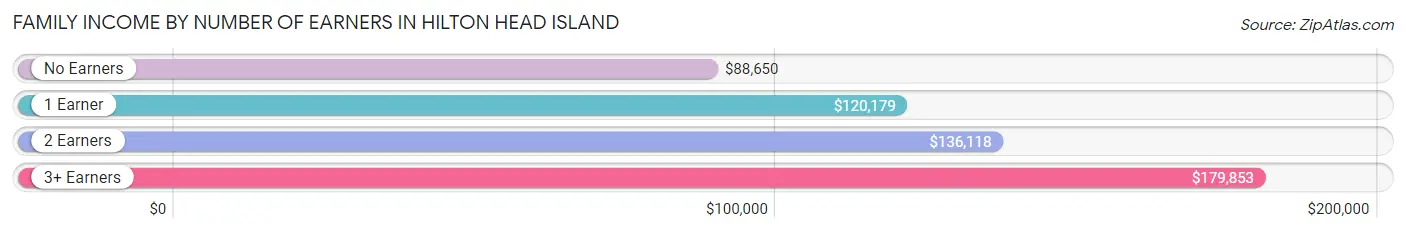
| Number of Earners | # Families | Median Income |
| No Earners | 3,888 (35.5%) | $88,650 |
| 1 Earner | 3,254 (29.7%) | $120,179 |
| 2 Earners | 3,062 (28.0%) | $136,118 |
| 3+ Earners | 750 (6.9%) | $179,853 |
| Total | 10,954 (100.0%) | $120,887 |
Household Income in Hilton Head Island
Household Income Brackets in Hilton Head Island
With 3,459 households falling in the category, the $200,000+ income range is the most frequent in Hilton Head Island, accounting for 20.2% of all households. In contrast, only 291 households (1.7%) fall into the $10,000 to $14,999 income bracket, making it the least populous group.
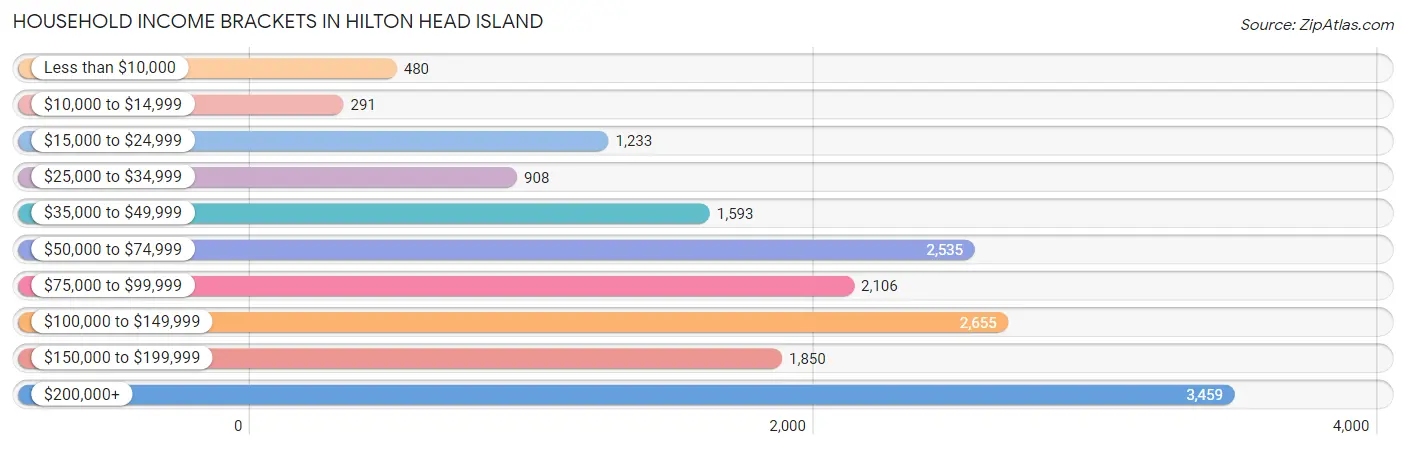
| Income Bracket | # Households | % Households |
| Less than $10,000 | 480 | 2.8% |
| $10,000 to $14,999 | 291 | 1.7% |
| $15,000 to $24,999 | 1,233 | 7.2% |
| $25,000 to $34,999 | 908 | 5.3% |
| $35,000 to $49,999 | 1,593 | 9.3% |
| $50,000 to $74,999 | 2,535 | 14.8% |
| $75,000 to $99,999 | 2,106 | 12.3% |
| $100,000 to $149,999 | 2,655 | 15.5% |
| $150,000 to $199,999 | 1,850 | 10.8% |
| $200,000+ | 3,459 | 20.2% |
Household Income by Householder Age in Hilton Head Island
The median household income in Hilton Head Island is $93,694, with the highest median household income of $108,182 found in the 45 to 64 years age bracket for the primary householder. A total of 5,760 households (33.6%) fall into this category. Meanwhile, the 15 to 24 years age bracket for the primary householder has the lowest median household income of $46,413, with 146 households (0.9%) in this group.
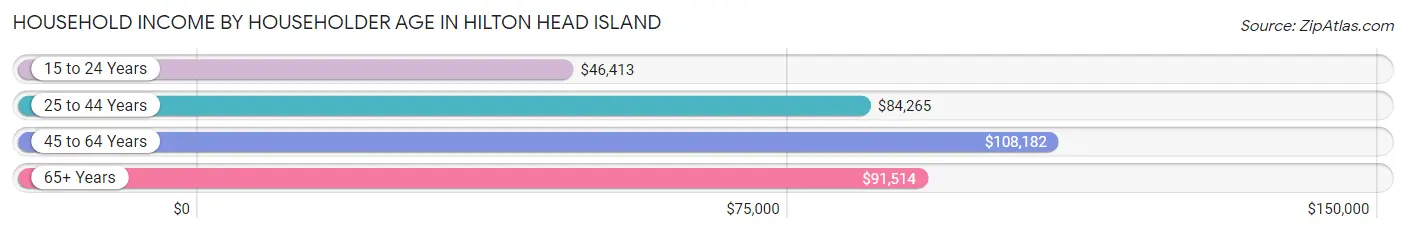
| Income Bracket | # Households | Median Income |
| 15 to 24 Years | 146 (0.9%) | $46,413 |
| 25 to 44 Years | 2,212 (12.9%) | $84,265 |
| 45 to 64 Years | 5,760 (33.6%) | $108,182 |
| 65+ Years | 9,008 (52.6%) | $91,514 |
| Total | 17,126 (100.0%) | $93,694 |
Poverty in Hilton Head Island
Income Below Poverty by Sex and Age in Hilton Head Island
With 7.7% poverty level for males and 7.6% for females among the residents of Hilton Head Island, 12 to 14 year old males and 5 year old females are the most vulnerable to poverty, with 145 males (30.7%) and 30 females (33.0%) in their respective age groups living below the poverty level.
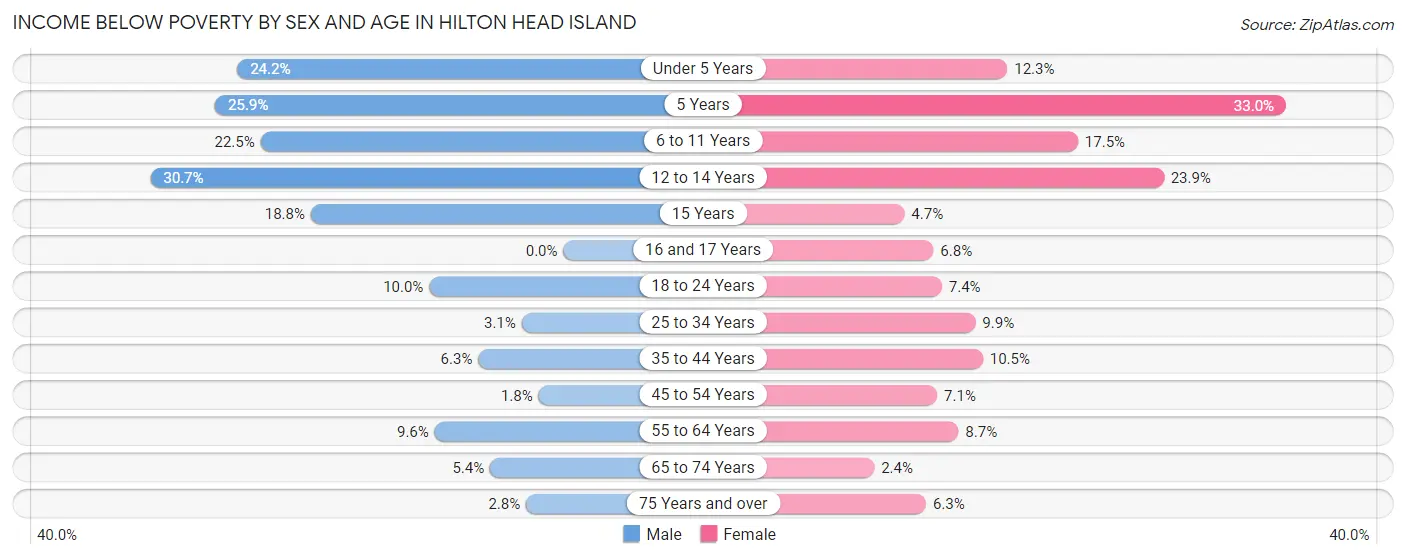
| Age Bracket | Male | Female |
| Under 5 Years | 160 (24.2%) | 29 (12.3%) |
| 5 Years | 30 (25.9%) | 30 (33.0%) |
| 6 to 11 Years | 203 (22.5%) | 105 (17.5%) |
| 12 to 14 Years | 145 (30.7%) | 98 (23.9%) |
| 15 Years | 9 (18.8%) | 6 (4.6%) |
| 16 and 17 Years | 0 (0.0%) | 28 (6.8%) |
| 18 to 24 Years | 99 (10.0%) | 43 (7.4%) |
| 25 to 34 Years | 53 (3.1%) | 158 (9.9%) |
| 35 to 44 Years | 101 (6.3%) | 143 (10.5%) |
| 45 to 54 Years | 33 (1.8%) | 147 (7.1%) |
| 55 to 64 Years | 325 (9.6%) | 300 (8.7%) |
| 65 to 74 Years | 197 (5.4%) | 98 (2.4%) |
| 75 Years and over | 89 (2.8%) | 231 (6.2%) |
| Total | 1,444 (7.7%) | 1,416 (7.6%) |
Income Above Poverty by Sex and Age in Hilton Head Island
According to the poverty statistics in Hilton Head Island, males aged 16 and 17 years and females aged 65 to 74 years are the age groups that are most secure financially, with 100.0% of males and 97.6% of females in these age groups living above the poverty line.
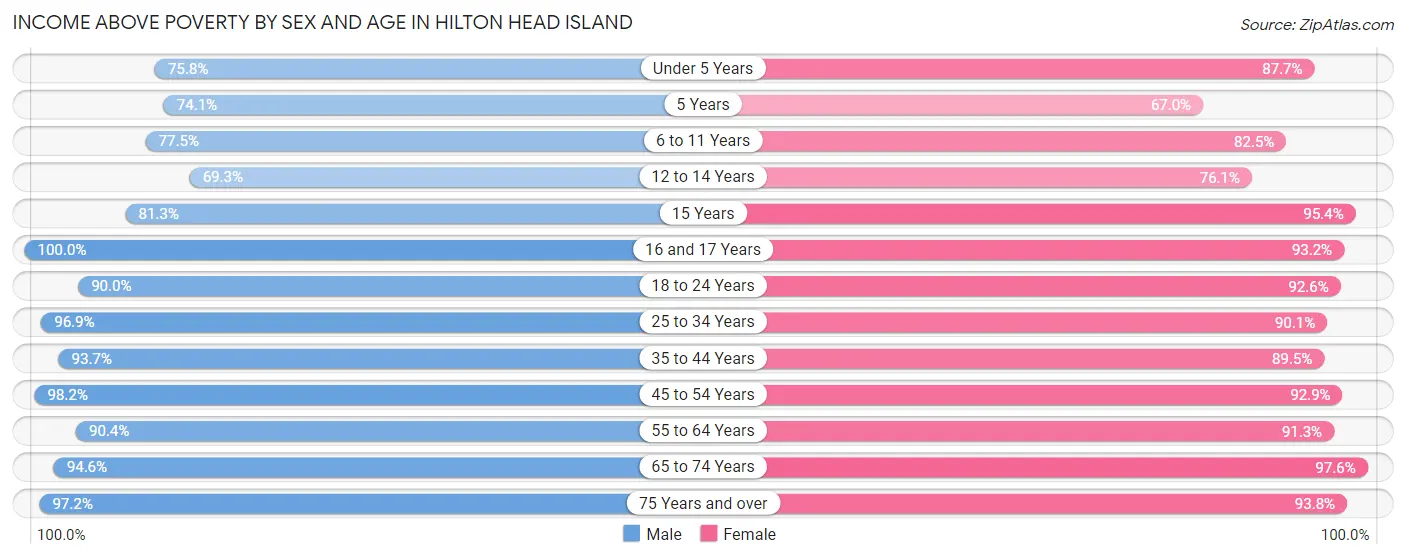
| Age Bracket | Male | Female |
| Under 5 Years | 501 (75.8%) | 207 (87.7%) |
| 5 Years | 86 (74.1%) | 61 (67.0%) |
| 6 to 11 Years | 700 (77.5%) | 494 (82.5%) |
| 12 to 14 Years | 328 (69.3%) | 312 (76.1%) |
| 15 Years | 39 (81.2%) | 123 (95.4%) |
| 16 and 17 Years | 229 (100.0%) | 384 (93.2%) |
| 18 to 24 Years | 895 (90.0%) | 536 (92.6%) |
| 25 to 34 Years | 1,655 (96.9%) | 1,434 (90.1%) |
| 35 to 44 Years | 1,498 (93.7%) | 1,223 (89.5%) |
| 45 to 54 Years | 1,764 (98.2%) | 1,929 (92.9%) |
| 55 to 64 Years | 3,073 (90.4%) | 3,163 (91.3%) |
| 65 to 74 Years | 3,424 (94.6%) | 3,969 (97.6%) |
| 75 Years and over | 3,128 (97.2%) | 3,467 (93.8%) |
| Total | 17,320 (92.3%) | 17,302 (92.4%) |
Income Below Poverty Among Married-Couple Families in Hilton Head Island
The poverty statistics for married-couple families in Hilton Head Island show that 2.6% or 253 of the total 9,549 families live below the poverty line. Families with 3 or 4 children have the highest poverty rate of 13.7%, comprising of 26 families. On the other hand, families with 5 or more children have the lowest poverty rate of 0.0%, which includes 0 families.
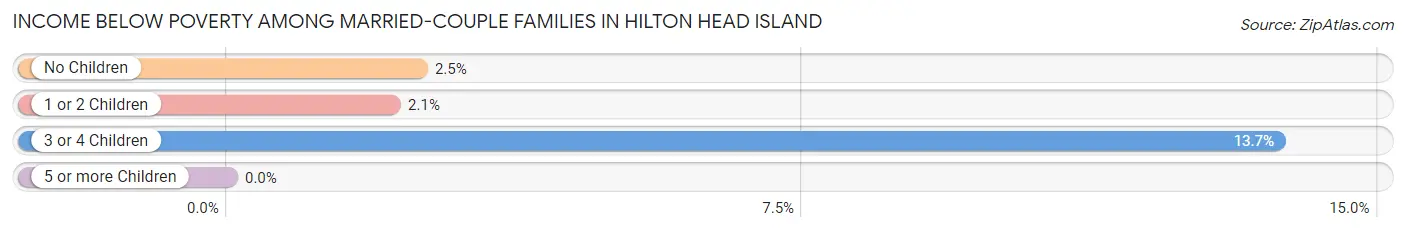
| Children | Above Poverty | Below Poverty |
| No Children | 7,917 (97.5%) | 201 (2.5%) |
| 1 or 2 Children | 1,194 (97.9%) | 26 (2.1%) |
| 3 or 4 Children | 164 (86.3%) | 26 (13.7%) |
| 5 or more Children | 21 (100.0%) | 0 (0.0%) |
| Total | 9,296 (97.4%) | 253 (2.6%) |
Income Below Poverty Among Single-Parent Households in Hilton Head Island
According to the poverty data in Hilton Head Island, 13.9% or 61 single-father households and 31.1% or 300 single-mother households are living below the poverty line. Among single-father households, those with 3 or 4 children have the highest poverty rate, with 30 households (100.0%) experiencing poverty. Likewise, among single-mother households, those with 3 or 4 children have the highest poverty rate, with 73 households (83.9%) falling below the poverty line.
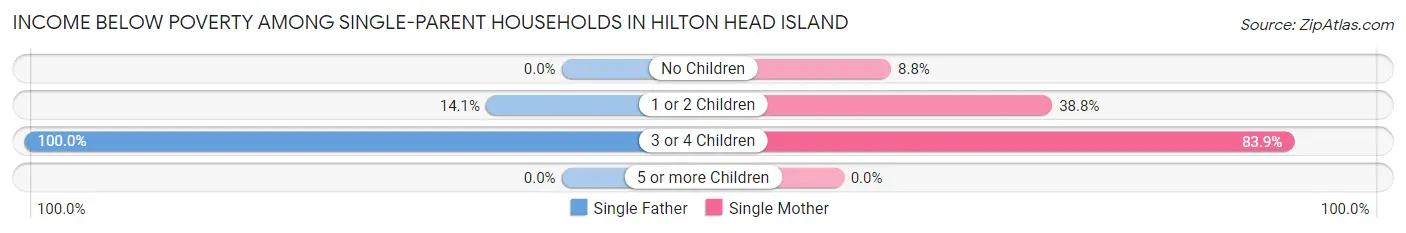
| Children | Single Father | Single Mother |
| No Children | 0 (0.0%) | 32 (8.8%) |
| 1 or 2 Children | 31 (14.1%) | 195 (38.8%) |
| 3 or 4 Children | 30 (100.0%) | 73 (83.9%) |
| 5 or more Children | 0 (0.0%) | 0 (0.0%) |
| Total | 61 (13.9%) | 300 (31.1%) |
Income Below Poverty Among Married-Couple vs Single-Parent Households in Hilton Head Island
The poverty data for Hilton Head Island shows that 253 of the married-couple family households (2.6%) and 361 of the single-parent households (25.7%) are living below the poverty level. Within the married-couple family households, those with 3 or 4 children have the highest poverty rate, with 26 households (13.7%) falling below the poverty line. Among the single-parent households, those with 3 or 4 children have the highest poverty rate, with 103 household (88.0%) living below poverty.
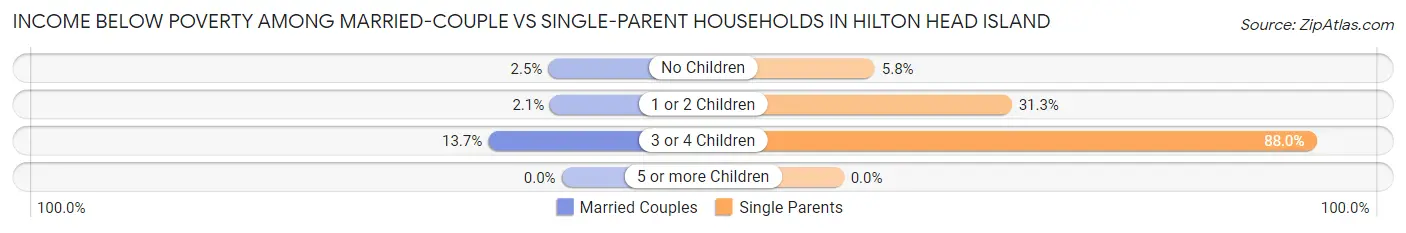
| Children | Married-Couple Families | Single-Parent Households |
| No Children | 201 (2.5%) | 32 (5.8%) |
| 1 or 2 Children | 26 (2.1%) | 226 (31.3%) |
| 3 or 4 Children | 26 (13.7%) | 103 (88.0%) |
| 5 or more Children | 0 (0.0%) | 0 (0.0%) |
| Total | 253 (2.6%) | 361 (25.7%) |
Race in Hilton Head Island
The most populous races in Hilton Head Island are White / Caucasian (29,579 | 78.4%), Hispanic or Latino (5,190 | 13.8%), and Some other Race (2,804 | 7.4%).
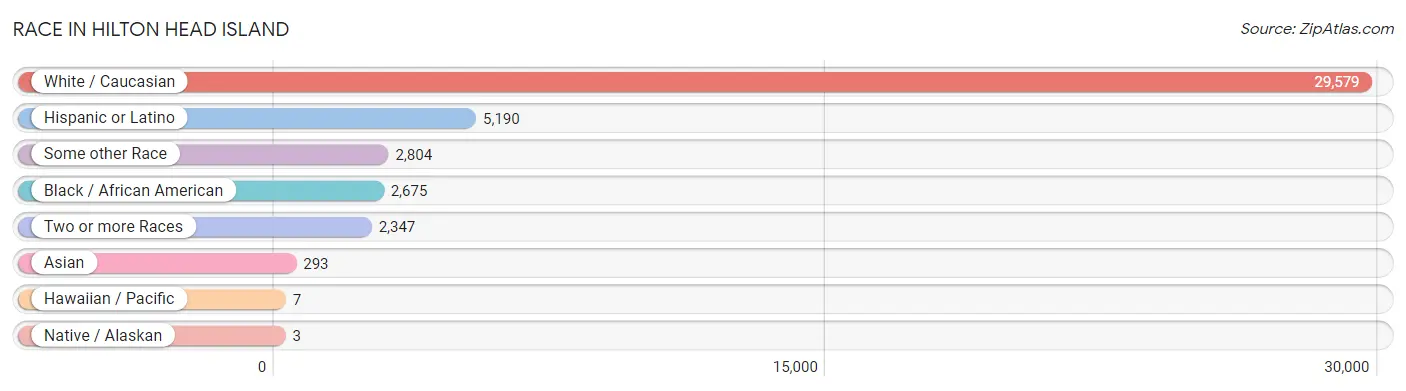
| Race | # Population | % Population |
| Asian | 293 | 0.8% |
| Black / African American | 2,675 | 7.1% |
| Hawaiian / Pacific | 7 | 0.0% |
| Hispanic or Latino | 5,190 | 13.8% |
| Native / Alaskan | 3 | 0.0% |
| White / Caucasian | 29,579 | 78.4% |
| Two or more Races | 2,347 | 6.2% |
| Some other Race | 2,804 | 7.4% |
| Total | 37,708 | 100.0% |
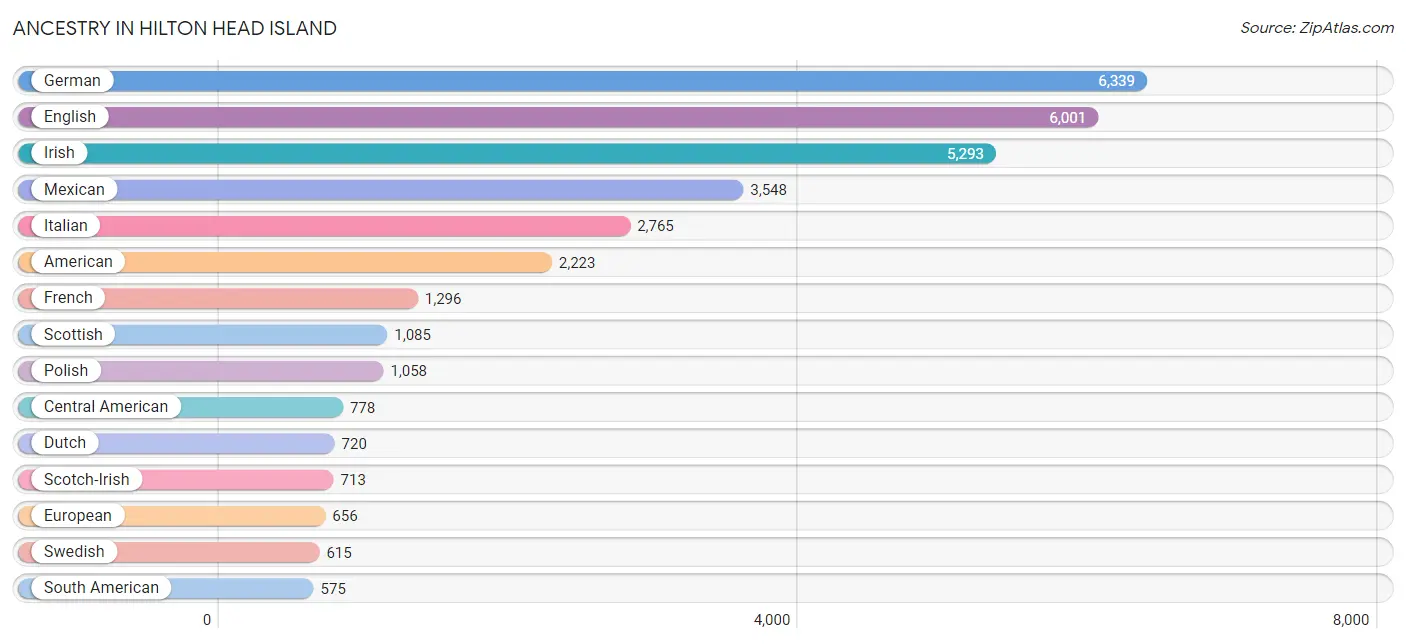
Ancestry in Hilton Head Island
The most populous ancestries reported in Hilton Head Island are German (6,339 | 16.8%), English (6,001 | 15.9%), Irish (5,293 | 14.0%), Mexican (3,548 | 9.4%), and Italian (2,765 | 7.3%), together accounting for 63.5% of all Hilton Head Island residents.
| Ancestry | # Population | % Population |
| African | 107 | 0.3% |
| Alsatian | 14 | 0.0% |
| American | 2,223 | 5.9% |
| Arab | 75 | 0.2% |
| Argentinean | 68 | 0.2% |
| Armenian | 108 | 0.3% |
| Australian | 5 | 0.0% |
| Austrian | 196 | 0.5% |
| Barbadian | 36 | 0.1% |
| Belgian | 24 | 0.1% |
| Bhutanese | 28 | 0.1% |
| Blackfeet | 4 | 0.0% |
| Bolivian | 18 | 0.1% |
| British | 267 | 0.7% |
| Canadian | 252 | 0.7% |
| Celtic | 20 | 0.1% |
| Central American | 778 | 2.1% |
| Cherokee | 449 | 1.2% |
| Chilean | 6 | 0.0% |
| Colombian | 296 | 0.8% |
| Costa Rican | 151 | 0.4% |
| Croatian | 85 | 0.2% |
| Cuban | 76 | 0.2% |
| Czech | 158 | 0.4% |
| Czechoslovakian | 68 | 0.2% |
| Danish | 109 | 0.3% |
| Delaware | 20 | 0.1% |
| Dominican | 7 | 0.0% |
| Dutch | 720 | 1.9% |
| Eastern European | 201 | 0.5% |
| English | 6,001 | 15.9% |
| European | 656 | 1.7% |
| Filipino | 16 | 0.0% |
| Finnish | 78 | 0.2% |
| French | 1,296 | 3.4% |
| French Canadian | 210 | 0.6% |
| German | 6,339 | 16.8% |
| Greek | 89 | 0.2% |
| Guamanian / Chamorro | 23 | 0.1% |
| Guatemalan | 102 | 0.3% |
| Guyanese | 47 | 0.1% |
| Honduran | 413 | 1.1% |
| Hungarian | 264 | 0.7% |
| Icelander | 24 | 0.1% |
| Indian (Asian) | 150 | 0.4% |
| Iranian | 13 | 0.0% |
| Irish | 5,293 | 14.0% |
| Italian | 2,765 | 7.3% |
| Jamaican | 49 | 0.1% |
| Korean | 74 | 0.2% |
| Latvian | 29 | 0.1% |
| Lebanese | 19 | 0.1% |
| Lithuanian | 105 | 0.3% |
| Macedonian | 37 | 0.1% |
| Mexican | 3,548 | 9.4% |
| Navajo | 3 | 0.0% |
| New Zealander | 19 | 0.1% |
| Nicaraguan | 84 | 0.2% |
| Northern European | 34 | 0.1% |
| Norwegian | 343 | 0.9% |
| Pakistani | 31 | 0.1% |
| Pennsylvania German | 15 | 0.0% |
| Peruvian | 27 | 0.1% |
| Polish | 1,058 | 2.8% |
| Portuguese | 67 | 0.2% |
| Puerto Rican | 137 | 0.4% |
| Russian | 281 | 0.7% |
| Salvadoran | 28 | 0.1% |
| Scandinavian | 222 | 0.6% |
| Scotch-Irish | 713 | 1.9% |
| Scottish | 1,085 | 2.9% |
| Seminole | 4 | 0.0% |
| Serbian | 19 | 0.1% |
| Slavic | 43 | 0.1% |
| Slovak | 127 | 0.3% |
| Slovene | 46 | 0.1% |
| South African | 21 | 0.1% |
| South American | 575 | 1.5% |
| Spaniard | 29 | 0.1% |
| Spanish | 31 | 0.1% |
| Sri Lankan | 50 | 0.1% |
| Subsaharan African | 128 | 0.3% |
| Swedish | 615 | 1.6% |
| Swiss | 167 | 0.4% |
| Thai | 31 | 0.1% |
| Ukrainian | 186 | 0.5% |
| Uruguayan | 87 | 0.2% |
| Venezuelan | 73 | 0.2% |
| Welsh | 258 | 0.7% |
| Yugoslavian | 40 | 0.1% | View All 90 Rows |
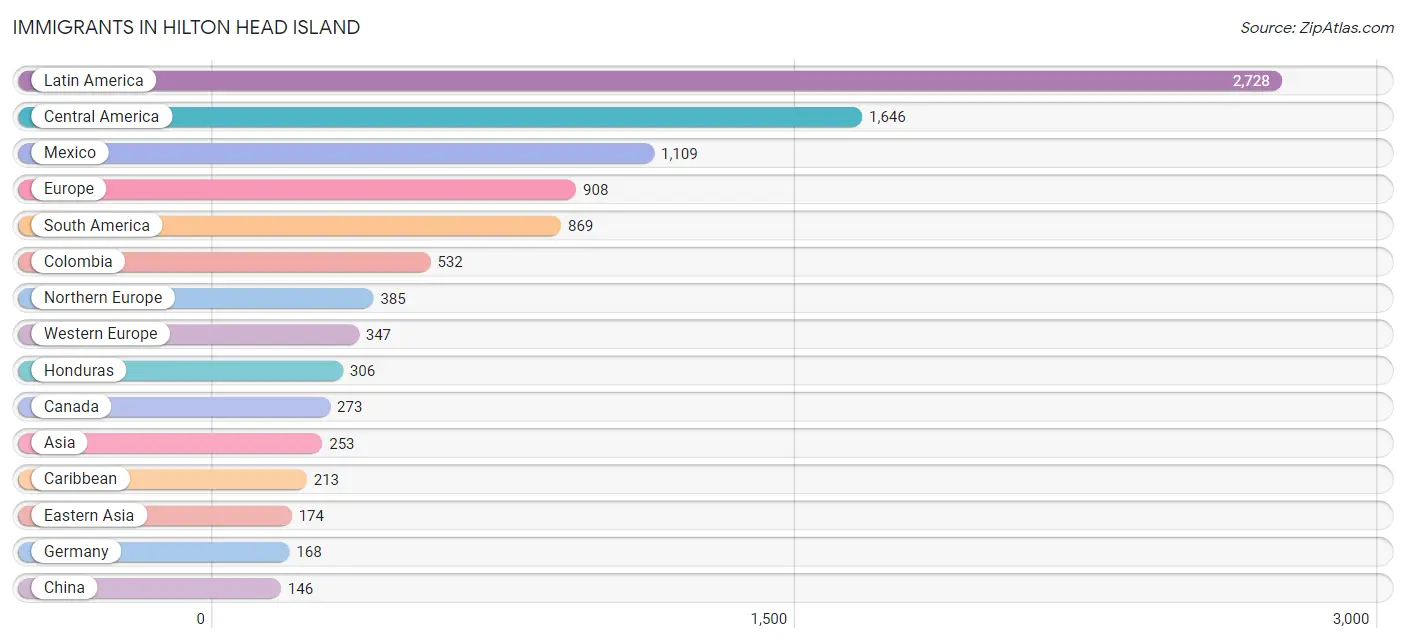
Immigrants in Hilton Head Island
The most numerous immigrant groups reported in Hilton Head Island came from Latin America (2,728 | 7.2%), Central America (1,646 | 4.4%), Mexico (1,109 | 2.9%), Europe (908 | 2.4%), and South America (869 | 2.3%), together accounting for 19.3% of all Hilton Head Island residents.
| Immigration Origin | # Population | % Population |
| Africa | 104 | 0.3% |
| Argentina | 62 | 0.2% |
| Asia | 253 | 0.7% |
| Austria | 49 | 0.1% |
| Barbados | 36 | 0.1% |
| Belgium | 2 | 0.0% |
| Bolivia | 89 | 0.2% |
| Canada | 273 | 0.7% |
| Caribbean | 213 | 0.6% |
| Central America | 1,646 | 4.4% |
| Chile | 6 | 0.0% |
| China | 146 | 0.4% |
| Colombia | 532 | 1.4% |
| Costa Rica | 17 | 0.1% |
| Croatia | 8 | 0.0% |
| Cuba | 44 | 0.1% |
| Czechoslovakia | 23 | 0.1% |
| Denmark | 4 | 0.0% |
| Dominican Republic | 7 | 0.0% |
| Eastern Africa | 9 | 0.0% |
| Eastern Asia | 174 | 0.5% |
| Eastern Europe | 126 | 0.3% |
| Egypt | 6 | 0.0% |
| El Salvador | 6 | 0.0% |
| England | 90 | 0.2% |
| Europe | 908 | 2.4% |
| France | 25 | 0.1% |
| Germany | 168 | 0.4% |
| Greece | 10 | 0.0% |
| Guatemala | 76 | 0.2% |
| Honduras | 306 | 0.8% |
| Hungary | 17 | 0.1% |
| Indonesia | 9 | 0.0% |
| Iran | 20 | 0.1% |
| Italy | 16 | 0.0% |
| Jamaica | 126 | 0.3% |
| Japan | 15 | 0.0% |
| Korea | 13 | 0.0% |
| Latin America | 2,728 | 7.2% |
| Lithuania | 8 | 0.0% |
| Mexico | 1,109 | 2.9% |
| Netherlands | 103 | 0.3% |
| Nicaragua | 51 | 0.1% |
| Nigeria | 22 | 0.1% |
| Northern Africa | 6 | 0.0% |
| Northern Europe | 385 | 1.0% |
| Oceania | 21 | 0.1% |
| Panama | 81 | 0.2% |
| Peru | 14 | 0.0% |
| Philippines | 20 | 0.1% |
| Portugal | 14 | 0.0% |
| Russia | 18 | 0.1% |
| Scotland | 30 | 0.1% |
| Serbia | 9 | 0.0% |
| Singapore | 12 | 0.0% |
| South Africa | 58 | 0.2% |
| South America | 869 | 2.3% |
| South Central Asia | 20 | 0.1% |
| South Eastern Asia | 59 | 0.2% |
| Southern Europe | 40 | 0.1% |
| Sweden | 42 | 0.1% |
| Taiwan | 24 | 0.1% |
| Thailand | 10 | 0.0% |
| Uruguay | 87 | 0.2% |
| Venezuela | 79 | 0.2% |
| Vietnam | 8 | 0.0% |
| Western Africa | 22 | 0.1% |
| Western Europe | 347 | 0.9% |
| Zimbabwe | 9 | 0.0% | View All 69 Rows |
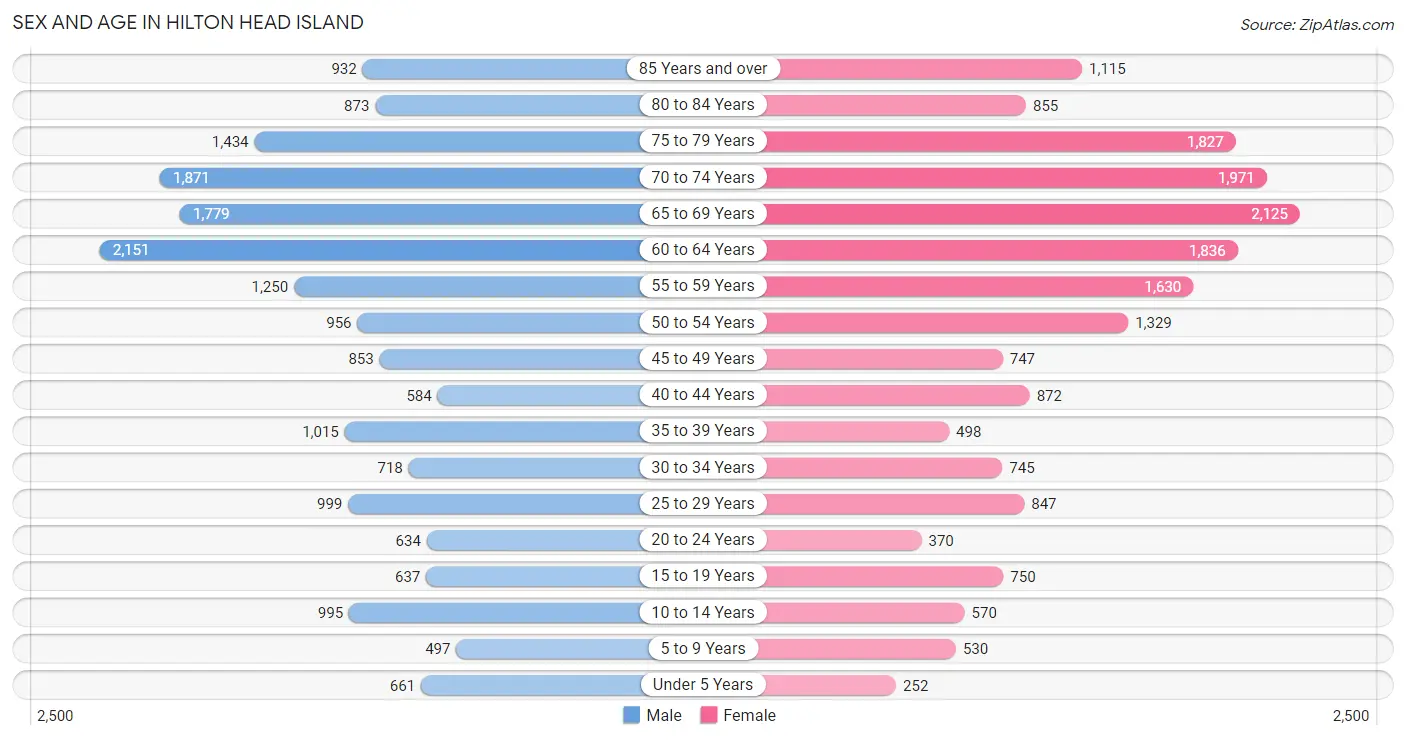
Sex and Age in Hilton Head Island
Sex and Age in Hilton Head Island
The most populous age groups in Hilton Head Island are 60 to 64 Years (2,151 | 11.4%) for men and 65 to 69 Years (2,125 | 11.3%) for women.
| Age Bracket | Male | Female |
| Under 5 Years | 661 (3.5%) | 252 (1.3%) |
| 5 to 9 Years | 497 (2.6%) | 530 (2.8%) |
| 10 to 14 Years | 995 (5.3%) | 570 (3.0%) |
| 15 to 19 Years | 637 (3.4%) | 750 (4.0%) |
| 20 to 24 Years | 634 (3.4%) | 370 (2.0%) |
| 25 to 29 Years | 999 (5.3%) | 847 (4.5%) |
| 30 to 34 Years | 718 (3.8%) | 745 (4.0%) |
| 35 to 39 Years | 1,015 (5.4%) | 498 (2.6%) |
| 40 to 44 Years | 584 (3.1%) | 872 (4.6%) |
| 45 to 49 Years | 853 (4.5%) | 747 (4.0%) |
| 50 to 54 Years | 956 (5.1%) | 1,329 (7.0%) |
| 55 to 59 Years | 1,250 (6.6%) | 1,630 (8.6%) |
| 60 to 64 Years | 2,151 (11.4%) | 1,836 (9.7%) |
| 65 to 69 Years | 1,779 (9.4%) | 2,125 (11.3%) |
| 70 to 74 Years | 1,871 (9.9%) | 1,971 (10.4%) |
| 75 to 79 Years | 1,434 (7.6%) | 1,827 (9.7%) |
| 80 to 84 Years | 873 (4.6%) | 855 (4.5%) |
| 85 Years and over | 932 (5.0%) | 1,115 (5.9%) |
| Total | 18,839 (100.0%) | 18,869 (100.0%) |
Families and Households in Hilton Head Island
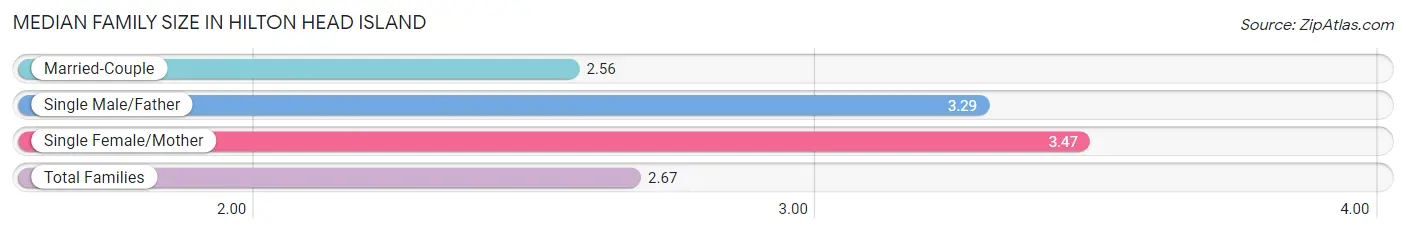
Median Family Size in Hilton Head Island
The median family size in Hilton Head Island is 2.67 persons per family, with single female/mother families (965 | 8.8%) accounting for the largest median family size of 3.47 persons per family. On the other hand, married-couple families (9,549 | 87.2%) represent the smallest median family size with 2.56 persons per family.
| Family Type | # Families | Family Size |
| Married-Couple | 9,549 (87.2%) | 2.56 |
| Single Male/Father | 440 (4.0%) | 3.29 |
| Single Female/Mother | 965 (8.8%) | 3.47 |
| Total Families | 10,954 (100.0%) | 2.67 |
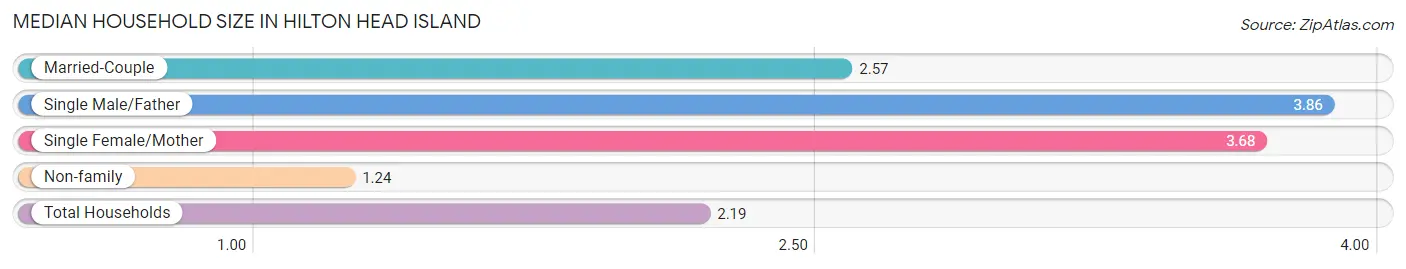
Median Household Size in Hilton Head Island
The median household size in Hilton Head Island is 2.19 persons per household, with single male/father households (440 | 2.6%) accounting for the largest median household size of 3.86 persons per household. non-family households (6,172 | 36.0%) represent the smallest median household size with 1.24 persons per household.
| Household Type | # Households | Household Size |
| Married-Couple | 9,549 (55.8%) | 2.57 |
| Single Male/Father | 440 (2.6%) | 3.86 |
| Single Female/Mother | 965 (5.6%) | 3.68 |
| Non-family | 6,172 (36.0%) | 1.24 |
| Total Households | 17,126 (100.0%) | 2.19 |
Household Size by Marriage Status in Hilton Head Island
Out of a total of 17,126 households in Hilton Head Island, 10,954 (64.0%) are family households, while 6,172 (36.0%) are nonfamily households. The most numerous type of family households are 2-person households, comprising 7,871, and the most common type of nonfamily households are 1-person households, comprising 5,045.
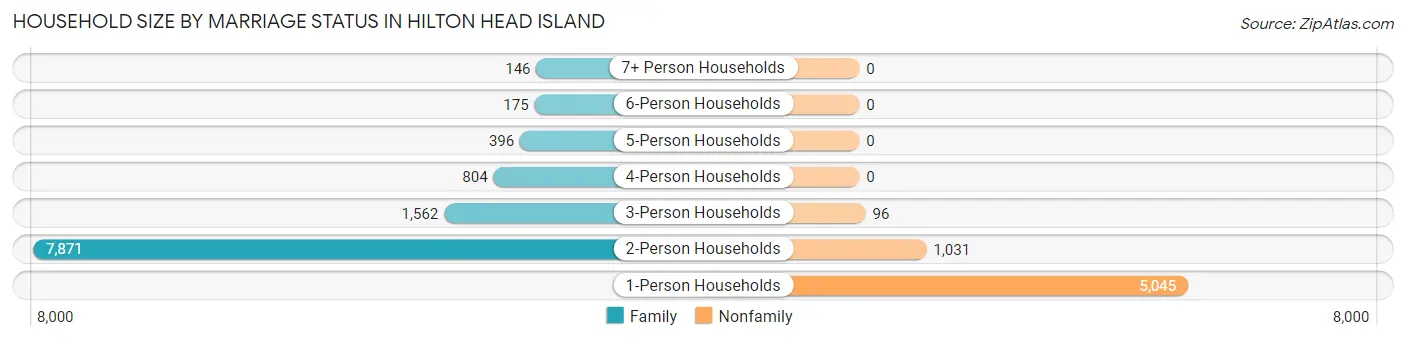
| Household Size | Family Households | Nonfamily Households |
| 1-Person Households | - | 5,045 (29.5%) |
| 2-Person Households | 7,871 (46.0%) | 1,031 (6.0%) |
| 3-Person Households | 1,562 (9.1%) | 96 (0.6%) |
| 4-Person Households | 804 (4.7%) | 0 (0.0%) |
| 5-Person Households | 396 (2.3%) | 0 (0.0%) |
| 6-Person Households | 175 (1.0%) | 0 (0.0%) |
| 7+ Person Households | 146 (0.9%) | 0 (0.0%) |
| Total | 10,954 (64.0%) | 6,172 (36.0%) |
Female Fertility in Hilton Head Island
Fertility by Age in Hilton Head Island
Average fertility rate in Hilton Head Island is 26.0 births per 1,000 women. Women in the age bracket of 35 to 50 years have the highest fertility rate with 32.0 births per 1,000 women. Women in the age bracket of 35 to 50 years acount for 57.0% of all women with births.
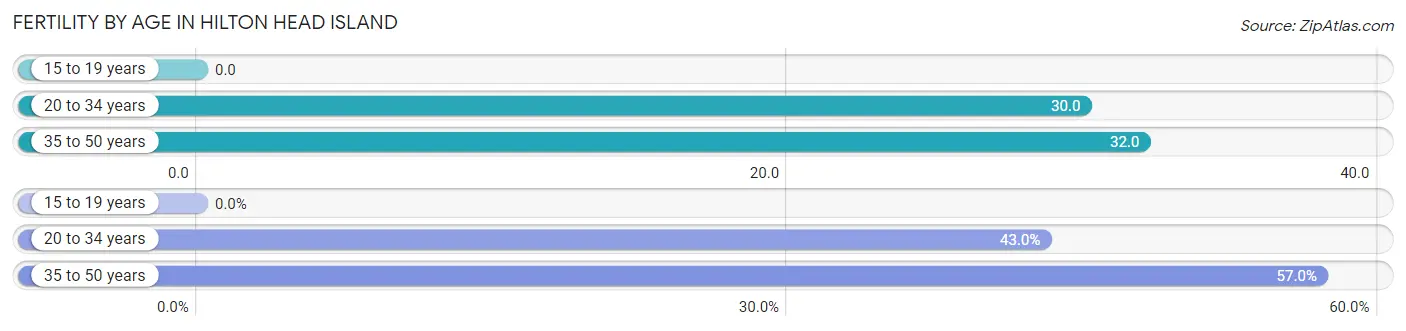
| Age Bracket | Women with Births | Births / 1,000 Women |
| 15 to 19 years | 0 (0.0%) | 0.0 |
| 20 to 34 years | 58 (43.0%) | 30.0 |
| 35 to 50 years | 77 (57.0%) | 32.0 |
| Total | 135 (100.0%) | 26.0 |
Fertility by Age by Marriage Status in Hilton Head Island
75.6% of women with births (135) in Hilton Head Island are married. The highest percentage of unmarried women with births falls into 20 to 34 years age bracket with 56.9% of them unmarried at the time of birth, while the lowest percentage of unmarried women with births belong to 35 to 50 years age bracket with 0.0% of them unmarried.
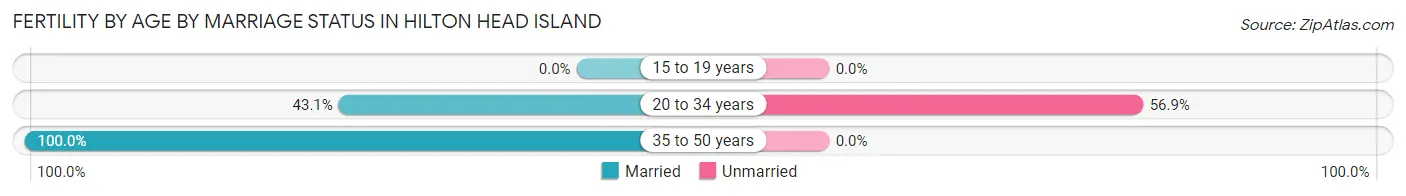
| Age Bracket | Married | Unmarried |
| 15 to 19 years | 0 (0.0%) | 0 (0.0%) |
| 20 to 34 years | 25 (43.1%) | 33 (56.9%) |
| 35 to 50 years | 77 (100.0%) | 0 (0.0%) |
| Total | 102 (75.6%) | 33 (24.4%) |
Fertility by Education in Hilton Head Island
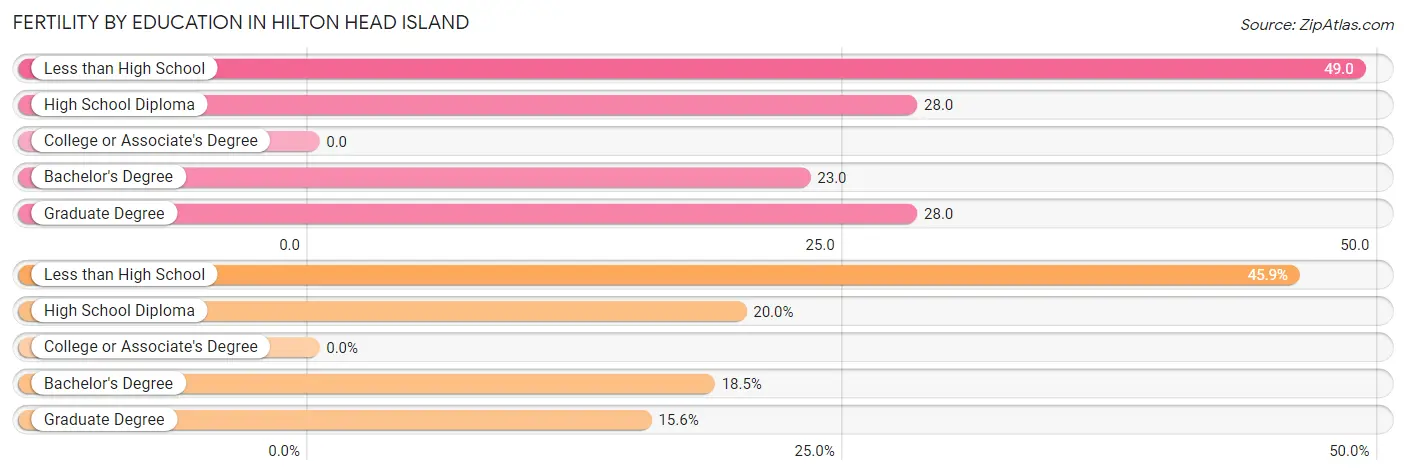
| Educational Attainment | Women with Births | Births / 1,000 Women |
| Less than High School | 62 (45.9%) | 49.0 |
| High School Diploma | 27 (20.0%) | 28.0 |
| College or Associate's Degree | 0 (0.0%) | 0.0 |
| Bachelor's Degree | 25 (18.5%) | 23.0 |
| Graduate Degree | 21 (15.6%) | 28.0 |
| Total | 135 (100.0%) | 26.0 |
Fertility by Education by Marriage Status in Hilton Head Island
24.4% of women with births in Hilton Head Island are unmarried. Women with the educational attainment of less than high school are most likely to be married with 100.0% of them married at childbirth, while women with the educational attainment of high school diploma are least likely to be married with 100.0% of them unmarried at childbirth.
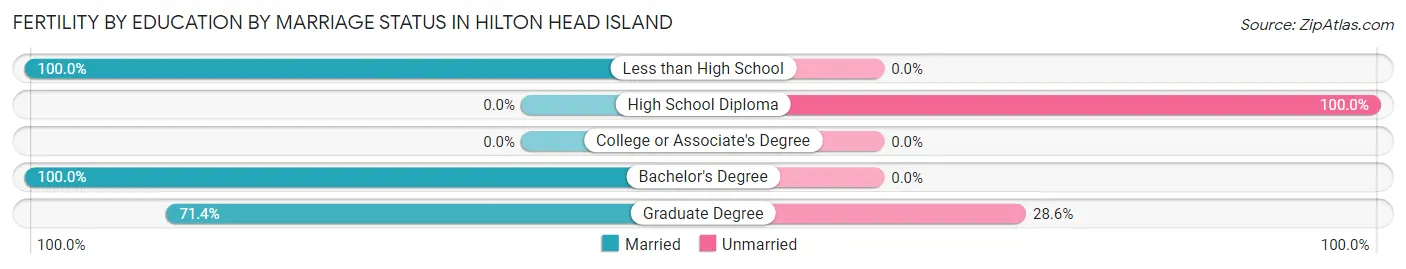
| Educational Attainment | Married | Unmarried |
| Less than High School | 62 (100.0%) | 0 (0.0%) |
| High School Diploma | 0 (0.0%) | 27 (100.0%) |
| College or Associate's Degree | 0 (0.0%) | 0 (0.0%) |
| Bachelor's Degree | 25 (100.0%) | 0 (0.0%) |
| Graduate Degree | 15 (71.4%) | 6 (28.6%) |
| Total | 102 (75.6%) | 33 (24.4%) |
Employment Characteristics in Hilton Head Island
Employment by Class of Employer in Hilton Head Island
Among the 15,753 employed individuals in Hilton Head Island, private company employees (10,973 | 69.7%), self-employed (incorporated) (1,496 | 9.5%), and self-employed (not incorporated) (1,172 | 7.4%) make up the most common classes of employment.
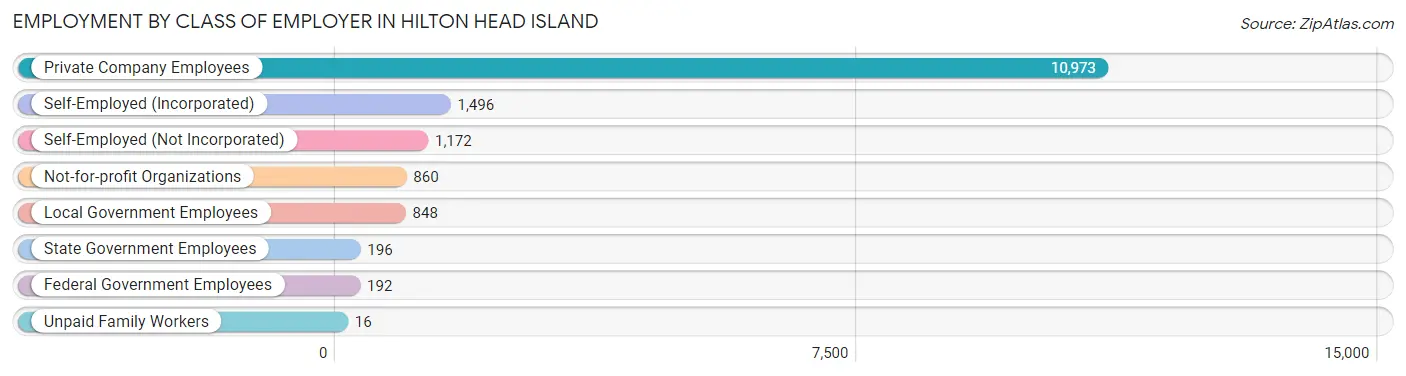
| Employer Class | # Employees | % Employees |
| Private Company Employees | 10,973 | 69.7% |
| Self-Employed (Incorporated) | 1,496 | 9.5% |
| Self-Employed (Not Incorporated) | 1,172 | 7.4% |
| Not-for-profit Organizations | 860 | 5.5% |
| Local Government Employees | 848 | 5.4% |
| State Government Employees | 196 | 1.2% |
| Federal Government Employees | 192 | 1.2% |
| Unpaid Family Workers | 16 | 0.1% |
| Total | 15,753 | 100.0% |
Employment Status by Age in Hilton Head Island
According to the labor force statistics for Hilton Head Island, out of the total population over 16 years of age (34,026), 48.1% or 16,367 individuals are in the labor force, with 2.8% or 458 of them unemployed. The age group with the highest labor force participation rate is 20 to 24 years, with 89.9% or 903 individuals in the labor force. Within the labor force, the 16 to 19 years age range has the highest percentage of unemployed individuals, with 8.3% or 48 of them being unemployed.
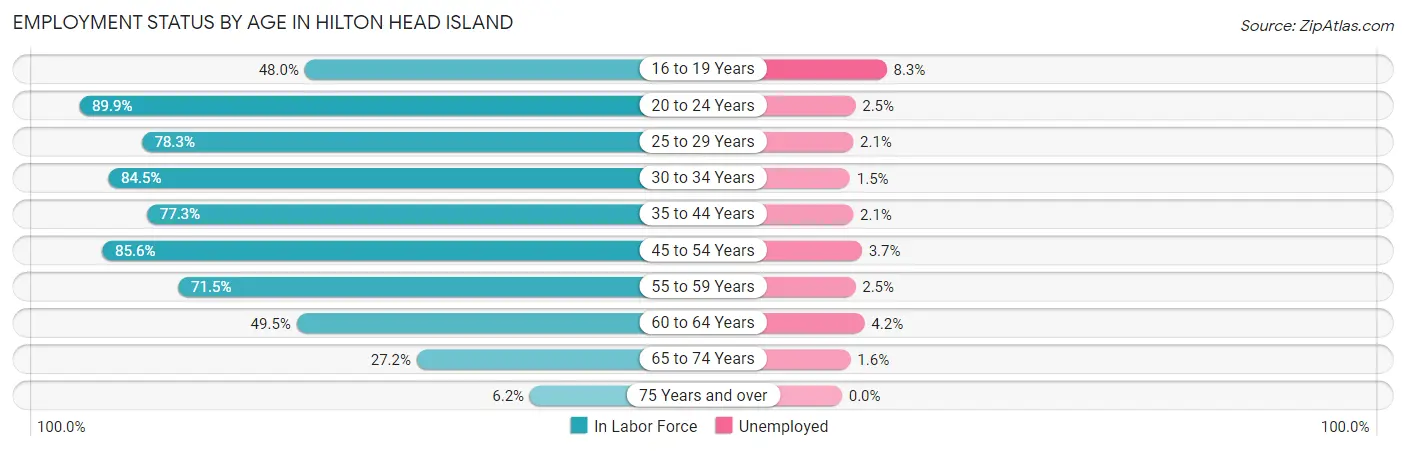
| Age Bracket | In Labor Force | Unemployed |
| 16 to 19 Years | 581 (48.0%) | 48 (8.3%) |
| 20 to 24 Years | 903 (89.9%) | 23 (2.5%) |
| 25 to 29 Years | 1,445 (78.3%) | 30 (2.1%) |
| 30 to 34 Years | 1,236 (84.5%) | 19 (1.5%) |
| 35 to 44 Years | 2,295 (77.3%) | 48 (2.1%) |
| 45 to 54 Years | 3,326 (85.6%) | 123 (3.7%) |
| 55 to 59 Years | 2,059 (71.5%) | 51 (2.5%) |
| 60 to 64 Years | 1,974 (49.5%) | 83 (4.2%) |
| 65 to 74 Years | 2,107 (27.2%) | 34 (1.6%) |
| 75 Years and over | 436 (6.2%) | 0 (0.0%) |
| Total | 16,367 (48.1%) | 458 (2.8%) |
Employment Status by Educational Attainment in Hilton Head Island
According to labor force statistics for Hilton Head Island, 72.4% of individuals (12,330) out of the total population between 25 and 64 years of age (17,030) are in the labor force, with 2.9% or 358 of them being unemployed. The group with the highest labor force participation rate are those with the educational attainment of college / associate degree, with 78.7% or 2,601 individuals in the labor force. Within the labor force, individuals with less than high school education have the highest percentage of unemployment, with 4.5% or 50 of them being unemployed.
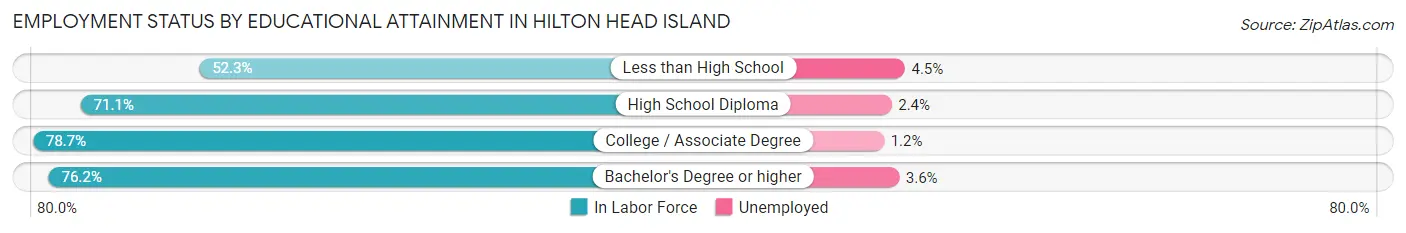
| Educational Attainment | In Labor Force | Unemployed |
| Less than High School | 1,106 (52.3%) | 95 (4.5%) |
| High School Diploma | 3,031 (71.1%) | 102 (2.4%) |
| College / Associate Degree | 2,601 (78.7%) | 40 (1.2%) |
| Bachelor's Degree or higher | 5,598 (76.2%) | 264 (3.6%) |
| Total | 12,330 (72.4%) | 494 (2.9%) |
Employment Occupations by Sex in Hilton Head Island
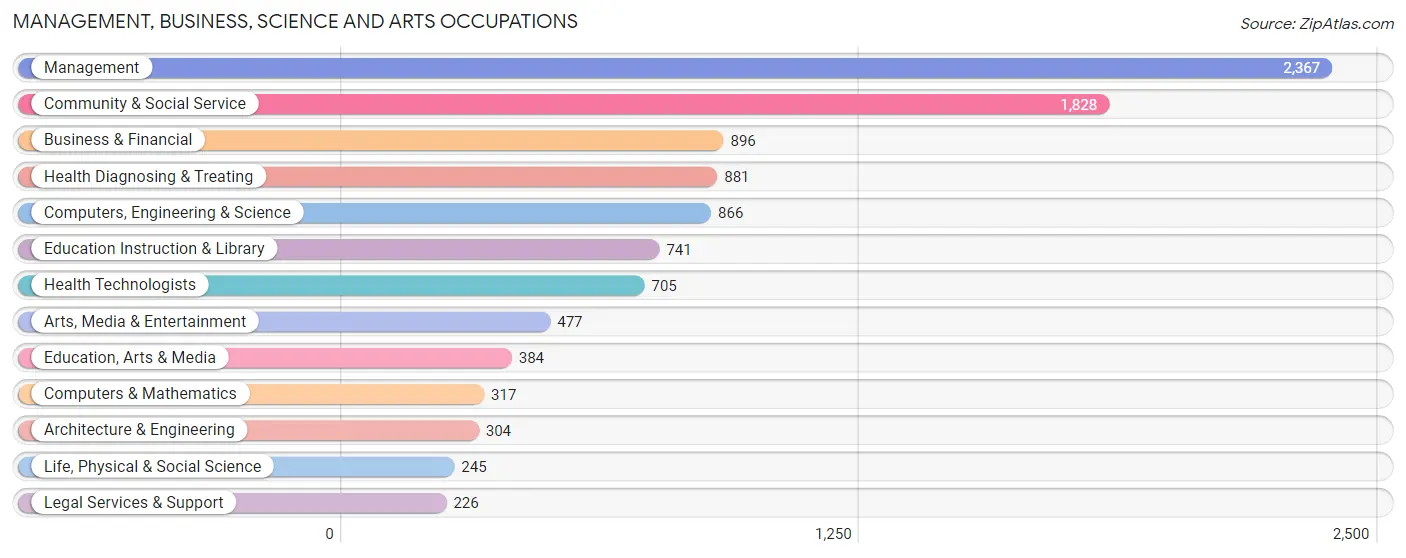
Management, Business, Science and Arts Occupations
The most common Management, Business, Science and Arts occupations in Hilton Head Island are Management (2,367 | 14.9%), Community & Social Service (1,828 | 11.5%), Business & Financial (896 | 5.6%), Health Diagnosing & Treating (881 | 5.6%), and Computers, Engineering & Science (866 | 5.4%).
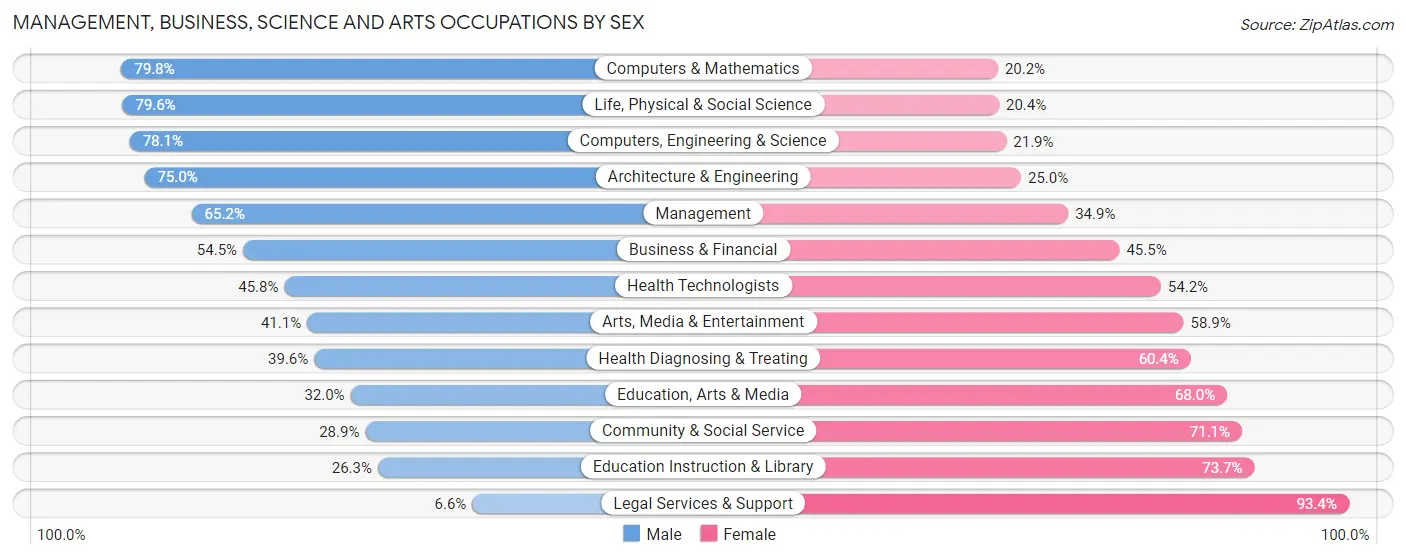
Management, Business, Science and Arts Occupations by Sex
Within the Management, Business, Science and Arts occupations in Hilton Head Island, the most male-oriented occupations are Computers & Mathematics (79.8%), Life, Physical & Social Science (79.6%), and Computers, Engineering & Science (78.1%), while the most female-oriented occupations are Legal Services & Support (93.4%), Education Instruction & Library (73.7%), and Community & Social Service (71.1%).
| Occupation | Male | Female |
| Management | 1,542 (65.1%) | 825 (34.8%) |
| Business & Financial | 488 (54.5%) | 408 (45.5%) |
| Computers, Engineering & Science | 676 (78.1%) | 190 (21.9%) |
| Computers & Mathematics | 253 (79.8%) | 64 (20.2%) |
| Architecture & Engineering | 228 (75.0%) | 76 (25.0%) |
| Life, Physical & Social Science | 195 (79.6%) | 50 (20.4%) |
| Community & Social Service | 529 (28.9%) | 1,299 (71.1%) |
| Education, Arts & Media | 123 (32.0%) | 261 (68.0%) |
| Legal Services & Support | 15 (6.6%) | 211 (93.4%) |
| Education Instruction & Library | 195 (26.3%) | 546 (73.7%) |
| Arts, Media & Entertainment | 196 (41.1%) | 281 (58.9%) |
| Health Diagnosing & Treating | 349 (39.6%) | 532 (60.4%) |
| Health Technologists | 323 (45.8%) | 382 (54.2%) |
| Total (Category) | 3,584 (52.4%) | 3,254 (47.6%) |
| Total (Overall) | 8,814 (55.5%) | 7,064 (44.5%) |
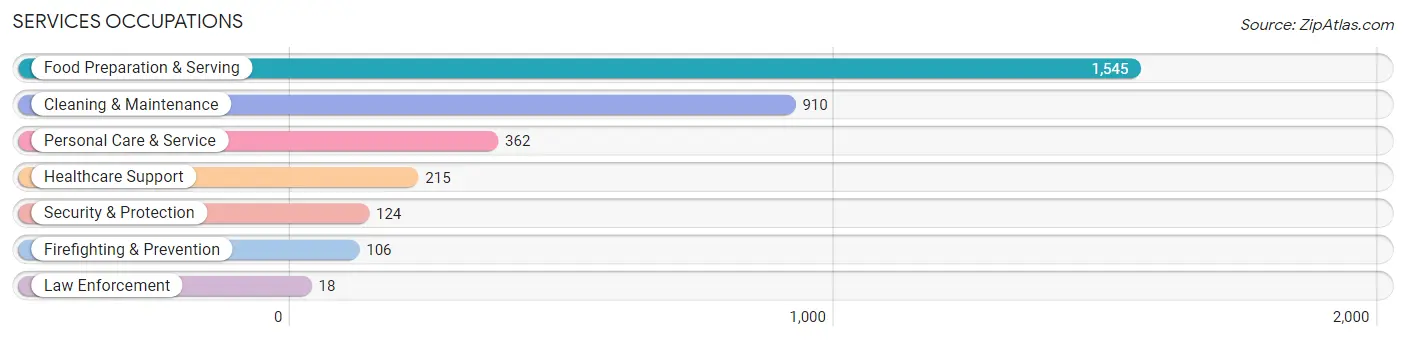
Services Occupations
The most common Services occupations in Hilton Head Island are Food Preparation & Serving (1,545 | 9.7%), Cleaning & Maintenance (910 | 5.7%), Personal Care & Service (362 | 2.3%), Healthcare Support (215 | 1.3%), and Security & Protection (124 | 0.8%).
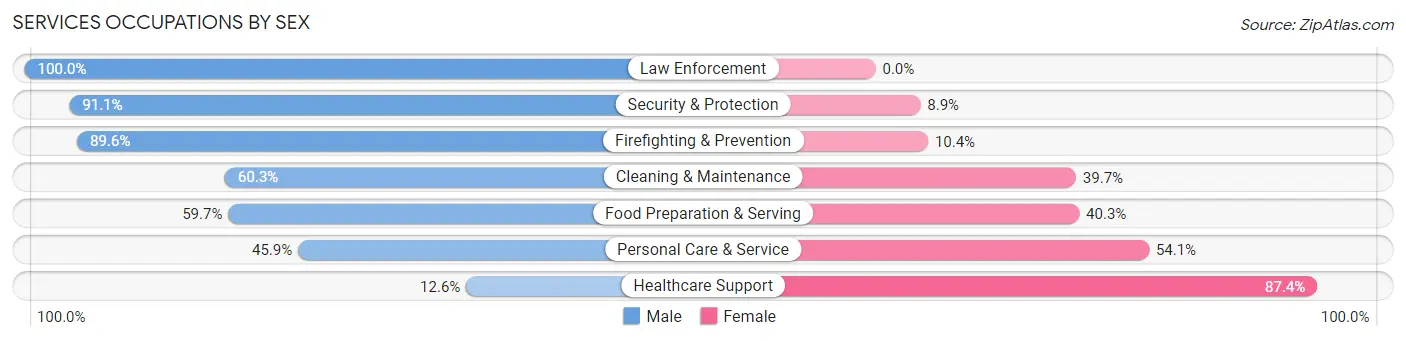
Services Occupations by Sex
Within the Services occupations in Hilton Head Island, the most male-oriented occupations are Law Enforcement (100.0%), Security & Protection (91.1%), and Firefighting & Prevention (89.6%), while the most female-oriented occupations are Healthcare Support (87.4%), Personal Care & Service (54.1%), and Food Preparation & Serving (40.3%).
| Occupation | Male | Female |
| Healthcare Support | 27 (12.6%) | 188 (87.4%) |
| Security & Protection | 113 (91.1%) | 11 (8.9%) |
| Firefighting & Prevention | 95 (89.6%) | 11 (10.4%) |
| Law Enforcement | 18 (100.0%) | 0 (0.0%) |
| Food Preparation & Serving | 922 (59.7%) | 623 (40.3%) |
| Cleaning & Maintenance | 549 (60.3%) | 361 (39.7%) |
| Personal Care & Service | 166 (45.9%) | 196 (54.1%) |
| Total (Category) | 1,777 (56.3%) | 1,379 (43.7%) |
| Total (Overall) | 8,814 (55.5%) | 7,064 (44.5%) |
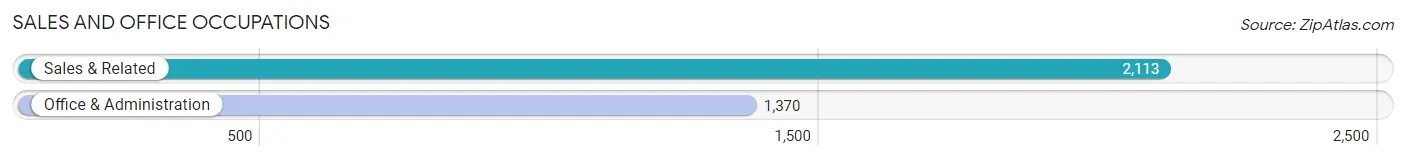
Sales and Office Occupations
The most common Sales and Office occupations in Hilton Head Island are Sales & Related (2,113 | 13.3%), and Office & Administration (1,370 | 8.6%).
Sales and Office Occupations by Sex
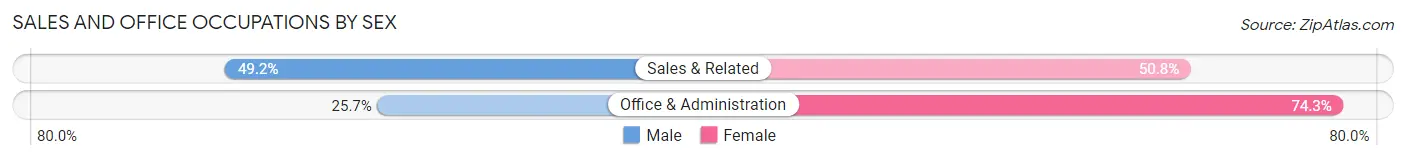
| Occupation | Male | Female |
| Sales & Related | 1,039 (49.2%) | 1,074 (50.8%) |
| Office & Administration | 352 (25.7%) | 1,018 (74.3%) |
| Total (Category) | 1,391 (39.9%) | 2,092 (60.1%) |
| Total (Overall) | 8,814 (55.5%) | 7,064 (44.5%) |
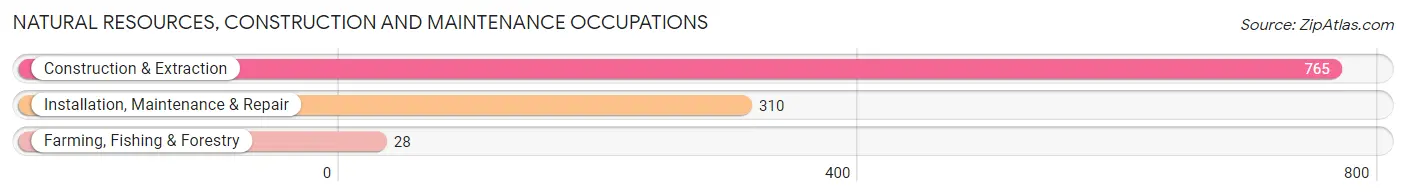
Natural Resources, Construction and Maintenance Occupations
The most common Natural Resources, Construction and Maintenance occupations in Hilton Head Island are Construction & Extraction (765 | 4.8%), Installation, Maintenance & Repair (310 | 1.9%), and Farming, Fishing & Forestry (28 | 0.2%).
Natural Resources, Construction and Maintenance Occupations by Sex
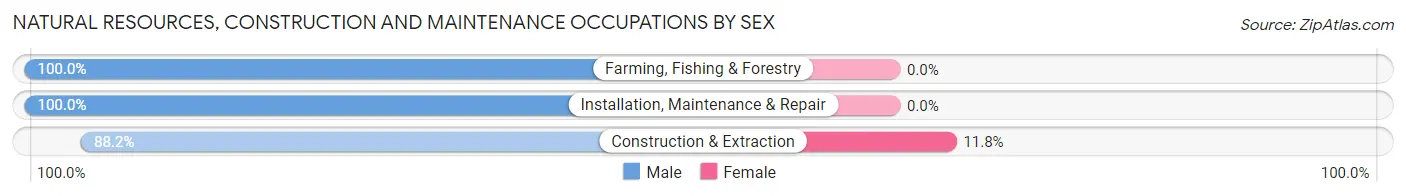
| Occupation | Male | Female |
| Farming, Fishing & Forestry | 28 (100.0%) | 0 (0.0%) |
| Construction & Extraction | 675 (88.2%) | 90 (11.8%) |
| Installation, Maintenance & Repair | 310 (100.0%) | 0 (0.0%) |
| Total (Category) | 1,013 (91.8%) | 90 (8.2%) |
| Total (Overall) | 8,814 (55.5%) | 7,064 (44.5%) |
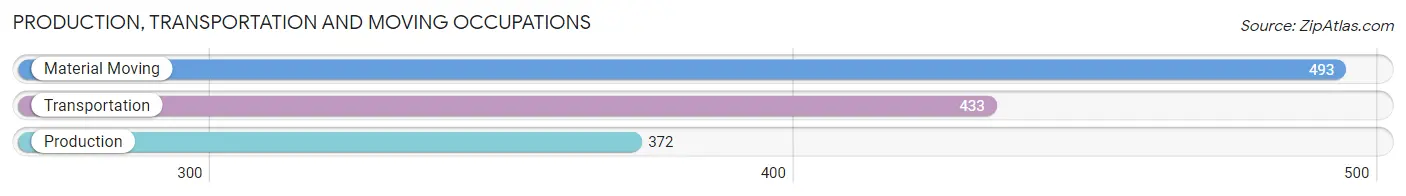
Production, Transportation and Moving Occupations
The most common Production, Transportation and Moving occupations in Hilton Head Island are Material Moving (493 | 3.1%), Transportation (433 | 2.7%), and Production (372 | 2.3%).
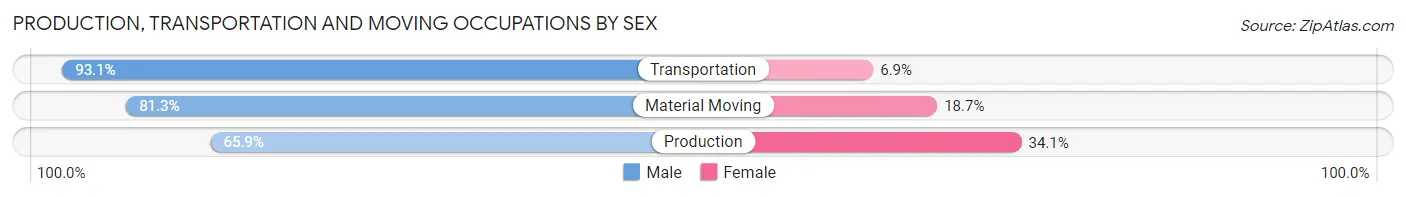
Production, Transportation and Moving Occupations by Sex
| Occupation | Male | Female |
| Production | 245 (65.9%) | 127 (34.1%) |
| Transportation | 403 (93.1%) | 30 (6.9%) |
| Material Moving | 401 (81.3%) | 92 (18.7%) |
| Total (Category) | 1,049 (80.8%) | 249 (19.2%) |
| Total (Overall) | 8,814 (55.5%) | 7,064 (44.5%) |
Employment Industries by Sex in Hilton Head Island
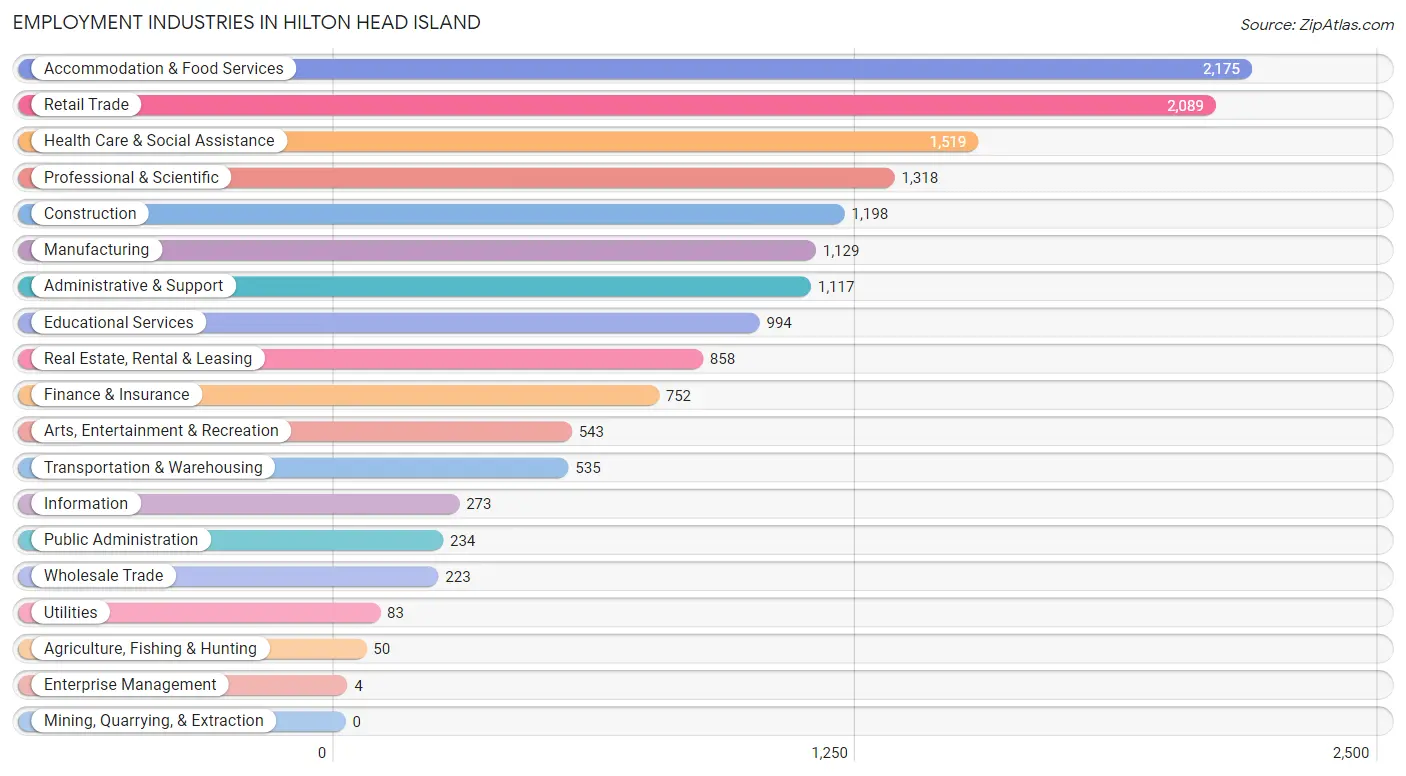
Employment Industries in Hilton Head Island
The major employment industries in Hilton Head Island include Accommodation & Food Services (2,175 | 13.7%), Retail Trade (2,089 | 13.2%), Health Care & Social Assistance (1,519 | 9.6%), Professional & Scientific (1,318 | 8.3%), and Construction (1,198 | 7.5%).
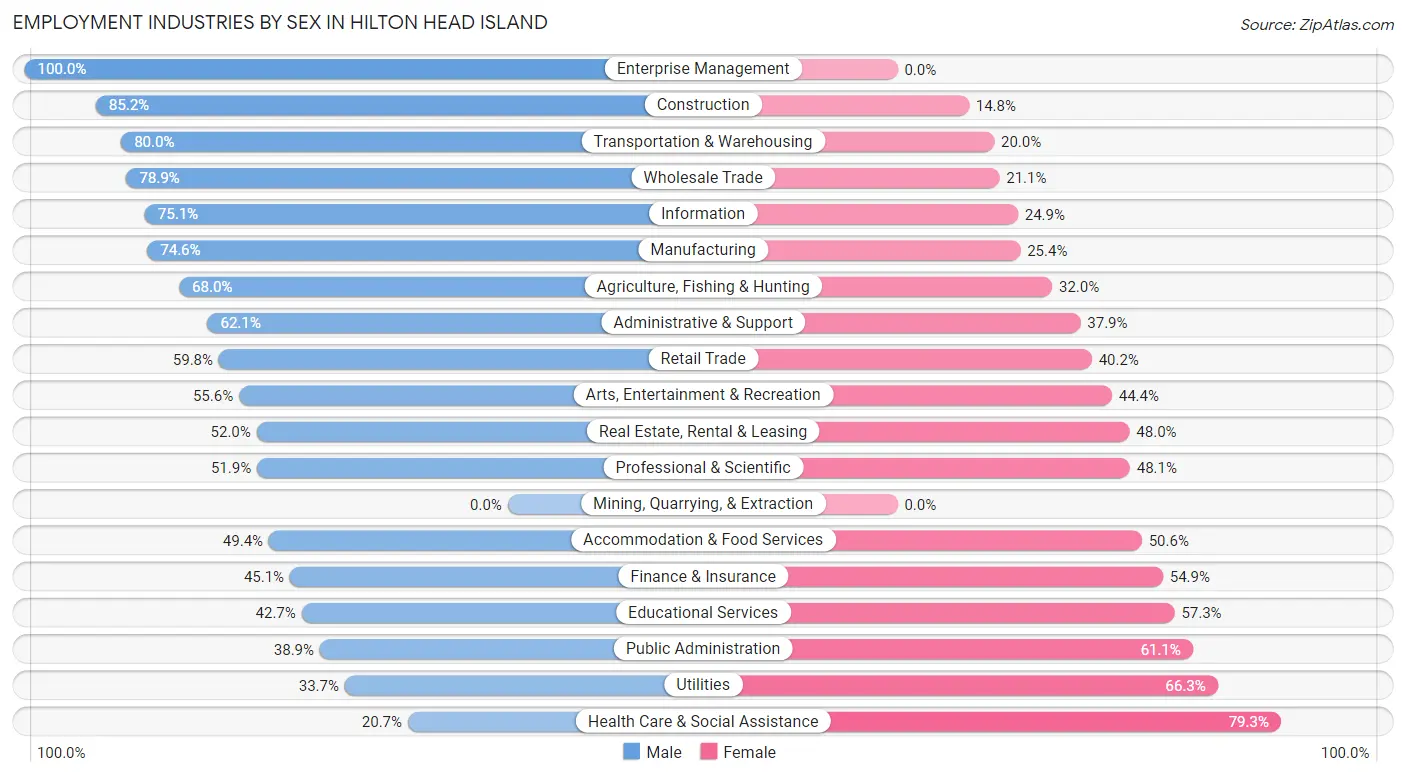
Employment Industries by Sex in Hilton Head Island
The Hilton Head Island industries that see more men than women are Enterprise Management (100.0%), Construction (85.2%), and Transportation & Warehousing (80.0%), whereas the industries that tend to have a higher number of women are Health Care & Social Assistance (79.3%), Utilities (66.3%), and Public Administration (61.1%).
| Industry | Male | Female |
| Agriculture, Fishing & Hunting | 34 (68.0%) | 16 (32.0%) |
| Mining, Quarrying, & Extraction | 0 (0.0%) | 0 (0.0%) |
| Construction | 1,021 (85.2%) | 177 (14.8%) |
| Manufacturing | 842 (74.6%) | 287 (25.4%) |
| Wholesale Trade | 176 (78.9%) | 47 (21.1%) |
| Retail Trade | 1,249 (59.8%) | 840 (40.2%) |
| Transportation & Warehousing | 428 (80.0%) | 107 (20.0%) |
| Utilities | 28 (33.7%) | 55 (66.3%) |
| Information | 205 (75.1%) | 68 (24.9%) |
| Finance & Insurance | 339 (45.1%) | 413 (54.9%) |
| Real Estate, Rental & Leasing | 446 (52.0%) | 412 (48.0%) |
| Professional & Scientific | 684 (51.9%) | 634 (48.1%) |
| Enterprise Management | 4 (100.0%) | 0 (0.0%) |
| Administrative & Support | 694 (62.1%) | 423 (37.9%) |
| Educational Services | 424 (42.7%) | 570 (57.3%) |
| Health Care & Social Assistance | 314 (20.7%) | 1,205 (79.3%) |
| Arts, Entertainment & Recreation | 302 (55.6%) | 241 (44.4%) |
| Accommodation & Food Services | 1,075 (49.4%) | 1,100 (50.6%) |
| Public Administration | 91 (38.9%) | 143 (61.1%) |
| Total | 8,814 (55.5%) | 7,064 (44.5%) |
Education in Hilton Head Island
School Enrollment in Hilton Head Island
The most common levels of schooling among the 4,397 students in Hilton Head Island are middle school (1,156 | 26.3%), high school (1,126 | 25.6%), and elementary school (798 | 18.1%).
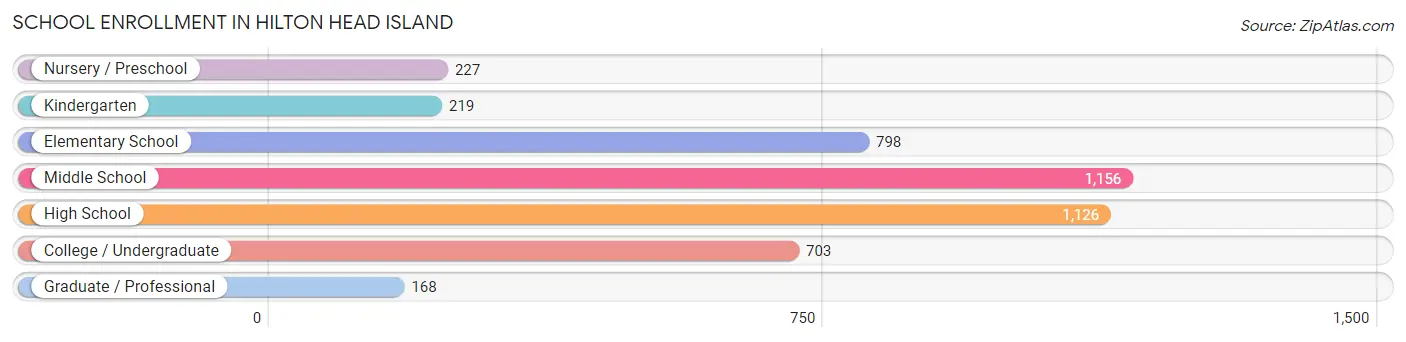
| School Level | # Students | % Students |
| Nursery / Preschool | 227 | 5.2% |
| Kindergarten | 219 | 5.0% |
| Elementary School | 798 | 18.1% |
| Middle School | 1,156 | 26.3% |
| High School | 1,126 | 25.6% |
| College / Undergraduate | 703 | 16.0% |
| Graduate / Professional | 168 | 3.8% |
| Total | 4,397 | 100.0% |
School Enrollment by Age by Funding Source in Hilton Head Island
Out of a total of 4,397 students who are enrolled in schools in Hilton Head Island, 1,112 (25.3%) attend a private institution, while the remaining 3,285 (74.7%) are enrolled in public schools. The age group of 3 to 4 year olds has the highest likelihood of being enrolled in private schools, with 103 (61.3% in the age bracket) enrolled. Conversely, the age group of 25 to 34 year olds has the lowest likelihood of being enrolled in a private school, with 43 (100.0% in the age bracket) attending a public institution.
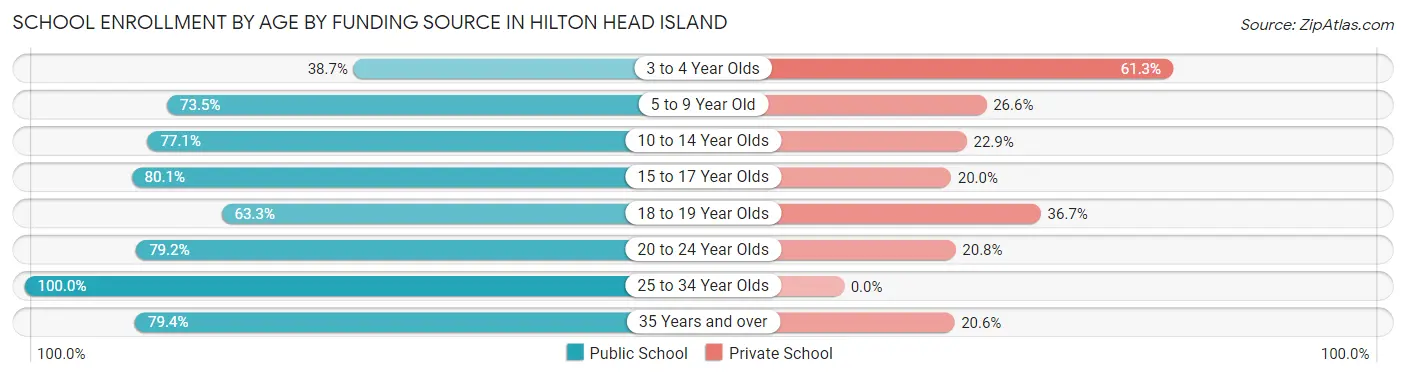
| Age Bracket | Public School | Private School |
| 3 to 4 Year Olds | 65 (38.7%) | 103 (61.3%) |
| 5 to 9 Year Old | 697 (73.5%) | 252 (26.6%) |
| 10 to 14 Year Olds | 1,159 (77.1%) | 344 (22.9%) |
| 15 to 17 Year Olds | 598 (80.0%) | 149 (20.0%) |
| 18 to 19 Year Olds | 245 (63.3%) | 142 (36.7%) |
| 20 to 24 Year Olds | 179 (79.2%) | 47 (20.8%) |
| 25 to 34 Year Olds | 43 (100.0%) | 0 (0.0%) |
| 35 Years and over | 297 (79.4%) | 77 (20.6%) |
| Total | 3,285 (74.7%) | 1,112 (25.3%) |
Educational Attainment by Field of Study in Hilton Head Island
Business (4,273 | 23.1%), education (2,496 | 13.5%), social sciences (2,105 | 11.4%), science & technology (1,536 | 8.3%), and engineering (1,226 | 6.6%) are the most common fields of study among 18,495 individuals in Hilton Head Island who have obtained a bachelor's degree or higher.
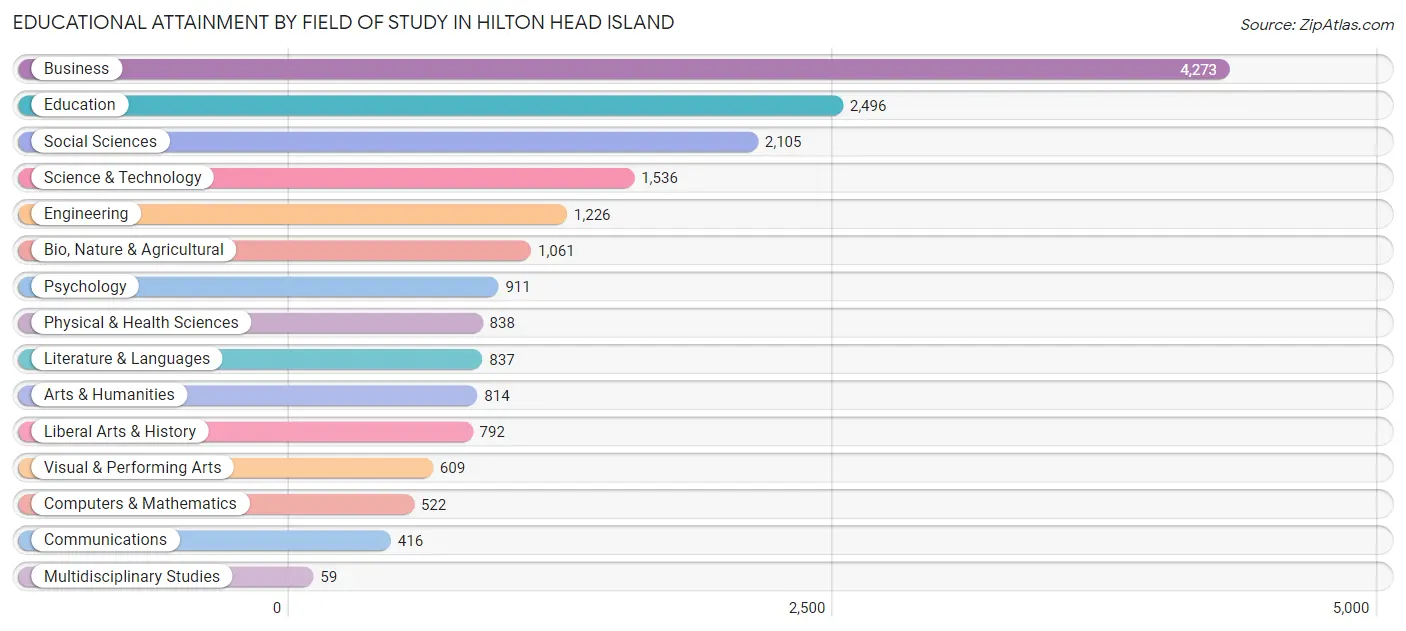
| Field of Study | # Graduates | % Graduates |
| Computers & Mathematics | 522 | 2.8% |
| Bio, Nature & Agricultural | 1,061 | 5.7% |
| Physical & Health Sciences | 838 | 4.5% |
| Psychology | 911 | 4.9% |
| Social Sciences | 2,105 | 11.4% |
| Engineering | 1,226 | 6.6% |
| Multidisciplinary Studies | 59 | 0.3% |
| Science & Technology | 1,536 | 8.3% |
| Business | 4,273 | 23.1% |
| Education | 2,496 | 13.5% |
| Literature & Languages | 837 | 4.5% |
| Liberal Arts & History | 792 | 4.3% |
| Visual & Performing Arts | 609 | 3.3% |
| Communications | 416 | 2.2% |
| Arts & Humanities | 814 | 4.4% |
| Total | 18,495 | 100.0% |
Transportation & Commute in Hilton Head Island
Vehicle Availability by Sex in Hilton Head Island
The most prevalent vehicle ownership categories in Hilton Head Island are males with 2 vehicles (3,997, accounting for 45.7%) and females with 2 vehicles (3,442, making up 57.0%).
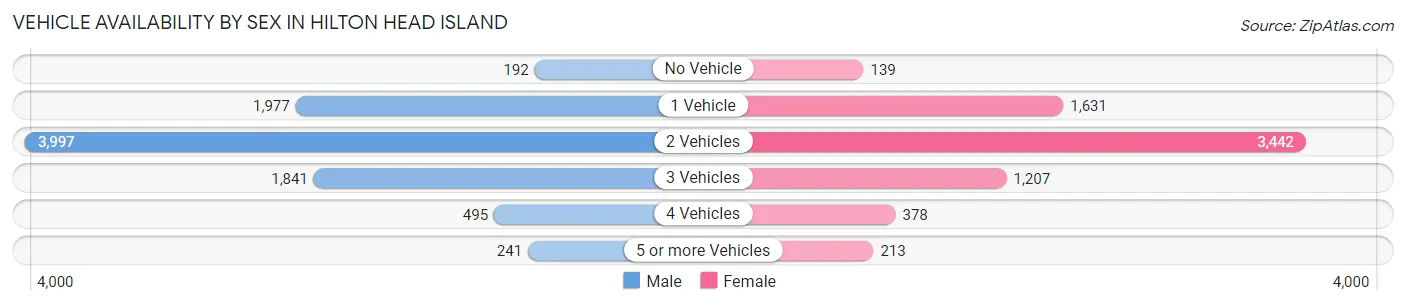
| Vehicles Available | Male | Female |
| No Vehicle | 192 (2.2%) | 139 (2.0%) |
| 1 Vehicle | 1,977 (22.6%) | 1,631 (23.3%) |
| 2 Vehicles | 3,997 (45.7%) | 3,442 (49.1%) |
| 3 Vehicles | 1,841 (21.1%) | 1,207 (17.2%) |
| 4 Vehicles | 495 (5.7%) | 378 (5.4%) |
| 5 or more Vehicles | 241 (2.8%) | 213 (3.0%) |
| Total | 8,743 (100.0%) | 7,010 (100.0%) |
Commute Time in Hilton Head Island
The most frequently occuring commute durations in Hilton Head Island are 10 to 14 minutes (3,079 commuters, 23.1%), 15 to 19 minutes (2,803 commuters, 21.0%), and 5 to 9 minutes (2,160 commuters, 16.2%).
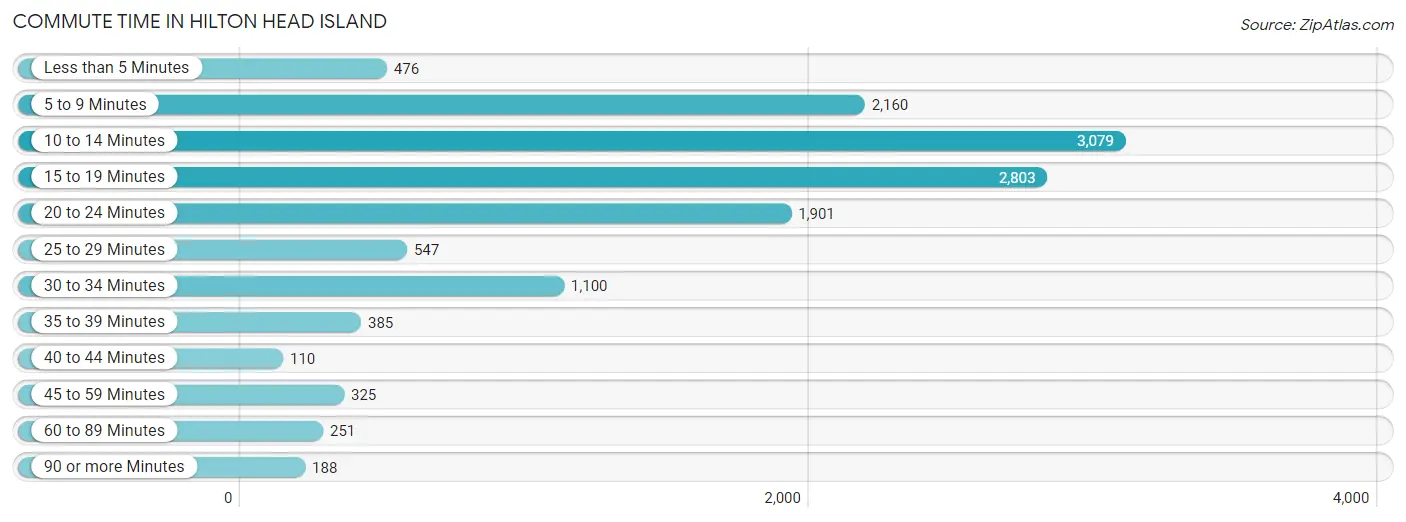
| Commute Time | # Commuters | % Commuters |
| Less than 5 Minutes | 476 | 3.6% |
| 5 to 9 Minutes | 2,160 | 16.2% |
| 10 to 14 Minutes | 3,079 | 23.1% |
| 15 to 19 Minutes | 2,803 | 21.0% |
| 20 to 24 Minutes | 1,901 | 14.3% |
| 25 to 29 Minutes | 547 | 4.1% |
| 30 to 34 Minutes | 1,100 | 8.3% |
| 35 to 39 Minutes | 385 | 2.9% |
| 40 to 44 Minutes | 110 | 0.8% |
| 45 to 59 Minutes | 325 | 2.4% |
| 60 to 89 Minutes | 251 | 1.9% |
| 90 or more Minutes | 188 | 1.4% |
Commute Time by Sex in Hilton Head Island
The most common commute times in Hilton Head Island are 10 to 14 minutes (1,714 commuters, 23.4%) for males and 10 to 14 minutes (1,365 commuters, 22.8%) for females.
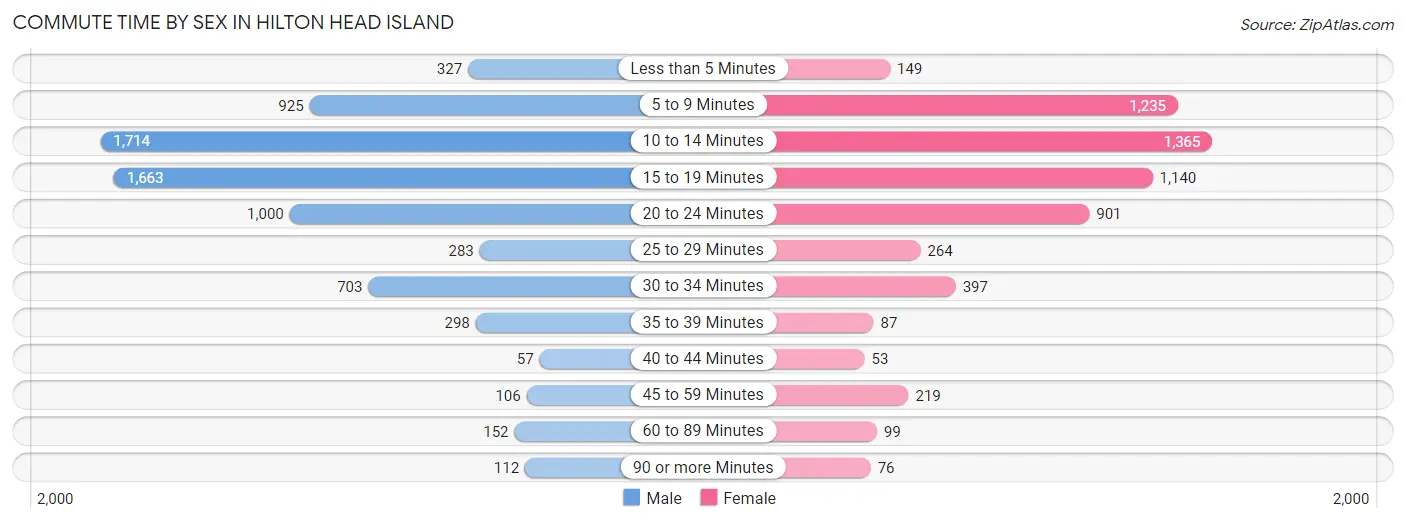
| Commute Time | Male | Female |
| Less than 5 Minutes | 327 (4.5%) | 149 (2.5%) |
| 5 to 9 Minutes | 925 (12.6%) | 1,235 (20.6%) |
| 10 to 14 Minutes | 1,714 (23.4%) | 1,365 (22.8%) |
| 15 to 19 Minutes | 1,663 (22.7%) | 1,140 (19.1%) |
| 20 to 24 Minutes | 1,000 (13.6%) | 901 (15.0%) |
| 25 to 29 Minutes | 283 (3.9%) | 264 (4.4%) |
| 30 to 34 Minutes | 703 (9.6%) | 397 (6.6%) |
| 35 to 39 Minutes | 298 (4.1%) | 87 (1.5%) |
| 40 to 44 Minutes | 57 (0.8%) | 53 (0.9%) |
| 45 to 59 Minutes | 106 (1.4%) | 219 (3.7%) |
| 60 to 89 Minutes | 152 (2.1%) | 99 (1.7%) |
| 90 or more Minutes | 112 (1.5%) | 76 (1.3%) |
Time of Departure to Work by Sex in Hilton Head Island
The most frequent times of departure to work in Hilton Head Island are 7:00 AM to 7:29 AM (1,542, 21.0%) for males and 8:00 AM to 8:29 AM (1,153, 19.3%) for females.
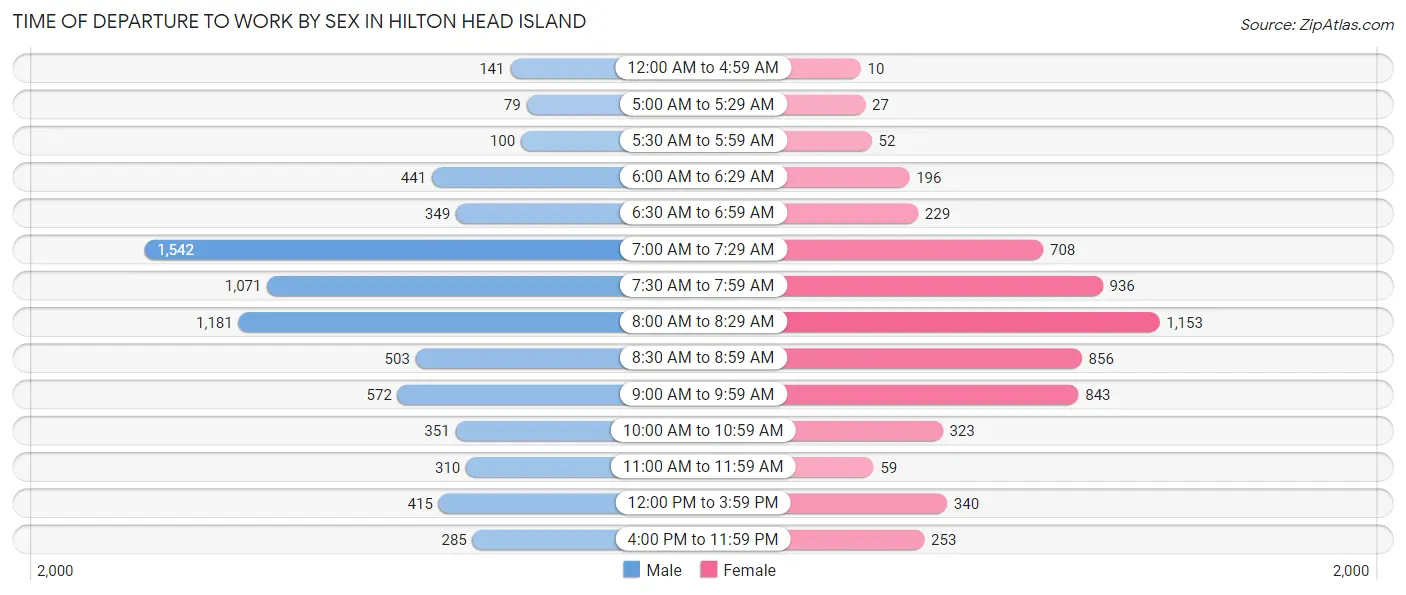
| Time of Departure | Male | Female |
| 12:00 AM to 4:59 AM | 141 (1.9%) | 10 (0.2%) |
| 5:00 AM to 5:29 AM | 79 (1.1%) | 27 (0.4%) |
| 5:30 AM to 5:59 AM | 100 (1.4%) | 52 (0.9%) |
| 6:00 AM to 6:29 AM | 441 (6.0%) | 196 (3.3%) |
| 6:30 AM to 6:59 AM | 349 (4.8%) | 229 (3.8%) |
| 7:00 AM to 7:29 AM | 1,542 (21.0%) | 708 (11.8%) |
| 7:30 AM to 7:59 AM | 1,071 (14.6%) | 936 (15.6%) |
| 8:00 AM to 8:29 AM | 1,181 (16.1%) | 1,153 (19.3%) |
| 8:30 AM to 8:59 AM | 503 (6.9%) | 856 (14.3%) |
| 9:00 AM to 9:59 AM | 572 (7.8%) | 843 (14.1%) |
| 10:00 AM to 10:59 AM | 351 (4.8%) | 323 (5.4%) |
| 11:00 AM to 11:59 AM | 310 (4.2%) | 59 (1.0%) |
| 12:00 PM to 3:59 PM | 415 (5.7%) | 340 (5.7%) |
| 4:00 PM to 11:59 PM | 285 (3.9%) | 253 (4.2%) |
| Total | 7,340 (100.0%) | 5,985 (100.0%) |
Housing Occupancy in Hilton Head Island
Occupancy by Ownership in Hilton Head Island
Of the total 17,126 dwellings in Hilton Head Island, owner-occupied units account for 13,828 (80.7%), while renter-occupied units make up 3,298 (19.3%).
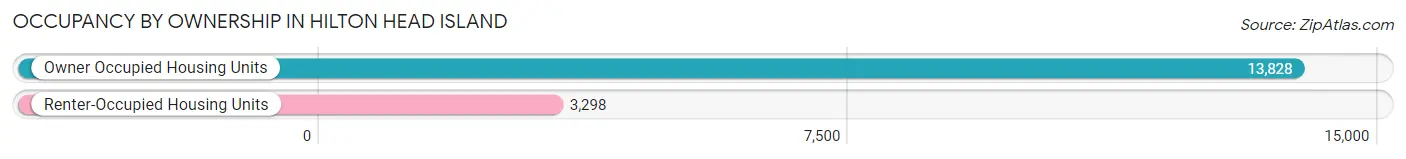
| Occupancy | # Housing Units | % Housing Units |
| Owner Occupied Housing Units | 13,828 | 80.7% |
| Renter-Occupied Housing Units | 3,298 | 19.3% |
| Total Occupied Housing Units | 17,126 | 100.0% |
Occupancy by Household Size in Hilton Head Island
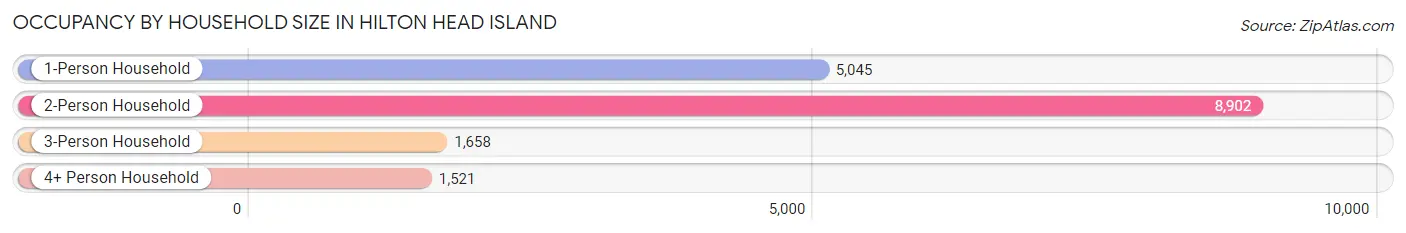
| Household Size | # Housing Units | % Housing Units |
| 1-Person Household | 5,045 | 29.5% |
| 2-Person Household | 8,902 | 52.0% |
| 3-Person Household | 1,658 | 9.7% |
| 4+ Person Household | 1,521 | 8.9% |
| Total Housing Units | 17,126 | 100.0% |
Occupancy by Ownership by Household Size in Hilton Head Island
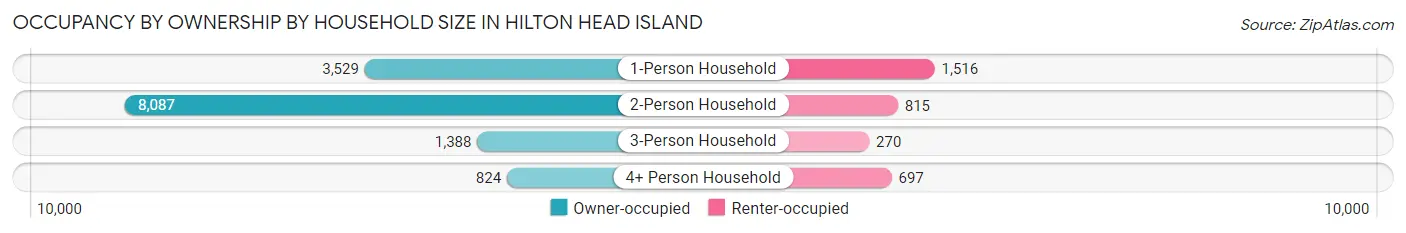
| Household Size | Owner-occupied | Renter-occupied |
| 1-Person Household | 3,529 (70.0%) | 1,516 (30.0%) |
| 2-Person Household | 8,087 (90.8%) | 815 (9.2%) |
| 3-Person Household | 1,388 (83.7%) | 270 (16.3%) |
| 4+ Person Household | 824 (54.2%) | 697 (45.8%) |
| Total Housing Units | 13,828 (80.7%) | 3,298 (19.3%) |
Occupancy by Educational Attainment in Hilton Head Island
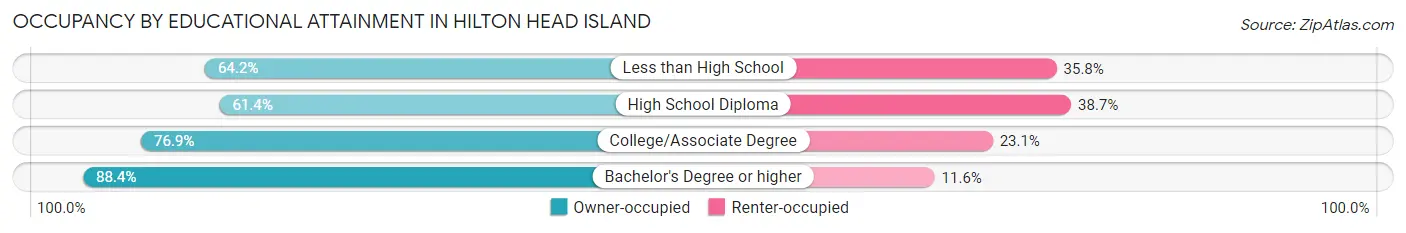
| Household Size | Owner-occupied | Renter-occupied |
| Less than High School | 720 (64.2%) | 401 (35.8%) |
| High School Diploma | 1,430 (61.4%) | 901 (38.7%) |
| College/Associate Degree | 2,739 (76.9%) | 823 (23.1%) |
| Bachelor's Degree or higher | 8,939 (88.4%) | 1,173 (11.6%) |
Occupancy by Age of Householder in Hilton Head Island
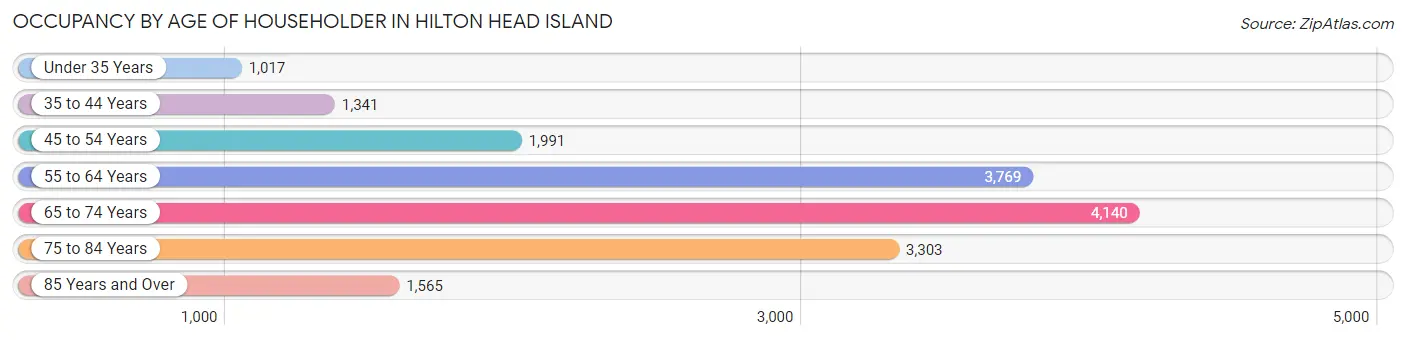
| Age Bracket | # Households | % Households |
| Under 35 Years | 1,017 | 5.9% |
| 35 to 44 Years | 1,341 | 7.8% |
| 45 to 54 Years | 1,991 | 11.6% |
| 55 to 64 Years | 3,769 | 22.0% |
| 65 to 74 Years | 4,140 | 24.2% |
| 75 to 84 Years | 3,303 | 19.3% |
| 85 Years and Over | 1,565 | 9.1% |
| Total | 17,126 | 100.0% |
Housing Finances in Hilton Head Island
Median Income by Occupancy in Hilton Head Island
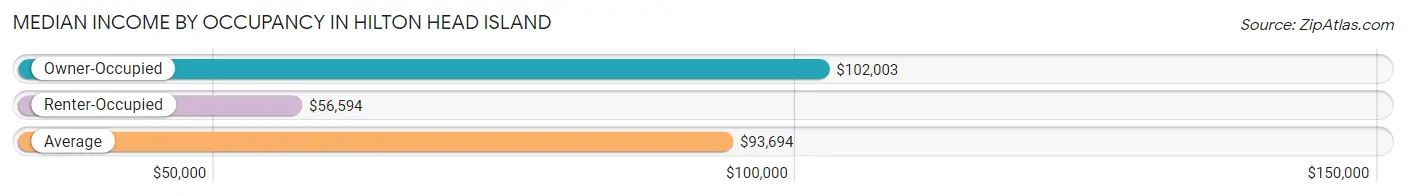
| Occupancy Type | # Households | Median Income |
| Owner-Occupied | 13,828 (80.7%) | $102,003 |
| Renter-Occupied | 3,298 (19.3%) | $56,594 |
| Average | 17,126 (100.0%) | $93,694 |
Occupancy by Householder Income Bracket in Hilton Head Island
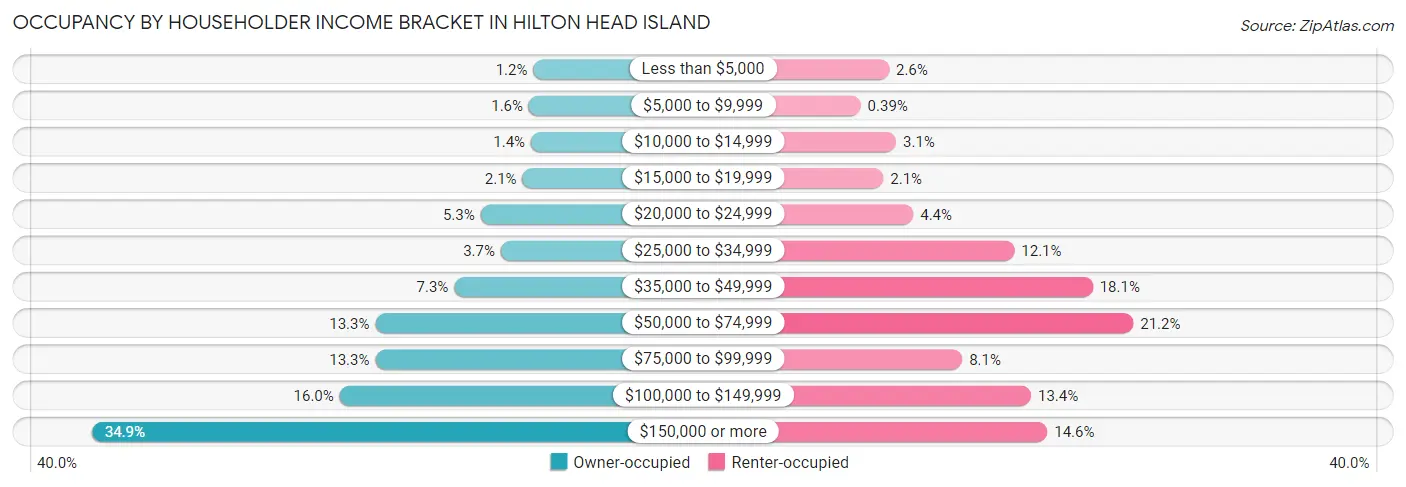
| Income Bracket | Owner-occupied | Renter-occupied |
| Less than $5,000 | 171 (1.2%) | 84 (2.5%) |
| $5,000 to $9,999 | 219 (1.6%) | 13 (0.4%) |
| $10,000 to $14,999 | 196 (1.4%) | 102 (3.1%) |
| $15,000 to $19,999 | 286 (2.1%) | 70 (2.1%) |
| $20,000 to $24,999 | 728 (5.3%) | 145 (4.4%) |
| $25,000 to $34,999 | 515 (3.7%) | 399 (12.1%) |
| $35,000 to $49,999 | 1,005 (7.3%) | 596 (18.1%) |
| $50,000 to $74,999 | 1,837 (13.3%) | 698 (21.2%) |
| $75,000 to $99,999 | 1,836 (13.3%) | 268 (8.1%) |
| $100,000 to $149,999 | 2,212 (16.0%) | 441 (13.4%) |
| $150,000 or more | 4,823 (34.9%) | 482 (14.6%) |
| Total | 13,828 (100.0%) | 3,298 (100.0%) |
Monthly Housing Cost Tiers in Hilton Head Island
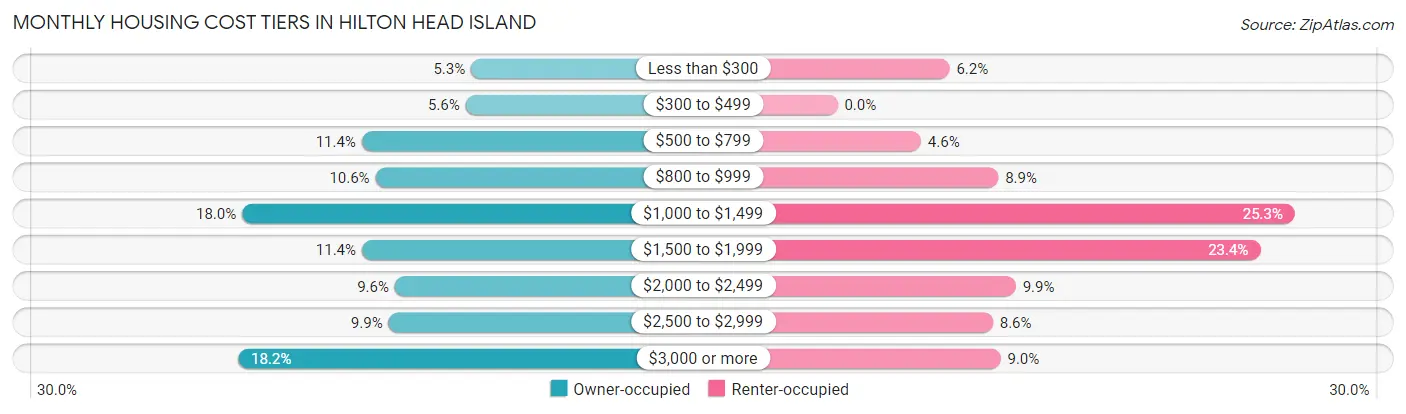
| Monthly Cost | Owner-occupied | Renter-occupied |
| Less than $300 | 738 (5.3%) | 204 (6.2%) |
| $300 to $499 | 780 (5.6%) | 0 (0.0%) |
| $500 to $799 | 1,574 (11.4%) | 152 (4.6%) |
| $800 to $999 | 1,468 (10.6%) | 293 (8.9%) |
| $1,000 to $1,499 | 2,488 (18.0%) | 833 (25.3%) |
| $1,500 to $1,999 | 1,572 (11.4%) | 770 (23.4%) |
| $2,000 to $2,499 | 1,321 (9.6%) | 325 (9.9%) |
| $2,500 to $2,999 | 1,369 (9.9%) | 283 (8.6%) |
| $3,000 or more | 2,518 (18.2%) | 297 (9.0%) |
| Total | 13,828 (100.0%) | 3,298 (100.0%) |
Physical Housing Characteristics in Hilton Head Island
Housing Structures in Hilton Head Island
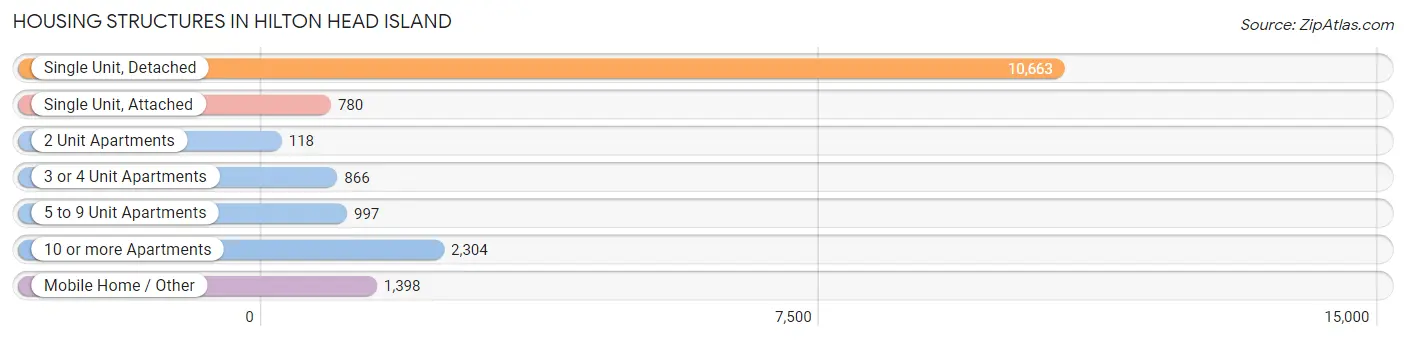
| Structure Type | # Housing Units | % Housing Units |
| Single Unit, Detached | 10,663 | 62.3% |
| Single Unit, Attached | 780 | 4.5% |
| 2 Unit Apartments | 118 | 0.7% |
| 3 or 4 Unit Apartments | 866 | 5.1% |
| 5 to 9 Unit Apartments | 997 | 5.8% |
| 10 or more Apartments | 2,304 | 13.5% |
| Mobile Home / Other | 1,398 | 8.2% |
| Total | 17,126 | 100.0% |
Housing Structures by Occupancy in Hilton Head Island
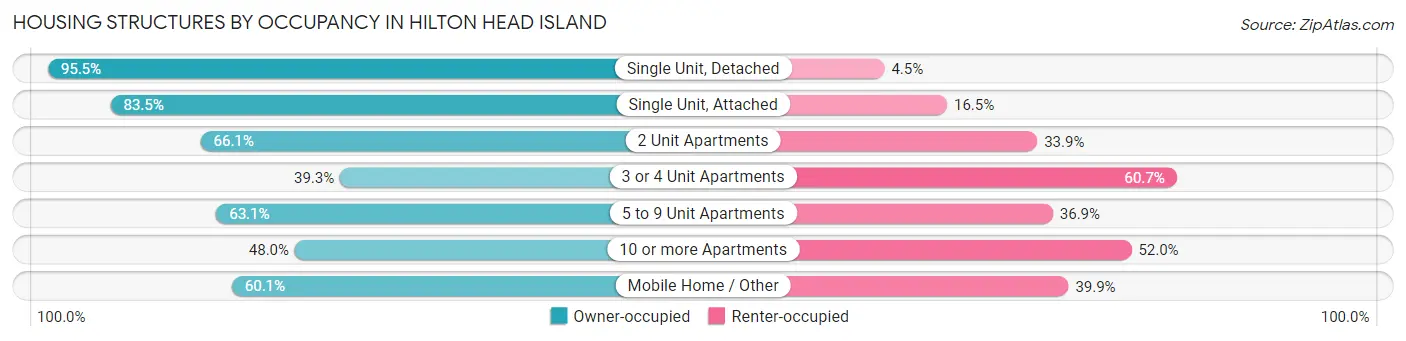
| Structure Type | Owner-occupied | Renter-occupied |
| Single Unit, Detached | 10,185 (95.5%) | 478 (4.5%) |
| Single Unit, Attached | 651 (83.5%) | 129 (16.5%) |
| 2 Unit Apartments | 78 (66.1%) | 40 (33.9%) |
| 3 or 4 Unit Apartments | 340 (39.3%) | 526 (60.7%) |
| 5 to 9 Unit Apartments | 629 (63.1%) | 368 (36.9%) |
| 10 or more Apartments | 1,105 (48.0%) | 1,199 (52.0%) |
| Mobile Home / Other | 840 (60.1%) | 558 (39.9%) |
| Total | 13,828 (80.7%) | 3,298 (19.3%) |
Housing Structures by Number of Rooms in Hilton Head Island
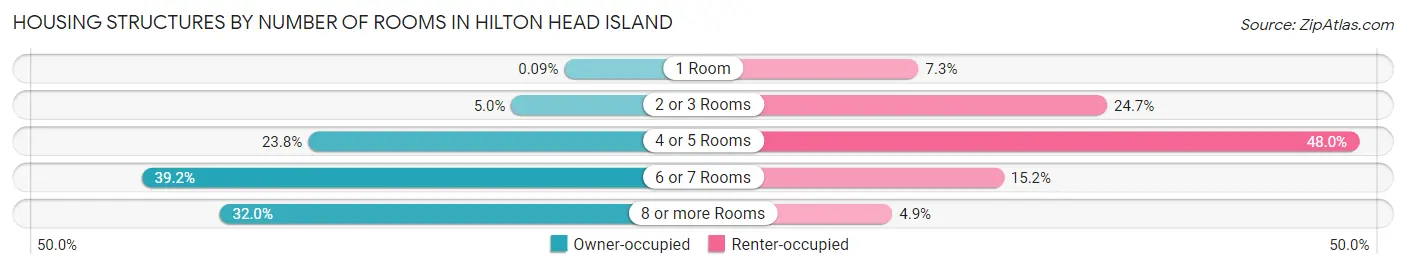
| Number of Rooms | Owner-occupied | Renter-occupied |
| 1 Room | 13 (0.1%) | 240 (7.3%) |
| 2 or 3 Rooms | 690 (5.0%) | 815 (24.7%) |
| 4 or 5 Rooms | 3,289 (23.8%) | 1,583 (48.0%) |
| 6 or 7 Rooms | 5,416 (39.2%) | 500 (15.2%) |
| 8 or more Rooms | 4,420 (32.0%) | 160 (4.9%) |
| Total | 13,828 (100.0%) | 3,298 (100.0%) |
Housing Structure by Heating Type in Hilton Head Island
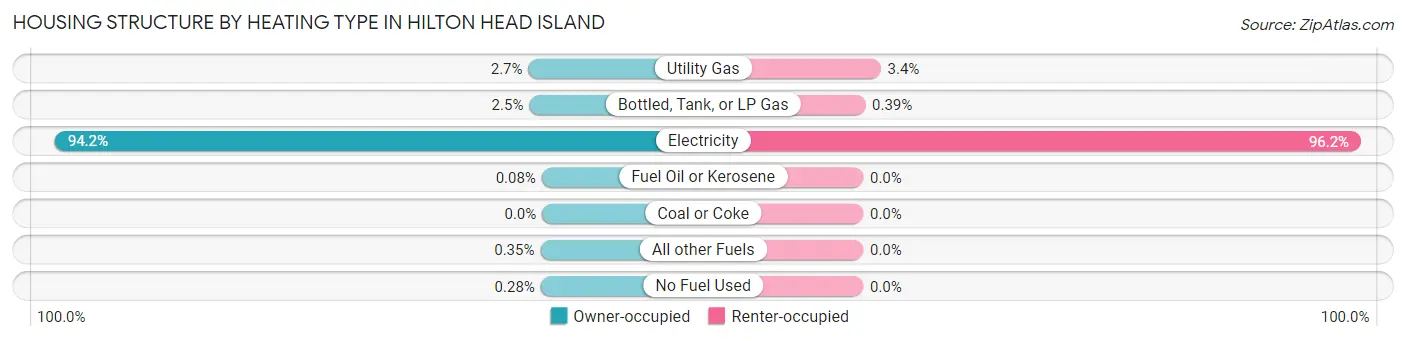
| Heating Type | Owner-occupied | Renter-occupied |
| Utility Gas | 366 (2.6%) | 112 (3.4%) |
| Bottled, Tank, or LP Gas | 344 (2.5%) | 13 (0.4%) |
| Electricity | 13,020 (94.2%) | 3,173 (96.2%) |
| Fuel Oil or Kerosene | 11 (0.1%) | 0 (0.0%) |
| Coal or Coke | 0 (0.0%) | 0 (0.0%) |
| All other Fuels | 48 (0.4%) | 0 (0.0%) |
| No Fuel Used | 39 (0.3%) | 0 (0.0%) |
| Total | 13,828 (100.0%) | 3,298 (100.0%) |
Household Vehicle Usage in Hilton Head Island
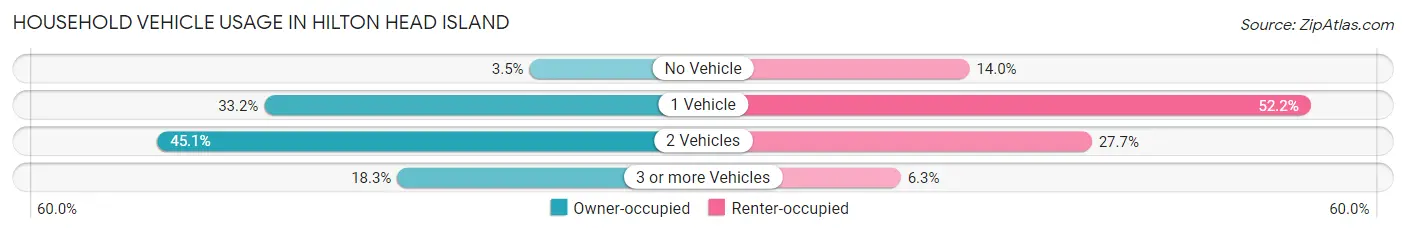
| Vehicles per Household | Owner-occupied | Renter-occupied |
| No Vehicle | 477 (3.5%) | 460 (14.0%) |
| 1 Vehicle | 4,585 (33.2%) | 1,720 (52.1%) |
| 2 Vehicles | 6,241 (45.1%) | 912 (27.7%) |
| 3 or more Vehicles | 2,525 (18.3%) | 206 (6.2%) |
| Total | 13,828 (100.0%) | 3,298 (100.0%) |
Real Estate & Mortgages in Hilton Head Island
Real Estate and Mortgage Overview in Hilton Head Island
| Characteristic | Without Mortgage | With Mortgage |
| Housing Units | 6,727 | 7,101 |
| Median Property Value | $598,000 | $580,500 |
| Median Household Income | $81,120 | $2,857 |
| Monthly Housing Costs | $869 | $2,301 |
| Real Estate Taxes | $2,845 | $103 |
Property Value by Mortgage Status in Hilton Head Island
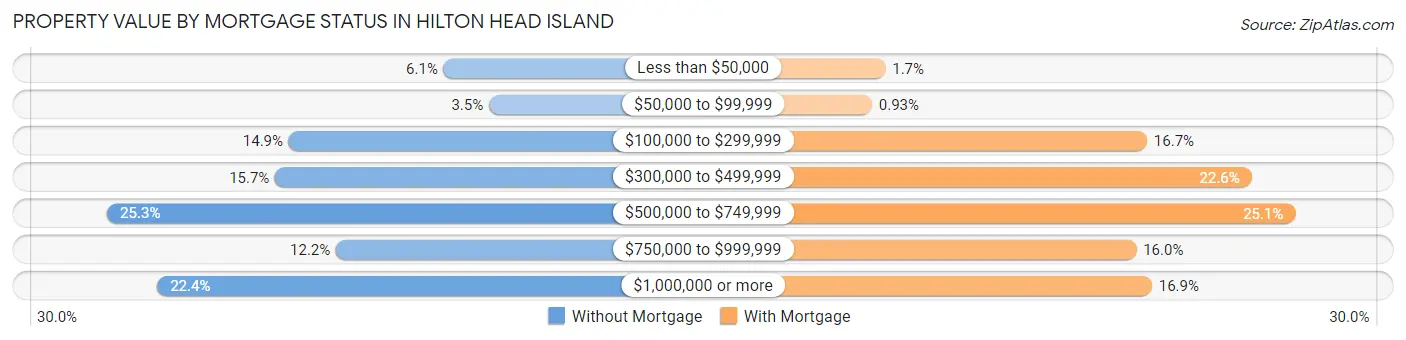
| Property Value | Without Mortgage | With Mortgage |
| Less than $50,000 | 407 (6.0%) | 121 (1.7%) |
| $50,000 to $99,999 | 233 (3.5%) | 66 (0.9%) |
| $100,000 to $299,999 | 1,002 (14.9%) | 1,182 (16.7%) |
| $300,000 to $499,999 | 1,055 (15.7%) | 1,607 (22.6%) |
| $500,000 to $749,999 | 1,701 (25.3%) | 1,784 (25.1%) |
| $750,000 to $999,999 | 821 (12.2%) | 1,139 (16.0%) |
| $1,000,000 or more | 1,508 (22.4%) | 1,202 (16.9%) |
| Total | 6,727 (100.0%) | 7,101 (100.0%) |
Household Income by Mortgage Status in Hilton Head Island
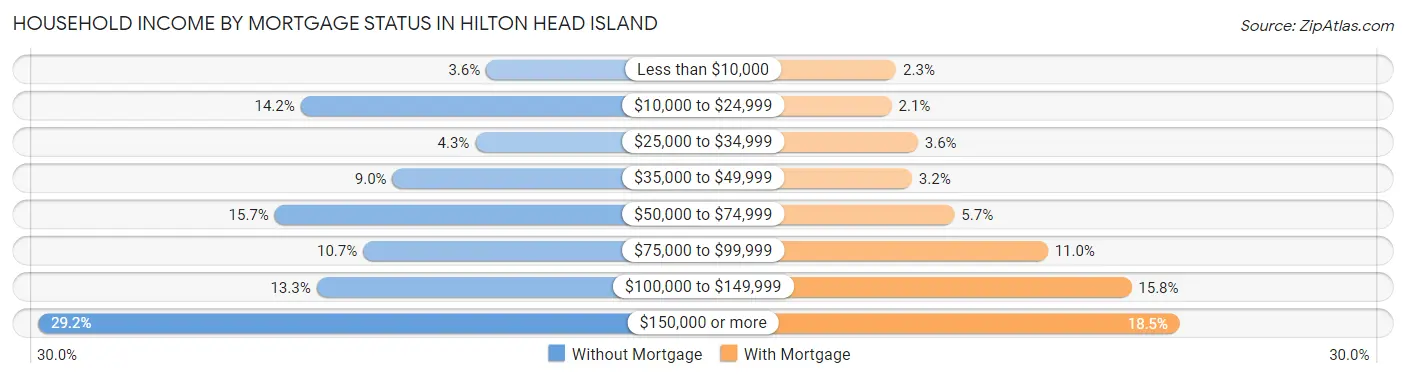
| Household Income | Without Mortgage | With Mortgage |
| Less than $10,000 | 244 (3.6%) | 165 (2.3%) |
| $10,000 to $24,999 | 957 (14.2%) | 146 (2.1%) |
| $25,000 to $34,999 | 286 (4.3%) | 253 (3.6%) |
| $35,000 to $49,999 | 604 (9.0%) | 229 (3.2%) |
| $50,000 to $74,999 | 1,057 (15.7%) | 401 (5.7%) |
| $75,000 to $99,999 | 717 (10.7%) | 780 (11.0%) |
| $100,000 to $149,999 | 896 (13.3%) | 1,119 (15.8%) |
| $150,000 or more | 1,966 (29.2%) | 1,316 (18.5%) |
| Total | 6,727 (100.0%) | 7,101 (100.0%) |
Property Value to Household Income Ratio in Hilton Head Island
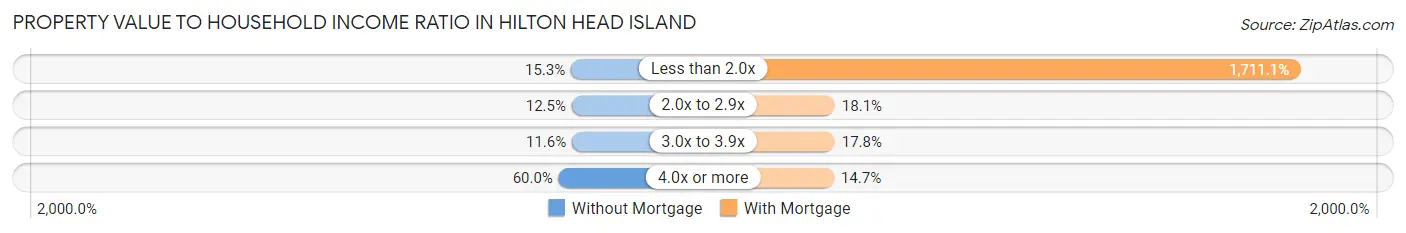
| Value-to-Income Ratio | Without Mortgage | With Mortgage |
| Less than 2.0x | 1,029 (15.3%) | 121,503 (1,711.1%) |
| 2.0x to 2.9x | 838 (12.5%) | 1,282 (18.0%) |
| 3.0x to 3.9x | 778 (11.6%) | 1,265 (17.8%) |
| 4.0x or more | 4,037 (60.0%) | 1,045 (14.7%) |
| Total | 6,727 (100.0%) | 7,101 (100.0%) |
Real Estate Taxes by Mortgage Status in Hilton Head Island
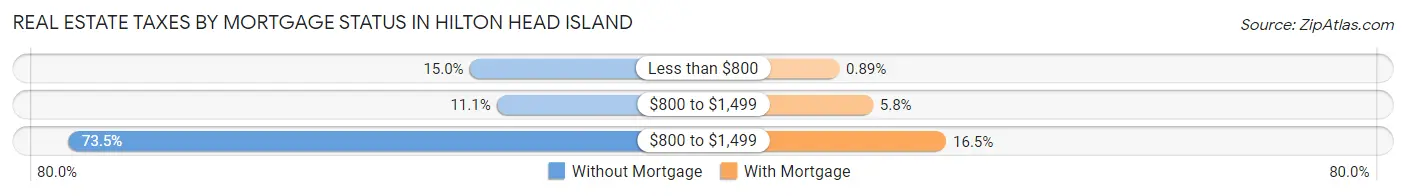
| Property Taxes | Without Mortgage | With Mortgage |
| Less than $800 | 1,009 (15.0%) | 63 (0.9%) |
| $800 to $1,499 | 743 (11.1%) | 413 (5.8%) |
| $800 to $1,499 | 4,946 (73.5%) | 1,173 (16.5%) |
| Total | 6,727 (100.0%) | 7,101 (100.0%) |
Health & Disability in Hilton Head Island
Health Insurance Coverage by Age in Hilton Head Island
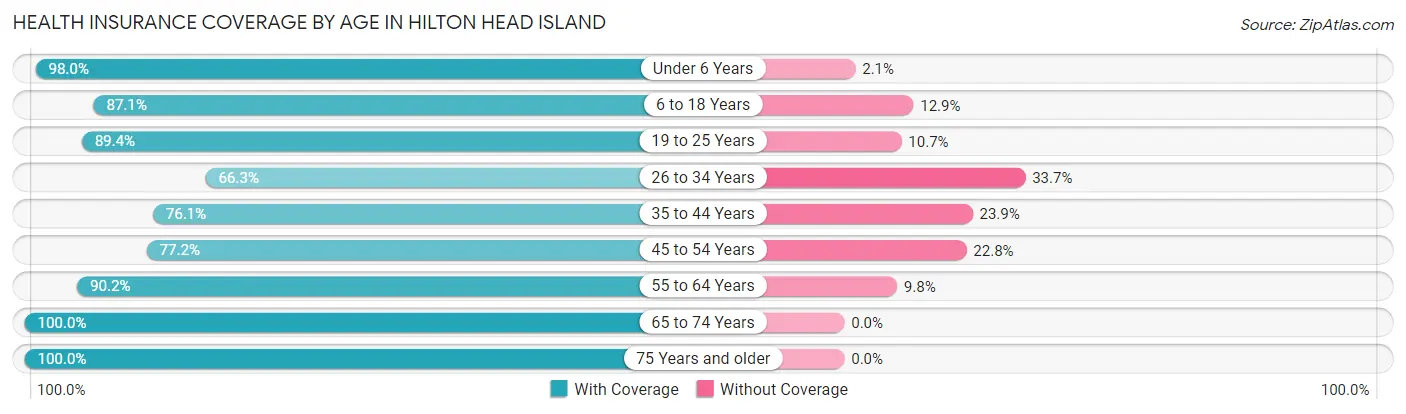
| Age Bracket | With Coverage | Without Coverage |
| Under 6 Years | 1,097 (98.0%) | 23 (2.1%) |
| 6 to 18 Years | 3,094 (87.1%) | 457 (12.9%) |
| 19 to 25 Years | 1,451 (89.3%) | 173 (10.6%) |
| 26 to 34 Years | 1,917 (66.3%) | 976 (33.7%) |
| 35 to 44 Years | 2,245 (76.1%) | 706 (23.9%) |
| 45 to 54 Years | 2,991 (77.2%) | 882 (22.8%) |
| 55 to 64 Years | 6,188 (90.2%) | 673 (9.8%) |
| 65 to 74 Years | 7,688 (100.0%) | 0 (0.0%) |
| 75 Years and older | 6,915 (100.0%) | 0 (0.0%) |
| Total | 33,586 (89.6%) | 3,890 (10.4%) |
Health Insurance Coverage by Citizenship Status in Hilton Head Island
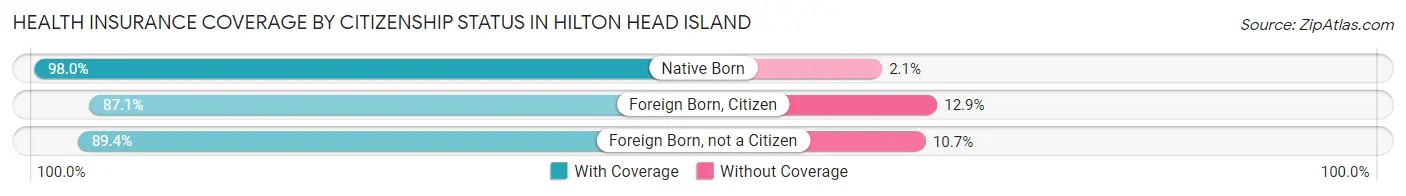
| Citizenship Status | With Coverage | Without Coverage |
| Native Born | 1,097 (98.0%) | 23 (2.1%) |
| Foreign Born, Citizen | 3,094 (87.1%) | 457 (12.9%) |
| Foreign Born, not a Citizen | 1,451 (89.3%) | 173 (10.6%) |
Health Insurance Coverage by Household Income in Hilton Head Island
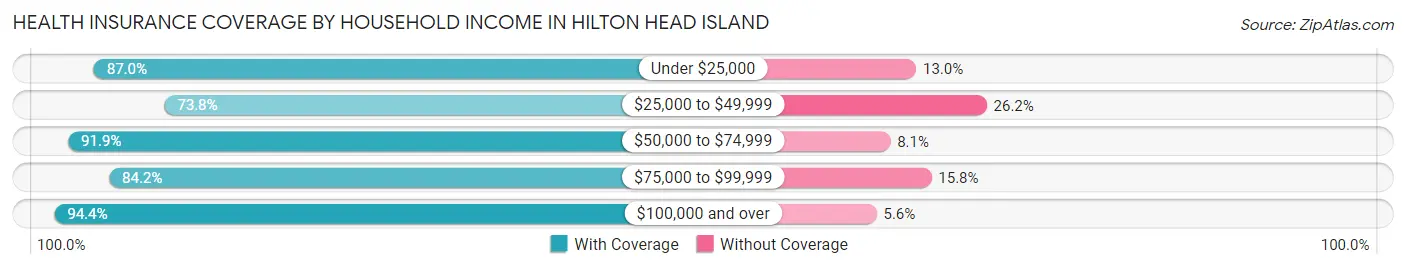
| Household Income | With Coverage | Without Coverage |
| Under $25,000 | 2,824 (87.0%) | 421 (13.0%) |
| $25,000 to $49,999 | 3,588 (73.8%) | 1,273 (26.2%) |
| $50,000 to $74,999 | 4,466 (91.9%) | 396 (8.1%) |
| $75,000 to $99,999 | 3,571 (84.2%) | 672 (15.8%) |
| $100,000 and over | 19,118 (94.4%) | 1,128 (5.6%) |
Public vs Private Health Insurance Coverage by Age in Hilton Head Island
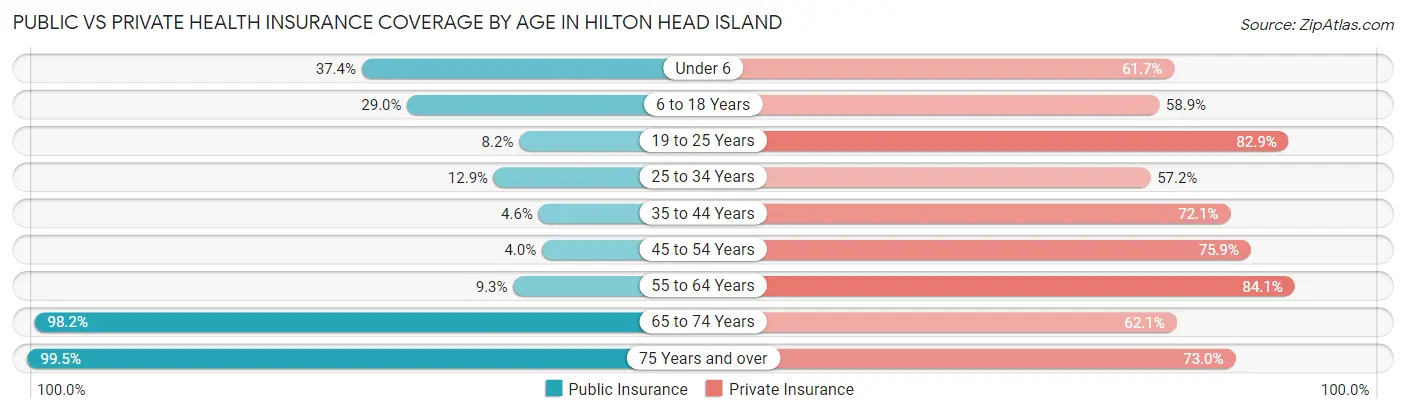
| Age Bracket | Public Insurance | Private Insurance |
| Under 6 | 419 (37.4%) | 691 (61.7%) |
| 6 to 18 Years | 1,028 (28.9%) | 2,090 (58.9%) |
| 19 to 25 Years | 133 (8.2%) | 1,347 (82.9%) |
| 25 to 34 Years | 373 (12.9%) | 1,656 (57.2%) |
| 35 to 44 Years | 135 (4.6%) | 2,128 (72.1%) |
| 45 to 54 Years | 153 (4.0%) | 2,940 (75.9%) |
| 55 to 64 Years | 637 (9.3%) | 5,767 (84.1%) |
| 65 to 74 Years | 7,546 (98.2%) | 4,777 (62.1%) |
| 75 Years and over | 6,877 (99.5%) | 5,051 (73.0%) |
| Total | 17,301 (46.2%) | 26,447 (70.6%) |
Disability Status by Sex by Age in Hilton Head Island
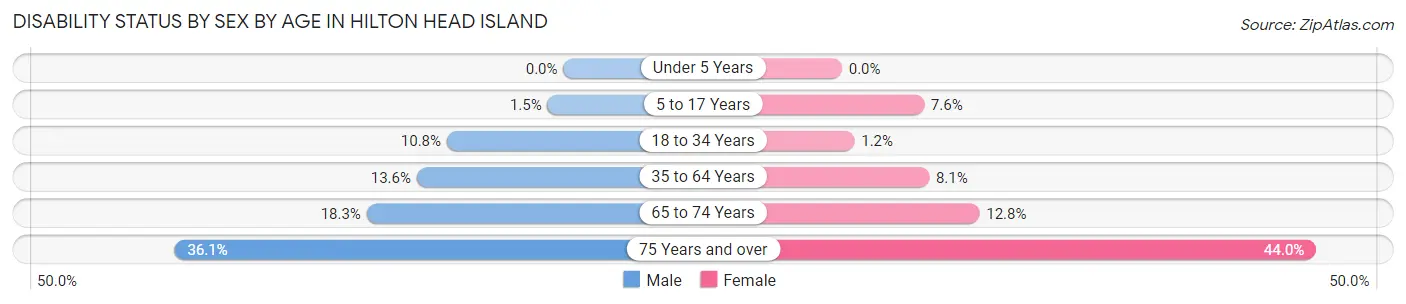
| Age Bracket | Male | Female |
| Under 5 Years | 0 (0.0%) | 0 (0.0%) |
| 5 to 17 Years | 26 (1.5%) | 125 (7.6%) |
| 18 to 34 Years | 292 (10.8%) | 25 (1.2%) |
| 35 to 64 Years | 923 (13.6%) | 558 (8.1%) |
| 65 to 74 Years | 661 (18.2%) | 519 (12.8%) |
| 75 Years and over | 1,161 (36.1%) | 1,628 (44.0%) |
Disability Class by Sex by Age in Hilton Head Island
Disability Class: Hearing Difficulty
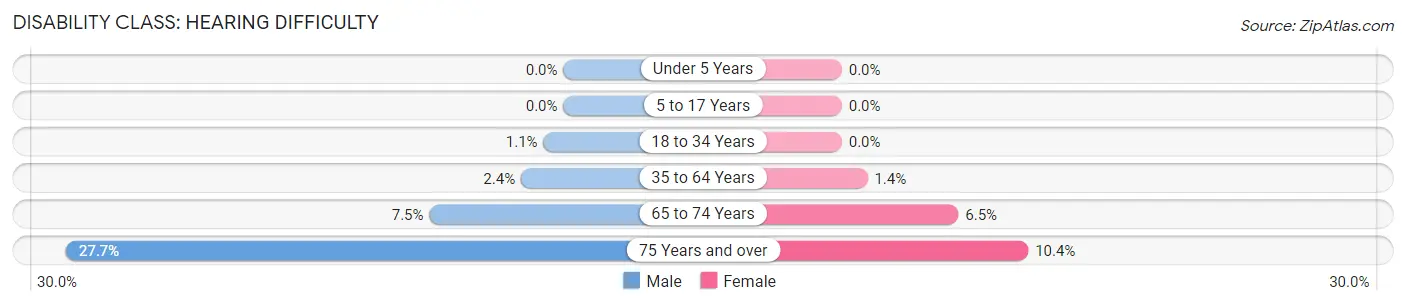
| Age Bracket | Male | Female |
| Under 5 Years | 0 (0.0%) | 0 (0.0%) |
| 5 to 17 Years | 0 (0.0%) | 0 (0.0%) |
| 18 to 34 Years | 30 (1.1%) | 0 (0.0%) |
| 35 to 64 Years | 160 (2.4%) | 99 (1.4%) |
| 65 to 74 Years | 270 (7.5%) | 264 (6.5%) |
| 75 Years and over | 891 (27.7%) | 384 (10.4%) |
Disability Class: Vision Difficulty
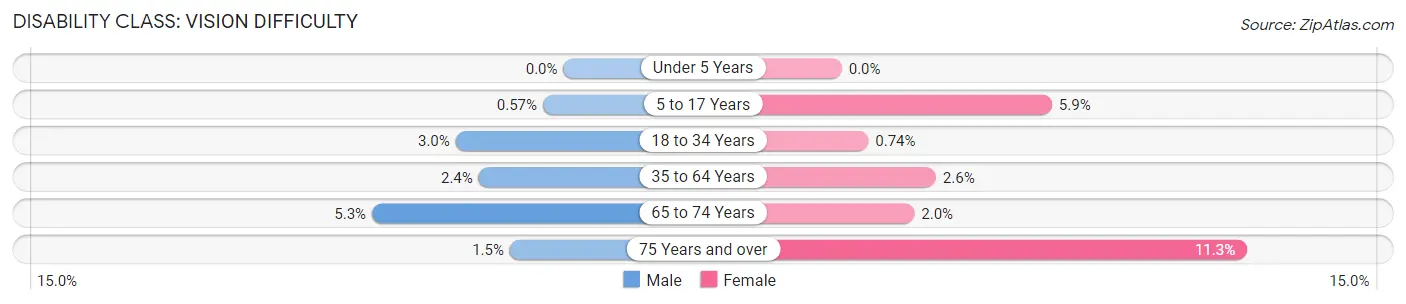
| Age Bracket | Male | Female |
| Under 5 Years | 0 (0.0%) | 0 (0.0%) |
| 5 to 17 Years | 10 (0.6%) | 96 (5.9%) |
| 18 to 34 Years | 81 (3.0%) | 16 (0.7%) |
| 35 to 64 Years | 160 (2.4%) | 181 (2.6%) |
| 65 to 74 Years | 193 (5.3%) | 82 (2.0%) |
| 75 Years and over | 48 (1.5%) | 417 (11.3%) |
Disability Class: Cognitive Difficulty
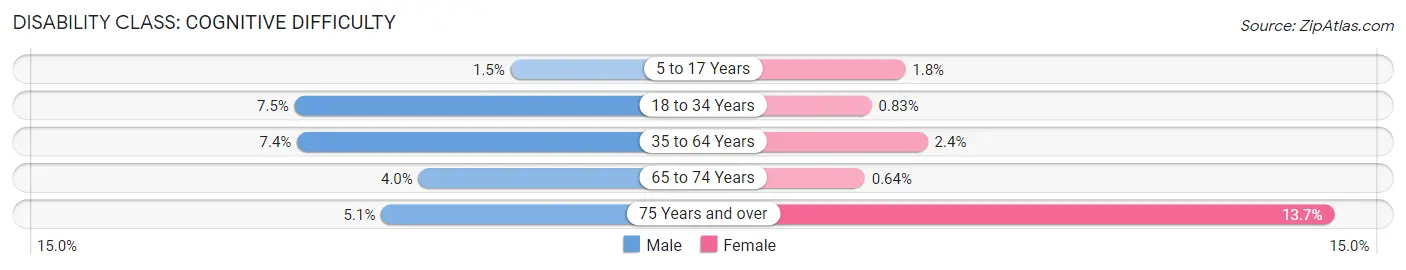
| Age Bracket | Male | Female |
| 5 to 17 Years | 26 (1.5%) | 29 (1.8%) |
| 18 to 34 Years | 202 (7.5%) | 18 (0.8%) |
| 35 to 64 Years | 503 (7.4%) | 165 (2.4%) |
| 65 to 74 Years | 146 (4.0%) | 26 (0.6%) |
| 75 Years and over | 163 (5.1%) | 507 (13.7%) |
Disability Class: Ambulatory Difficulty
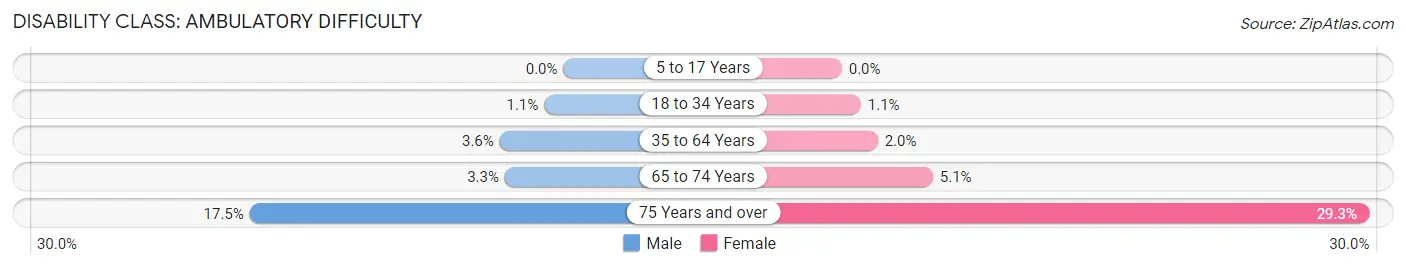
| Age Bracket | Male | Female |
| 5 to 17 Years | 0 (0.0%) | 0 (0.0%) |
| 18 to 34 Years | 29 (1.1%) | 23 (1.1%) |
| 35 to 64 Years | 241 (3.5%) | 138 (2.0%) |
| 65 to 74 Years | 118 (3.3%) | 206 (5.1%) |
| 75 Years and over | 562 (17.5%) | 1,085 (29.3%) |
Disability Class: Self-Care Difficulty
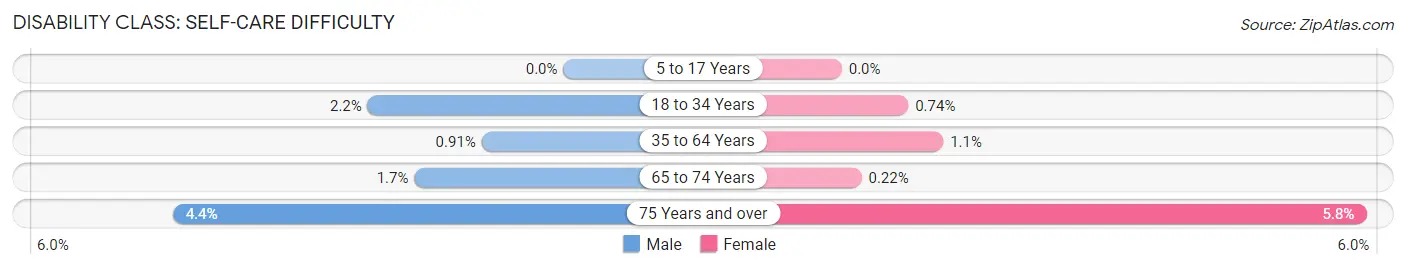
| Age Bracket | Male | Female |
| 5 to 17 Years | 0 (0.0%) | 0 (0.0%) |
| 18 to 34 Years | 59 (2.2%) | 16 (0.7%) |
| 35 to 64 Years | 62 (0.9%) | 78 (1.1%) |
| 65 to 74 Years | 60 (1.7%) | 9 (0.2%) |
| 75 Years and over | 140 (4.3%) | 216 (5.8%) |
Technology Access in Hilton Head Island
Computing Device Access in Hilton Head Island
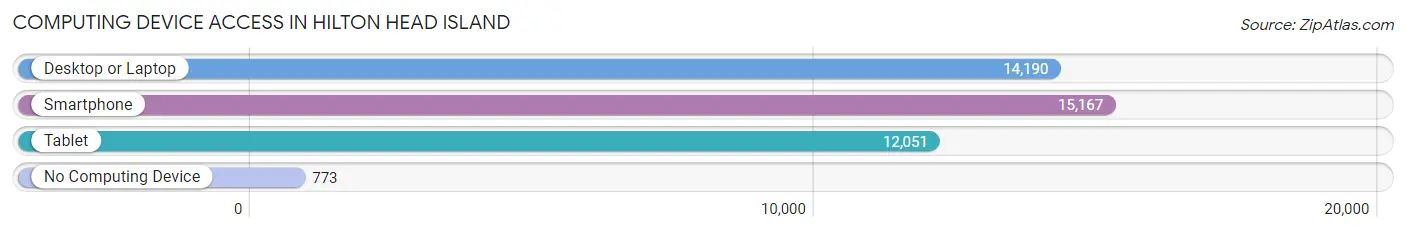
| Device Type | # Households | % Households |
| Desktop or Laptop | 14,190 | 82.9% |
| Smartphone | 15,167 | 88.6% |
| Tablet | 12,051 | 70.4% |
| No Computing Device | 773 | 4.5% |
| Total | 17,126 | 100.0% |
Internet Access in Hilton Head Island
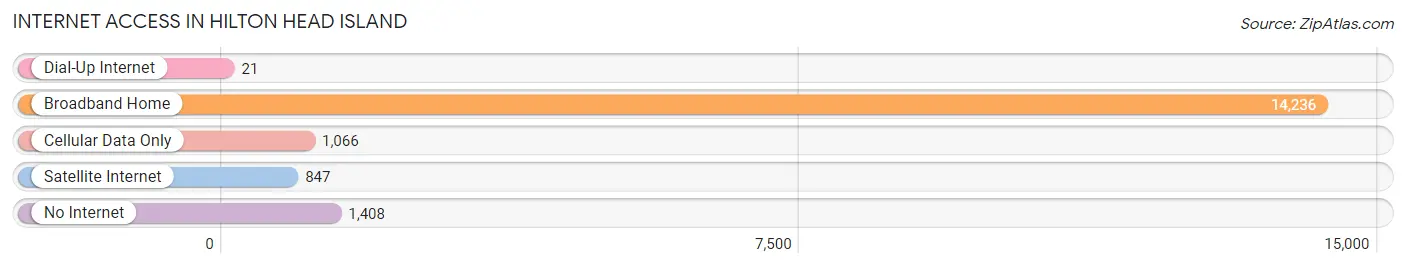
| Internet Type | # Households | % Households |
| Dial-Up Internet | 21 | 0.1% |
| Broadband Home | 14,236 | 83.1% |
| Cellular Data Only | 1,066 | 6.2% |
| Satellite Internet | 847 | 5.0% |
| No Internet | 1,408 | 8.2% |
| Total | 17,126 | 100.0% |
Hilton Head Island Summary
Hilton Head Island is a barrier island located off the coast of South Carolina in the United States. It is the largest of the Sea Islands, a chain of barrier islands that stretches along the Atlantic coast from South Carolina to Florida. The island is known for its beautiful beaches, golf courses, and resorts, and is a popular tourist destination.
Geography
Hilton Head Island is located in Beaufort County, South Carolina, and is approximately 12 miles long and 5 miles wide. It is bordered by the Atlantic Ocean to the east, the Intracoastal Waterway to the west, and the Calibogue Sound to the south. The island is connected to the mainland by two bridges, the Broad Creek Bridge and the Cross Island Parkway.
The island is composed of a variety of habitats, including maritime forests, salt marshes, and beaches. The maritime forests are composed of live oaks, magnolias, and other hardwood trees, while the salt marshes are home to a variety of wildlife, including crabs, shrimp, and fish. The beaches are composed of white sand and are popular for swimming, sunbathing, and other recreational activities.
History
Hilton Head Island was first inhabited by Native Americans, who used the island as a hunting and fishing ground. The first European settlers arrived in the 16th century, and the island was used for farming and timber harvesting. In the 19th century, the island was developed as a resort destination, and the first hotel was built in 1883.
In the 1950s, the island was developed as a planned community, and the first golf course was built in 1956. The island has since become a popular tourist destination, and is home to numerous resorts, golf courses, and other attractions.
Economy
Hilton Head Island is a popular tourist destination, and tourism is the primary driver of the island’s economy. The island is home to numerous resorts, golf courses, and other attractions, and is a popular destination for beachgoers, golfers, and other vacationers.
In addition to tourism, the island is home to a variety of businesses, including restaurants, retail stores, and other services. The island is also home to a number of manufacturing and technology companies, as well as a growing number of financial services firms.
Demographics
As of the 2010 census, the population of Hilton Head Island was 37,099. The population is composed of a variety of racial and ethnic groups, including White (77.2%), African American (14.2%), Hispanic or Latino (4.2%), and Asian (2.2%). The median household income is $63,945, and the median age is 47.
Conclusion
Hilton Head Island is a beautiful barrier island located off the coast of South Carolina. It is known for its beautiful beaches, golf courses, and resorts, and is a popular tourist destination. The island’s economy is primarily driven by tourism, and it is home to a variety of businesses, including restaurants, retail stores, and other services. The population of the island is composed of a variety of racial and ethnic groups, and the median household income is $63,945.
Common Questions
What is Per Capita Income in Hilton Head Island?
Per Capita income in Hilton Head Island is $66,506.
What is the Median Family Income in Hilton Head Island?
Median Family Income in Hilton Head Island is $120,887.
What is the Median Household income in Hilton Head Island?
Median Household Income in Hilton Head Island is $93,694.
What is Income or Wage Gap in Hilton Head Island?
Income or Wage Gap in Hilton Head Island is 28.3%.
Women in Hilton Head Island earn 71.7 cents for every dollar earned by a man.
What is Family Income Deficit in Hilton Head Island?
Family Income Deficit in Hilton Head Island is $10,284.
Families that are below poverty line in Hilton Head Island earn $10,284 less on average than the poverty threshold level.
What is Inequality or Gini Index in Hilton Head Island?
Inequality or Gini Index in Hilton Head Island is 0.50.
What is the Total Population of Hilton Head Island?
Total Population of Hilton Head Island is 37,708.
What is the Total Male Population of Hilton Head Island?
Total Male Population of Hilton Head Island is 18,839.
What is the Total Female Population of Hilton Head Island?
Total Female Population of Hilton Head Island is 18,869.
What is the Ratio of Males per 100 Females in Hilton Head Island?
There are 99.84 Males per 100 Females in Hilton Head Island.
What is the Ratio of Females per 100 Males in Hilton Head Island?
There are 100.16 Females per 100 Males in Hilton Head Island.
What is the Median Population Age in Hilton Head Island?
Median Population Age in Hilton Head Island is 59.8 Years.
What is the Average Family Size in Hilton Head Island
Average Family Size in Hilton Head Island is 2.7 People.
What is the Average Household Size in Hilton Head Island
Average Household Size in Hilton Head Island is 2.2 People.
How Large is the Labor Force in Hilton Head Island?
There are 16,367 People in the Labor Forcein in Hilton Head Island.
What is the Percentage of People in the Labor Force in Hilton Head Island?
48.1% of People are in the Labor Force in Hilton Head Island.
What is the Unemployment Rate in Hilton Head Island?
Unemployment Rate in Hilton Head Island is 2.8%.