Cities with the Highest Percentage of Population Employed in Transportation & Warehousing in the United States
RELATED REPORTS & OPTIONS
Transportation & Warehousing
United States
Compare Cities
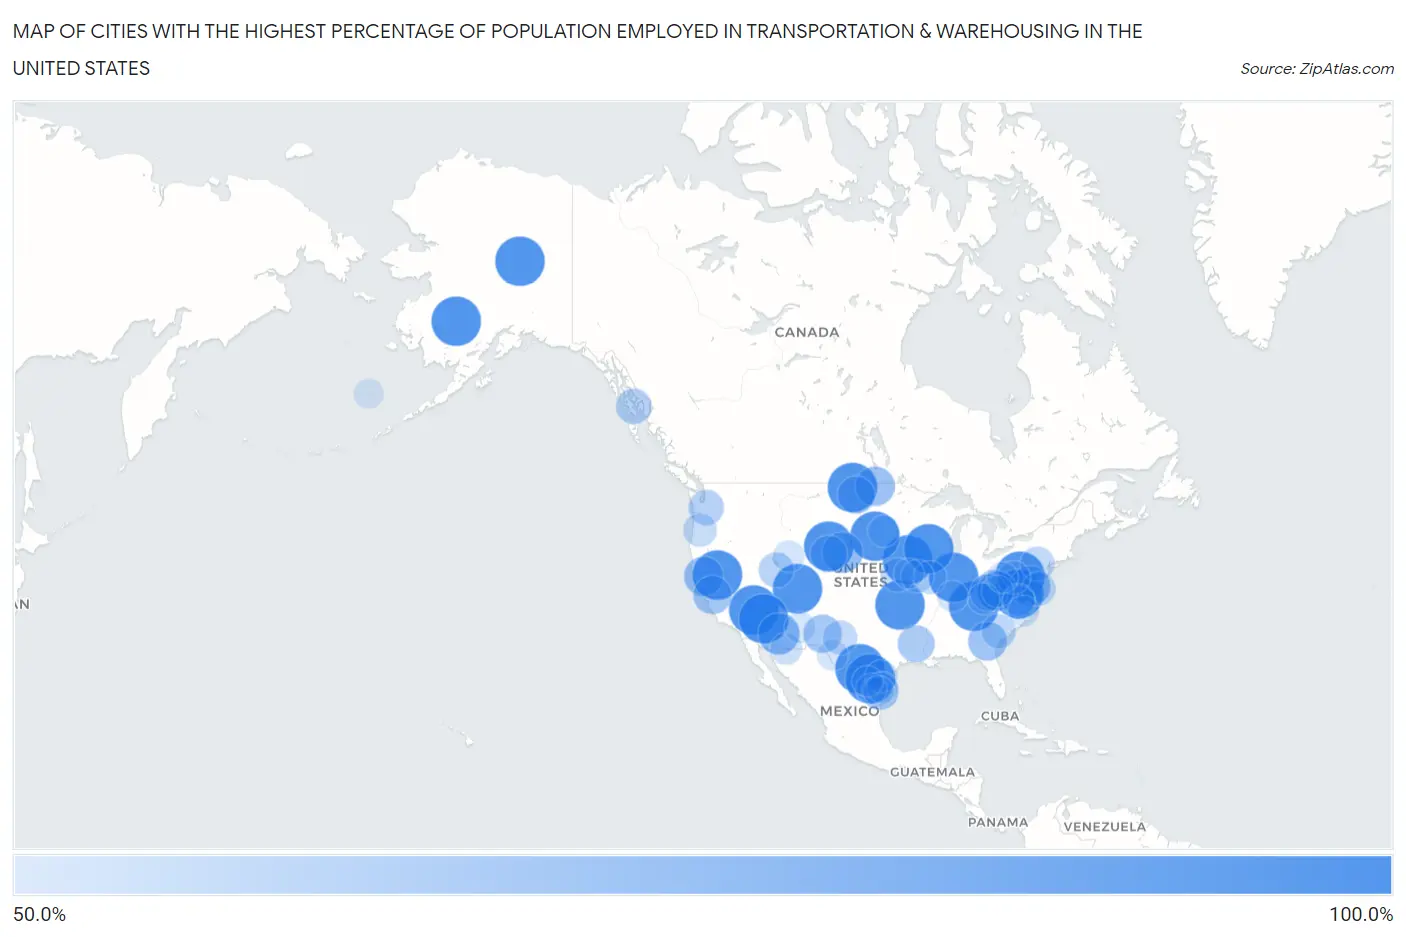
Map of Cities with the Highest Percentage of Population Employed in Transportation & Warehousing in the United States
0.0%
100.0%
Cities with the Highest Percentage of Population Employed in Transportation & Warehousing in the United States
| City | % Employed | vs State | vs National | |
| 1. | La Sal | 100.0% | 4.7%(+95.3)#1 | 4.9%(+95.1)#1 |
| 2. | Rio | 100.0% | 4.6%(+95.4)#1 | 4.9%(+95.1)#2 |
| 3. | Mabie | 100.0% | 5.1%(+94.9)#1 | 4.9%(+95.1)#3 |
| 4. | Swift Bird | 100.0% | 3.5%(+96.5)#1 | 4.9%(+95.1)#4 |
| 5. | Whiteside | 100.0% | 6.1%(+93.9)#1 | 4.9%(+95.1)#5 |
| 6. | Elgin | 100.0% | 6.1%(+93.9)#2 | 4.9%(+95.1)#6 |
| 7. | Drowning Creek | 100.0% | 4.5%(+95.5)#1 | 4.9%(+95.1)#7 |
| 8. | Stewart | 100.0% | 5.8%(+94.2)#1 | 4.9%(+95.1)#8 |
| 9. | Goodsprings | 100.0% | 6.1%(+93.9)#1 | 4.9%(+95.1)#9 |
| 10. | Pecktonville | 100.0% | 4.4%(+95.6)#1 | 4.9%(+95.1)#10 |
| 11. | Quemado | 100.0% | 5.5%(+94.5)#1 | 4.9%(+95.1)#11 |
| 12. | Bloomingville | 100.0% | 4.9%(+95.1)#1 | 4.9%(+95.1)#12 |
| 13. | Candy Kitchen | 100.0% | 3.6%(+96.4)#1 | 4.9%(+95.1)#13 |
| 14. | Rivervale | 100.0% | 5.0%(+95.0)#1 | 4.9%(+95.1)#14 |
| 15. | Yucca | 100.0% | 4.8%(+95.2)#1 | 4.9%(+95.1)#15 |
| 16. | Blackfoot | 100.0% | 4.3%(+95.7)#1 | 4.9%(+95.1)#16 |
| 17. | Dresser | 100.0% | 5.1%(+94.9)#1 | 4.9%(+95.1)#17 |
| 18. | Columbia | 100.0% | 4.0%(+96.0)#1 | 4.9%(+95.1)#18 |
| 19. | Burlington | 100.0% | 5.5%(+94.5)#2 | 4.9%(+95.1)#19 |
| 20. | Homestead | 100.0% | 4.5%(+95.5)#2 | 4.9%(+95.1)#20 |
| 21. | Jerome | 100.0% | 5.1%(+94.9)#2 | 4.9%(+95.1)#21 |
| 22. | Franklin Cdp Sacramento County | 100.0% | 5.1%(+94.9)#2 | 4.9%(+95.1)#22 |
| 23. | Whitlock | 100.0% | 6.1%(+93.9)#3 | 4.9%(+95.1)#23 |
| 24. | Bevington | 100.0% | 4.3%(+95.7)#1 | 4.9%(+95.1)#24 |
| 25. | Cloverleaf Colony | 100.0% | 3.5%(+96.5)#2 | 4.9%(+95.1)#25 |
| 26. | Livengood | 100.0% | 7.7%(+92.3)#1 | 4.9%(+95.1)#26 |
| 27. | Carlton | 100.0% | 5.5%(+94.5)#3 | 4.9%(+95.1)#27 |
| 28. | Goodenow | 100.0% | 6.2%(+93.8)#1 | 4.9%(+95.1)#28 |
| 29. | Hillside Acres | 100.0% | 5.5%(+94.5)#4 | 4.9%(+95.1)#29 |
| 30. | Red Devil | 100.0% | 7.7%(+92.3)#2 | 4.9%(+95.1)#30 |
| 31. | Storla | 100.0% | 3.5%(+96.5)#3 | 4.9%(+95.1)#31 |
| 32. | Lost Springs | 100.0% | 4.4%(+95.6)#1 | 4.9%(+95.1)#34 |
| 33. | Grano | 100.0% | 4.1%(+95.9)#1 | 4.9%(+95.1)#35 |
| 34. | Bankston | 100.0% | 4.3%(+95.7)#2 | 4.9%(+95.1)#36 |
| 35. | Sacate Village | 80.0% | 4.8%(+75.2)#2 | 4.9%(+75.1)#37 |
| 36. | Berea | 78.3% | 4.9%(+73.4)#1 | 4.9%(+73.3)#38 |
| 37. | Eagle Harbor | 78.1% | 4.4%(+73.7)#2 | 4.9%(+73.2)#39 |
| 38. | Comfort | 77.5% | 4.5%(+73.0)#1 | 4.9%(+72.6)#40 |
| 39. | Dixie Union | 76.9% | 6.3%(+70.6)#1 | 4.9%(+72.0)#41 |
| 40. | Page | 76.6% | 4.5%(+72.1)#2 | 4.9%(+71.6)#42 |
| 41. | Elk Creek | 75.0% | 5.1%(+69.9)#3 | 4.9%(+70.1)#43 |
| 42. | Loma | 75.0% | 4.1%(+70.9)#2 | 4.9%(+70.1)#44 |
| 43. | Vanceboro | 74.6% | 3.4%(+71.2)#1 | 4.9%(+69.7)#45 |
| 44. | Glenwood | 73.8% | 6.3%(+67.5)#2 | 4.9%(+68.9)#46 |
| 45. | Westley | 72.8% | 5.1%(+67.7)#4 | 4.9%(+67.9)#47 |
| 46. | Bent | 72.0% | 3.6%(+68.5)#2 | 4.9%(+67.1)#48 |
| 47. | Medill | 71.7% | 5.0%(+66.7)#1 | 4.9%(+66.7)#49 |
| 48. | Benedict | 70.2% | 4.1%(+66.1)#3 | 4.9%(+65.3)#50 |
| 49. | Rangerville | 69.8% | 5.5%(+64.3)#5 | 4.9%(+64.9)#51 |
| 50. | Crum | 69.6% | 4.5%(+65.1)#3 | 4.9%(+64.6)#52 |
| 51. | Joyce | 69.4% | 4.6%(+64.8)#2 | 4.9%(+64.5)#53 |
| 52. | Norton | 69.3% | 4.5%(+64.9)#4 | 4.9%(+64.4)#54 |
| 53. | Y O Ranch | 69.0% | 4.4%(+64.6)#2 | 4.9%(+64.1)#55 |
| 54. | Bull Lake | 67.9% | 4.3%(+63.6)#2 | 4.9%(+63.0)#56 |
| 55. | Rains | 67.1% | 4.3%(+62.8)#1 | 4.9%(+62.1)#57 |
| 56. | Kasaan | 65.9% | 7.7%(+58.2)#3 | 4.9%(+61.0)#58 |
| 57. | Mineral | 65.5% | 4.9%(+60.5)#1 | 4.9%(+60.5)#59 |
| 58. | Ophir | 64.9% | 4.7%(+60.2)#2 | 4.9%(+59.9)#60 |
| 59. | Lamb | 64.0% | 5.1%(+58.9)#3 | 4.9%(+59.1)#61 |
| 60. | Cope | 63.6% | 4.3%(+59.4)#2 | 4.9%(+58.7)#62 |
| 61. | Piñas | 63.2% | 2.9%(+60.2)#1 | 4.9%(+58.2)#63 |
| 62. | Monument | 62.9% | 3.6%(+59.3)#3 | 4.9%(+58.0)#64 |
| 63. | Holiday Pocono | 62.7% | 5.0%(+57.7)#1 | 4.9%(+57.8)#65 |
| 64. | Powellville | 62.2% | 4.4%(+57.7)#3 | 4.9%(+57.2)#66 |
| 65. | Williamstown | 62.1% | 5.0%(+57.1)#2 | 4.9%(+57.1)#67 |
| 66. | Brazos | 61.9% | 5.5%(+56.4)#6 | 4.9%(+57.0)#68 |
| 67. | Depauw | 61.5% | 5.1%(+56.4)#4 | 4.9%(+56.6)#69 |
| 68. | Leona | 61.5% | 4.3%(+57.2)#1 | 4.9%(+56.6)#70 |
| 69. | Shedd | 61.0% | 3.8%(+57.2)#1 | 4.9%(+56.0)#71 |
| 70. | Baskerville | 60.0% | 4.0%(+56.0)#2 | 4.9%(+55.1)#72 |
| 71. | Time | 60.0% | 6.2%(+53.8)#2 | 4.9%(+55.1)#73 |
| 72. | Danville | 59.7% | 4.4%(+55.3)#4 | 4.9%(+54.8)#74 |
| 73. | Burton | 59.2% | 6.2%(+53.0)#3 | 4.9%(+54.2)#75 |
| 74. | Excello | 59.1% | 5.0%(+54.1)#3 | 4.9%(+54.1)#76 |
| 75. | Yadkin College | 58.2% | 4.3%(+53.8)#1 | 4.9%(+53.2)#77 |
| 76. | Lamington | 58.1% | 5.8%(+52.4)#1 | 4.9%(+53.2)#78 |
| 77. | Los Ebanos Cdp Starr County | 58.0% | 5.5%(+52.5)#7 | 4.9%(+53.0)#79 |
| 78. | La Paloma Addition | 58.0% | 5.5%(+52.5)#8 | 4.9%(+53.0)#80 |
| 79. | Beyerville | 57.7% | 4.8%(+52.9)#3 | 4.9%(+52.7)#81 |
| 80. | Lunenburg | 57.6% | 4.0%(+53.6)#3 | 4.9%(+52.6)#82 |
| 81. | Kincaid | 56.5% | 4.5%(+52.1)#5 | 4.9%(+51.6)#83 |
| 82. | Mcallister | 56.5% | 4.3%(+52.3)#3 | 4.9%(+51.6)#84 |
| 83. | Oakley | 56.5% | 4.4%(+52.0)#3 | 4.9%(+51.5)#85 |
| 84. | Hetland | 56.2% | 3.5%(+52.8)#4 | 4.9%(+51.3)#86 |
| 85. | Jeff | 56.0% | 5.7%(+50.3)#1 | 4.9%(+51.1)#87 |
| 86. | Valentine | 55.6% | 5.5%(+50.1)#9 | 4.9%(+50.6)#88 |
| 87. | Port Mansfield | 55.6% | 5.5%(+50.1)#10 | 4.9%(+50.6)#89 |
| 88. | Luna | 55.6% | 3.6%(+52.0)#4 | 4.9%(+50.6)#90 |
| 89. | Falkland | 55.5% | 4.3%(+51.1)#2 | 4.9%(+50.5)#91 |
| 90. | Groveland | 55.2% | 5.1%(+50.0)#5 | 4.9%(+50.2)#92 |
| 91. | Manitou | 55.0% | 5.7%(+49.2)#2 | 4.9%(+50.0)#93 |
| 92. | Bivins | 54.5% | 5.5%(+49.0)#11 | 4.9%(+49.6)#94 |
| 93. | Smithfield | 54.5% | 4.5%(+50.1)#6 | 4.9%(+49.6)#95 |
| 94. | Dora | 54.3% | 5.0%(+49.2)#2 | 4.9%(+49.3)#96 |
| 95. | J F Villareal | 54.3% | 5.5%(+48.8)#12 | 4.9%(+49.3)#97 |
| 96. | Dorseyville | 54.1% | 4.6%(+49.5)#3 | 4.9%(+49.2)#98 |
| 97. | La Presa | 54.0% | 5.5%(+48.5)#13 | 4.9%(+49.1)#99 |
| 98. | Villa Verde | 53.8% | 5.5%(+48.3)#14 | 4.9%(+48.9)#100 |
| 99. | St George | 53.6% | 7.7%(+45.9)#4 | 4.9%(+48.6)#101 |
| 100. | Lock Springs | 53.3% | 5.0%(+48.4)#4 | 4.9%(+48.4)#102 |
Common Questions
What are the Top 10 Cities with the Highest Percentage of Population Employed in Transportation & Warehousing in the United States?
Top 10 Cities with the Highest Percentage of Population Employed in Transportation & Warehousing in the United States are:
What city has the Highest Percentage of Population Employed in Transportation & Warehousing in the United States?
La Sal has the Highest Percentage of Population Employed in Transportation & Warehousing in the United States with 100.0%.
What is the Percentage of Population Employed in Transportation & Warehousing in the United States?
Percentage of Population Employed in Transportation & Warehousing in the United States is 4.9%.